



Abstract
Historical documents provide a general chronological overview of the environmental evolution of the Yangtze River delta (YRD) during the last ca. 2000 years; however, absolute dating of the region’s late Holocene sediment is relatively rare. Optically stimulated luminescence (OSL) dating has been increasingly applied to the age determination of Holocene deposits in deltaic environments. In this study, three 23–27 m long drill cores running from south to north were collected from the Qihai plain of the northern YRD in order to reconstruct the history of this region’s formation since the late Holocene. A total of 24 samples from the three cores were subjected to OSL dating using coarse silt-sized (45–63 μm) quartz. The OSL ages range from approximately 190–3490 a revealing that the age of the delta front and delta plain facies in the coring sites are younger than 500 a while the sediments in the underlying prodelta facies are older than 2000 a. On the basis of the large age gap between the two set of deposits, we suspect that the coring sites remained submerged from 2000 to 500 years ago. As the central core has older and coarser sandy deposits than the neighbouring cores, we infer that the central core was located on a sandy mouth bar, while other cores sat within distributary channels within the estuary. The OSL ages are consistent with both the chronology implied by historical documents and other stratigraphic records in the area. This study enhances the chronological framework of land formation and delta evolution in the Qihai plain area of the YRD and thereby consolidates the conclusions derived from the application of a single technique alone.
Keywords
Introduction
The Yangtze River (Changjiang) is the third longest river in the world (~6300 km in length), whose delta comprises both one of the cradles of Neolithic civilisation (Chen et al., 2005; Itzstein-Davey et al., 2007; Yan and Xu, 1987; Yu et al., 2000) and the present economic centre of China. Consequently, the evolution of the Yangtze River delta (YRD) and its response to climate change and human activities during the Holocene have received considerable attention (e.g. Chen et al., 1979; Delta Research Group, Department of Marine Geology, Tongji University, 1978; Hori et al., 2001, 2002; Liu et al., 2010; Song et al., 2013; Wang et al., 2013; Wang Z et al., 2018; Yan and Xu, 1987; Ye, 1986, 2018). These studies provide a general framework for the delta’s evolution and coastline shifts since the early Holocene. The modern YRD has formed from palaeo-incised valley over the last ca. 8000 years as the sea level has approached the present and its rate of rise has decelerated (e.g. Song et al., 2013; Stanley and Warne, 1994). As a river delta strongly influenced by tide, it evolved from a funnel shaped bay into delta through the infilling of the bay, the emergence of sandy river mouth bars and the abandonment of distributaries (Delta Research Group, Department of Marine Geology, Tongji University, 1978; Goodbred and Saito, 2012; Yan and Xu, 1987). In general, the width of the bay has been shortened, and the distributaries on the northern side of the mouth bars preferentially silted over the last 2000 years (Chen et al., 1979). Stratigraphic study of the delta facies typically shows a structure of a prograding tidal-dominated delta, which comprised fine-grained prodelta facies, upwards coarsening delta front facies and fining delta plain facies in ascending order (Hori et al., 2001; Yan and Xu, 1987).
A proper understanding of the mechanisms of the delta’s formation due to climate change and human activities relies on an adequate chronology of its stratigraphy. The last 2000 years is an important period as human activities have intensified in the catchment and led to accelerate soil erosion (Chen et al., 1979). Although there have been a number of detailed dating studies on cores in the YRD since the 2000s, the chronologies of these cores are mainly based on 14C dating (e.g. Hori et al., 2001; Li et al., 2014; Long et al., 2014; Wang et al., 2011, 2013; Yi et al., 2003; Zhang and Lin, 2017). However, so-called old carbon, caused by the reworking of sediment, and radiocarbon reservoir effects in the coastal environment lead to the reliability of 14C ages being questioned; furthermore, the paucity of carbon material in delta front sandy deposits can preclude 14C dating entirely (Stanley and Chen, 2000). Over the last 2000 years, for which historical archives are available in China, description of the morphological changes in the delta region provides some independent evidence of coastline shifts and land changes over a centennial scale. However, such historical documents normally provide information only on the emergence of land or coastal retreat, while the aggradation or erosion history of the subsurface stratigraphy remains undocumented. It is difficult to determine the driving forces of coastline change without a three-dimensional stratigraphical view. Therefore, a combination of historical archives with securely dated deltaic deposits can provide a better understanding of the processes of delta evolution.
In recent years, with the development of optically stimulated luminescence (OSL) dating (Huntley et al., 1985; Murray & Wintle, 2000, 2003), this technique has been applied to Holocene sediments in a number of delta regions including the Mississippi (e.g. Chamberlain et al., 2018a; Shen et al., 2015; Shen and Mauz, 2012), the Ganges–Brahmaputra–Meghna (e.g. Chamberlain et al., 2017), the Rhine Meuse (e.g. Wallinga et al., 2010) and the Mekong delta (e.g. Sanderson et al., 2007; Tamura et al., 2012). In the meantime, a number of OSL dating-based studies have been reported in the YRD (e.g. Gao et al., 2016, 2017, 2019; Nian et al., 2018a, 2018b, 2019; Nian and Zhang, 2018; Sugisaki et al., 2015; Wang et al., 2015; Wang F et al., 2018). It has been found that the OSL signal of YRD quartz was well bleached, especially in the medium-grained quartz (MG, 45–63 μm) (Nian et al., 2018a, 2018b). These studies have confirmed OSL dating as a robust technique that can reliably be used to determine the age of Holocene deposits in the YRD.
The Qihai plain is part of the youngest area of land formed on the northern part of the YRD (Figure 1a). According to historical documents, the Qihai plain has shown a progradation–retrogradation–progradation pattern over the last 1000 years, with the most recent emergence around 286 a (AD 1730, all the ages in this study are presented in years (a) before AD 2016 for comparison) (Chen and Chen, 2010; Tan, 1987; Zhou, 1999). In this study, we collected three cores (BX, MQ and WB) from the Qihai plain along a south–north transect. On the basis of the OSL ages of 24 samples (Figure 2 and Table 1) and a comparison with reported coastline change inferred from historical archives (Tan, 1987; Zhou, 1999), we aim to reconstruct the temporal and spatial variations of accumulation rate since late Holocene, and to understand the controlling factors, such as the migration of delta deposition centre (Hori et al., 2001), sediment source changes and the depositional pattern of distributary and mouth bar units in the delta system.
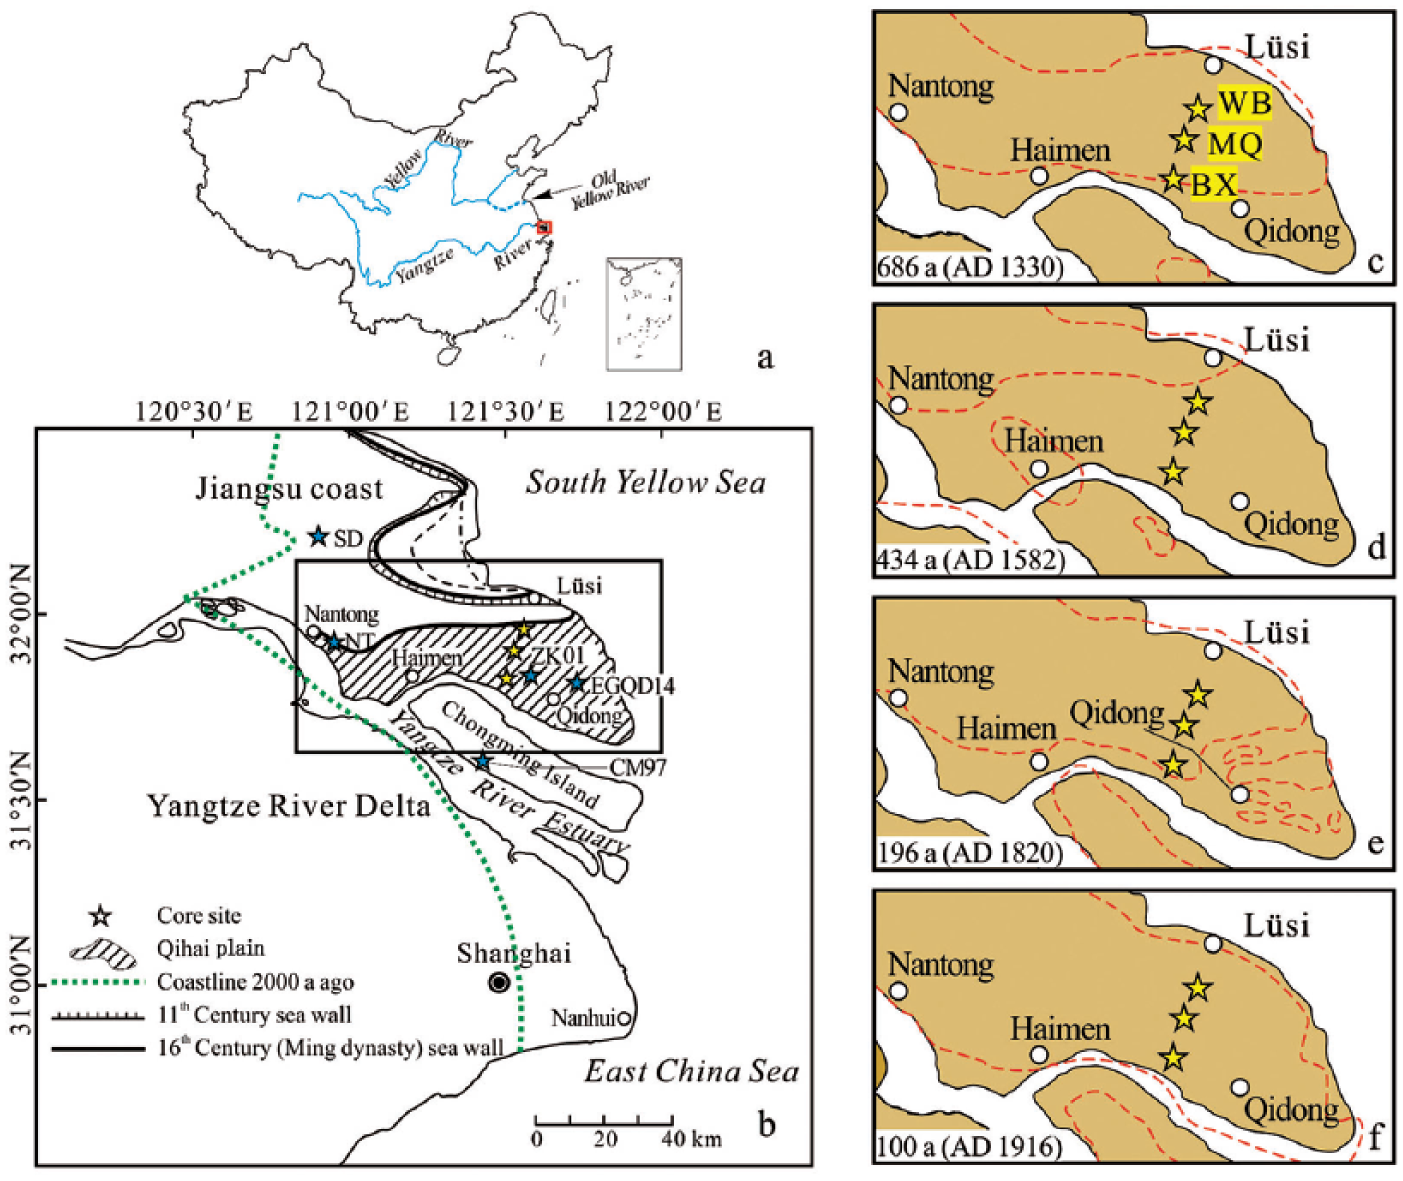
(a) The regional location of the Yangtze River Delta (b) showing the details of the study area in the northern part of the Yangtze River Delta, China. The rectangle in (b) is enlarged in (c) to (f), with the palaeoshoreline estimated by historical records (Chen and Chen, 2010; Tan, 1987; Zhou, 1999) shown in dashed lines (red). The location of cores BX, MQ and WB (yellow stars) is shown with cited cores CM97 (Hori et al., 2001, 2002), ZK01 (Zhang and Lin, 2017), NT (Nian et al., 2018a), SD (Nian et al., 2018b) and EGQD14 (Gao et al., 2019) from previous studies (blue stars). Please visit the journal website to view this figure in color.

Lithological description of cores BX, MQ and WB, and their stratigraphic correlation with neighbouring cores EGQD14 (Gao et al., 2018), CM97 (Hori et al., 2001), and ZK01 (Zhang and Lin, 2017). The age in red has been excluded. The red closed circles represent the quartz OSL ages and blue closed circles represent 14C ages. The shell patterns represent the shell layers. Gray, pink, and yellow colors represent clay, silt, and sand, respectively. Please visit the journal website to view this figure in color.
U, Th, K concentration, De and OSL ages of samples collected from cores BX, MQ and WB.

CAM: central age model; MAM: minimum age model.
The ages in bold are those used in this study.
Study area
On the basis of historical documentary evidence from the region (Tan, 1987; Zhou, 1999), it is known that the Qihai plain has been subjected to a series of phases of deposition and erosion over the last 1000 years. From early 14th century, the coast of the Qihai plain advanced to the central part of the present plain (Figure 1c). However, affected by sea level rise and a shift of the Yangtze River’s main channel to the northern branch, the coastline retreated during 675–344 a (AD 1341–1672) with the coastline extending from Nantong to Lüsi (Figure 1d) (Ling, 2001). In the middle 18th century, the main channel moved to the southern branch (Zhang and Meng, 2009), land loss gradually ceased and the coastline started to prograde again southward (Figure 1e and f) (Chen and Chen, 2010; Tan, 1987; Zhou, 1999). It should be noted that the Yellow River discharged into the southern Yellow Sea from 888 to 161 a (AD 1128–1855), with the later period (522–161 a, AD 1494–1855) delivering abundant sediment to the South Yellow Sea and Jiangsu coast (Liu et al., 2010; Zhang, 1984). Whether this event is linked to the progradation of Qihai plain through longshore current delivery is still unclear.
Three cores (BX, MQ and WB), ranging from 23 to 27 m in length, were collected from the study area (Figure 1b). Lithologically, the three cores show a fine-coarse-fine trend from the bottom towards the surface enabling three units to be defined (Figures 2 and 3). Unit A comprises the bottom part of each core. The sediments are dark grey in colour and mainly consist of clayey silt with interbedded coarse-silt layers and thin shell beds. Unit B comprises the middle part and coarsest layer of the cores. The sediments consist of silts and fine sands, and are interbedded with thin clay layers. The sediment colour changes from dark grey to grey at a depth of ~13 m. Unit C is the uppermost part of the cores and shows a fining trend upwards. The sediment is dominated by silty-clay and clayey silt, and is characterised by sand-mud couplets. The top ~2 or 3 m of the cores comprises yellowish clayey silts with redoximorphic features. On the basis of stratigraphic correlation with neighbouring cores (EGQD14, CM97 and ZK01) (Figure 2), Unit A comprises shallow sea/prodelta facies, while Units B and C are delta front and delta plain facies, respectively (Gao et al., 2019; Goodbred and Saito, 2012; Hori et al., 2001; Zhang and Lin, 2017).

Down-core variations in the particle size composition of cores BX, MQ and WB; A: prodelta; B: delta front; C: delta plain.
Method
Particle size
The cores were sectioned at 15-cm intervals throughout each profile and dried at 40°C for particle size measurement. The top part of each core, that is, 0.4 m in cores BX and WB and 0.8 m in MQ core, comprises disturbed material and was therefore not included in our analysis. Particle size distribution was measured using a laser particle size analyser (Beckman Coulter LS13-320) after pretreatment with 5% H2O2 and 0.2 M HCl to dissolve organic matter and biogenic carbonate, respectively. Sodium hexametaphosphate (0.5 M (NaPO3)6) was added to encourage complete sediment particle size disaggregate following ultra-sonication (Lu, 2000).
OSL dating
Particle size analysis of the three cores indicates their dominance by silt and fine sand. Previous studies have found that in the YRD area, coarse silt-sized (45–63 μm) quartz is normally better bleached than fine sand-sized quartz (Nian et al., 2018a, 2018b; Nian and Zhang, 2018); consequently, MG quartz was extracted for OSL dating.
All three cores were split under subdued red light conditions. Eight OSL samples were collected from each core resulting in a total of 24 samples. Samples preparation and OSL measurements were also performed under subdued red light conditions. The samples were treated with H2O2 (30%) and HCl (10%) to remove organic material and carbonates, respectively. The MG fraction (45–63 μm) was separated using wet sieving and then treated with silica-saturated H2SiF6 (30%) for at least 3 days (Wang et al., 2006), followed by rinsing in 10% HCl for 1 h and finally washing several times with distilled water. The purity of the quartz separated was checked via the OSL IR depletion ratio (within 10% of unity) (Duller, 2003) and the 110°C TL peak (Li et al., 2002).
Luminescence measurements were performed on an automated Risø TL/OSL DA-20 DASH reader with 7.5 mm Hoya U-340 filters in front of an ET EMD-9107 photomultiplier tube. A calibrated 90Sr/90Y beta source was used for laboratory irradiation. Quartz grains aliquots were stimulated with a 470 nm LED light set at 90% of 97 mW cm-2 full power. Quartz grains were mounted on 9.7 mm diameter aluminium discs using Silkospray silicone oil for multiple-grain aliquot measurements. A mould with 3 mm diameter holes and a small soft brush were used to ensure the same area of silicone oil. A single-aliquot regenerative-dose (SAR) protocol (Murray and Wintle, 2000) was applied to determine the equivalent dose (De) of quartz samples. The initial 0.4 s of the signals, minus a background estimated from the average signal between 0.4 and 1.4 s (early background) (Ballarini et al., 2007; Cunningham and Wallinga, 2010), was used for De estimation using a single saturating exponential function ensuring that the signal is dominated by the fast component. Meanwhile, we also calculated the late background results (first 0.4 s of stimulation minus a background derived from the last 10 s of stimulation) to compare with the early background results. Water content was calculated as the ratio of the water weight to the dried sediment weight, allowing an uncertainty of 5% for each sample. The concentrations of uranium (U), thorium (Th) and potassium (K) were measured using neutron activation analysis (NAA) (Table 1). Dose rates and OSL ages were carried out by DRAC-Calculator 1.2 (Durcan et al., 2015). The elemental concentrations were converted into dose rates using the conversion factors of Adamiec and Aitken (1998). An alpha efficiency factor (α-value) of 0.04 ± 0.02 (Rees-Jones, 1995) was used for MG quartz. Attenuation factors from Brennan et al. (1991) and Guerin et al. (2012) were utilised to calculate alpha and beta dose rates, respectively.
Results
Particle size distribution
The particle size distribution of cores BX, MQ and WB is shown in Figure 3. The bottom part (Unit A) in cores BX and WB displays a minor fine-coarse-fine trend, while the particle size of core MQ becomes coarser with decreasing depth. The mean particle size of Unit A in core MQ is the coarsest of the three cores, with an average value of 70 μm, while the mean of Unit A in cores BX and WB are 50 and 58 μm, respectively. Unit B is the coarsest layer in each core, with most of the sediments containing more than 50% sand fraction. The average values of the mean particle size are 77 μm in core BX, 96 μm in core MQ and 61 μm in core WB. The particle size of Unit B in MQ core is coarsest in these three cores. In Unit C, sediments become finer with decreasing depth and the average values of the mean size decreases from south to north, that is, core BX (52 μm) > core MQ (35 μm) > core WB (29 μm).
OSL dating results
Routine checks on the SAR protocol
In order to obtain suitable measurement conditions for the SAR protocol, routine tests are conducted including preheat plateau and dose recovery tests (Murray and Wintle, 2003). The preheat plateau and dose recovery tests were carried out on samples BX-3, MQ-5 and WB-5 using varying preheat temperatures from 160°C to 300°C for 10 s in 20°C intervals (at least three aliquots per temperature), followed by a fixed cut-heat to 160°C. The artificial bleaching for dose recovery tests is stimulated twice by blue light LED for 100 s with a pause for at least 10,000 s. As shown in Figure S1, available online, preheat plateaus are evident between 160°C and 220°C for sample BX-3 from core BX (Figure S1a, available online), between 160°C and 240°C for sample MQ-5 from core MQ (Figure S1e, available online) and sample WB-5 from core WB (Figure S1i, available online). The dose recovery ratio is close to unity at preheat of 160°C–220°C for sample BX-3 (Figure S1c, available online), 160°C–240°C for sample MQ-5 (Figure S1g, available online) and 180°C–220°C for sample WB-5 (Figure S1k, available online). Based on the above results, a preheat temperature of 200°C for cores BX and WB and 220°C for core MQ with a fixed cut-heat of 160°C were selected for the SAR protocol. In these experimental conditions, the corresponding recuperation values are lower than 5% and recycling ratios range from 0.9 to 1.1 (Figure S1b, f and j, available online). In order to further prove the reliability of the selected preheat temperatures, dose recovery test was conducted on all the samples of these three cores. The dose recovery ratios (recovered/given dose) were between 0.9 and 1.1 (Figure S1d, h and l, available online). The above results indicate that the SAR protocol can be applied to the samples.
OSL ages
The representative decay curves and dose-response curves of MG quartz from samples BX-3, MQ-5 and WB-5 are shown in Figure 4. The De values of all the samples are calculated using the central age model (CAM) and minimum age model (MAM) (Galbraith et al., 1999) with the R package ‘Luminescence’ (Mercier and Kreutzer, 2017). A sigma-b value of 0.1 was used for MAM De calculations based on our previous study in the area (Nian et al., 2018a, 2018b). The identical results calculated by early background (Table 1) and late background (Table S1, available online), in combination with the natural OSL decay curves (Figure 4a–c), indicate that the signals of quartz samples are dominated by the fast component, which is consistent with our previous studies in the area (Nian et al., 2019). The ages obtained with an early background subtraction were chosen in this study. The De distributions for all 24 samples presented in combined radial and kernel density estimate plots are shown in Figures 5 and S2, S3 and S4, available online, which were generated by the R package ‘Luminescence’ of the abanico plot (Kreutzer et al., 2012). Two groups of ages reproduced by the CAM and MAM models are generally consistent within the experimental errors (Table 1 and Figure 6), indicating that most of the 45–63 μm quartz samples were well bleached in the area (Chamberlain et al., 2018b; Chamberlain and Wallinga, 2018; Nian et al., 2018a, 2018b). At least to some extent, some samples showed that the CAM De values are higher than the MAM De values, especially for relative young samples (<500 years) (Figure 6). In a previous study (Wang F et al., 2018), we investigated the age of core A6-6 (mean grain size 20 μm) from the subaqueous delta using 4–11 μm quartz, and found that OSL ages (<200 years) were ca. 60 years older than the expected age, through comparisons with 210Pb, 137Cs, 239+240Pu and microplastics dating, and probably caused by incomplete bleaching. However, two different grain-size fractions (45–63 μm in this study, 4–11 μm in the previous study) were used in these two studies and the deposits belonged to different time periods, so the results of core A6-6 cannot be used as a criterion for assessing the degree of bleaching in this study. Small-aliquots (3 mm in diameter) yield ca. 2000 grains on a single disc, estimated by the function calc AliquotSize() (Burow, 2017) implemented in the R package ‘Luminescence’. According to single grain luminescence measurements in the area (Nian et al., 2018b), OSL intensities of quartz grains are extremely low, only ca. 0.6% of the grains on average can be used to determine the De values in the end. There are ca. 12 ‘valid’ grains which passed the rejection criteria, calculated using the average value of 0.6%. So the small aliquot in the grain-size fractions (45–63 μm) also can reflect the degree of bleaching of the samples in the area. Our results showed that the CAM De values of some samples are systematically higher than the MAM De values (Table 1 and Figure 6); there is variance in overdispersion of the De values ranging from ca. 6% to 30% for the samples, which suggests that some samples may in fact suffer incomplete bleaching and be consistent with our previous study in the area (Nian et al., 2018a, 2018b; Nian and Zhang, 2018). Considering that MAM model yields robust De values of partially bleached sediments and consistent De values obtained using the CAM model of well-bleached samples, MAM De values are adopted in the following discussion. The ages of the samples ranged between 190 ± 10 and 2770 ± 140 a for core BX, 220 ± 20 and 3360 ± 200 a for core MQ and 310 ± 30 and 3490 ± 230 a for core WB (Table 1 and Figure 7).
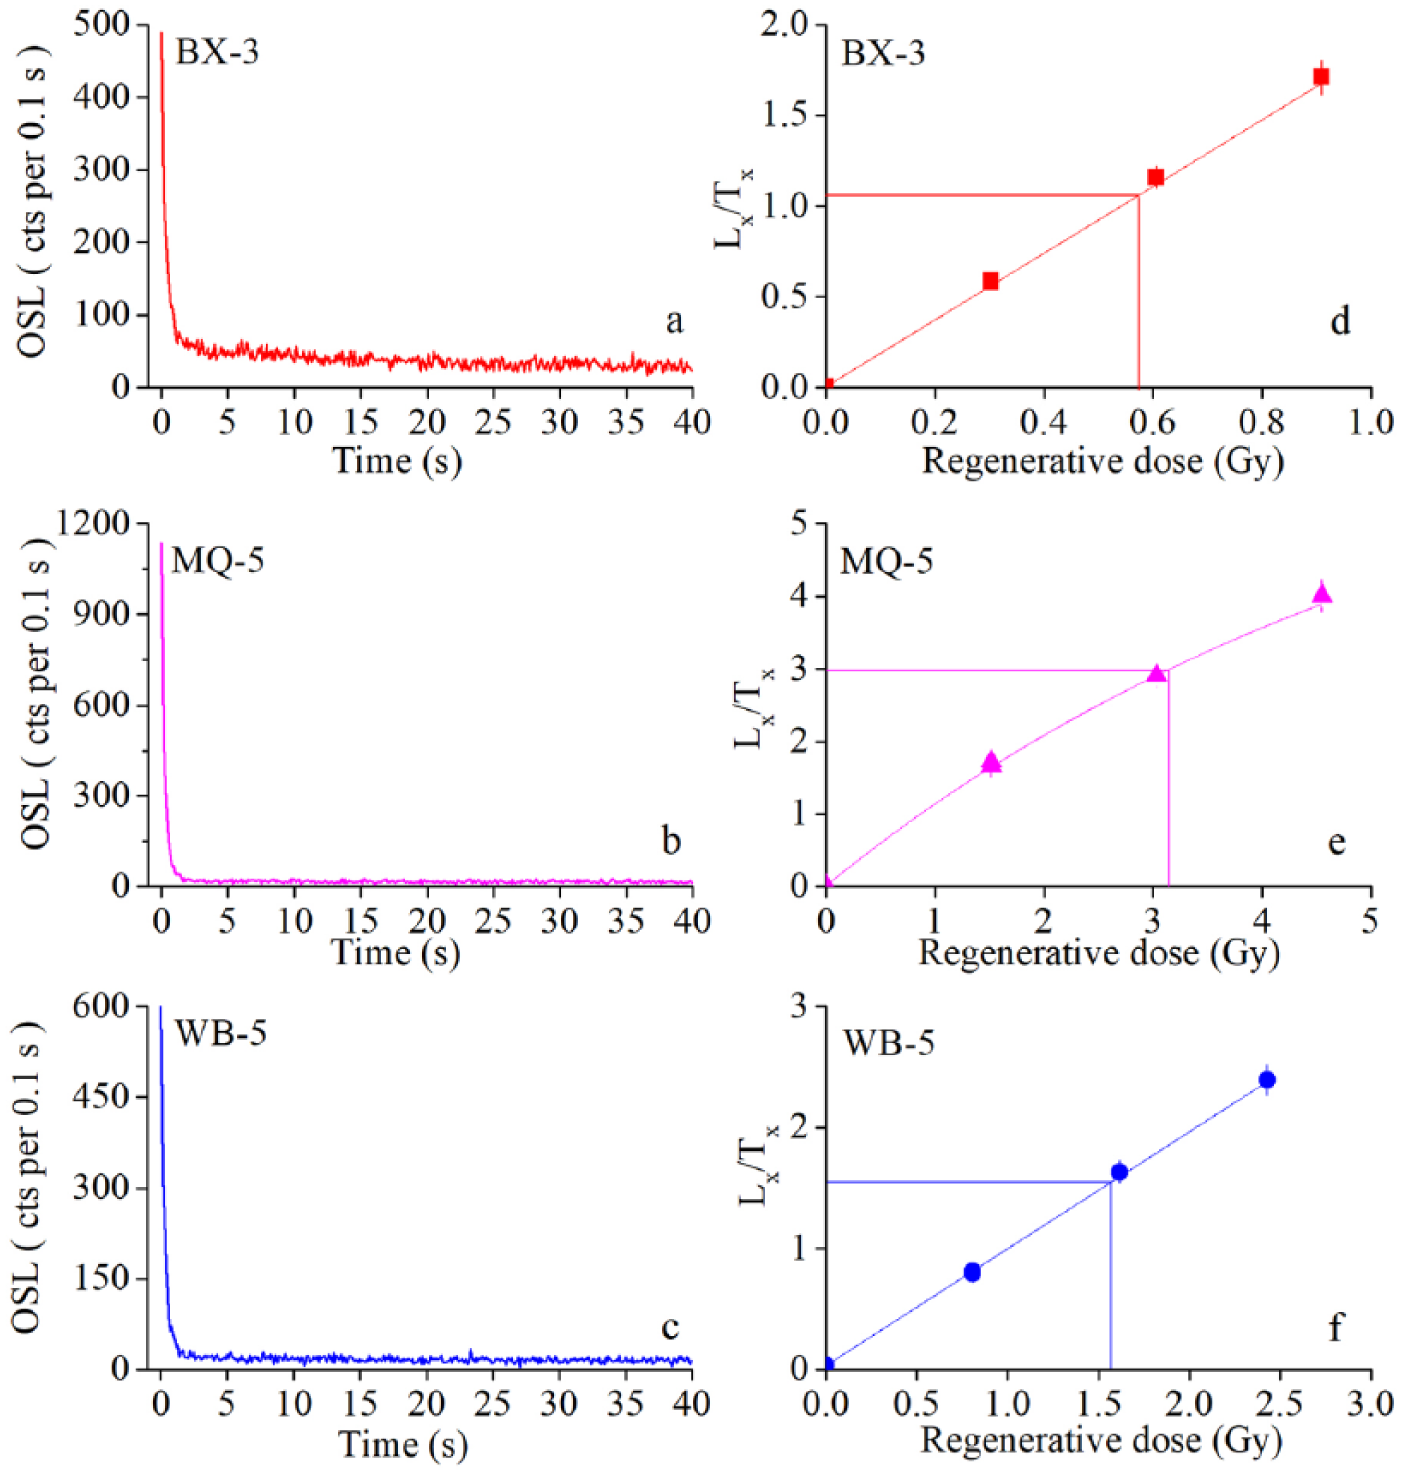
(a, b and c) Natural OSL decay curves and (d, e and f) the sensitivity-corrected growth curves of samples BX-3, MQ-5 and WB-5.
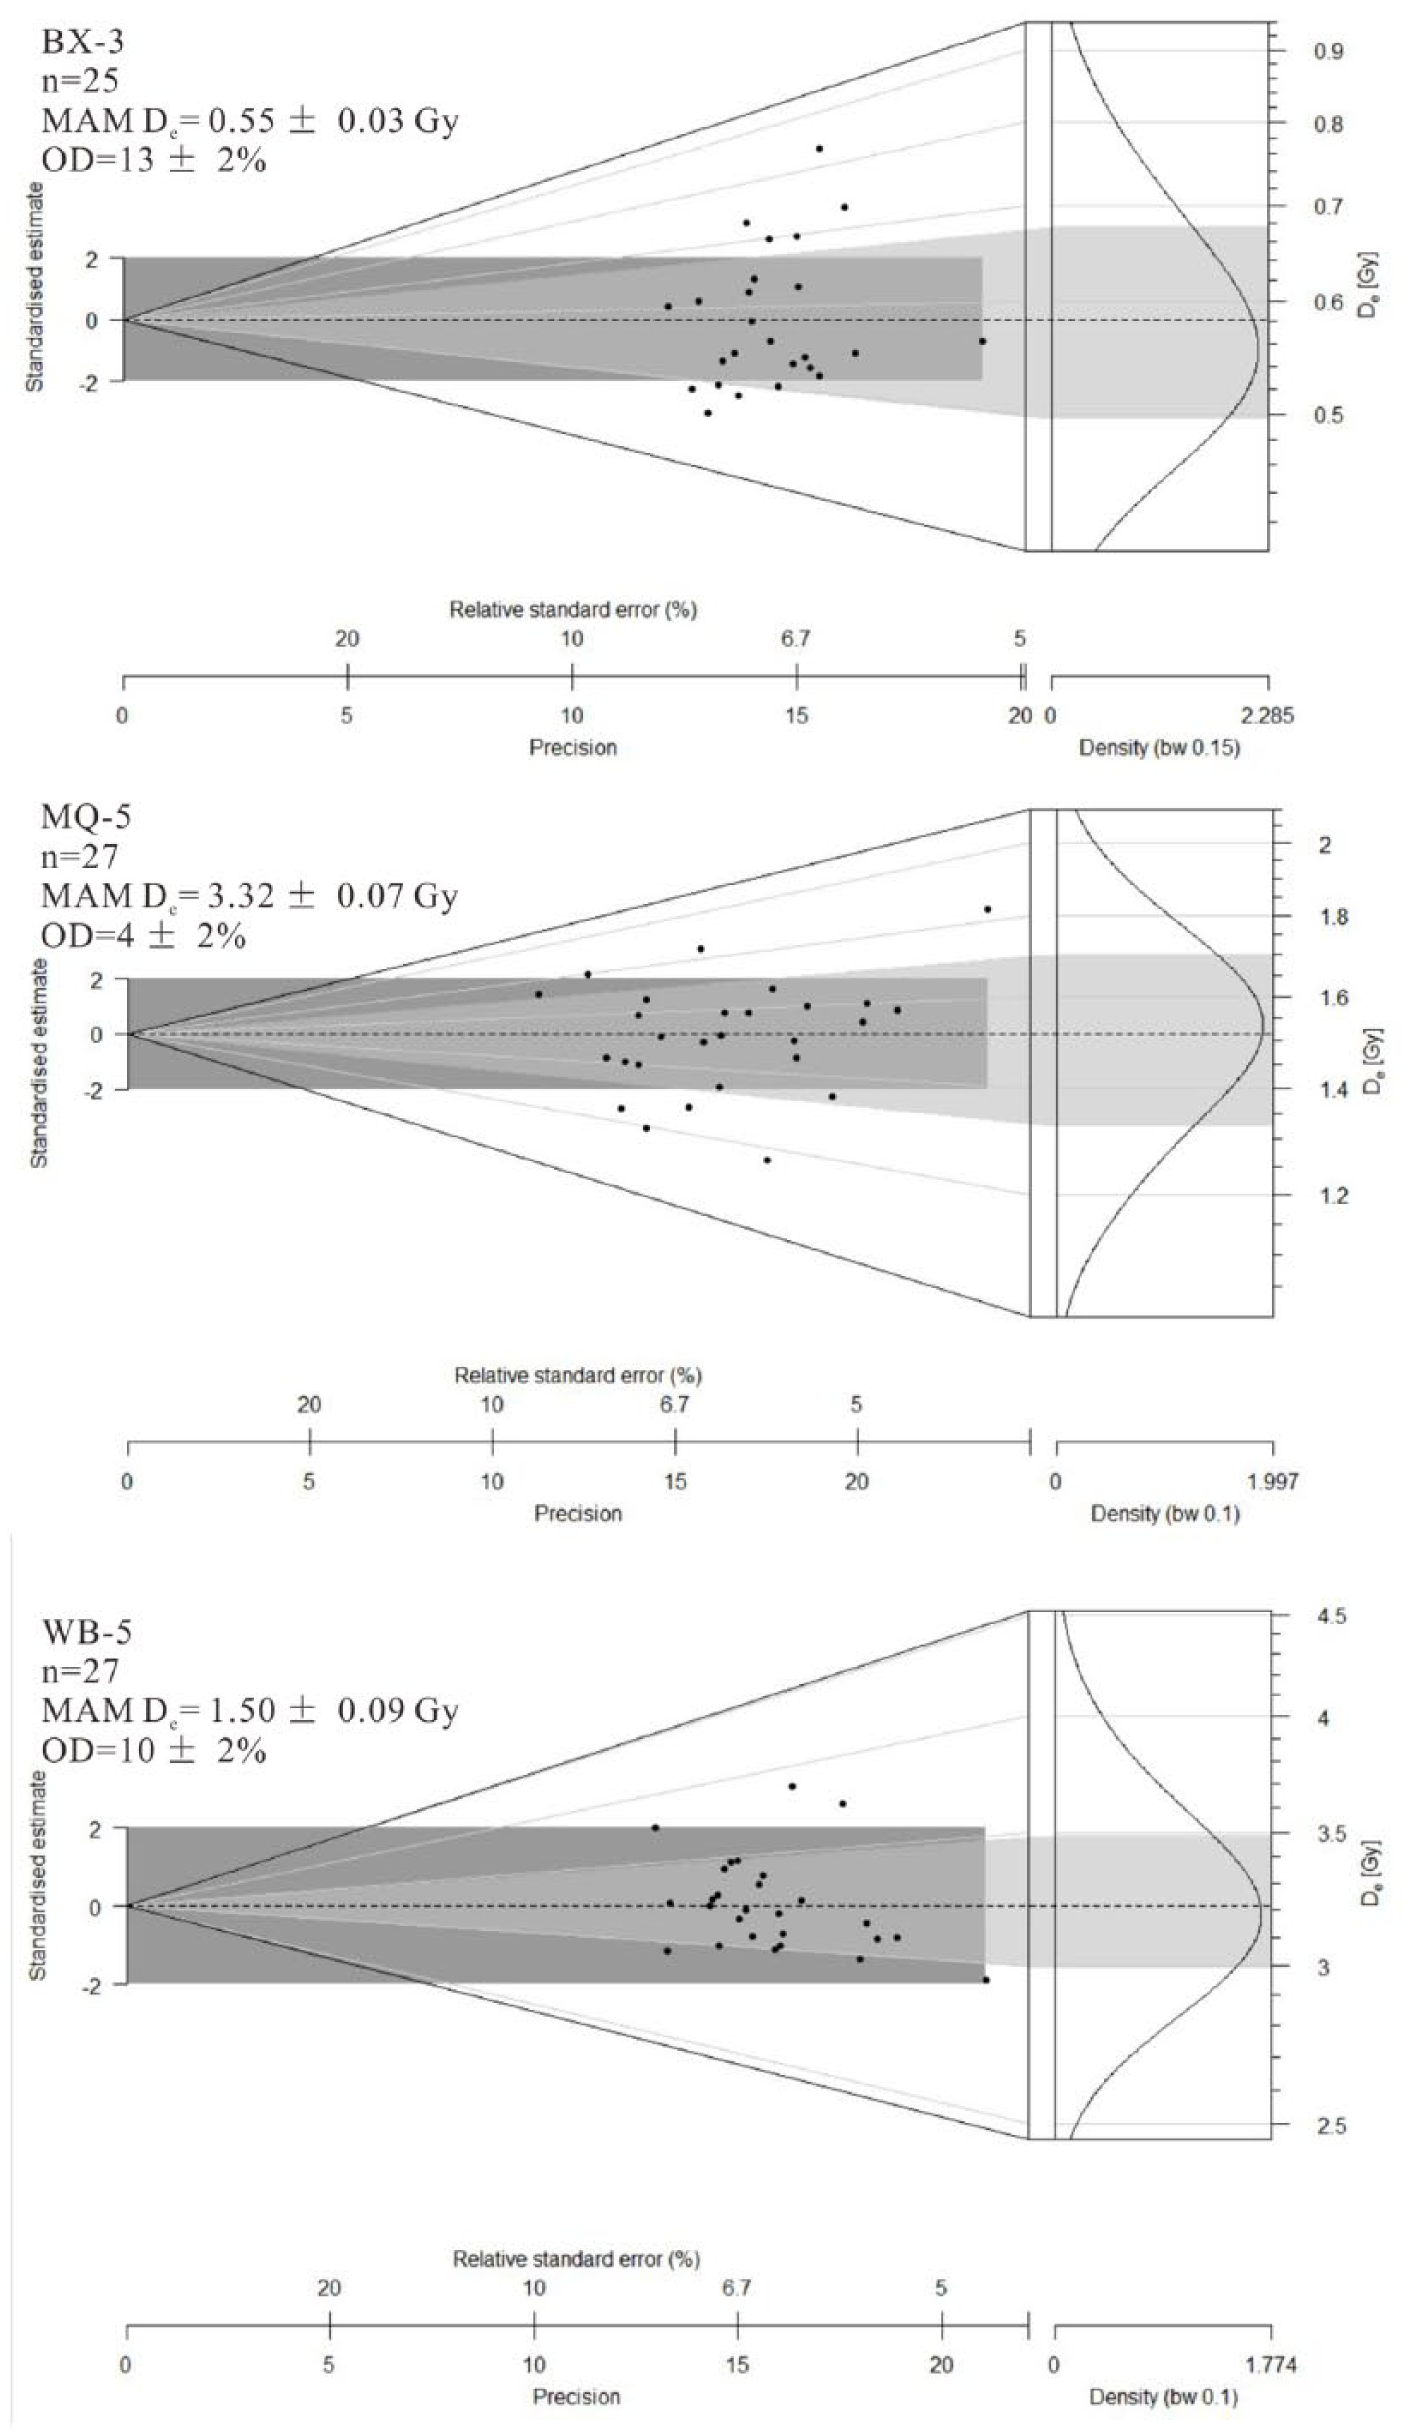
De distributions shown as radial plots and kernel density estimate plots for samples BX-3, MQ-5 and WB-5. The grey bar is centred on the De calculated by the MAM.

The relationship between CAM De versus MAM De for all samples from cores BX, MQ and WB; the inset shows the ages of the samples ranging from 0 to 1000 a.
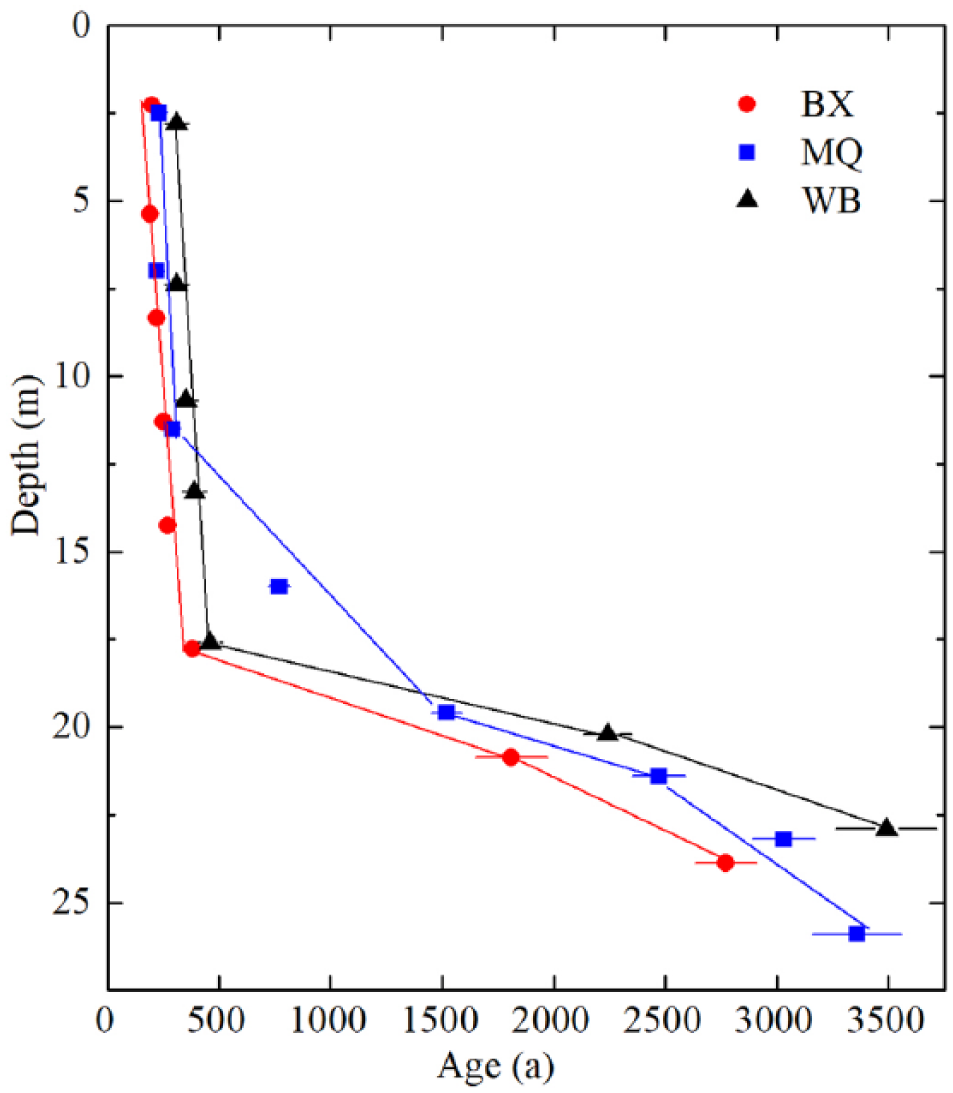
Age-depth relationships and accumulation curves for cores BX, MQ and WB. The MAM ages were used in this figure.
Discussion
Reliability of the OSL chronology
The OSL ages of the samples from cores BX, MQ and WB generally increase with increasing depth and agree well with the wider stratigraphic sequence of the area, except for sample WB-5 which shows age reversals (Table 1). There are a couple of common potential reasons for such OSL age reversals in the YRD area, such as incomplete quartz bleaching due to rapid deposition, turbidite sedimentation or sediment reworking caused by gravity flow, river floods, tidal currents or typhoon events in general (Nian and Zhang, 2018). Considering the sedimentary strata of the core, redeposition of eroded older sediment may take primary responsibility for the abnormal OSL age of sample WB-5, and therefore, this sample was excluded in the following discussion. According to historical records (Figure 1), the most northern coring site became emergent about 300 years ago (in the middle 18th century). The youngest OSL ages of the samples from delta plain range from ca. 190 to 340 a, a timeframe that coincides with historical documents. The OSL ages in Unit C of the three cores become older from south to north, that is, the OSL ages in the cores’ top layer are BX < MQ < WB. This indicates that the northern part of the study area was formed earliest. This is consistent with the southward progradation trend of the coastline indicated by historical evidence (Figure 1) (Chen et al., 1979; Tan, 1987; Zhou, 1999).
Our OSL ages in Units B and C of cores BX and WB are close to those of the corresponding layer in neighbouring core EGQD14, which is younger than 600 a (Gao et al., 2019). It should be noted that age reversals also occurred in core EGQD14 (Figure 2). Prodelta facies (Unit A) in our cores are older than 2000 a, which is similar to that in neighbouring core EGQD14 (>2460 a). Further southward, core CM97 includes prodelta facies older than 1510 a (Figure 1; Hori et al., 2001).
Sedimentation rates and their environmental significance
According to the OSL ages, the sedimentation rates of Unit A range from 0.2 ± 0.1 to 0.5 ± 0.1 cm/a. In Units B and C, the sedimentation rates increase greatly to 8.6 ± 0.5 cm/a (17.8–2.3 m) and 9.9 ± 0.7 cm/a (17.6–2.8 m) for cores BX and WB, respectively. In core MQ, the top part of Unit B and Unit C has a very high deposition rate, that is, 15 ± 2.5 cm/a (11.5–2.5 m), while the lower part of Unit B (19.6–11.5 m) has a lower sedimentation rate of ca. 0.7 ± 0.1 cm/a (Figure 8).
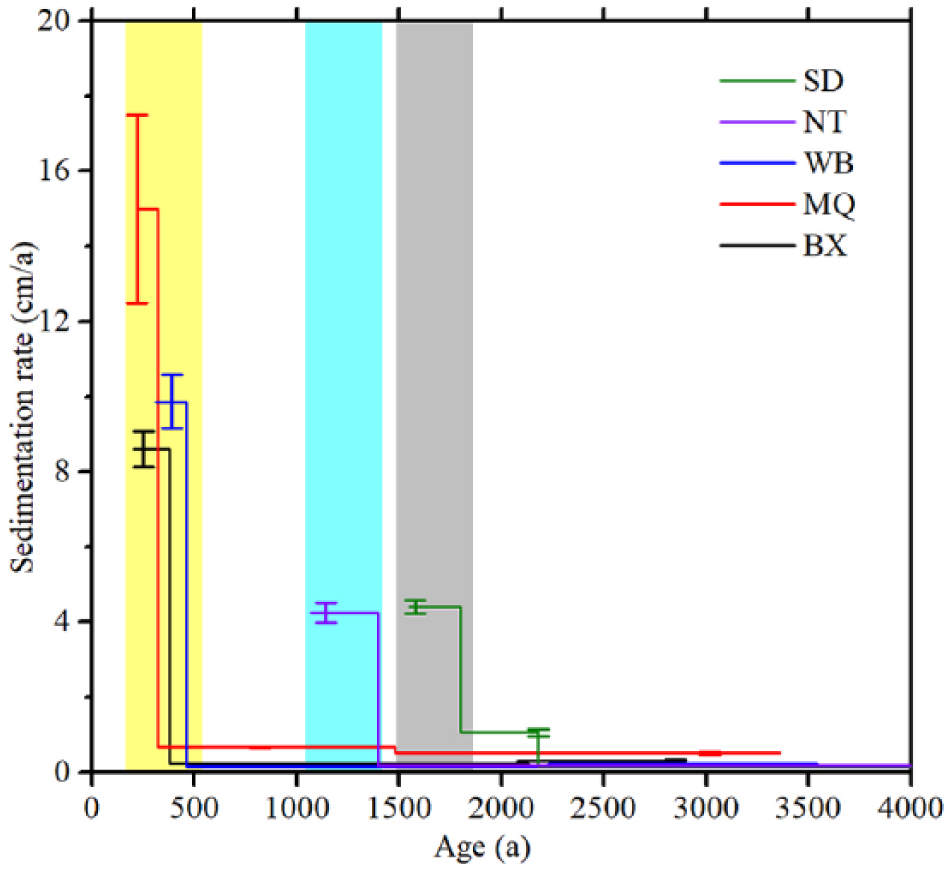
Sedimentation rate variations in cores BX, MQ and WB in comparison with previously reported cores SD (Nian et al., 2018b) and NT (Nian et al., 2018a). The coloured zones reveal different stages of rapid deposition, which suggest a general coastal progradation trend from northwest to southeast. Please visit the journal website to view this figure in color.
According to the sharp change in grain size, OSL dating result and a broken shell layer in core BX, we infer that there is a sedimentary hiatus between Units A and B. Such an extremely low sedimentation rate at the transition of Units A and B indicates that the coring site experienced limited sediment deposition for a long period. In addition, the erosion of previously deposited sediment by extreme events could be also a possible reason (so-called Sadler effect, Sadler, 1981), as historical documents show coast advancement/retreat in the last 1000 years (Chen and Chen, 2010; Ling, 2001; Zhang and Meng, 2009).
The extremely high sedimentation rates in Units B and C, and their coarser particle size, reflect the sedimentation characteristic of an estuarine sand bar (Goodbred and Saito, 2012; Noel and Robert, 2010). Synthesising of the results of the dating of sediment cores in the YRD, we found that the YRD has a rapid sedimentation rate in the top ca. 20 m, which covers the delta front and delta plain facies (Nian et al., 2018a, 2018b). Such river mouth sand bar deposition tends to migrate eastward and southward with the progradation of delta. In other words, the delta depocenter has migrated to the study site during the last 500 years, causing the enhanced sedimentation rate in Units B and C.
From previous studies, it has been shown that migration of river mouth sand bar deposition in the YRD began around 6.0 cal kyr BP, when sea levels stabilised (Song et al., 2013). The nearby cores NT (Nian et al., 2018a) and SD (Nian et al., 2018b) show rapid deposition from 2000 to 1000 a (Figure 8). Our cores show a rapid accumulation period during last 500 a, which is consistent with nearby core EGQD14. Based on the OSL ages, we find that sediment rates in the river mouth bar become faster in the younger sediments (Figure 8). Sediment accumulation rates in cores NT and SD range from 4.2 ± 0.3 to 4.4 ± 0.2 cm/a (Nian et al., 2018a, 2018b), while in the more recent cores BX, MQ and WB, it ranges from 8.6 ± 0.5 to 15.0 ± 2.5 cm/a (Figure 8).
Such an increased deposition rate at our study site may have been caused by the narrowing and shoaling of an incised palaeo-Yangtze River valley since 2000 a. That is, if sediment supply was constant during the Holocene, the continuous deposition of sediment in the valley will have decreased the accommodation space and therefore increased the accumulation rate. Alternatively, this feature could have been caused by an increased sediment supply since the late Holocene. One explanation for such a change is that human activities in the Yangtze River basin have intensified over the last 2000 years with a growing population (Chen et al., 1979). Alternatively, it is argued that the southern shift of the Yellow River mouth to the Jiangsu coast (to the north of the study area) between 888 a (AD 1128) and 161 a (AD 1855) delivered abundant sediment to the Yellow Sea (Zhang, 2005) (Figure 1a). A proportion of the sediments was carried southward to our study area by longshore currents therefore contributing to the rapid emergence of land over the last 300 years (Zhang, 2005). The exact mechanism involved requires further study.
Furthermore, our OSL dating of multiple cores, densely sampled within a small area, reveals the detailed distribution of sedimentary units within a delta system. A sedimentary hiatus, reflected by the OSL ages, is seen in all three cores; however, core MQ seems to have received sandy deposits earlier. A comparison of particle size characteristics indicates that the sand content in core MQ is much greater than in cores BX and WB in Unit B (Figure 3). In cores BX and WB, at the boundary between Units B and C and the bottom part of Unit B (Figure 2), a shell layer (~3 cm) indicating an erosional feature was observed. This shell layer is not seen in core MQ. We therefore infer that core MQ was located on a sandy mouth bar in the former estuary while cores BX and WB lay in the neighbouring channels on either side of the mouth bar. Such an assemblage of mouth bar and distributary is commonly found in tidal dominated estuarine environments. From historical documents, it is evident that the Qihai plain formed from a number of smaller sand shoals interspersed by channels (e.g. Figure 1e). It is interesting, however, that our results are consistent with earlier observations in tidally dominated deltas: progradation and land formation are largely through the amalgamation of smaller mouth bars and the siltation of distributaries (Goodbred and Saito, 2012). It demonstrates the heterogeneity of deposits with delta environments and that detailed sampling and dating is badly needed for proper delta evolution reconstruction.
Conclusion
Based on OSL dating using coarse silt-sized quartz (45–63 μm), we find that rapid aggradation of the delta front and the delta plain facies of the Qihai plain on the northern YRD occurred within the last 500 a. The underlying prodelta facies has an age of more than 2000 a, which is consistent with regional stratigraphic and historical documentary evidence. The large age gaps between the prodelta and delta front facies suggest that the coring sites remained at a water depth of ca. 18 m for a considerable period before the deposition of sandy river mouth bars. Among the three cores studied, the central core (MQ) appears to accumulate sandy deposits earlier than the neighbouring cores (BX and WB). This suggests that core MQ was located on a sandy mouth bar in the former tidal dominated estuary while cores BX and WB sat in the neighbouring channels. Our results demonstrate that the OSL technique can constrain estimates of coastline change on centennial scale based on documents in historical archives. Such a combined approach offers a more confident understanding of coastal geomorphological evolution processes in a tide-dominated delta.
Supplemental Material
Supplementary_Material – Supplemental material for Refining the late-Holocene coastline and delta development of the northern Yangtze River delta: Combining historical archives and OSL dating
Supplemental material, Supplementary_Material for Refining the late-Holocene coastline and delta development of the northern Yangtze River delta: Combining historical archives and OSL dating by Feng Wang, Weiguo Zhang, Xiaomei Nian, Can Ge, Xuanqi Zhao, Qinzi Cheng, Jin Chen and Simon M Hutchinson in The Holocene
Footnotes
Acknowledgements
Feng Wang gratefully acknowledges financial support from the China Scholarship Council (CSC). We thank the reviewer who gave constructive comments that have greatly improved the paper.
Funding
The author(s) disclosed receipt of the following financial support for the research, authorship, and/or publication of this article: This study was supported in part by the National Natural Science Foundation of China (41271223, 41576094 and 41771009), the Ministry of Science and Technology of China Project (2017YFE0107400), the China Postdoctoral Special Science Foundation (2017T100284) and the Open Research Fund of State Key Laboratory of Estuarine and Coastal Research (SKLEC-PGKF201906).
Supplemental material
Supplemental material for this article is available online.

References
Supplementary Material
Please find the following supplemental material available below.
For Open Access articles published under a Creative Commons License, all supplemental material carries the same license as the article it is associated with.
For non-Open Access articles published, all supplemental material carries a non-exclusive license, and permission requests for re-use of supplemental material or any part of supplemental material shall be sent directly to the copyright owner as specified in the copyright notice associated with the article.
