
Abstract
Atmospheric dust plays an important role in terrestrial and marine ecosystems, particularly those that are nutrient limited. Despite that most dust originates from arid and semi-arid regions, recent research has shown that past dust events may have been involved in boosting productivity in nutrient-poor peatlands. We investigated dust deposition in a mid-latitude, raised bog, which is surrounded by a complex geology (paragneiss/schist, granite, quartzite and granodiorite). As proxies for dust fluxes, we used accumulation rates of trace (Ti, Zr, Rb, Sr and Y) as well as major (K and Ca) lithogenic elements. The oldest, largest dust deposition event occurred between ~8.6 and ~7.4 ka BP, peaking at ~8.1 ka BP (most probably the 8.2 ka BP event). The event had a large impact on the evolution of the mire, which subsequently transitioned from a fen into a raised bog in ~1500 years. From ~6.7 to ~4.0 ka BP, fluxes were very low, coeval with mid-Holocene forest stability and maximum extent. In the late Holocene, after ~4.0 ka BP, dust events became more prevalent with relatively major deposition at ~3.2–2.5, ~1.4 ka BP and ~0.35–0.05 ka BP, and minor peaks at ~4.0–3.7, ~1.7, ~1.10–0.95 ka BP and ~0.74–0.58 ka BP. Strontium fluxes display a similar pattern between ~11 and ~6.7 ka BP but then became decoupled from the other elements from the mid Holocene onwards. This seems to be a specific signal of the granodiorite batholith, which has an Sr anomaly. The reconstructed variations in dust fluxes bear a strong climatic imprint, probably related to storminess controlled by North Atlantic Oscillation conditions. Complex interactions also arise because of increased pressure from human activities.
Introduction
Dust emission, transport and deposition are fundamentally affected by climate (e.g. Maher et al., 2010; Shao, 2014) but, conversely, dust plays a significant role in influencing global climate (e.g. the radiative balance, serving as cloud condensation and ice nuclei), on relevant biogeochemical processes (e.g. ocean fertilization) and it has the potential to produce environmental and health impacts such as the dispersion of microorganisms and pollutants (e.g. Formenti et al., 2011; Goudie, 2009; Martínez-García and Winckler, 2014; Merkel et al., 2014; Schepanski et al., 2014; Winckler and Mahowald, 2014). Despite the significant advances in characterizing dust properties, challenges regarding their variation in space and time remain (Formenti et al., 2011). Long-term records of dust deposition from environmental archives can contribute valuable information about these variations at different temporal and spatial scales (Merkel et al., 2014), and palaeo-dust records are windows through which we can observe and understand past environments (Marx et al., 2018).
Peatlands are important palaeo-environmental archives. Their wide distribution, relatively long chronologies (from late Pleistocene to Holocene) and availability of proxies (biological, mineralogical, geochemical, isotopic, etc.) offer great potential to investigate the multiple cause and effect relationships between dust and environmental processes – including human activities – from local, regional to global scales (e.g. Allan et al., 2013; Björck et al., 2012; De Vleeschouwer et al., 2014; Kylander et al., 2013, 2016; Marx et al., 2008, 2009; Shotyk et al., 2001; Silva-Sánchez et al., 2015; Vanneste et al., 2016). Peatlands are abundant in temperate and boreal areas, but these regions are often overlooked in dust research, despite the many potential dust sources they host (e.g. soils, glacial sediments, bedrock). A recent investigation by Kylander et al. (2018), carried out at Store Mosse – the largest bog in southern Sweden – found that dust fertilization may have been the trigger for an exceptional increase in peat (and carbon) accumulation that occurred in this bog between ~5.4 and ~4.5 ka BP. A fact that highlights the importance of dust in these oligotrophic ecosystems.
Few long-term dust records exist in Spain. Geochemical research performed on marine (Moreno et al., 2002) and lake sediment cores (Jiménez-Espejo et al., 2014) focused on reconstructing the changes of Saharan dust fluxes in the late Pleistocene (spanning from 48 to 28 ka) and the Holocene. The marine sediment data documented an increase in northward transport of Saharan dust coeval with strengthened atmospheric circulation in northern latitudes; while lake data reflected a stepwise increase between 7.0 and 6.0 ka BP, fluxes remaining high since then and until present.
Concerning peat research, Martínez Cortizas et al. (2005) investigated a peat core from Pena da Cadela (PDC) bog (Xistral Mountains, NW Spain), spanning from the mid/late Holocene (~5.3 ka to present) and found that increased dust fluxes coincided with forest declines during well-known cultural periods (Neolithic, Iron Age, Roman Period, Middle Ages, etc.) and establishing a link between forest clearance, enhanced soil erosion and dust emission/deposition. They also identified a possible source effect and discussed the potential influence of physical/mineralogical fractionation during transport on the geochemical record. Gallego et al. (2013) also investigated for trace elements a peat record from northern Spain, focusing their interpretation on aerosol emissions due to mining and industrial activities. Following a similar approach, Silva-Sánchez et al. (2014, 2016) analysed two shorter (~3.0 and 0.7 ka, respectively) peat records, from north-western and west-central Spain, finding the same correlation between human pressure on woodlands and increased erosion/dust deposition. More recently, Orme et al. (2017) investigated grain-size composition of a peat core from Tremoal do Pedrido (TPD, NW Spain), relating changes in sand content to storminess and adding another piece to the dust–climate puzzle.
Here, we present a palaeo-dust record from TPD, which extends the chronology of the latter investigations back into the early Holocene (~10.3 ka BP) and, to date, provides the longest dust record in the region. We analysed a peat core at high resolution for lithogenic elements (K, Ca, Ti, Rb, Sr, Y and Zr) and calculated their accumulation rates (ARs). Our aim was to: (1) quantify elemental net ARs and estimate the total AR of atmospheric soil dust, (2) determine the chronology of the dust events at quasi-decadal to millennial scale and (3) relate the events to potential driving factors (i.e. climate, source changes, human activities). Understanding dust composition and sourcing is also important for the use of lithogenic elements as reference for the estimation of atmospheric soil dust (e.g. Shotyk et al., 2002) or the calculation of enrichment factors of pollution elements such as Pb (e.g. Kylander et al., 2006).
Material and methods
Location and sampling
TPD is a small (2 ha) raised bog located in the Xistral Mountains (43.4503°N, 7.5292°W), in NW Spain, at an elevation of 695 m a.s.l. and approximately 30 km south of the Atlantic coast (Figure 1). The vegetation of the central dome is dominated by sedges (Carex duriei, Carex panicea), grasses (Molinia caerulea, Agrostis curtisii, Deschampsia flexuosa) and mosses (Sphagnum subnitens), while heathers (Calluna vulgaris, Erica mackaiana) are in a relatively low abundance. In the fen lag grasses dominate, mosses (Sphagnum subsecundum and Sphagnum denticulatum) are less abundant, and rushes (Juncus bulbosus) become a significant component of the plant communities (Fraga Vila et al., 2001).
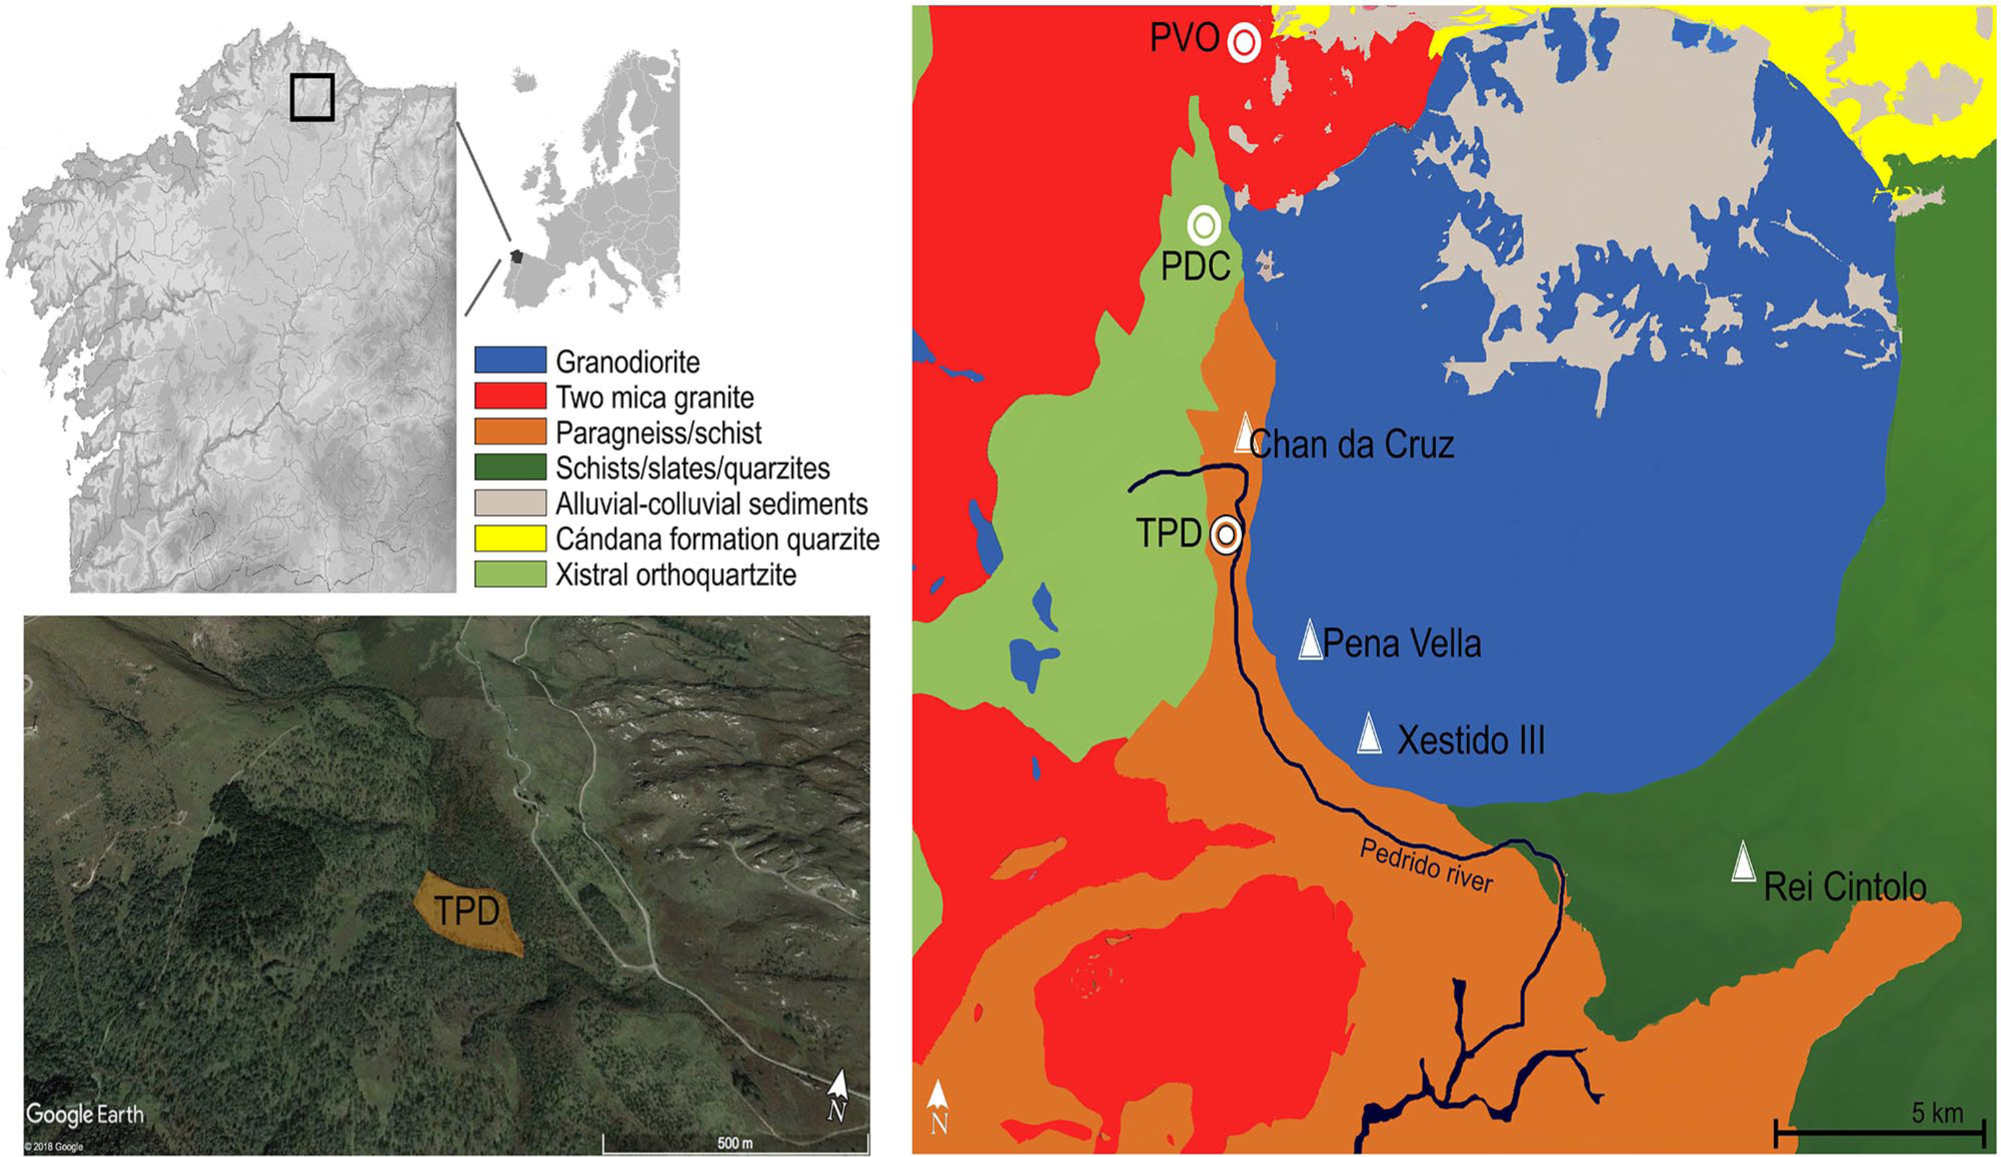
Location of the Tremoal de Pedrido raised bog. Circles represent other studied bogs in the area (PDC, Pena da Cadela; PVO, Penido Vello), while triangles represent prehistoric archaeological sites (Chan da Cruz, Pena Vella, Xestido III, Rei Cintolo; see text for references).
The mire lies over metamorphic rocks (paragneiss/schist), but locally (within 1–10 km), two mica granites (to the north and south of the mire), quartzites (to the west) and granodiorites (to the east) are also extensive, making for a complex geological setting (Figure 1).
A 4.23 m profile was sampled in 2012 at the centre of the dome with a Russian corer (1 m long and 10 cm in diameter). We used a parallel two-bore sampling procedure, taking overlapping sections (100 cm long, with ~10 cm overlap) with alternating drives within ~50 cm of each other. Peat sections were protected in PVC hemi-tubes, wrapped in plastic film and taken to the laboratory. Here, they were sliced into 1-cm-thick slices for the upper metre and into 2-cm-thick slices below 1 m. Each sample was placed in a polyethylene bag and stored at 4°C in a fridge. Sections were aligned by using stratigraphy, physical properties (bulk density, ash content, and colour) and geochemical composition.
Physical properties
Bulk density was determined by dividing the mass (i.e. dry weight) of each peat slice by its volume. Ash content was obtained after burning samples, previously dried until constant weight, at 450°C for 2 h. Ash content was then calculated as the percentage of the total dried mass represented by the ash.
Colour was determined in dried and finely milled samples using a Konica-Minolta CR-5 colorimeter for solids, measuring in the CIELab colour space (e.g. Sanmartín et al., 2015). The measurements provide quantitative values for luminosity (L*), colour coordinates (a* and b*), chroma (C*) and hue (h). Here we present the colour coordinates to support the interpretation of the stratigraphy of the bog.
Geochemical composition
Dried samples were finely milled and homogenized prior to analysis. Carbon and nitrogen were determined by combustion using a LECO Truspec CHN analyser. Lithogenic elements (K, Ca, Ti, Ti, Rb, Sr, Y and Zr) were analysed using an EMMA-XRF analyser (Cheburkin and Shotyk, 1996; Weiss et al., 1998), which was calibrated with standard certified reference materials (NIST 1515, 1541, 1547 and 1575, BCR 60 and 62 and V-1). Detection limits were 0.01% for Ca and K, 20 µg g–1 for Ti, 2 µg g–1 for Zr and 0.5 µg g–1 for Rb, Sr and Y. Replicate analyses of selected samples agreed within 5%. The equipment is hosted at the RIAIDT (Infrastructure Network to Support Research and Technological Development) facilities of the Universidade de Santiago de Compostela (Spain).
Calculation of ARs and dust fluxes
ARs were calculated by multiplying the concentrations of the elements by the bulk density and dividing by the time span represented by each peat slice (estimated using the age-depth model). The calculated ARs are expressed as either g m–2 yr–1 (K and Ca) or mg m–2 yr–1 (Ti, Rb, Sr, Y and Zr). Total accumulated soil dust (ASD) is usually estimated by using the concentration of a conservative lithogenic element in a reference material, such as the upper continental crust (see, for example, Shotyk et al., 2002). Although trends and chronologies are quite similar, very different estimates of AR can be obtained depending on the element and reference employed (Kylander et al., 2016; Shotyk et al., 2002).
As discussed below, we opted to use the ash content to estimate total mineral matter mass and from this the AR of inorganic (AR-Ing) matter, as an approximation for total ASD. We are aware of the limitations because ash is not only composed of inorganic material deposited on the bog (changes in plant composition may also affect ash content). But logic dictates that any estimation using lithogenic elements should be equal to or closer to the AR-Ing (i.e. the estimation should not be much larger than the total mass of inorganic matter in a given peat section). For the sake of comparison, we calculated ASD using Ti, Zr and Rb, following Shotyk et al. (2002). ASD-Ti and ASD-Zr resulted in ARs two to four times larger than AR-Ing, while AR-Rb produced two to three times larger ASD in the fen and transition sections but almost identical values to AR-Ing in the bog section of the core (SM Figure 1, available online). The use of single elements may result in an overestimation of mineral matter fluxes, even if we consider that some of the minerals that were originally deposited were completely weathered and some mineral losses may have occurred during the following millennia. It is unlikely, however, that 60–80% of the total deposited dust mass was lost through weathering and leaching, even in the most recent sections of the peat record, as suggested by the AR-Ti and AR-Zr records. Thus, here we use AR-Ing as a conservative estimate of atmospheric dust deposition.
Age-depth modelling
Eleven bulk peat samples were radiocarbon dated (Beta Analytic Inc.; SM Table 1, available online). The corresponding age-depth model was obtained using the Clam application developed by Blaauw (2010), which includes calibration of the 14C dates with the IntCaL13–14C calibration curve (Reimer et al., 2013). The model was constrained with the age of sampling (year 2012) at the surface, plus estimated calibrated ages for well-known events (SM Figures 2 and 3, available online; AD 1 for the Roman Pb peak; AD 1975 for the maximum recent Pb peak and lowest Pb isotopic ratio, constrained with 210Pb analyses; Martínez Cortizas et al., 2005, 2012, 2013; Olid et al., 2010, 2013; Pontevedra-Pombal et al., 2013). The best fit was obtained using a smooth spline (SM Figure 2, available online). All dates provided in this text are in calibrated years BP unless specified otherwise.
Statistical analyses
Correlation between peat properties, elemental concentrations and ARs was assessed with the Pearson correlation coefficient. Factor analysis by principal components (PCA) was also performed on the lithogenic elements and total inorganic ARs (correlation matrix mode) to reduce dimensionality. Data were standardized (Z-scores) before analysis to avoid scaling effect and obtain average-centred distributions (Erickson et al., 1999). The varimax solution maximizes the loadings of the variables on the components, enabling the extraction of the shared and specific variation of each element, thus providing more clear patterns and helping in the identification of the underlying (latent) factors affecting dust deposition.
PCA on the correlation matrix provides loadings for the variables that are in fact correlation coefficients, and thus the square of a loading in one component accounts for the proportion of variance of a variable allocated into that component. The sum of the squares of the loadings of the extracted components is the communality of the variable (i.e. the total proportion of its variation explained by the components). Here we use the fractionation of the communality to assess the effect of the underlying factors in controlling the ARs of the lithogenic elements and total inorganic matter content. This can be depicted as a simple but informative cumulative graph (Muller et al., 2008).
To determine the probability of discrete changes occurring in the depth/age records, we used the change point (CP) modelling routine developed by Gallagher et al. (2011), as applied in previous investigations on peat records (e.g. Kylander et al., 2013). The approach uses transdimensional Markov chain Monte Carlo to sample thousands of possible solutions, in a Bayesian context, balancing the requirement of fitting the data and avoiding unjustified complexity on the CP structure.
Results
Peat sequence and nature of the mire
The depth records of the physico-chemical properties analysed (peat density, ash content, total carbon and nitrogen and peat colour parameters) are presented in Figure 2. The base (>412 cm) of the TPD core is represented by an organic-rich, mineral sediment (A), with high density (0.40–0.73 g cm–3) and ash content (64–85%), and low C (7.6–20.4%) and N (0.29–0.66%) contents. No evidence of flooding events or erosion (lamination, sandy layers, etc.) was found. The composition changes abruptly into minerogenic peat (fen section, 360–412 cm, B), characterized by a large decrease in density (to approximately 0.20 g cm–3) and ash content (20–32%) and an increase in C and N (35–46% and 0.91–0.21%, respectively). From 360 to 340 cm (transition section, C) the minerotrophic peat evolves into ombrotrophic peat, which dominates the rest of the profile (bog section, <340 cm, D). This last section is characterized by peat densities less than 0.2 g cm–3 (down to 0.09 g cm–3), ash contents typically below 2% (with some localized peaks of up to 14%), and very high C (44.0–55.4%) and N (0.60–2.74%) content. Peat density and ash content are positively correlated, and negatively correlated with carbon content (SM Table 2, available online; sediment samples excluded); nitrogen is not significantly correlated with C nor with peat density or ash.
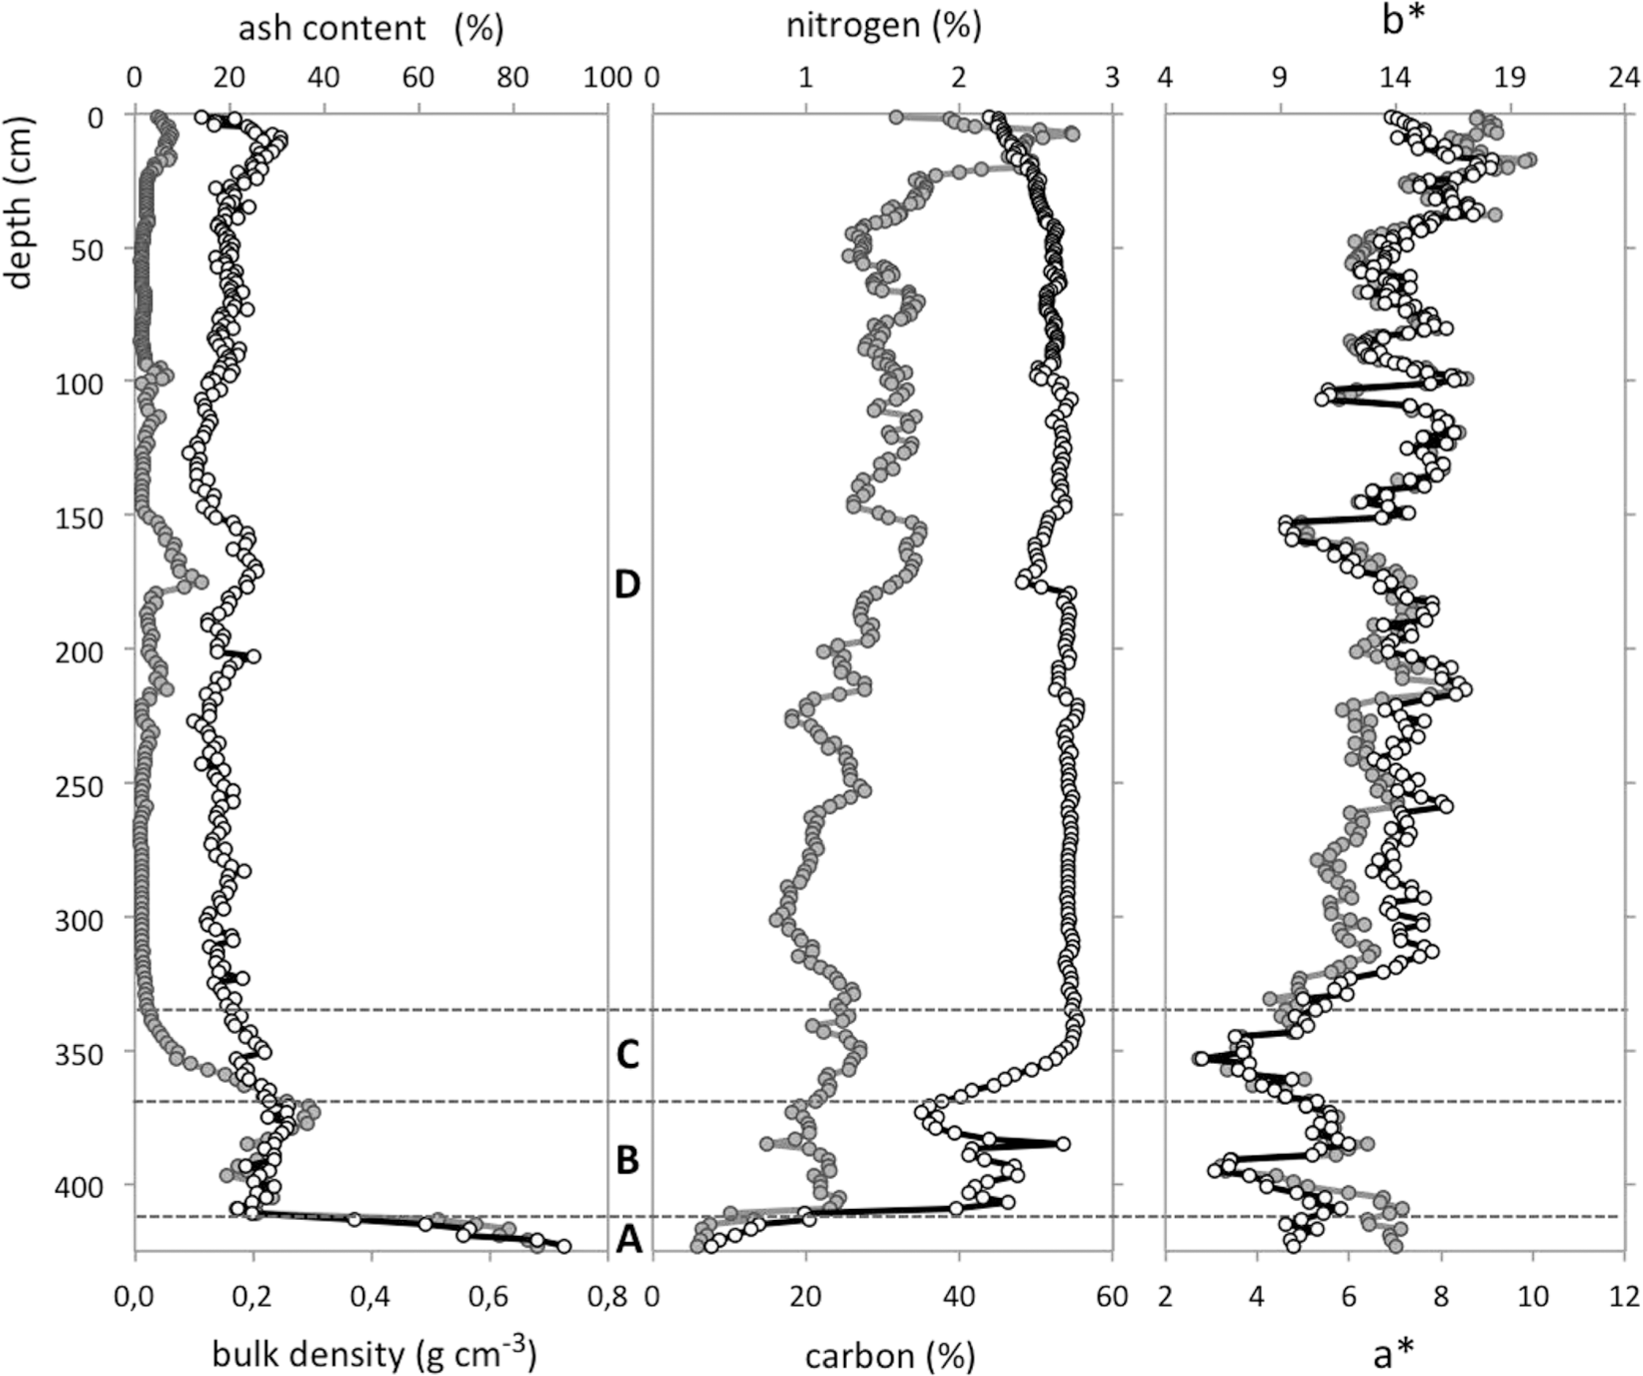
Bulk density, ash content, total C and N contents and colour parameters (a* and b*) in the TPD core (NW Spain). A: organic matter rich mineral soil; B: minerogenic peat (fen section); C: transition peat; and D: ombrotrophic peat.
The colour coordinates, a* and b*, have low values, indicating brownish peat colours (Figure 2). Sections A– C show relatively lower values (i.e. dark brown), while they increase and remain approximately 7 and 14 (a* and b*, respectively), indicative of lighter brown colours, in the ombrotrophic peat. These values are quite similar to those obtained for another profile sampled in the same bog (Sanmartín et al., 2015). Both parameters are highly correlated (r = 0.87; SM Figure 4, available online) and show some small variations in the ombrotrophic peat section, two excursions to lower values coinciding with increases in ash content (Figure 2). These data are used to support the stratigraphy of the TPD core and will not be discussed further.
Records of lithogenic elements
The analysed lithogenic elements show quite similar patterns of concentrations and ARs (Figure 3 and SM Figure 5, available online): high values in the sediment (section A, SM Figure 5, available online), intermediate in the fen section (B), rapidly decreasing values in the transition section (C) and generally low values in the bog section (D). The largest concentration peak occurs at 377 cm for all elements, and minor peaks are also found in the bog section (the most obvious at 160–175, 99, 68, 37 and 9 cm, Figure 3). K, Ca, Rb and Sr also show a steady increase in the upper peat section (starting at 80, 50 or 25 cm). Apart from these, Sr (and Ca to some extent) is also elevated in the section 270–330 cm.

Depth records of concentrations (grey line) and accumulation rates (black line) of lithogenic elements in the peat section of the TPD core (NW Spain). B: minerogenic peat (fen section); C: transition peat; and D: ombrotrophic peat.
Lithogenic elements are highly correlated with ash content (r = 0.75–0.98, SM Table 2, available online), with Sr showing the lowest correlation, although is still significant. ARs of the single elements are also highly correlated between them and with the total AR of inorganic matter (AR-Ing, SM Table 2, available online). Again, the main exception is Sr, which has a moderate to low correlation with AR-Ca and AR-K.
The PCA extracted four major components (Cp1–Cp4) from the records of ARs. They explain 97% of the total variance (Cp1 69%, Cp2 21%, Cp3 5% and Cp4 2%). Loadings for the AR can be found in Table 1 and a summary of the fractionation of the communality (i.e. the variance of each AR explained by the set of extracted components) is shown in Figure 4. AR-Ing, AR-K, AR-Ca, AR-Ti, AR-Rb, AR-Y and AR-Zr show large positive loadings in Cp1 and AR-Sr in Cp2 (Table 1). Cp2 also allocates a significant part of the variance for AR-Ca (33%) and a small part for AR-K (12%) and AR-Rb (7%). Cp3 captures a significant percentage of the variance for AR-K (24%) and a low percentage for AR-Rb (7%), while Cp4 seems to be related to the residual variation of AR-Y (10% of the variance).
Loadings of the principal components (Cp1–Cp4) extracted by PCA, using the accumulation rates as variables.
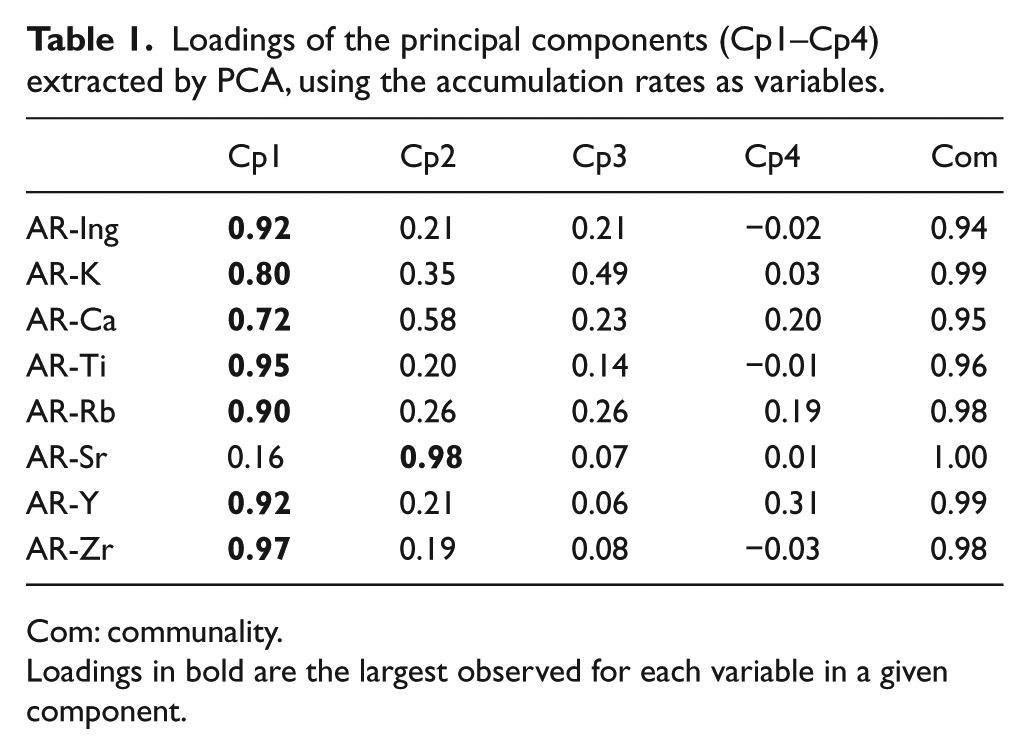
Com: communality.
Loadings in bold are the largest observed for each variable in a given component.

Fractionation of the communality of the accumulation rates of lithogenic elements after extraction with principal components analysis.
Chronology of changes in dust deposition and composition
The chronology of the scores’ records of the principal components provides a way to holistically evaluate the main changes in the fluxes and composition of the dust deposited on TPD (Figure 5). We follow the subdivision of the Holocene proposed by Walker et al. (2012).

Chronology of the changes of the four extracted components using the accumulation rates of lithogenic elements and total mineral matter content. The grey lines indicate the probability of a change point obtained by change point modelling.
Early Holocene (10.3–8.2 ka): Peat accumulation in TPD was initiated by ~10.3 ka and a fen existed until the end of this period. Mineral matter accumulation was high (average AR-Ing 18 ± 3 g m–2 yr–1) and with relatively low variation until ~8.6 ka (Figure 5). From ~8.6 ka to the boundary of the mid Holocene, dust fluxes increased to reach the maximum value of the record (AR-Ing 37 g m–2 yr–1). Dust deposition may have also been elevated ~9.9–9.7 and ~9.3–8.8 ka, but the lower temporal resolution of this section of the profile increases the uncertainty of the results.
Strontium fluxes were proportional to total dust fluxes (Figure 5), showing the same changes and a high correlation with AR-Ing and to the other lithogenic elements (r = 0.77–0.98, n = 21). Yttrium, on the other hand, was relatively enriched (the correlation with AR-Ing is the lowest of all lithogenic elements, r = 0.76).
Mid Holocene (8.2–4.2 ka): Dust fluxes decreased rapidly until ~6.7 ka, coinciding with the decrease in bulk density, ash content and the increase in total C and N, and a change to more chromatic, brownish peat colours typical of ombrotrophic peat. The mire fully transitioned into a bog over a period of approximately 1500 years. During this transitional phase, K fluxes were slightly higher and Y fluxes were relatively lower (Figure 5).
Between ~6.7 ka and the late-Holocene boundary, dust fluxes were at background values (average AR-Ing 2.2 ± 0.6 g m–2 yr–1). Contrary to the total dust flux, Sr accumulation largely increased in the early bog phase until ~5.5 ka. It rapidly decreased by ~5.1 ka and then held relatively lower but constant values to the phase boundary (Figure 5).
Late Holocene (<4.2 ka): CP analysis identifies six dust events (Figure 5): ~4.0–3.7, ~3.2–2.5, ~1.7, ~1.4, ~0.95–0.74 and ~0.35–0.05 ka, with maxima AR-Ing ranging from 3 to 23 g m–2 yr–1. Synchronous with the largest AR-Ing (by ~3.2–2.5 ka), K and Y fluxes were relatively lower and Sr fluxes relatively higher (Figure 5). From 1.1 ka to present, AR-Sr rapidly increased to values comparable with those recorded in the period ~6.6–5.5 ka (Figure 5), while AR-K increased abruptly since ~0.35 ka.
Discussion
Estimating net atmospheric soil dust deposition (ASD)
ARs of lithogenic elements in peat are easy to estimate provided that accurate bulk density, elemental concentrations and age are available. But translating this into net dust ARs is more complicated. Usually, one or more lithogenic elements are chosen based upon the assumption that their host minerals (1) are not intensely affected by weathering processes in the source area, (2) are not subjected to significant physical and mineralogical fractionation during transport, (3) interception by mire vegetation does not result in depletion or enrichment, (4) remain in constant proportion with changes in dust fluxes and (5) are not significantly affected by post-depositional remobilization. As indicated by Kylander et al. (2016), no optimal reference element exists. These authors found that the use of different elements resulted in differences up to an order of magnitude in the estimation of net dust fluxes and variable timing of maxima. This is consistent with the comments made in the section dealing with the calculation of atmospheric dust ARs and highlights the need for caution and a thorough evaluation of element behaviour in each case/site.
Ash content is frequently determined to assess the total amount of mineral matter in peat. However, it is known that it is not only related to inorganic dust deposition because changes in peat vegetation (e.g. from mosses or herbs to woody plants) may also affect it. On the other hand, in the TPD core, the large correlation (SM Table 2, available online) and communality (Table 1) between AR-Ing (even being a conservative estimation of ASD) and the AR of lithogenic elements (Ti and Zr in particular) supports the assumption that almost all changes in ash content are related to dust content. Findings by Orme et al. (2017), based on results from a shorter profile from the same bog, support this interpretation. In that profile, sand content and ash were highly correlated (r = 0.71, n = 249). Sjöström et al. (2018) also lend support to our assumption as they found that the bulk mineralogy of peat samples ashed at 500°C was dominated by commonly occurring atmospheric dust minerals (primary minerals, such as quartz and feldspar, and secondary minerals, such as clay minerals). The geology of the area where TPD is located is mainly composed of plutonic and metamorphic rocks, implying that the mineralogy of the soils is dominated by quartz, feldspar and muscovite, with some minor contributions of plagioclase, biotite and trace abundances of minerals such as zircon, apatite or monazite. No carbonate source exists in the area. Le Roux and Shotyk (2006) and Chesworth et al. (2006) have discussed the stability of mineral phases under the geochemical environment of the peat. Some of the minerals in minor and trace abundances in the soils surrounding TPD – and consequently, also in the atmospheric dust – have higher susceptibility to weathering in the bog, as illustrated by SEM analyses (Le Roux and Shotyk, 2006). This implies that part of the original dust mass may have disappeared through weathering and leaching after thousands of years in the bog. Given the dominant mineralogy of the sources, only a small proportion is likely to have been lost at TPD.
The TPD mire AR-Ing and AR-lithogenic records show a complex history of dust deposition in NW Iberia during the Holocene. AR-Ing identifies 10 (possibly 12) events, seven of them during the late Holocene (past 4000 years, Figure 5). Assuming AR-Ing is a reasonable estimator of total mineral matter accumulation, it was much higher in the early Holocene: background values were nine times and the mid- and late-Holocene maximum 1.6 times higher than their mid- and late-Holocene counterparts. The dramatic decrease in mineral matter accumulation at the end of the early Holocene reflects the evolution of the mire from a fen into a bog. During the fen phase, apart from atmospheric sources, mineral matter fluxes may have largely depended on contributions of eroded soil material by runoff from the catchment. In fact, the peak in AR-Ing by ~8.1 ka is only two times larger than the average (AR-Ing 8.9 ± 1.5 g m–2 yr–1) from ~10.3 to ~8.6 ka. Of the seven dust events identified in the late Holocene, two show comparable increases (two to three times the background) with five much larger (four to ten times the background).
Our results also indicate that while AR-Ti and AR-Zr seem to be exclusively controlled by total mineral dust flux, the accumulation of K, Ca, Rb, Y and Sr was partially controlled by other processes.
The climate signal in the dust record
The chronology of the dust events bears a notable climatic imprint, most particularly with well-known Holocene cold events. Figure 6 compares proxies for dust deposition in TPD (AR-Ing, Cp1 and AR-Sr) with climate proxies for cold and dry periods (Wanner et al., 2011) at northern latitudes. Of the eight major cold periods in the North Atlantic, four are synchronous with increases in dust deposition at TPD: at ~9.9–9.7, ~8.4–8.1, ~3.2–2.5 and ~1.7–1.4 ka. Two others coincide with minor increases in AR-Ing (not detected by CP modelling) at ~5.2 and ~4.6–4.4 ka; and the other two are coeval with major AR-Sr increases, by ~6.2–6.5 and ~0.95–0.35 ka (Figure 6a, c and d).
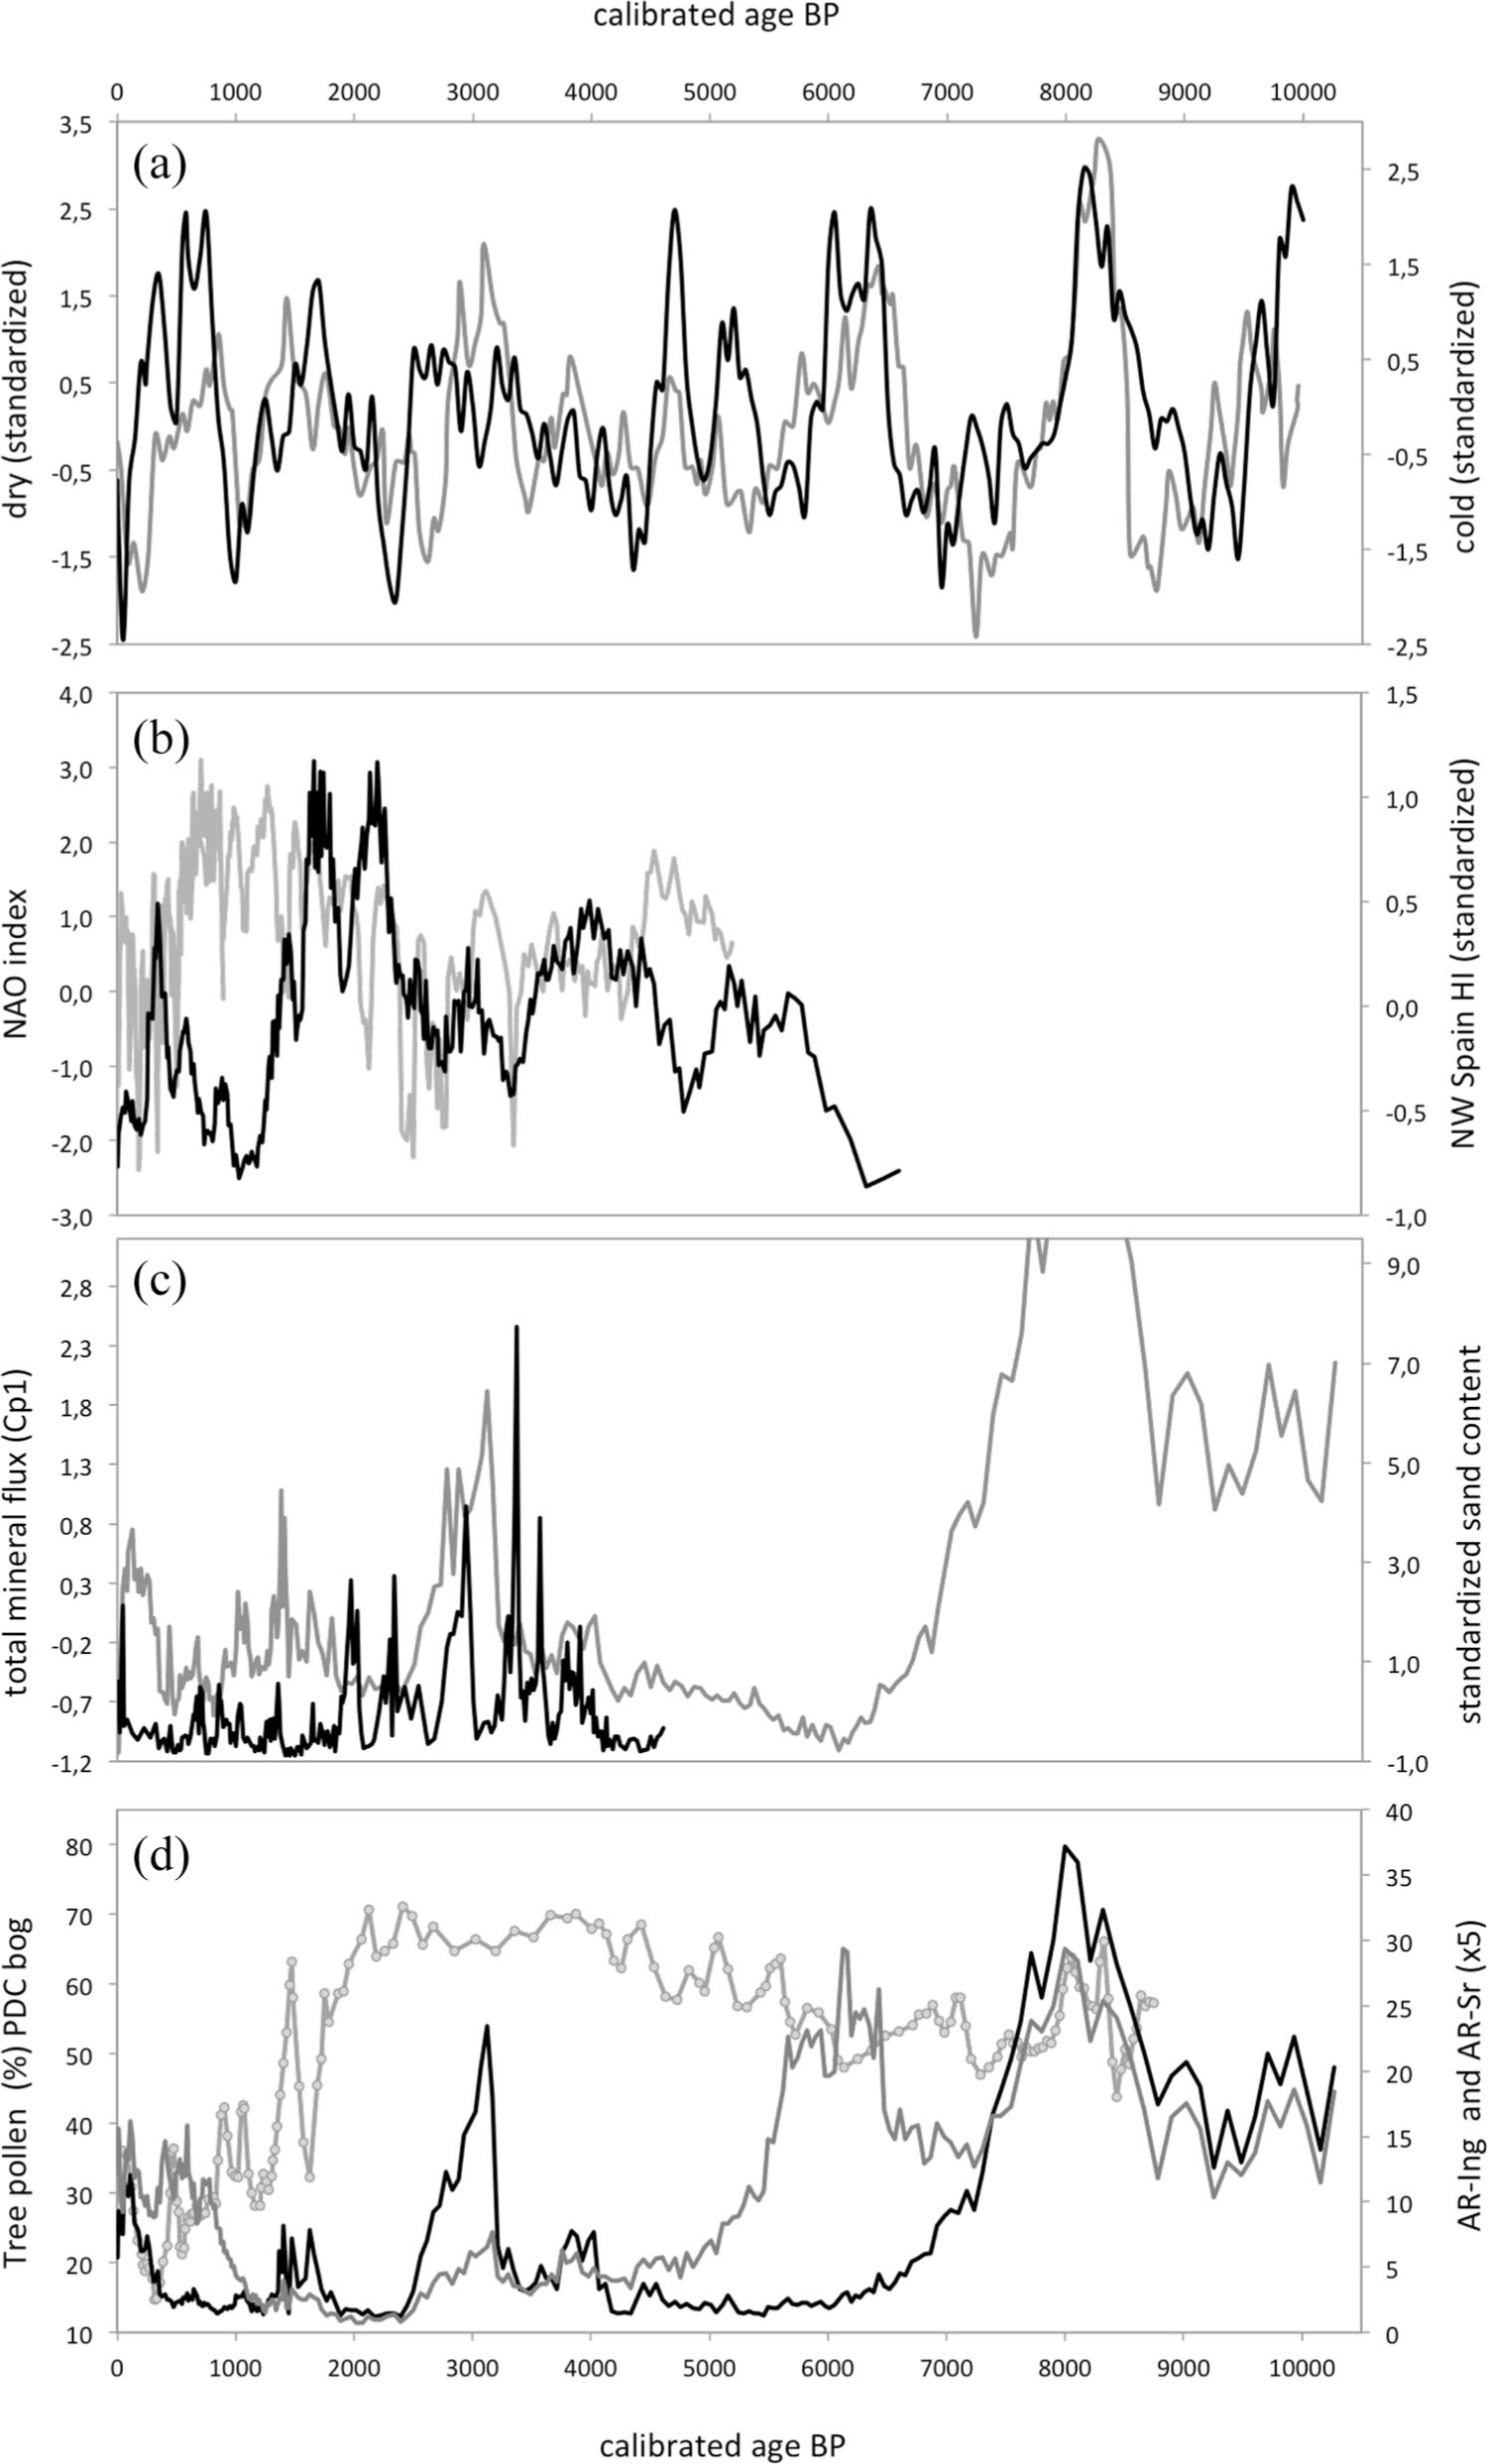
Changes in atmospheric dust fluxes during the Holocene found in the Tremoal do Pedrido raised bog and comparison with climate proxies. (a) cold (black line) and dry (grey line) phases in the North Atlantic (Wanner et al., 2011) – positive values: colder and drier, negative values: warmer and wetter; (b) reconstructed NAO index (Trouet et al., 2009 and Olsen et al., 2012) and humidity index for NW (compiled from Martíez Cortizas et al., 1999 and Mighall et al., 2006; positive values: wetter, negative values: drier); (c) standardized sand content (black line) of a previous TPD core (Orme et al., 2017) and total mineral flux (Cp1, grey line) in the studied core and (d) AR-Ing (black line) and AR-Sr (dark grey line) in the TPD core and tree pollen record (light grey line) from the Pena da Cadela (PDC) bog.
Because major dust sources are presently located in arid and semi-arid (warm and cold) regions, changes in aridity have been invoked to explain the variability shown by palaeo-dust records. In the reconstruction by Wanner et al. (2011), cold and dry conditions mostly co-occur, making it difficult to assess their potential control at TPD. Nevertheless, higher dust deposition seems to coincide with cold and very dry phases in the North Atlantic (e.g. ~8.4–8.1 and ~3.2–2.5 ka) rather than cold and less dry (e.g. ~9.9–9.7, ~5.2 and ~4.6–4.4 ka) climatic conditions (Figure 6a). All but one of the warmer and humid phases correlate with lower dust fluxes in TPD. The only exception is the ~4.0–3.7 ka event, which may have occurred under moderately dry and warm conditions in the North Atlantic (Figure 6a). Marx et al. (2018) remark on the apparent inconsistency regarding the role played by variations in aridity on controlling dust emissions, at least in arid areas, because rainfall rarely inhibits soil erosion. On the other hand, Pye and Zhou (1989) suggest that continental aridity plays a minor role in dust fluxes from China into the Northwest Pacific.
The TPD record also fits with the chronology of fluctuations in Sahara dust supply – the Sahara being one of the major sources of dust for southern Europe. The record from Lake Sidi (Middle Atlas, Morocco), for example, reflects clear increases in dust deposition at approximately 10.2, 9.4, 8.2, 7.3, 6.6 and 5.0 ka (Zielhofer et al., 2017a), which may correspond with the ~9.9–9.7, ~9.3–8.8, ~8.6–8.1 and ~5.5–5.1 ka phases in the AR-Ing TPD record. The Saharan dust peaks at 7.3 and 6.6 ka found in Lake Sidi coincide with the fen bog transition in TPD and cannot be identified. These increases were correlated with minima in Western Mediterranean winter rainfall and North Atlantic cooling (Zielhofer et al., 2017b).
Figure 6b shows a local humidity index that was compiled from three humidity records obtained for peatlands in the Xistral Mountains (data from Martínez-Cortizas et al., 1999 and Mighall et al., 2006). It also shows the compiled curve of NAO reconstructions done by Trouet et al. (2009) and Olsen et al. (2012), which together extend back to ~5.5 ka. Overall, high values of the humidity index (i.e. higher rainfall) correspond to low or negative values of the NAO. This is particularly the case for the quasi-permanent positive NAO between ~1500 and ~600 BP, the Medieval Climate Anomaly, which ended at the start of the ‘Little Ice Age’ (Oliva et al., 2018). Studies of historical records of precipitation from NW Spain have also shown that the NAO is highly correlated with winter rainfall, where negative values are associated with the passage of cold fronts responsible for enhanced rainfall events, that is, a southern displacement of the storm track (Fernández-González et al., 2012; Lorenzo et al., 2008; Trigo, 2006). At the same time, both records (NAO and local humidity) indicate that cold phases in the North Atlantic corresponded to dry periods at lower latitude and vice versa; a correlation already proposed by Magny (2013) based on Holocene lake levels and dendrochronological data from Europe.
Changes in storminess may also exert a control on dust deposition. Orme et al. (2017) investigated grain-size distribution from a shorter core sampled in TPD and used the content of coarse sand as a storm track index (Figure 6). Our longer records for AR-Ing and total mineral matter flux (Cp1) fit rather well with this index, although the peaks are not always of the same magnitude. The most notable difference occurs between ~2.4 and 2.0 ka, when sand shows two clear increases against background dust fluxes (Figure 6c and d). Peaks in mineral matter fluxes and, most particularly, sand content, coincide with negative excursions of the NAO suggesting a strong link between dust production–deposition and storminess during the last 5.5 ka, as suggested by Orme et al. (2017). Our results also confirm the larger impact of dust events during the late Holocene with background fluxes prevailing through almost all of the mid Holocene, as observed in other areas of Europe (Allan et al., 2013; Shotyk et al., 2002), Africa (Zielhofer et al., 2017b) and North America (Pratte et al., 2017). If this scenario was typical of the whole Holocene, our record also suggests that NAO values may have been positive during the mid Holocene, when mineral matter fluxes to TPD were very low. A situation supported by increased storm activity at higher latitude during this period (Stewart et al., 2018).
Variations in the grain size of the deposited dust may be accompanied by changes in elemental composition due to physical and mineralogical fractionation during transport (Björck et al., 2012; Marx et al., 2018; Schuetz, 1989; Vanneste et al., 2016). Coarser (i.e. sand) and denser mineral particles are deposited closer to the source area but finer ones (i.e. silt and clay) are mostly washed out by rainfall (i.e. wet deposition). Research done on soils of the studied area found significant differences in major and trace element concentrations in different grain-size fractions (Peiteado Varela et al., 2002; Taboada et al., 2006). In soils developed from granites and granodiorites, K, Ca and Sr were enriched in the sand, Zr in the silt and Ti in the clay fractions. These results point to a potential for chemical fractionation depending on dust transport conditions. In fact, this is observed when element contents in TPD are compared with those found by Martínez Cortizas et al. (2005) in the nearby PDC bog (~6 km NW of TPD at 970 m a.s.l., Figure 1). During the last 5000 years, K, Ca, Ti, Sr and Zr average contents in TPD were higher compared with PDC (by 2.5, 1.6, 1.7, 1.3 and 1.2 times, respectively).
Dust sources
The evidence discussed so far suggests that most of the dust deposited at TPD may have come from local sources. It is reasonable to assume that in periods characterized by larger PCA scores local sources dominated dust fluxes, as shown by the increase in grain size found by Orme et al. (2017); while more distant sources (i.e. dusts from long-range transport) may have contributed significantly only under low or background dust fluxes. This is supported by Kylander et al. (2005) who investigated the Pb isotopic composition in a core from the Penido Vello (PVO) bog (~10 km N of TPD at 780 m a.s.l., Figure 1), and used the isotopes to estimate the relative contribution of local sources and Saharan dust to the accumulated Pb deposition record. They found that during the early Holocene and beginning of the mid Holocene Saharan dusts contributed less than 2% of the deposited Pb, while through almost all of the mid Holocene – when background dust fluxes occurred at TPD – the Saharan contribution increased to as much as 42%. They connected these variations to the stepwise aridification of the Sahara, which may have ended by the beginning of the late Holocene.
Apart from these general considerations, the most noteworthy change in dust composition seen in the TPD record is that shown by the AR-Sr. Although Sr fluxes share most of the changes shown by the other lithogenic elements, specific phases of elevated values occurred at ~6.6–5.5 ka and during the last 1 ka. The high concentrations and AR-Sr in the lower section of the core could be affected by upward diffusion of Sr derived from the weathering of the local rock/sediment, as suggested for other Sr records from raised bogs (Shotyk et al., 2001). While some contribution from the weathering of plagioclase (low content) in the basal soil/sediment cannot be disregarded, this is not likely to be the dominant source of Sr in TPD. There is no continuous decrease from the bottom to the top of the core, but rather discrete peaks that suggest periods of increased atmospheric inputs. Moreover, the shorter record at PDC (~5.3 ka; Martínez Cortizas et al., 2005) and PVO (~8.0 ka; Kylander et al., 2005) also show elevated Sr concentrations between ~5.0 and 7.0 ka and during the last 1000 years, pointing to a regional signal. This is remarkable because the three bogs have developed over quite different lithologies: paragneiss/schist, quartzite and granite (TPD, PDC and PVO, respectively; Figure 1) and, thus, represent quite varied local mineralogical compositions.
The geochemical atlas of soils from NW Spain (Guitián, 1992) indicates that Sr concentrations in the granodiorite’s soils are up to two times higher compared with soils developed on paragneiss/schist and granite, and up to five times higher than soils developed on quartzite (concentrations of >250, 100–150 and <50 µg g–1, respectively). Thus, the periods of high Sr concentrations and ARs (~5.0–7.0 and <~1.0 ka) most likely reflect dust originating from the granodiorite batholith. The Sr signal in TPD may be enhanced by physical fractionation because, as indicated above, Sr concentrations are higher in the coarser fractions and this mire is at lower altitude and closer to the batholith than PDC and PVO (see Figure 1). Interestingly, in both periods, elevated Sr fluxes coincide with low to very low total atmospheric dust deposition (AR-Ing, Figure 6; except for the last 300 years).
Human activities: role of deforestation
Previous results from PDC mire indicated that human activities – mainly through deforestation – played a key role in soil erosion and thus also dust transport and deposition over the last 5000 years (Martínez Cortizas et al., 2005). The main lines of evidence are (1) the synchronous decreases in total tree pollen and increases in dust deposition and Pb enrichments (for the last 3000 years), (2) the significant negative correlation between Sr concentrations and total tree pollen and (3) extensive evidence of soil erosion in prehistoric and historic times (see references in the aforementioned paper). The tree pollen record from a long profile (PDC2, unpublished data) retrieved in PDC, spanning the last ~8.7 ka is shown in Figure 6. The pattern is almost identical to that observed in the shorter record, with forest decline (i.e. decreases in tree pollen) coinciding with increases in dust deposition. During the early Holocene, relatively short-lived declines occurred by ~8.4 and ~8.2 ka, whereas more systematic retreats occurred in the mid Holocene by ~8.0–7.2 and ~6.7–5.3 ka. More localized forest contraction took place at ~5.2, ~4.6 and ~4.2 ka. In the late Holocene, a slight decline occurred by ~3.5–2.5 ka, followed by the two largest clearances in the record at ~2.0–1.6 and ~1.4–1.2 ka. During the last 1000 years the decline in forest abundance continued, dispersed between short-lived recoveries (~1.5, ~1.05, ~0.87 and ~0.44 ka), until total tree pollen recently increased over the last 200 years (mostly driven by reforestation, first by pine and later by eucalyptus).
The chronology of these changes fits with known socio-cultural periods, such as the Neolithic, Bronze Age, Iron Age, Roman period, Late Antiquity and the Middle Ages, as found for NW Spain in previous studies (López-Merino et al., 2010, 2014; Martínez Cortizas et al., 2005; Mighall et al., 2006; Muñoz Sobrino et al., 2001, 2005). Research elsewhere in Europe also pointed to climate and regional human activities as triggers for dust deposition in bogs (Fagel et al., 2014; Longman et al., 2017). In the Swiss Alps, for example, increasing human influence on erosion was found to have occurred since the middle Bronze Age, affecting soil dynamics and hydrological patterns and leading to an increase in floods (Arnaud et al., 2016).
The TPD dust record presented here is the longest obtained in NW Spain and provides new information about the early Holocene. These new data point to both climate changes and superimposed human activity as drivers of the dust fluxes. Archaeological studies suggest that the area surrounding the TPD mire was widely occupied by humans from the Upper Palaeolithic and Epipalaeolithic onwards (Figure 1). Settlement in the early Holocene included rock shelters, open-air sites and caves. Epipalaeolithic sites, such as Xestido III (8400–7800 cal BP), Pena Vella, Chan da Cruz and Rei Cintolo Cave (8600–8400 cal BP; Figure 1), have been discovered north and east of the TPD bog. In addition, Upper Palaeolithic layers were found in Pena Grande and Férvedes II (Fábregas and De Lombera, 2010; Lombera Hermida, 2011; López Cordeiro, 2004; Ramil Rego and Ramil Soneira, 1996; Villar Quinteiro, 2007) located south of the mire. The Xistral Mountains are a natural passage between inland areas and the coast, characterized by the existence of extensive wetlands. Human occupation expanded into relatively high elevations (up to 850 m a.s.l.) and seems to have been mainly related to the control and exploitation of these wetlands. Settlements grouped around them, modifying the surrounding landscape by managing the forest through the use of fire (Criado-Boado et al., 1991; López Cordeiro, 2003).
Conclusion
The dust record at TPD is the result of complex interactions through time. Climate appears as the main driver, the result of changes in temperature, humidity and storminess, coupled to North Atlantic climate patterns and the aridification of the Sahara. Metachronous (i.e. delayed) responses of human societies may have produced a positive feedback on dust emission/deposition by enhancing soil erosion due to deforestation and leading to modifications in hydrological patterns (as shown in the Alps by Arnaud et al., 2016), particularly in the late Holocene. These activities and climatic conditions most likely controlled the formation and activation of local/regional dust sources, which were dominant during phases of elevated dust fluxes. Deposition of long-range transported dust may have only been relatively relevant under local background fluxes as suggested by Kylander et al. (2005).
In line with previous work from elsewhere in Europe, Africa and North America, the TPD record reveals higher dust fluxes in the early Holocene, background deposition in the mid Holocene and increased dust fluxes during the late Holocene. Strontium, on the other hand, showed specific periods of elevated fluxes that did not coincide with other lithogenic elements. The geological setting, the distribution of Sr in the soils of the area and the coeval declines in forest cover, point to the local granodiorite area as the principal source for the dust during these periods.
Future research will extend the range of analyses including grain size, x-ray diffraction on selected ash samples, rare earth elements (e.g. as in Ferrat et al., 2012a, 2012b) and Sr isotopes determinations, would help to explore in more specific detail the mineralogical changes, in order to discriminate between the different source areas and evaluate the effects of dust fertilization on the bioproductivity and carbon accumulation of this raised bog.
Supplemental Material
TPD_SM_Figures – Supplemental material for Holocene atmospheric dust deposition in NW Spain
Supplemental material, TPD_SM_Figures for Holocene atmospheric dust deposition in NW Spain by Antonio Martínez Cortizas, Olalla López-Costas, Lisa Orme, Tim Mighall, Malin E Kylander, Richard Bindler and Ángela Gallego Sala in The Holocene
Footnotes
Acknowledgements
The authors would like to extend their thanks to the students of the EcoPast research group (GI-1553, Universidade de Santiago de Compostela, Facultade de Bioloxía) and colleagues who helped with fieldwork and laboratory analyses.
Funding
The author(s) disclosed receipt of the following financial support for the research, authorship and/or publication of this article: This research was partially funded by Consiliencia network (ED431D2017/08 Xunta de Galicia) and Funding for Consolidation and Structuration of Research Units (ED431B2018/20 Xunta de Galicia).
Supplemental material
Supplemental material for this article is available online.
References
Supplementary Material
Please find the following supplemental material available below.
For Open Access articles published under a Creative Commons License, all supplemental material carries the same license as the article it is associated with.
For non-Open Access articles published, all supplemental material carries a non-exclusive license, and permission requests for re-use of supplemental material or any part of supplemental material shall be sent directly to the copyright owner as specified in the copyright notice associated with the article.