



Abstract
A number of archives that span the past ~2000 years suggest that recent variability in hydroclimatic conditions that are influenced by the Asian monsoon in China are unusual in the longer term context. However, the lack of high-resolution precipitation records over this period hampered our ability to characterize and constrain the forcing mechanism(s) of the recent humidity variations. Here, we present the ratio of hematite to goethite (Hm/Gt) derived from the semiquantitative evaluation of the diffuse reflectance spectroscopic analysis as a reliable and effective precipitation proxy to reconstruct the humidity variations during the past 1400 years deduced from Tengchongqinghai Lake sediments, southwestern China. Hm/Gt varied synchronously with variations of Chinese temperature reconstructed from the historical documents and sunspot activity index over the past 1400 years. Critical periodicities of ~450 and ~250 years show that solar activity is the dominant control on precipitation change on centennial scales. However, the relationship determined from Hm/Gt in this study contradicts the stalagmite δ18O interpretations from different regions of China, which exhibit a more complex precipitation pattern that is influenced by the strength of westerly jet in addition to the Asian monsoon. The increased westerly jet during the ‘Little Ice Age’ (LIA) caused a humid climate in southern China and dry conditions in northern and western China.
Introduction
The climate variations over the past 2000 years are critical for contextualizing instrumental climate data in the longer term perspective, identifying anthropogenic influence on climate change, and simulating the course of future climate. It is therefore essential to reconstruct precipitation and temperature variations during the past two millennia. It has been recognized that the temperature variations in different climatic regions of China are broadly synchronous with those over the Northern Hemisphere (Ge et al., 2013; Yang et al., 2002). Nevertheless, the precipitation variations reconstructed from numerous archives, such as historical documentations, tree ring, stalagmite and pollen, revealed distinct centennial-scale variations and regional differentiations over the past 2000 years (Chen et al., 2015; Wang et al., 2001a; Zheng et al., 2014; Zhou et al., 2011 and reference therein; Yang et al., 2016). The humid/dry frequency derived from historical documents suggested that there is no uniform spatial pattern of rainfall in warm and/or cold climatic intervals during the past 2000 years (Chen et al., 2015; Wang et al., 2001; Zheng et al., 2014; Zhou et al., 2011). Based on historical documents, Wang et al. (2001b) have clarified the spatial patterns of rainfall in eastern China into six types. They suggested that the spatial patterns of rainfall in eastern China could be identified as ‘Droughts along the middle and lower reaches of the Yangtze River, floods to the north and the south of it’ and ‘Droughts in the south of the Yangtze River and floods in the north of it’ during the ‘Little Ice Age’ (LIA) (Wang et al., 2001b). The pattern of a North–South mode was suggested to dominate the Yangtze River. Zhou et al. (2011) analyzed the flood/dry frequency derived from history documents, and suggested that a relatively wetter climate dominated southern China while a relatively drier in the Yellow River valley during LIA. After synthesizing the most up-to-date and comprehensive proxy moisture/precipitation records during the past 1000 years in arid Central Asia and monsoonal Asia, Chen et al. (2015) proposed that there exists not only a ‘North–South’ mode of precipitation change in monsoonal eastern China but also a ‘West–East’ hydroclimatic dipole mode in mid-latitude Asia during the ‘Medieval Warm Period’ (MWP) and LIA.
The precipitation in southwestern China is mainly controlled by the southwest monsoon, and the spatial patterns of precipitation changes in southwestern China have been attracting growing interest (Chen et al., 2014; Li et al., 2018; Peng et al., 2019; Tan et al., 2018; Zhang et al., 2015). What are the spatial patterns of precipitation changes in southwestern China? Do the spatial patterns of precipitation in monsoonal eastern China during the past 2000 years also exist in southwestern China? These questions continually arose and high-quality records were required to shed light on the spatial patterns of precipitation changes in southwestern China. The sediments from Tengchongqinghai (TCQH) Lake and Xingyun Lake in southwestern China show that dry climate was predominant during the LIA (Chen et al., 2014; Li et al., 2018; Xiao et al., 2015; Zhang et al., 2015); however, a humid LIA was documented in Erhai Lake and Lugu Lake, which are located 176.2 and 367.3 km to the northeast, respectively (Sheng et al., 2015; Xu et al.,2014, 2015). Whether such apparent spatial differences in precipitation result from the uncertainty of proxies or reflect the geographical influence on atmospheric circulation still remain unclear. To better understand the climate changes during the LIA, more refined proxies of effective precipitation are required.
A series of studies suggested that hematite and goethite in soils and sediments provide a reliable precipitation proxy based on their opposite formation conditions and competitive formation mechanisms (Abrajevitch et al., 2009; Cornell and Schwertmann, 2003; Viscarra Rossel et al., 2010; Yapp, 2001). The reconstructed hematite and goethite ratios (Hm/Gt) from loess deposits and marine sediments have been successfully used to reflect the variations in effective precipitation (Balsam et al., 2004; Cornell and Schwertmann, 2003; Hao et al., 2009; Harris & Mix, 1999, 2002; Ji et al., 2004; Zhang et al., 2007). Here, we present a continuous and high-resolution Hm/Gt record from sediments in TCQH Lake, southwestern China to discuss the spatial pattern of precipitation during the past 2000 years. The linkage of the rainfall pattern to the solar activity and their possible mechanisms are also discussed.
Geological setting
Lake TCQH is an almost completely closed crater lake located in Tengchong County of Yunnan province, southwestern China (25°08′06″N–25°07′44″N, 98°34′11″E–98°34′26″E, elevation ca. 1885 m) (Figure 1a). A detailed description of the geological and geographical settings can be found in Peng et al. (2019). In brief, the lake water is mainly fed by precipitation. The mean annual air temperature is approximately 14.7℃ and the annual precipitation is about 1506 mm with an average of 19.9 mm in January and 291.3 mm in July (Li et al., 2018). Most of the total rainfall (75%) occurs during May to September (Peng et al., 2019). The terrestrial vegetation around the lake consists mainly of evergreen Quercus, Castanopsis, Lithocarpus, and Pinus (Li et al., 2018; Wang et al., 2002; Zhang et al., 2015) (Figure 1b).

(a) Geographical location of the Tengchongqinghai Lake (TCQH, red star) and other sites of Wanxiang Cave (WX, Zhang et al., 2008), Huguang Maar (HGY, Zeng et al., 2012), Lugu Lake (LG, Sheng et al., 2015), and Jhumar Cave (JHU, Sinha et al., 2011) (orange solid circle indicates a dry LIA and blue solid circle indicates a wet LIA). (b) A photograph of the Tengchongqinghai Lake. (c) The sites of our cores.
Methods
Sampling
Five short gravity cores (named TCQH-1, TCQH-2, TCQH-4, TCQH-5, and TCQH-6) were drilled from the lake bank to the center with water depths varying from ~1 to 5.7 m (Figure 1c). TCQH-4 (25°7′59.03″, 98°34′20.32″) is the longest (144 cm) among the five cores. Three plant remains (tree branches or leaves) in TCQH-4 (at depths of 19, 59, and 107 cm, respectively) were collected for accelerator mass spectrometer radiocarbon 14C (AMS 14C) dating at Beta Analytic Testing Laboratory, US (Table 1). The age model established by linear interpolation shows that the age of the bottom sediments is 653 cal. yr AD, and thus TCQH-4 could document climatic variations of the past 1400 years.
AMS radiocarbon dates from Tengchongqinghai Lake (core TCQH-4).

Age was calibrated by the percent modern carbon using high probability density range method.
Age was calibrated by conventional radiocarbon age using high-probability density range method.
The cores were mainly composed of homogeneous silty clay, and the color varies slightly from light dark gray to dark gray with changing organic matter content. The volcanic breccia was observed from a depth of 35 cm from the top of TCQH-2 core. The cores are continuously sampled by pushing in plastic cubes (8 cm3) for environmental magnetism analysis. A total of 213 cube samples were collected, that is, 39, 25, 72, 46, and 31 for each core, respectively. The bulk samples were also collected at the same resolution.
Magnetic measurement
The low-field volume magnetic susceptibility (κ) was first measured at a frequency of 976 Hz with a Kappabridge on all specimens. The following magnetic measurements were only performed on cube samples of TCQH-4. Anhysteretic remanent magnetization (ARM) was imparted in a 100 mT alternating field with a superimposed 50 μT direct bias field using an alternating field demagnetizer anhysteretic and pulse magnetizer (LDA5/PAM1), and then measured on a Spinner Magnetometer JR6A. Isothermal remanent magnetism (IRM) was induced in a sequence of magnetic fields of increasing value up to 1 T. The IRM induced from the 1 T field is referred to as saturation isothermal remanent magnetization (SIRM). Measurements of all the SIRM were performed with a Spinner Magnetometer JR6A.
Hysteresis loops were measured on bulk samples of TCQH-4 using Princeton Measurements Corporation MicroMag 3900 vibrating sample magnetometer (VSMs). Coercivity (Hc) were obtained after diamagnetic and paramagnetic corrections. Remanence curves were measured by current demagnetization of 0 T back to −0.5 T, and remanent coercivity (Hcr) and isothermal remanent magnetization −300 mT (IRM−300mT) were obtained by remanence curves. The hard fraction of IRM (HIRM) was defined as 0.5 × (IRM1T + IRM−300mT) and it is equivalent to the relative amount of hematite. The relative amount of goethite was defined as the difference in remanent magnetization under 1 T and 2 T fields.
In order to identify the type of magnetic materials in sediment, temperature-dependent susceptibility (χ–T) curves were measured on four representative cube samples of TCQH-4 using a Kappabridge MFK1-FA magnetic susceptibility meter from room temperature to 700℃ in an argon environment with frequency of 976 Hz. First-order reversal curves (FORCs) were measured on their bulk samples on VSMs, and the FORC diagrams were calculated from 180 FORCs using the FORCinel software version 1.18 (Harrison and Feinberg, 2008).
Diffuse reflectance spectrophotometry
The diffuse reflectance spectroscopic (DRS) analysis was measured on bulk sample of TCQH-4 to identify and semi-quantify the hematite and goethite. The pretreatment and analysis test followed the procedures described by Deaton and Balsam (1991) and Torrent and Barrón (2008). The dried bulk samples were first grinded under 200 mesh using an agate mortar and then the powder samples were put on a rectangular glass (7 cm × 4 cm × 2 mm) and made into slurry with ultrapure water. Then it was smoothed and dried at air temperature and analyzed on a Perkin-Elmer Lambda 950 spectrophotometer with a diffuse reflectance attachment. Data from the spectrophotometer were recorded at 0.5-nm intervals from 350 to 800 nm. The raw reflection curve was transferred into a second-derivation curve using the Kubella–Munk theory and mathematical method. The amplitudes of the characteristic bands in the second-derivation curve were used in the semiquantitative analysis of goethite and hematite.
Results
As is illustrated in Figure 2, TCQH-1, TCQH-4, TCQH-5, and TCQH-6 cores show the same range of volume magnetic susceptibility (0~50 ×10−6 SI) (Table S1). The magnetic susceptibility of the TCQH-2 core (~400 ×10−6 SI) is eight times that of other cores, possibly affected by the volcanic breccia. However, five cores are correlated well using the volume magnetic susceptibility, which denotes that the sediments possess common depositional features (Figure 2).

Volume susceptibility records compared with other cores in this study. (a) TCQH-1 core. (b) TCQH-2 core. (c) TCQH-5 core. (d) TCQH-4 core. (e) TCQH-6 core.
All the loops of TCQH-4 tend to close before 500 mT and have a slight wasp-waisted shape, suggesting the presence of soft and hard components (Figure 3). It is consistent with the ranges of Hcr (26–72 mT) and Hc (9–16 mT). The χ–T curves display a remarkable decrease near 580°C indicating the presence of magnetite (Figure 3). A slight decreasing trend was also observed from the room temperature to near 180°C in the χ–T curves (Figure 3), suggesting the possible presence of goethite (Liu et al., 2012). The prominent valleys at ~415 and 535 nm wavelengths in the second derivative curves of DRS of all samples proved the presence of goethite and hematite (Figure 4).

(a) Representative hysteresis loop (corrected for paramagnetism). (b) Magnetic grain size follows Dunlop (2002) of sample collected at variable depths. (c) χ–T curves for representative samples, where the red curves represent the heating curves. (d) FORC diagram for selected samples.

The second derivative curves for selected samples (I415 and I540 are the amplitudes of these characteristic bands are measured as the difference between the minimum at the band and the next associated maximum at a longer wavelength in the derivative curves).
ARM, SIRM, κ, and ARM/SIRM ratios of TCQH-4 are shown in Figure 5 (Table S2). Hm and Gt concentrations and Hm/Gt ratios derived from the semiquantitative evaluation of DRS (Hm/Gt(DRS)) in Figure 5 (Table S3). Although ARM is more susceptible to fine magnetic grains, numerous researches showed that ARM may be served as a proxy, indicating the fraction of SD particles in samples (Creer and Morris, 1996; Evans and Heller, 2003; Liu et al., 2012; Wang et al., 2001). The concentration parameters ARM, SIRM, and κ show that the concentrations of magnetic materials in TCQH-4 are stable in sediments below 103 cm. After that, the concentrations increase sharply. Apparently, increased Hm and Gt concentrations can be observed at the same section (Figure 5). However, the DRS-derived Hm/Gt ratios are relatively lower below 103 cm relative to the more recent part of the record. A similar trend can also be observed in the Hm/Gt ratios measured by environmental magnetism (Hm/Gt(Mag)) (Figure 6). Meanwhile, the grain size parameter ARM/SIRM ratios show larger values (>0.05) below 103 cm while relatively stable values (~0.025) above 103 cm, which suggests that magnetic materials above 103 cm have relatively larger grain sizes to those below 103 cm. The varied grain sizes of magnetic mineral were also illustrated in the Day-plot (Figure 3). The Day-plot and FORC diagrams indicate that the magnetic mineralogy varied from PSD to SP-SD with depth (Figure 3).

Down-core variations of magnetic and DRS parameters. (a) TCQH-4 Core photograph. (b) Volume susceptibility (κ). (c) Anhystere remanent magnetization (ARM). (d) Saturation isothermal remanent magnetization (SIRM). (e) ARM/SIRM. (f) Estimated content of hematite. (g) Estimated content of goethite. (h) Hematite/goethite (Hm/Gt).

The Tengchongqinghai Lake humidity record compared with other records. (a) Hm/Gt record from magnetism parameters (navy blue solid line, smoothed by a 5-point adjacent average). (b) Hm/Gt record from DRS data (orange solid line, smoothed by a 5-point adjacent average). (c) Ensemble temperature reconstructions of China (Ge et al., 2013). (d) The stalagmite δ18O record of Dandak Cave (Sinha et al., 2007; blue solid line; smoothed by a 5-point adjacent average) and Jhumar Cave (Sinha et al., 2011, green solid line; smoothed by a 5-point adjacent average). The gray dashed lines are raw data records.
Discussion
Hematite/Goethite ratio as a proxy for effective precipitation proxy
The minerals hematite and goethite commonly occur in sediments and soils (Kämpf and Schwertmann., 1983; Schwertmann and Murad, 1983; Schwertmann, 1988). Hematite can be derived from several processes, such as ferrihydrite by a dehydration-rearrangement process and thermal dehydration from goethite (Jiang et al., 2012), whereas goethite mainly forms directly from any Fe source via solution and accumulates at the expense of hematite and maghemite through the dominance of rainfall-driven processes (Ji et al., 2004; Long et al., 2011; Zhang et al., 2007). Indeed, hematite and goethite formations are favored by opposite climate conditions and their formation processes are competitive (Schwertmann, 1988). Generally, goethite is favored by moist and cold conditions while hematite is favored by warm and dry conditions (Ji et al., 2004; Zhang et al., 2007). The rate of hematite to goethite, therefore, is mainly related to moisture variation in soil, and in turn to rainfall variation (Abrajevitch et al., 2009; Cornell and Schwertmann, 2003; Schwertmann, 1988). Significant correlations between the relative abundance of Hm and Gt and rainfall were observed in some studies (Hyland et al., 2015; Long et al., 2011). For example, the Hm/(Hm + Gt) ratios in a saprolitic ferralsol transect on Hainan Island, South China show a corresponding decrease as the rainfall increases (Long et al., 2011). The literature-derived and measured goethite-hematite (Gt/Hm) ratios of 70 modern soils from global sites reveal a significant positive correlation with the mean annual precipitation, with higher proportions of goethite versus hematite in a wetter state, and vice versa (Hyland et al., 2015). By recovering hematite and goethite from a variety of sediments, for example, marine sediment and Chinese loess (Hao et al., 2009; Ji et al., 2004; Zhang et al., 2007), some scientists used hematite and goethite concentrations, as well as their relative abundances, to reflect the variations in effective precipitation (Abrajevitch et al., 2009; Balsam et al., 2004; Cornell and Schwertmann, 2003; Hao et al., 2009; Harris & Mix, 1999, 2002; Ji et al., 2004; Long et al., 2011; Lyons et al., 2014; Zhang et al., 2007). For instance, Ji et al. (2004) used DRS to derive the Hm/Gt ratios from two sections in Chinese loess to reconstruct dry/humid patterns over central China during the last glacial–interglacial cycle. Using the Hm/Gt ratios in marine sediment from South China Sea, Zhang et al. (2007) produced the long-term variations in Asian monsoonal rainfall during the past 600 kyr. They suggested that the Hm/Gt ratio can be a reasonable precipitation proxy (Ji et al., 2004; Zhang et al., 2007).
In Lake TCQH, the process and environment of formation, transportation, and deposition of magnetic minerals appear to be related to rainfall variations. The magnetic property of magnetic minerals in five cores from Lake TCQH reveals great similarities, with relatively higher concentrations in sediments above 103 cm relative to these at the rest section (Figure 2). In addition, all cores, except TCQH-2, have almost the same ranges of κ. This means that the magnetic properties are largely controlled by the input of detrital, and finally by rainfall variations. Tengchong region has very high annual precipitation with a long rainy season. This not only results in a rapid formation of weathering minerals but also a rapid transportation of these weathering products into Lake TCQH. Consequently, in situ produced iron oxides that have been balanced with the climate in the Tengchong region are rapidly delivered to Lake TCQH. Therefore, the rainfall signal is well preserved in the Hm/Gt record.
Centennial-scales humidity variations during the past 1400 years
Over the past 1400 years, the Hm/Gt ratios suggest that two extremely dry periods at TCQH Lake occurred from AD 1065 to 1200 and from AD 1300 to 1750, corresponding to late-MWP and the LIA, respectively, and a wet period occurred from AD 653 to 1065, corresponding to the early MWP (Figure 6). This implies that the climate was humid and then turned to dry during the MWP and the climate was dry during the LIA in southwestern China. The overall trend of humidity variations in TCQH-4 is consistent with the temperature changes over the past 2000 years in China (Ge et al., 2013) and the Indian monsoon variations recorded by stalagmite δ18O data from Jhumar and Dandak Caves in Central India (Sinha et al.,2011, 2007) (Figure 6), suggesting a warm/wet-cold/dry pattern of climate over the past 1400 years in southwestern China.
Solar radiation was suggested to be one of the main factors influencing climate variation in monsoonal China during the Holocene (Jiang et al., 2017; Perry and Hsu, 2000; Wang et al., 2005). We separate the different components of the Hm/Gt(DRS) ratios using Singular Spectrum Analysis–MultiTaper Method (SSA-MTM). The analyses were performed using the SSA-MTM toolkit freeware (Ghil et al., 2002). Three components were extracted. Significant centennial-scale cycles are clearly observed in PC2 and PC3 (Figure 7), although there are no significant cycles in PC1. Moreover, the variations in PC3 are similar to the variations of sunspot activities index (Solanki et al., 2004). Power spectrum analyses (Schulz and Mudelsee, 2002) of PC2 and PC3 have also revealed significant periodicities of 450 and ~250 years, which are consistent with the periodicity of solar activity (Agnihotri et al., 2002; Masarik et al., 2001; Stuiver and Braziunasm, 1993) (Figure 8). The continuous wavelet power spectrum (Grinsted et al., 2004) also shows these periodicities (Figure 9). We further apply the cross wavelet transform (XWT) and squared wavelet coherence (WTC) between Hm/Gt, PC3, and sunspot. The XWT and WTC results also show an in-phase relationship between Hm/Gt, PC3, and the sunspot index (Figure 9). The 450 and ~250-year periodicities have been recognized in monsoon documents of China during the Holocene (Cosford et al., 2008; Dykoski et al., 2005). This analysis suggests that solar activity had important influences on the regional precipitation in southwestern China during the past 1400 years.

SSA analysis of Hm/Gt ratios and compared with sunspot record (Solanki et al., 2004). (a) Sunspot record. (b) PC3 of the Hm/Gt ratio. (c) PC1 and PC2 of the Hm/Gt ratio.

MTM and power spectrum analysis of Hm/Gt PC2 and PC3 record.

(a, b) The continuous wavelet power spectrum of standardized Hm/Gt, PC3, and sunspot index. (c, d) Cross-wavelet transform of the standardized Hm/Gt, PC3 and sunspot index time series. The relative phase relationship is shown as arrows (with in-phase pointing right, anti-phase pointing left). (e, f) Squared wavelet coherence between the standardized Hm/Gt, PC3 and sunspot index time series. The thick black contour designates the 5% significance lever against red noise and the cone of influence (COI) where edge effects might distort the picture is shown as a lighter shade.
The spatial differences of precipitation in southwestern China
According to our Hm/Gt(DRS) records, the climatic condition was relatively dry during the LIA (Figure 10). Significant regional differences in hydrological conditions were observed across monsoonal China during the LIA (Figure 10). For example, the speleothem record from Wanxiang Cave documented a dry LIA in northern China (Zhang et al., 2008), while the sediment from Huguang Maar showed a wet LIA in southern China (Chu et al., 2002; Zeng et al., 2012) (Figure 10). A ‘south flood-north drought’ trend was the commonly spatial pattern of hydroclimatic changes during the LIA in monsoonal eastern China (Qian and Lin, 2005; Zheng et al., 2014). By analyzing the 63-site yearly dry/wet index derived from historical documents, Zheng et al. (2014) found that flood dominated the east of 105°E while drought was dominant its west part during the LIA. They proposed that there also exists an ‘east flood-west drought’ pattern during the LIA in monsoonal eastern China (Zheng et al., 2014). It is worth noting that the ‘east flood-west drought’ can also be observed in the monsoonal southern China during the LIA, with a wet LIA in coastal southern China, with a dry LIA in southwestern China (Chen et al., 2019; Chen et al., 2015), although some lakes sediments including Xingyun Lake (Chen et al., 2014), Erhai Lake (Xu et al., 2014, 2015), and Lugu Lake (Sheng et al., 2015) in southwestern China displayed a wet LIA. Obviously, the dry LIA deduced from our Hm/Gt(DRS) record is consistent with the east–west mode. On centennial timescale, therefore, we proposed the possibility of a relatively dry condition in southwestern China during the LIA.
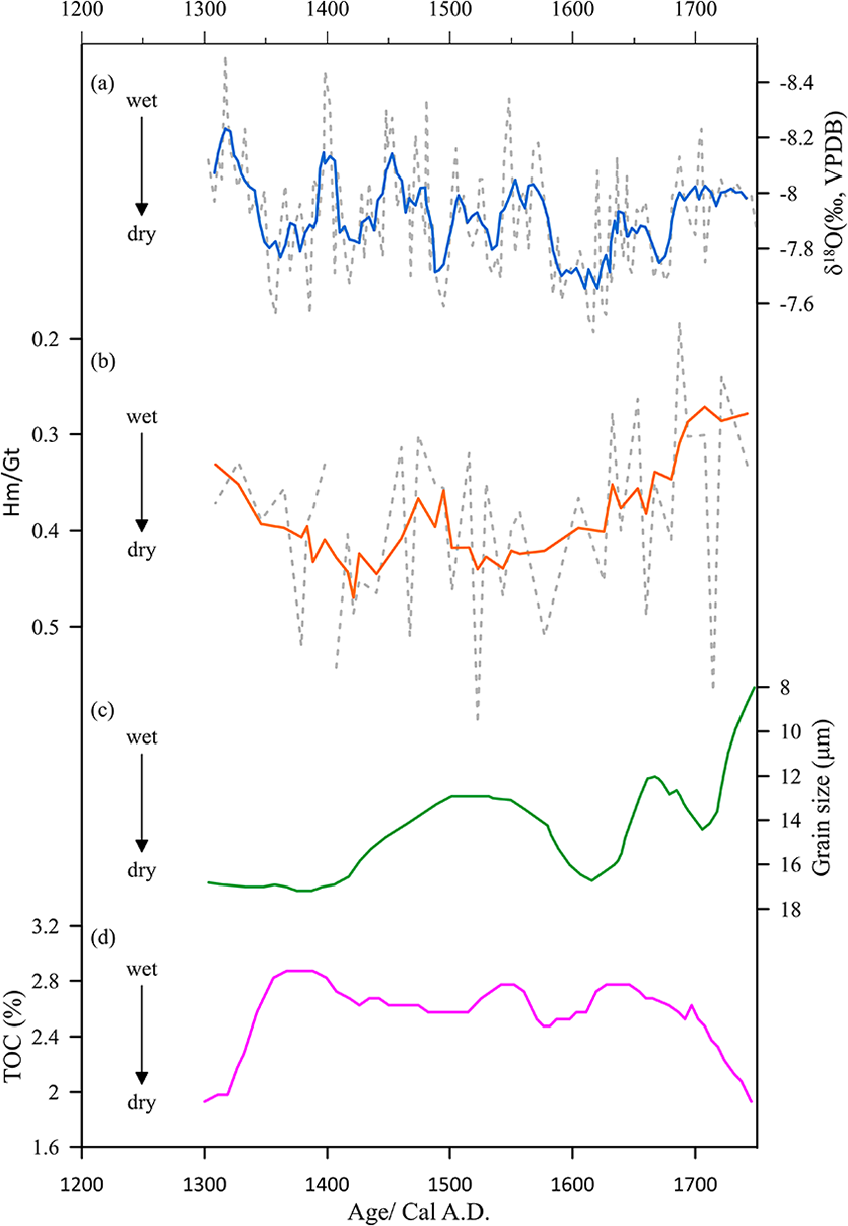
The Tengchongqinghai Lake humidity record compared with other records. (a) The stalagmite δ18O record of Wanxiang Cave (Zhang et al., 2008). (b) Hm/Gt from this study. (c) The grain size record of Lugu Lake (Sheng et al., 2015). (d) TOC record of Huguangyan maar Lake (Chu et al., 2002).
The asynchronous variations in humidity in monsoonal southern China are unlikely to be caused by the anti-phase relationship of southeast and southwest monsoons (Hong et al., 2005), because speleothem δ18O records from monsoonal China and India documented weak summer monsoon intensity during the LIA (Sinha et al., 2011; Zhang et al., 2008). Numerous studies suggested that the ‘south flood-north drought’ trend in monsoonal eastern China was caused by the changes in the timing and duration of the EASM intraseasonal stages (i.e. spring, pre-Meiyu, Meiyu, and midsummer), and in turn were controlled by the south–north transition of the Westerly jet relative to the Tibetan Plateau (Hsu and Lin 2007; Hsu and Liu 2003; Chiang et al., 2017; Zhang et al., 2018). The seasonal migration of the maximal westerlies from south of the plateau to the north marked the onset of Meiyu, resulting in enhanced rainfall in the Yangtze River Valley, while the migration of westerlies away from the northern edge of the plateau marked the end of Meiyu (Chiang et al., 2017; Zhang et al., 2018). Then persistent rainfall would occur in northeastern China and southeastern China (Chiang et al., 2017). The relatively strong westerly jet was observed during the LIA (An et al., 2012; Mayewski et al., 1997). It would delay the seasonally northward shift of the westerly jet, and in turn delay the onset of Meiyu (Chiang et al., 2015), which would reduce rainfall in northern China, but enhance rainfall in central and southern China during the LIA (Tan et al., 2011). Moreover, during the cold phase, the strong westerly jet dominates the moisture transport of the whole Tibetan Plateau, resulting in reduced rainfall in the westerlies-dominated area and the Indian monsoon region (Zhang et al., 2017). The inverse humidity conditions recorded in our Hm/Gt (DRS) record and other lake sediments in southwestern China might have been caused by the complexity of the topography (e.g. plateau, and mountain) and the atmospheric circulation here.
Conclusion
The Hm/Gt deduced from TCQH Lake sediments in Southeast China was used to reconstructed precipitation variations in Tengchong for the past 1400 years. The combined Hm/Gt record suggests that the dry periods at TCQH Lake occurred from AD 1065 to 1200 and from AD 1350 to 1750, and the wet period was from AD 953 to 1065, during the past 1400 years. This shows that the MWP was wet and then became dry and the LIA was dry in Tengchong. Hm/Gt varied synchronously with the Chinese temperature reconstructed from the historical documents and sunspot activity index over the past 1400 years. The multiple periodicity analysis displayed significant ~450 and ~250-year cycles, suggesting that solar activity mainly controls precipitation changes in southwestern China. However, the humidity variations determined from Hm/Gt(DRS) in this study contradicts these in other regions of China, which have a more complex precipitation pattern that is influenced by the strength of westerly jet in addition to the Asian monsoon. The solar activity and strong westerly jet may have an important influence on regional precipitation in southwestern China during the LIA.
Supplemental Material
Data_set_for_T.W._Zhang – Supplemental material for Humidity variations spanning the ‘Little Ice Age’ from an upland lake in southwestern China
Supplemental material, Data_set_for_T.W._Zhang for Humidity variations spanning the ‘Little Ice Age’ from an upland lake in southwestern China by Tingwei Zhang, Xiaoqiang Yang, Qiong Chen, Jaime L Toney, Qixian Zhou and Huahong Gao in The Holocene
Footnotes
Acknowledgements
The authors thank Fabienne Marret and two anonymous reviewers for their helpful and constructive reviews of the manuscript. Thanks are also due to Tingting Tao for sample collection. See supporting information for details of the data used in this study. The other data used are from the cited references.
Funding
The author(s) received no financial support for the research, authorship, and/or publication of this article: This work is financially supported by the projects of NSFC (41672162, 41872217), the Natural Science Foundation of Guangdong Province (2018B030311064) and Guangdong Province Introduced Innovative R&D Team of Geological Processes and Natural Disasters around the South China Sea (Grant No. 2016ZT06N331).

Supplemental material
Supplemental material for this article is available online.
References
Supplementary Material
Please find the following supplemental material available below.
For Open Access articles published under a Creative Commons License, all supplemental material carries the same license as the article it is associated with.
For non-Open Access articles published, all supplemental material carries a non-exclusive license, and permission requests for re-use of supplemental material or any part of supplemental material shall be sent directly to the copyright owner as specified in the copyright notice associated with the article.
