



Abstract
The eastern China summer precipitation is related to the Pacific Decadal Oscillation (PDO) on interdecadal time scales in modern times, but it remains unclear whether such a relationship holds prior to the instrumental period. We examine this relationship during the Medieval Climate Anomaly (MCA) and Little Ice Age (LIA). According to a composite analysis using simulations of the HadCM3 model, which is selected from nine available climate models, the PDO–eastern China summer precipitation relationship varies with climatic background. The modern relationship features deficient precipitation over North and South China and excessive precipitation in the Yangtze–Huai River Valley in positive PDO phases compared with negative phases. In contrast, there is more precipitation over South and North China but less in the Yangtze–Huai River Valley during the MCA and widespread below-normal summer precipitation over eastern China during the LIA. Such different PDO-related precipitation patterns between the MCA and LIA are closely linked to distinct changes in local atmospheric circulation. Compared with negative PDO phases, positive phases during the MCA show an anomalous Pacific–Japan/East Asia–Pacific pattern over East Asia and strengthened high-level westerlies centering on 120°E and 25–30°N, which lead to the triple pattern in the precipitation anomaly. During the LIA, a cyclonic anomaly occurs over the South China Sea–Philippine Sea in the lower and middle troposphere, and two upper-level low trough anomalies occur over East Asia, causing the anomalous precipitation deficit. The different PDO-related local circulations are found to be relevant to the thermodynamic effect of low-latitude sea surface temperature and summer precipitation over India, as well as the propagation of upstream wave trains.
Keywords
Introduction
Interdecadal climate variation is a hot topic in climate change studies and has attracted increasing attention in recent decades because it modulates the global warming process (e.g. Franzke, 2014; Nitta and Yoshimura, 1993) and affects interannual variability, such as the well-known El Niño–Southern Oscillation (ENSO) (e.g. Chang et al., 2001; Wu and Mao, 2016a). The dominant modes of interdecadal variation are always found in mid-latitude oceans (Goddard et al., 2012), such as the Pacific Decadal Oscillation (PDO) in the North Pacific (Mantua et al., 1997). In the positive PDO phase, negative sea surface temperature anomalies (SSTAs) occur in the central and western North Pacific, and positive horseshoe-like SSTAs distribute along the west coast of North America. The PDO is thought to be closely related to the interdecadal variations of ocean ecology and fishery production (e.g. Mantua and Hare, 2002; Miller et al., 2004) and climate in North America, India, and East Asia (e.g. DeFlorio et al., 2013; Krishnamurthy and Krishnamurthy, 2013; Qian and Zhou, 2014; Zhu and Yang, 2003).
It is well documented that two striking interdecadal shifts have occurred in the eastern China summer precipitation in recent decades. After the late 1970s, summer precipitation decreased over the Yangtze–Huai River Valley but increased over North China (e.g. Qian and Qin, 2008; Wang, 2001; Zhou and Huang, 2003); in the 1990s, the pattern was reversed (e.g. Ding et al., 2008; Huang et al., 2013; Liu et al., 2011; Zhu et al., 2011). Such changes are accompanied by simultaneous phase switches of the PDO, and earlier studies demonstrated a close relationship between them. More specifically, Ma (2007) argued that the dry conditions over North China since the late 1970s were potentially related to the colder North Pacific in the positive PDO phase. Furthermore, it was found that this relationship could be established through a PDO-related Pacific–Japan (PJ)/East Asia–Pacific (EAP) pattern (Qian and Zhou, 2014). For the shift in the 1990s, precipitation changes over North China and the Yangtze–Huai River Valley seem to be linked to the PDO through a warming over Lake Baikal and a weakened westerly jet (Zhu et al., 2011, 2015). Moreover, Wu and Mao (2016b) reported that the PDO might also be responsible for the decadal change of summer precipitation over South China.
The PDO displays quasi-20-year and quasi-50-year cycles (Minobe, 1997, 1999), but the instrumental data are so short that they limit a thorough understanding. Therefore, it is necessary to examine the behavior of the PDO and the associated eastern China summer precipitation changes on longer time scales. Note that the PDO index can be extended back to hundreds of years ago via reconstructions, and this provides us with an opportunity to examine the issue. However, the reconstructed PDO indices created using tree rings or dry/wet indices in North America and Asia exhibit large uncertainties (e.g. Biondi et al., 2001; D’Arrigo et al., 2001; D’Arrigo and Wilson, 2006; MacDonald and Roslyn, 2005; Shen et al., 2006). The indices are generally consistent with each other and with the observed index during the calibration period but show little correlation in phases and regime shifts prior to that period (Landrum et al., 2013; McAfee, 2014; Wise, 2015). In recent decades, the climate model has become a powerful tool for addressing climatic changes and underlying mechanisms. A range of models have been used to conduct the last millennium simulations under the Palaeoclimate Modelling Intercomparison Project Phase 3 (PMIP3; Braconnot et al., 2012) framework. These simulations have exhibited reasonable skills in modeling climate change (PAGES 2K Consortium, 2015; Parsons et al., 2017) and PDO features (Fleming and Anchukaitis, 2016) during the last millennium. Therefore, the simulations offer an independent source for investigating the PDO and related eastern China summer precipitation prior to the instrumental period.
In this work, we first evaluate the skill of the PMIP3 models in reproducing the PDO features and PDO-related summer precipitation changes over eastern China during the instrumental period when the simulations overlap the observations. A suitable model is then selected for further analysis using the last millennium simulation. The Medieval Climate Anomaly (MCA, 950–1250) and Little Ice Age (LIA, 1450–1850) are two typical periods over the last millennium and differ in climatic backgrounds. According to both reconstructions and simulations, the MCA (LIA) is relatively warm (cold) and featured by La Niña–like (El Niño–like) conditions in the tropical Pacific (e.g. Adams et al., 2003; Cobb et al., 2003; Mann et al., 2005, 2009). Such differences arise from the effect of external forcings, which are moderate during the MCA but exhibit active volcanic eruptions and several insolation minima during the LIA (Crowley, 2000; Phipps et al., 2013; Schurer et al., 2013). Such two periods provide a good opportunity to discuss the long-term behavior of the PDO and PDO–eastern China summer precipitation relationship under different climatic backgrounds.
Data and method
Model and observational data
The study uses nine models that were included in the PMIP3 project (supplementary Table S1, available online); these models have been used to perform both historical and last millennium experiments. The historical experiment covers the period of 1850–2005 and is forced by time-varying atmospheric constituents due to anthropogenic and volcanic influences, solar radiation, land use, and concentrations of short-lived species of natural and anthropogenic aerosols (Taylor et al., 2012). For the last millennium (850–1850) experiment, the external forcing includes changes of volcanic aerosols, solar radiation related to orbital parameters and solar output, atmospheric greenhouse gas (GHG) concentrations, and land use (Schmidt et al., 2011).
The historical simulations are used in model evaluation, and the HadCM3 model is selected for analysis using the last millennium simulation. HadCM3 is run on a horizontal resolution of 3.75° × 2.46° for the atmospheric component and 1.25° × 1.25° for the oceanic component. This model has been widely used in the simulation of the last millennium climate and exhibits good skill in reproducing the reconstructed temperature evolution (Schurer et al., 2014). Details of the last millennium simulation of the model are described in Schurer et al. (2014) and references therein.
The observed sea surface temperature (SST) data are obtained from the National Oceanic and Atmospheric Administration (NOAA) monthly Extended Reconstructed SST version 5 (ERSST v5; Huang et al., 2017) dataset for 1900–2016, the horizontal resolution of which is 2° × 2°. The observed monthly land precipitation data are taken from two datasets, the Climatic Research Unit time series version 4.01 (CRU TS v4.01; Harris et al., 2013) dataset of the Hadley Center from 1901–2016 and the Global Precipitation Climatology Center version 7 (GPCC v7; Schneider et al., 2017) dataset of the National Center for Atmospheric Research (NCAR) from 1901–2013, which are both on a grid with a horizontal resolution of 0.5° latitude × 0.5° longitude. Note that the time ranges of the historical experiment (1850–2005) and observations (1900–2010s) are not completely overlapped, so we choose the common time period 1900–2005 for comparison, and it is called the instrumental or historical period hereafter. Because some models use the rotated pole grid in the ocean component, we interpolate the SST data into a 0.5° × 0.5° grid for calculation, and other data (precipitation, wind speed, sea surface pressure, and geopotential height) are also interpolated for uniformity.
Method
The PDO is defined as the leading empirical orthogonal function (EOF) mode of the North Pacific monthly residual SSTAs over 20°N–60°N and 120°E–100°W (Mantua et al., 1997). The residual SSTAs are obtained by first removing the climatological annual cycle from the original time series and subsequently subtracting the global-mean SSTAs from the local SSTAs, as in previous studies (Fleming and Anchukaitis, 2016; Zhang et al., 1997). Correspondingly, the PDO index is the first principal component (PC1) time series of the leading EOF. In this work, the index is averaged by an 11-year moving average filter to highlight the decadal changes. We normalize the PDO index utilizing its standard deviation, and the leading EOF is scaled by multiplying the corresponding value.
The PDO-related climatic element fields are represented by a composite analysis as the averages of corresponding variables for positive PDO phases minus those for the negative ones. Positive (negative) PDO phases are defined when the PDO index is greater than 0.5 (less than −0.5) standard deviation of the index (Fuentes-Franco et al., 2016; Kayano and Andreoli, 2007). The significance of the composite difference is evaluated using the standard Student’s t-test. To reveal the propagation of the stationary Rossby wave train, we calculate the horizontal wave activity flux using the following equation given by Plumb (1985):

where F s is the horizontal Plumb wave activity flux, p = pressure/1000 hPa, ψ' is a perturbation quantity of the stream function, and a, ϕ, and λ denote the Earth’s radius, latitude, and longitude, respectively.
Evaluation of models
We evaluate the capability of the PMIP3 models in simulating the features of the observed PDO and its relationship with the eastern China summer precipitation using the historical simulation. The spatial pattern of the observed PDO (18% explained variance) is characterized by cold SSTAs in the central and western North Pacific and warm SSTAs along the west coast of North America for the positive PDO phase (Figure 1a). This pattern is well replicated in the historical simulations. The correlation coefficients between the observation and models range from 0.68 to 0.90 (statistically significant at the 99% confidence level), and except for CCSM4, the explained variances in the models (16% to 23%) are also comparable to that in the observation (supplementary Figure S1, available online). A slight difference is that the negative SSTA center is located over the central North Pacific in the observation but relatively westward in the simulations, and this seems to be a common phenomenon in climate models (Henley et al., 2017; Wei et al., 2018; Yim et al., 2015).
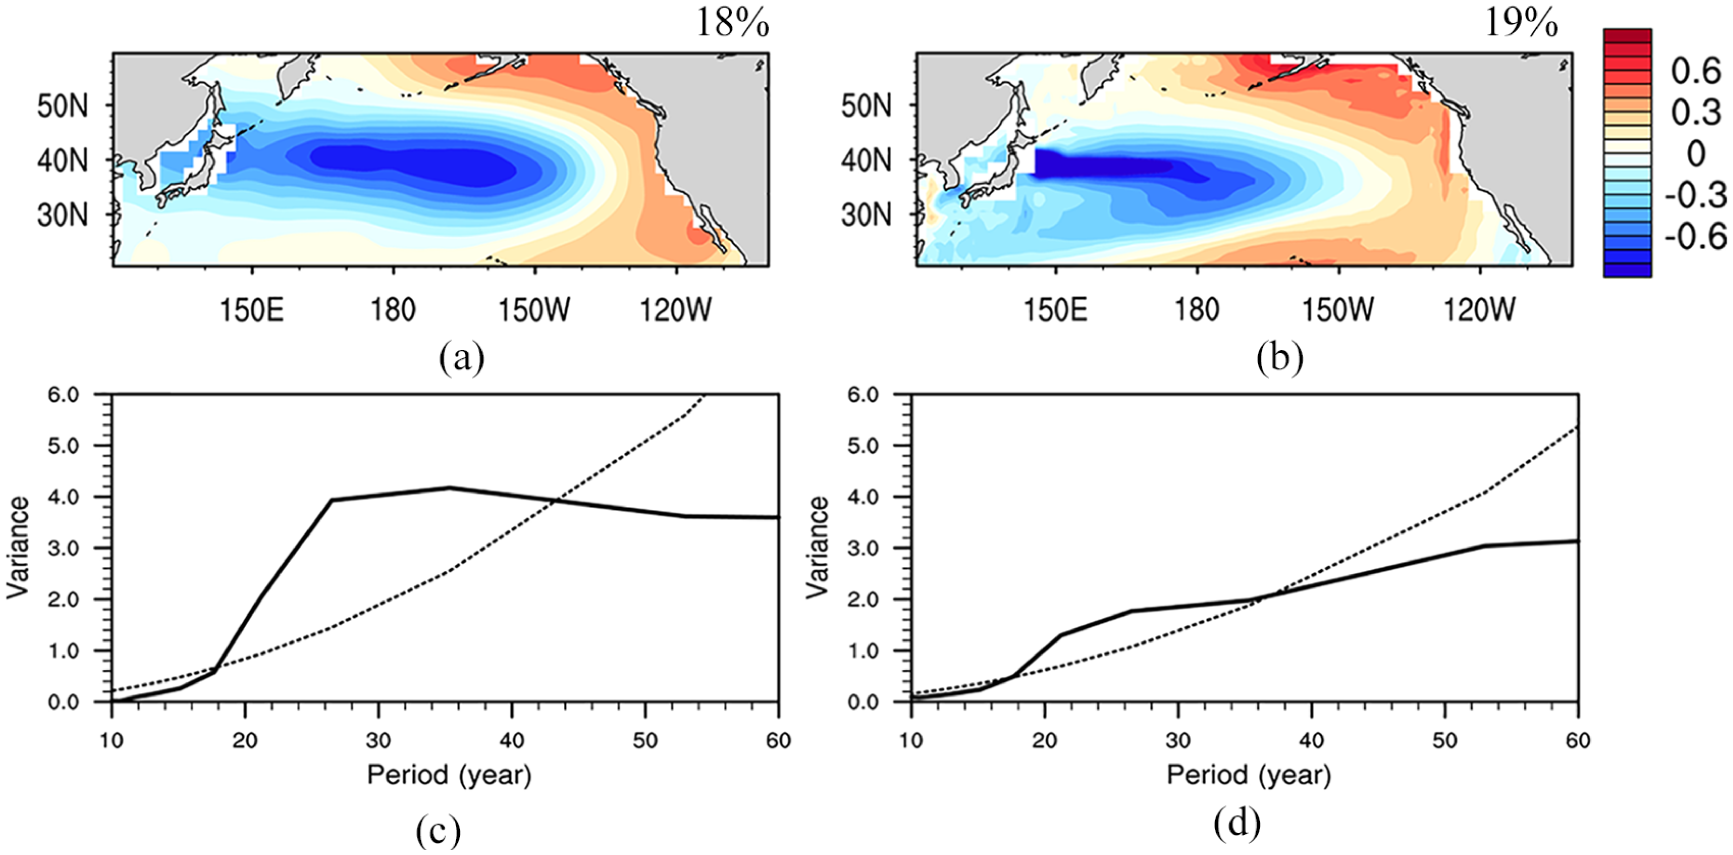
Spatial patterns of the PDO and power spectrums of the PDO index in observation (a and c, ERSST) and HadCM3 (b and d). The explained variance is given at the top right of panels (a) and (b). In panels (c) and (d), solid lines represent the spectrum of the PDO indices, and dashed lines represent the 90% red noise confidence level.
The spectral feature of the observed PDO index is detected using the power spectrum method, which has been widely applied in estimating the periodicity of the ENSO, PDO, and other periodic oscillations (e.g. Deser et al., 2010; Oshima and Tanimoto, 2009). The power spectrum shows that the dominant periodicity of the observed PDO lies in the 20- to 40-year time scales (Figure 1c). In simulations, although the spectral peak differs, most models also display obvious periodicities of approximately 20 to 40 years (supplementary Figure S2, available online). Note that the observed PDO index shows that the PDO phase shifts from negative to positive near 1900, 1925, and 1976, and the opposite shifts occur near 1911, 1945, and 2000, whereas the models only present random phases with no consistency in specific shift timing. This might indicate that the PDO is the representation of natural internal variability (Newman et al., 2016; Wei et al., 2018).
The PDO–eastern China summer precipitation relationship is represented by the composite positive-minus-negative PDO difference of the eastern China summer precipitation. The composite precipitation anomaly characterizes a meridional triple pattern in the observations (CRU and GPCC dataset), that is, more precipitation in the Yangtze–Huai River Valley against less precipitation over North and South China (Figure 2a and b), which is coincident with the pattern derived from other datasets (Qian and Zhou, 2014; Wei et al., 2018). Most models fail to describe this pattern and exhibit no significant spatial correlations with the observation, except for the HadCM3 model, which shows a spatial correlation coefficient of 0.45 (0.32) with the CRU (GPCC) dataset, significant at the 99% confidence level (supplementary Figure S3, available online).
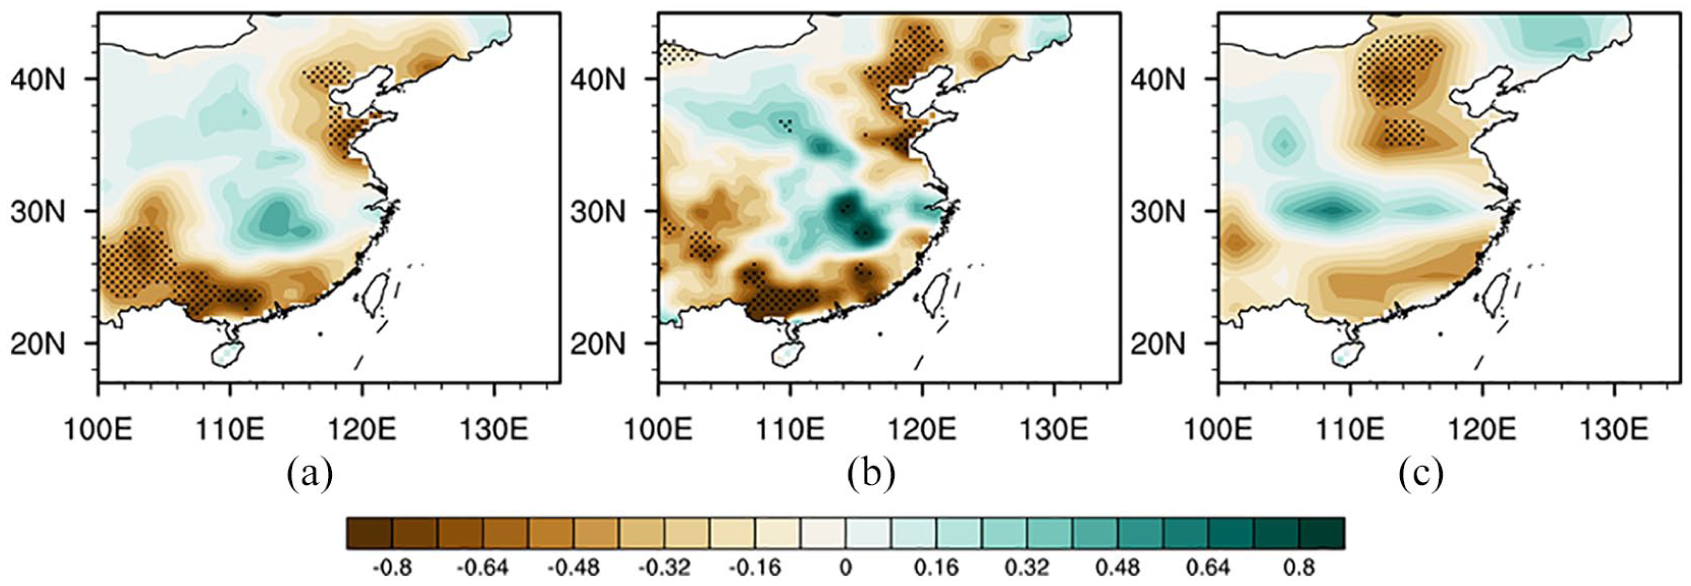
Composite positive-minus-negative PDO differences of precipitation (mm day−1) over eastern China in observations (a, CRU and b, GPCC) and HadCM3 (c). The dots indicate areas with statistically significant anomalies at the 90% confidence level.
Altogether, most models are able to reproduce the observed spatial and spectral characteristics of the PDO, and HadCM3 is the only model that both simulates the PDO features (Figure 1) and captures the observed change of PDO-related summer precipitation over eastern China (Figure 2). Therefore, HadCM3 is selected for analysis of the PDO and its relationship with the eastern China summer precipitation during the MCA and LIA.
Results
Features of PDO and its relationship with eastern China summer precipitation during the MCA and LIA
Figure 3 displays the PDO features during the MCA and LIA as simulated by HadCM3. Spatially, the PDO patterns during the MCA and LIA bear a strong resemblance to that during the historical period, with cooling over the central and western North Pacific and horseshoe-like warming in the eastern North Pacific (Figure 3a and b). Such a pattern explains 17% of the total variance during the MCA and 16% during the LIA. In terms of the time dimension, the power spectrum of the PDO indices shows notable interdecadal peaks. The significant cycles are located at 25 and 40 years during the LIA, comparable to the periodicity in the historical simulation, and they are slightly shorter than the 30- and 60-year cycles during the MCA (Figure 3c and d). Moreover, the interdecadal peaks are more prominent during the MCA and LIA compared with the historical period, especially the 40-year cycle during the LIA. To sum up, spatially, there is little difference for the PDO pattern among the MCA, LIA, and historical period; for the spectral aspect, the PDO presents multi-decadal cycles in all the three periods, although the detailed intensity and periodicity are distinct.
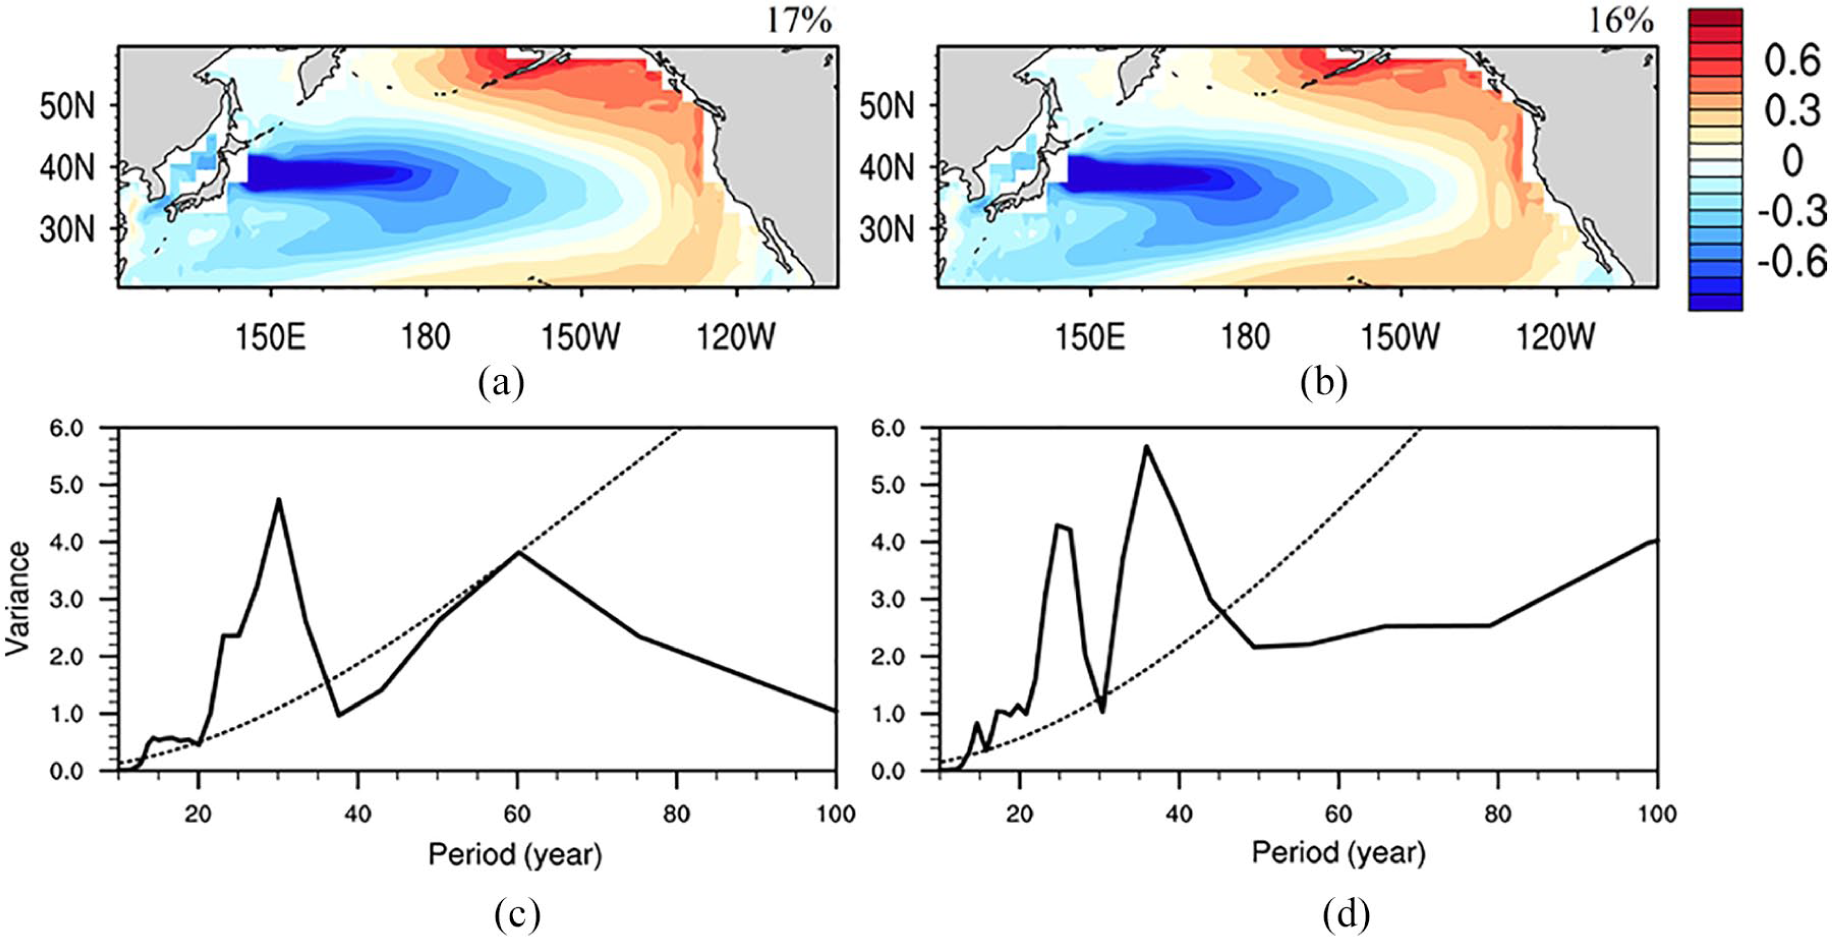
Spatial patterns of the PDO and power spectrums of the PDO index in HadCM3 during the (a and c) MCA and (b and d) LIA. The explained variance is given at the top right of panels (a) and (b). In panels (c) and (d), solid lines represent the spectrum of the PDO indices, and dashed lines represent the 90% red noise confidence level.
Furthermore, we use the HadCM3 model, which can reproduce the pluvial condition during the MCA and deficient precipitation during the LIA (not shown) documented in proxy records (Zhang et al., 2008; Zhao et al., 2015), to examine the PDO–eastern China summer precipitation relationship. Compared with the negative PDO phase, the positive PDO phase is characterized by a meridional triple structure of the precipitation anomaly during the MCA, namely, excessive precipitation over South and North China and a deficit over the Yangtze–Huai River Valley (Figure 4a). During the LIA, the significant negative precipitation anomaly is widespread from South to North China (Figure 4b). The composite precipitation changes are different among the MCA, LIA, and historical periods, although little change occurs in the PDO properties. This indicates an unstable relationship between the PDO and the eastern China summer precipitation. Except for eastern China, the distinct patterns of PDO-related precipitation also occur in the surrounding land and sea. For the positive PDO phase, there is less precipitation over South China Sea during the MCA but more during the LIA; in India, the precipitation significantly decreases during the LIA, while its change is insignificant during the MCA.
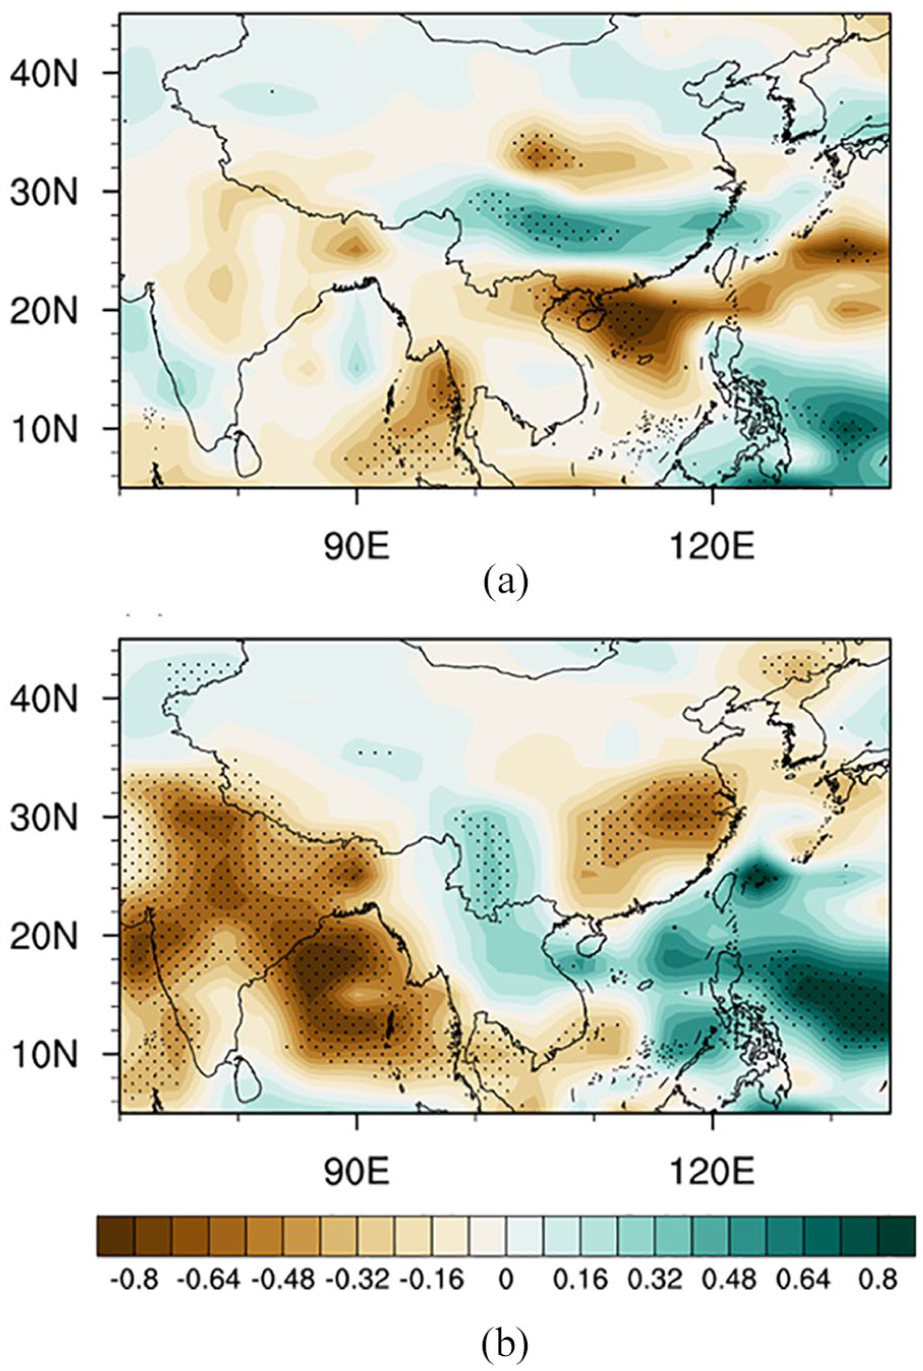
Composite positive-minus-negative PDO differences of precipitation (mm day−1) over eastern China and surroundings in HadCM3 during the (a) MCA and (b) LIA. The dots indicate areas with statistically significant anomalies at the 90% confidence level.
Mechanisms of the unstable relationship during the MCA and LIA
Local circulation
Figures 5 and 6 show the composite positive-minus-negative PDO differences of atmospheric circulation that are directly associated with precipitation changes over China. During the MCA, key features for the lower to middle troposphere include anticyclonic, cyclonic, and anticyclonic anomalies over the east of Taiwan, Korean Peninsula to North China, and the north of Northeast China, respectively (Figure 5a and b). Climatologically, the eastern China and neighboring sea are dominated by southerlies of the summer monsoon that bring moisture inland. The anticyclonic anomaly over the east of Taiwan indicates a southwestward extension of the western Pacific subtropical high (WPSH), which facilitates the southerlies and related moisture delivery to South China along the western flank of the WPSH. To the north of the anticyclonic anomaly, the cyclonic anomaly benefits more precipitation over North China. In the upper level, there is an anticyclonic anomaly over Lake Baikal and a cyclonic anomaly centering over Shandong Province (Figure 5c), and the latter is zonally elongated and leads to easterly anomalies to the north and westerly anomalies to the south of approximately 35°N (Figure 5e). Strengthened westerlies are centered crossing 120°E along 25–30°N and favor high-level zonal divergence and consequent ascending anomalies (Figure 5d). This vertical configuration is conducive to precipitation in South China but suppresses precipitation in the Yangtze–Huai River Valley. Taken together, the two upper-level circulation anomalies (Figure 5c) are discerned in the mid–low levels as cyclonic anomaly in Korean Peninsula to North China and anticyclonic anomaly in the north of Northeast China (Figure 5a and b), indicating an equivalent barotropic vertical structure. However, the upper level features no counterpart to the low-level anticyclonic anomaly over the east of Taiwan, which means the vertical structure is baroclinic. The above configuration of circulation anomalies, namely a baroclinic structure in the subtropics and barotropy in the extra-tropics, characterizes the PJ/EAP teleconnection pattern (Huang and Sun, 1992; Lu and Lin, 2009; Nitta, 1987).
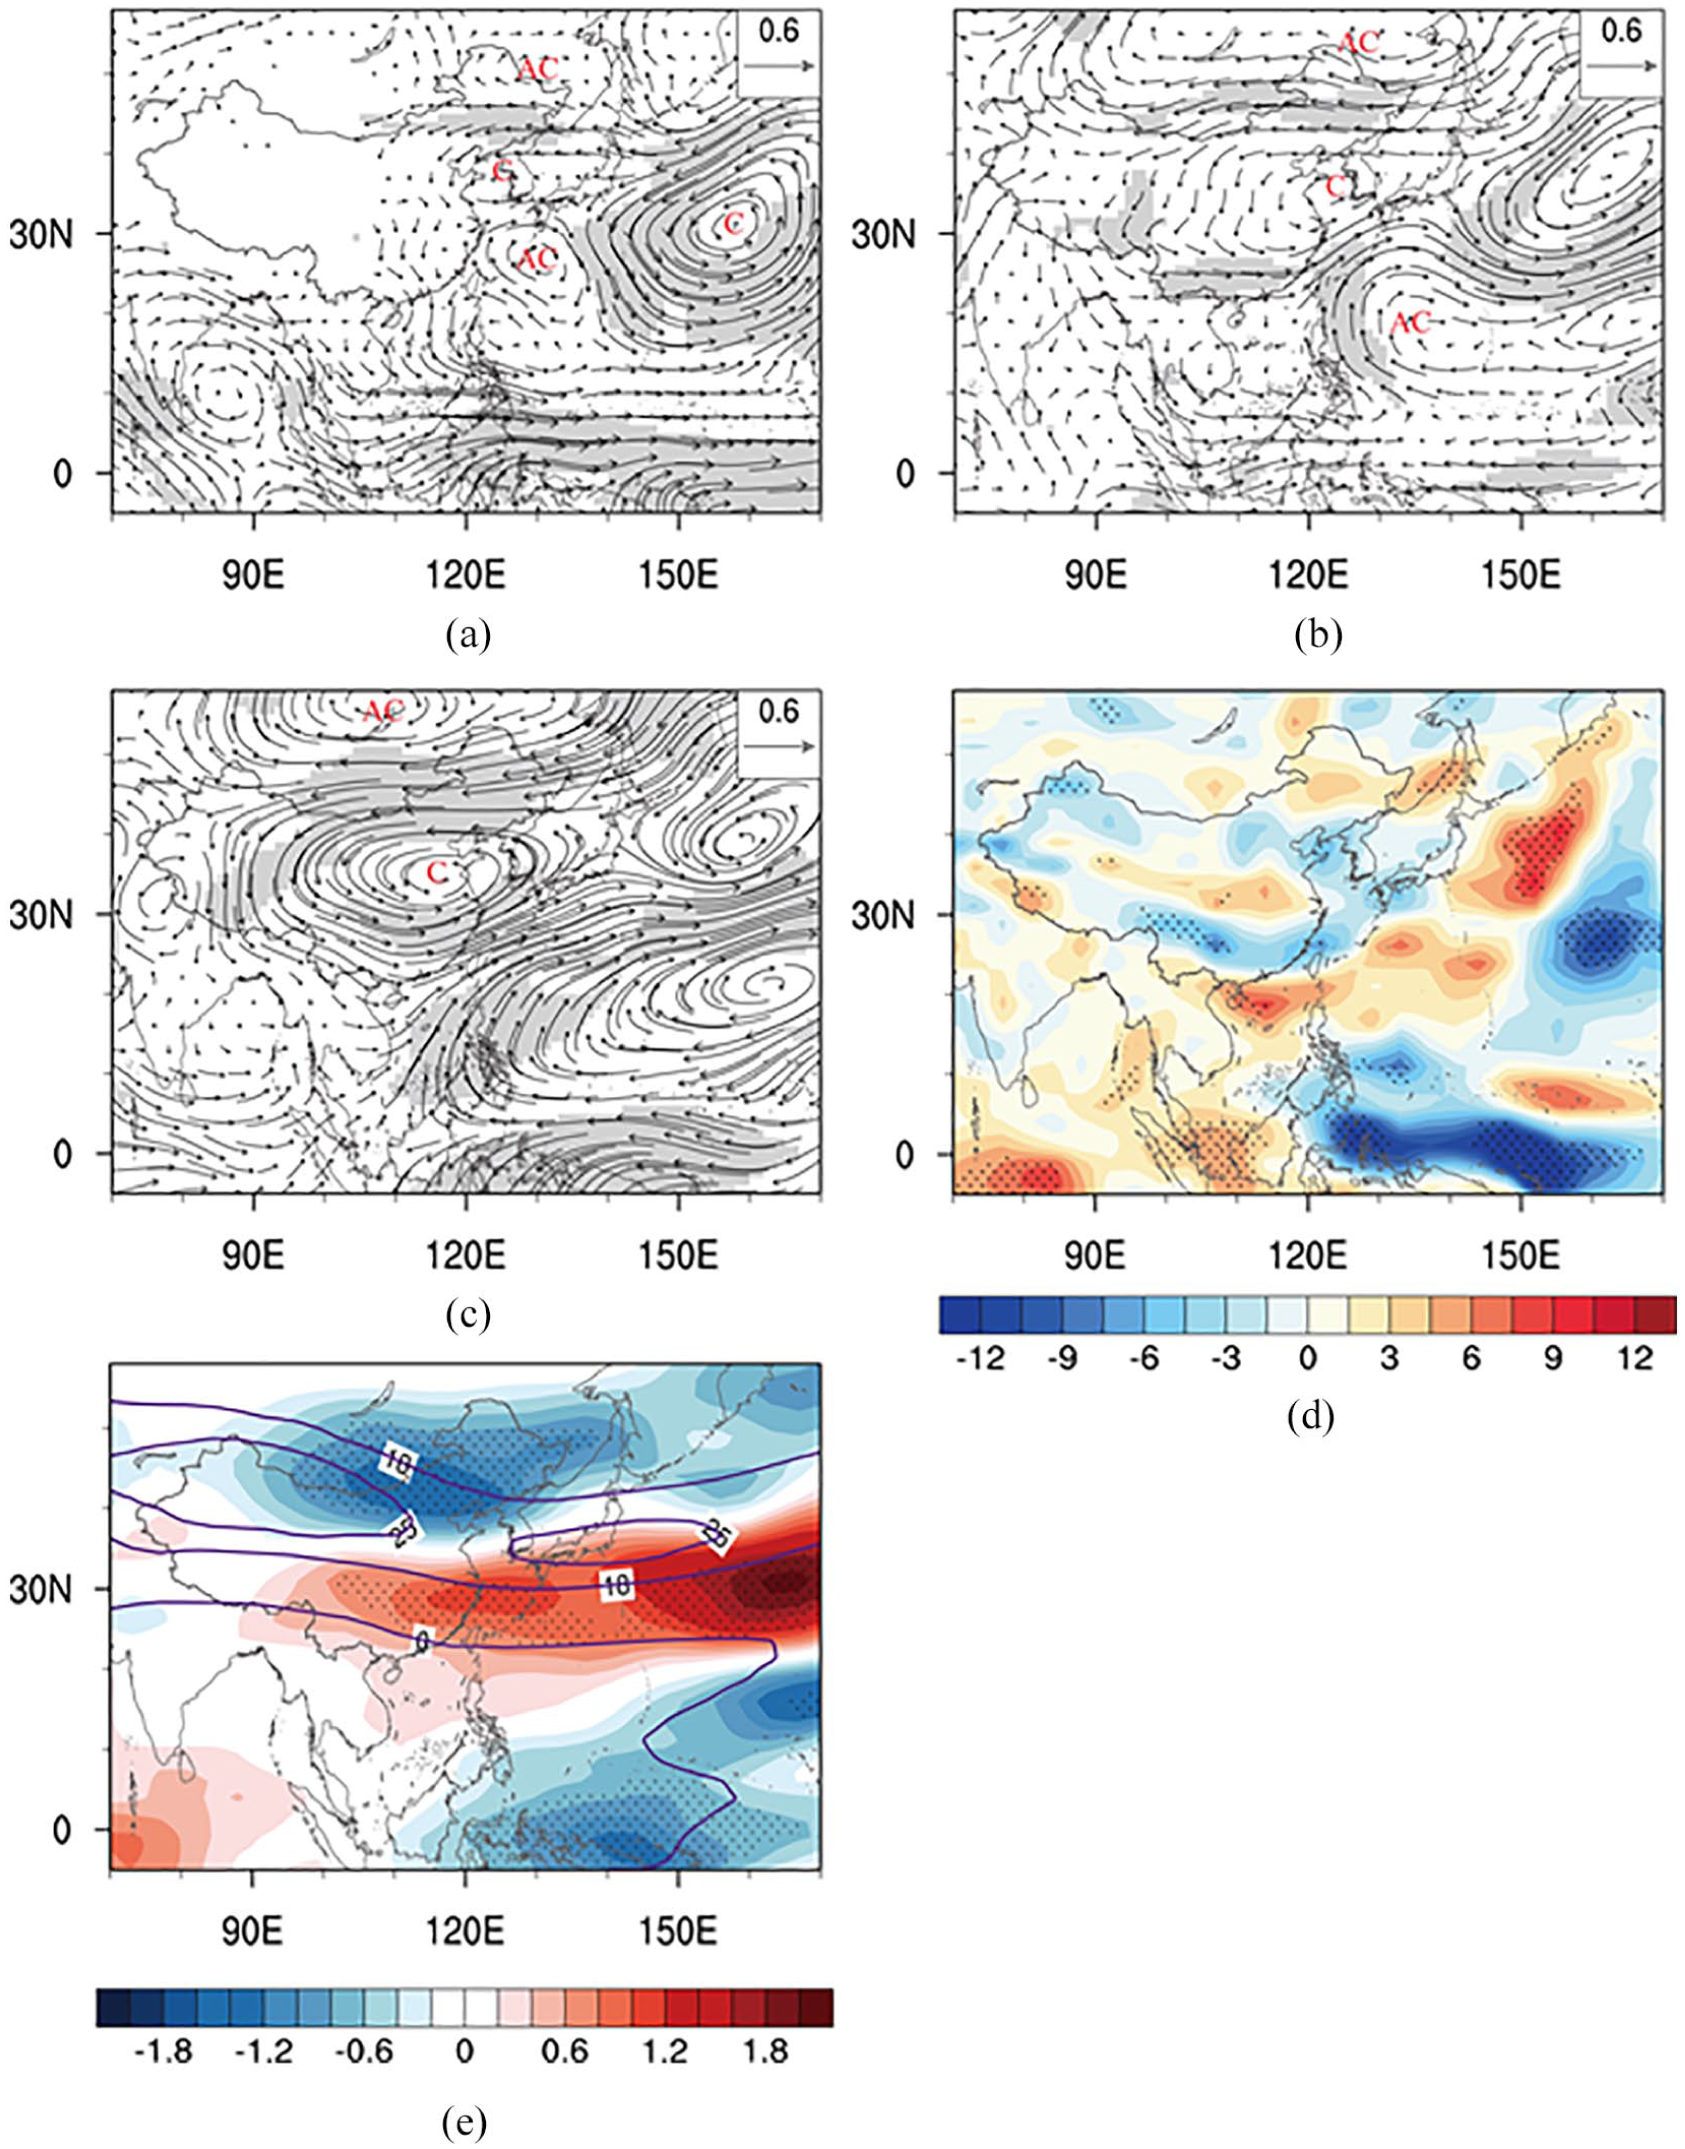
Composite positive-minus-negative PDO differences of horizontal wind (m s−1) at (a) 850 hPa, (b) 500 hPa, (c) 200 hPa, (d) vertical velocity (10−3 Pa s−1) at 500 hPa, and (e) zonal wind (m s−1) at 200 hPa during the MCA. Shadings in panels (a–c) and dots in (d) and (e) indicate areas with statistically significant anomalies at the 90% confidence level. In (a), regions with an elevation above 1500 m are left blank. In a–c, the letters ‘AC’ and ‘C’ denote an anticyclonic and cyclonic anomaly, respectively. In (e), the structure of upper-tropospheric westerly jet and boundary of westerlies at 200 hPa are indicated by the contours of zonal wind equal to 18, 25, and 0 m s−1.
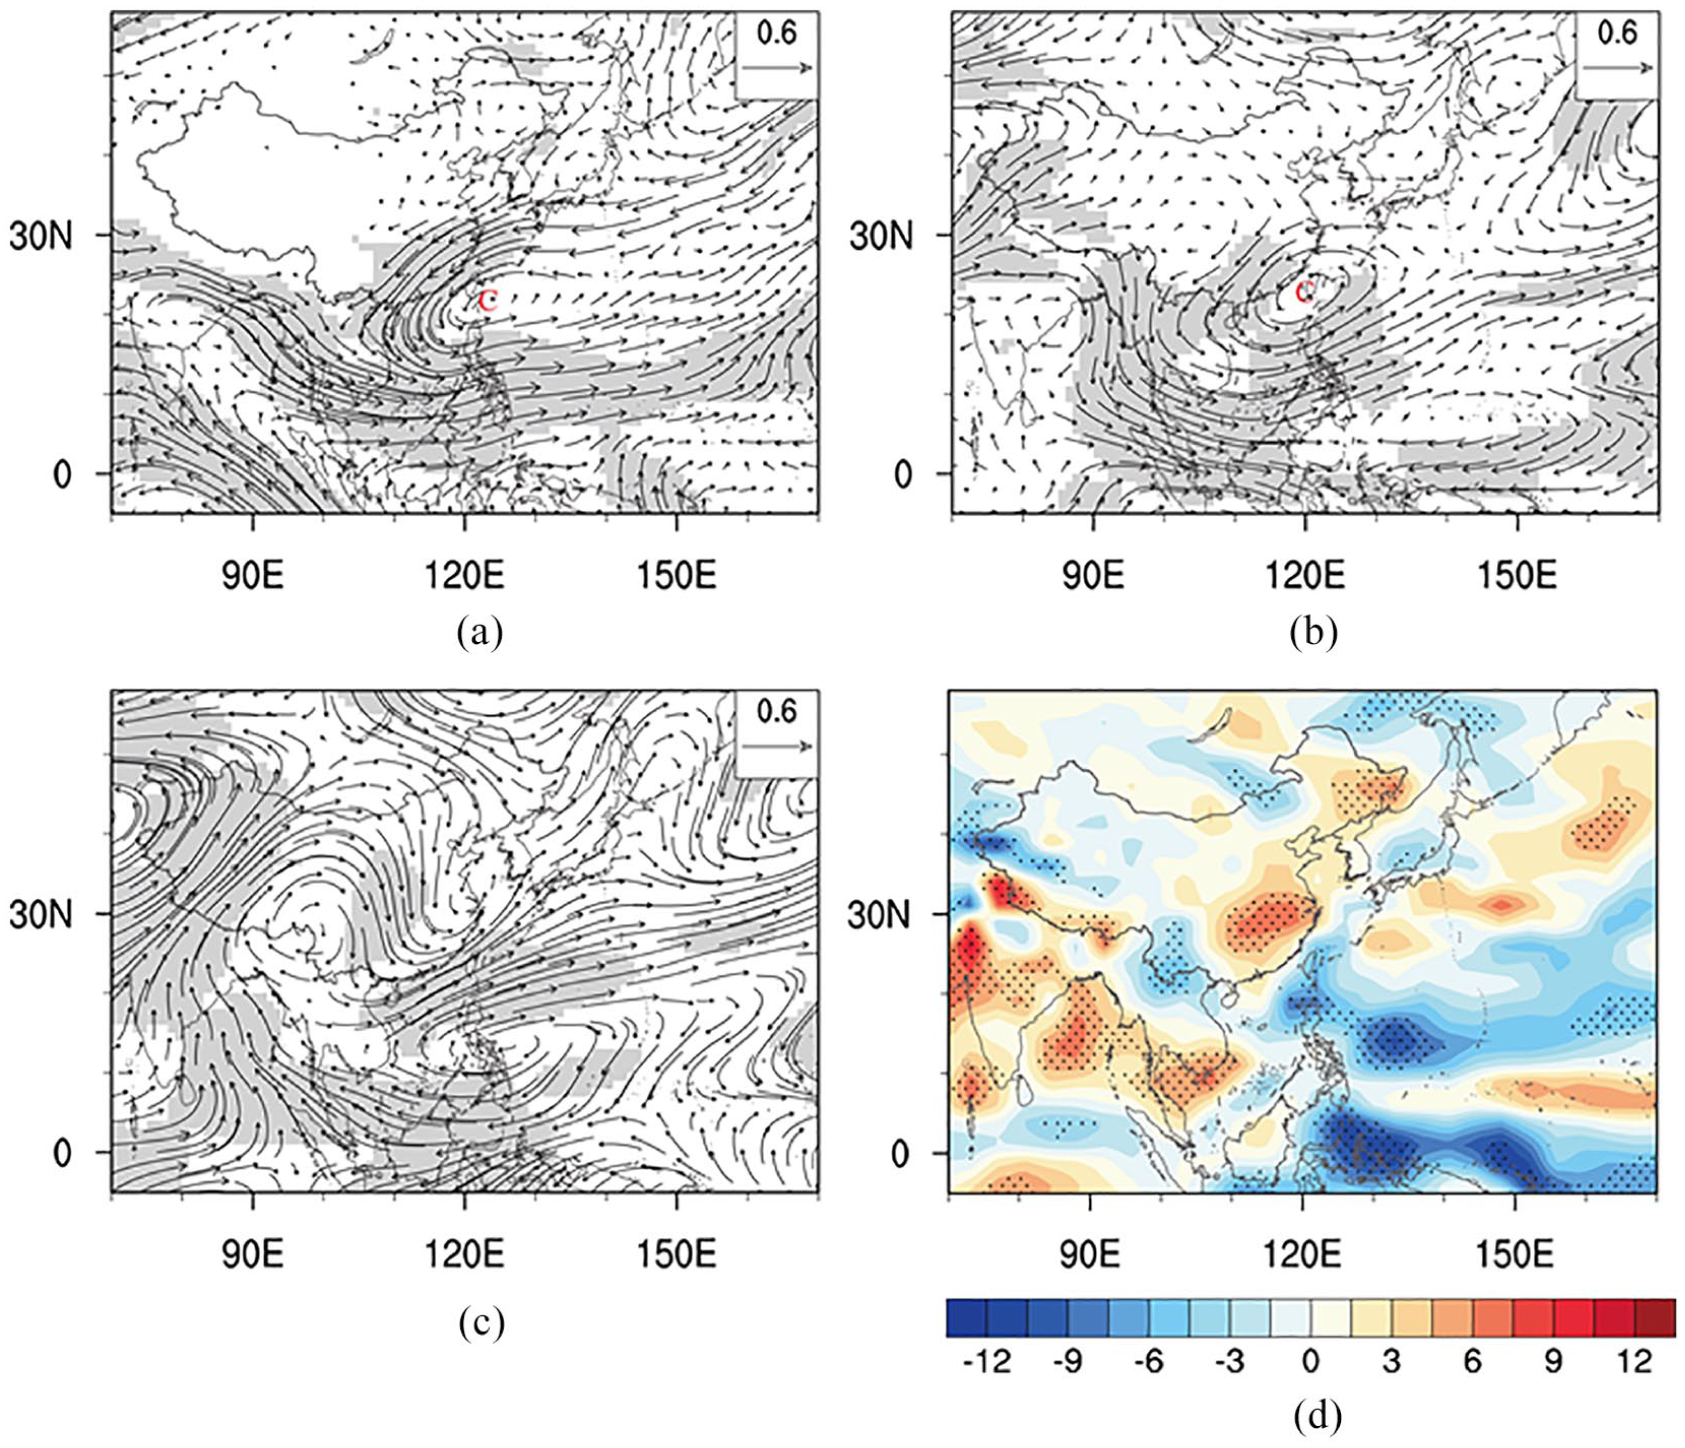
Same as Figure 5a–d, but during the LIA.
During the LIA, the composite changes of local circulation favor a significant cyclonic anomaly over the South China Sea (SCS)–Philippine Sea (around 120°E and 25°N) from the lower to middle troposphere, indicating a weakened WPSH (Figure 6a and b). In the northwest side of the cyclone, the associated northeasterly anomalies reduce the water vapor flowing into eastern China and hence suppress precipitation in that location. In the upper level, two low-pressure trough anomalies occur. One is located to the east of Lake Baikal, and the other locates over the southeastern coast of China (Figure 6c). Under their influence, strong northerly anomalies prevail in the upstream of the troughs and cause anomalous negative temperature and vorticity advections in eastern China, which contribute to the anomalous descending motion (Figure 6d) and the final precipitation deficit.
Possible factors related to local circulation change
Previous studies have found that the PDO-related local circulation over eastern China is often linked to low-latitude SSTAs (Qian and Zhou, 2014; Wu and Mao, 2016b; Yu et al., 2015). Figure 7 shows the composite positive-minus-negative PDO differences of the SST and related outgoing longwave radiation (OLR) during the MCA and LIA. In our study, the composite Pacific SST change during the LIA is stronger than that during the MCA, especially the low-latitude warm SSTAs, which might be partly responsible for the distinct local circulation changes. More specifically, during the MCA, positive PDO phases feature cooling anomalies around Taiwan (Figure 7a), which is accompanied by suppressed convection activities and thus reduced diabatic heating (Figure 7c). This condition could contribute to the formation of the baroclinic anticyclonic anomaly over the east of Taiwan and further the PJ/EAP pattern (Figure 5a) (Nitta, 1987). In the tropical Pacific north of 10°N, significant warm SSTAs arise from the west coast of North America and extend westward to 180°, inducing the low-level cyclonic anomaly centering around 160°E and 30°N (Figure 5a) through the Gill response (Gill, 1980). During the LIA, although there are also cooling anomalies around Taiwan, the significant warm SSTAs in the tropical Pacific extends further westward to around 135°E (Figure 7b). The too-far-west extension of the warm SSTAs results in a Gill response over the SCS–Philippine Sea, leading to local enhanced convective heating (decreased OLR; Figure 7d) and low-level cyclonic anomaly in 120°E and 25°N (Figure 6a).
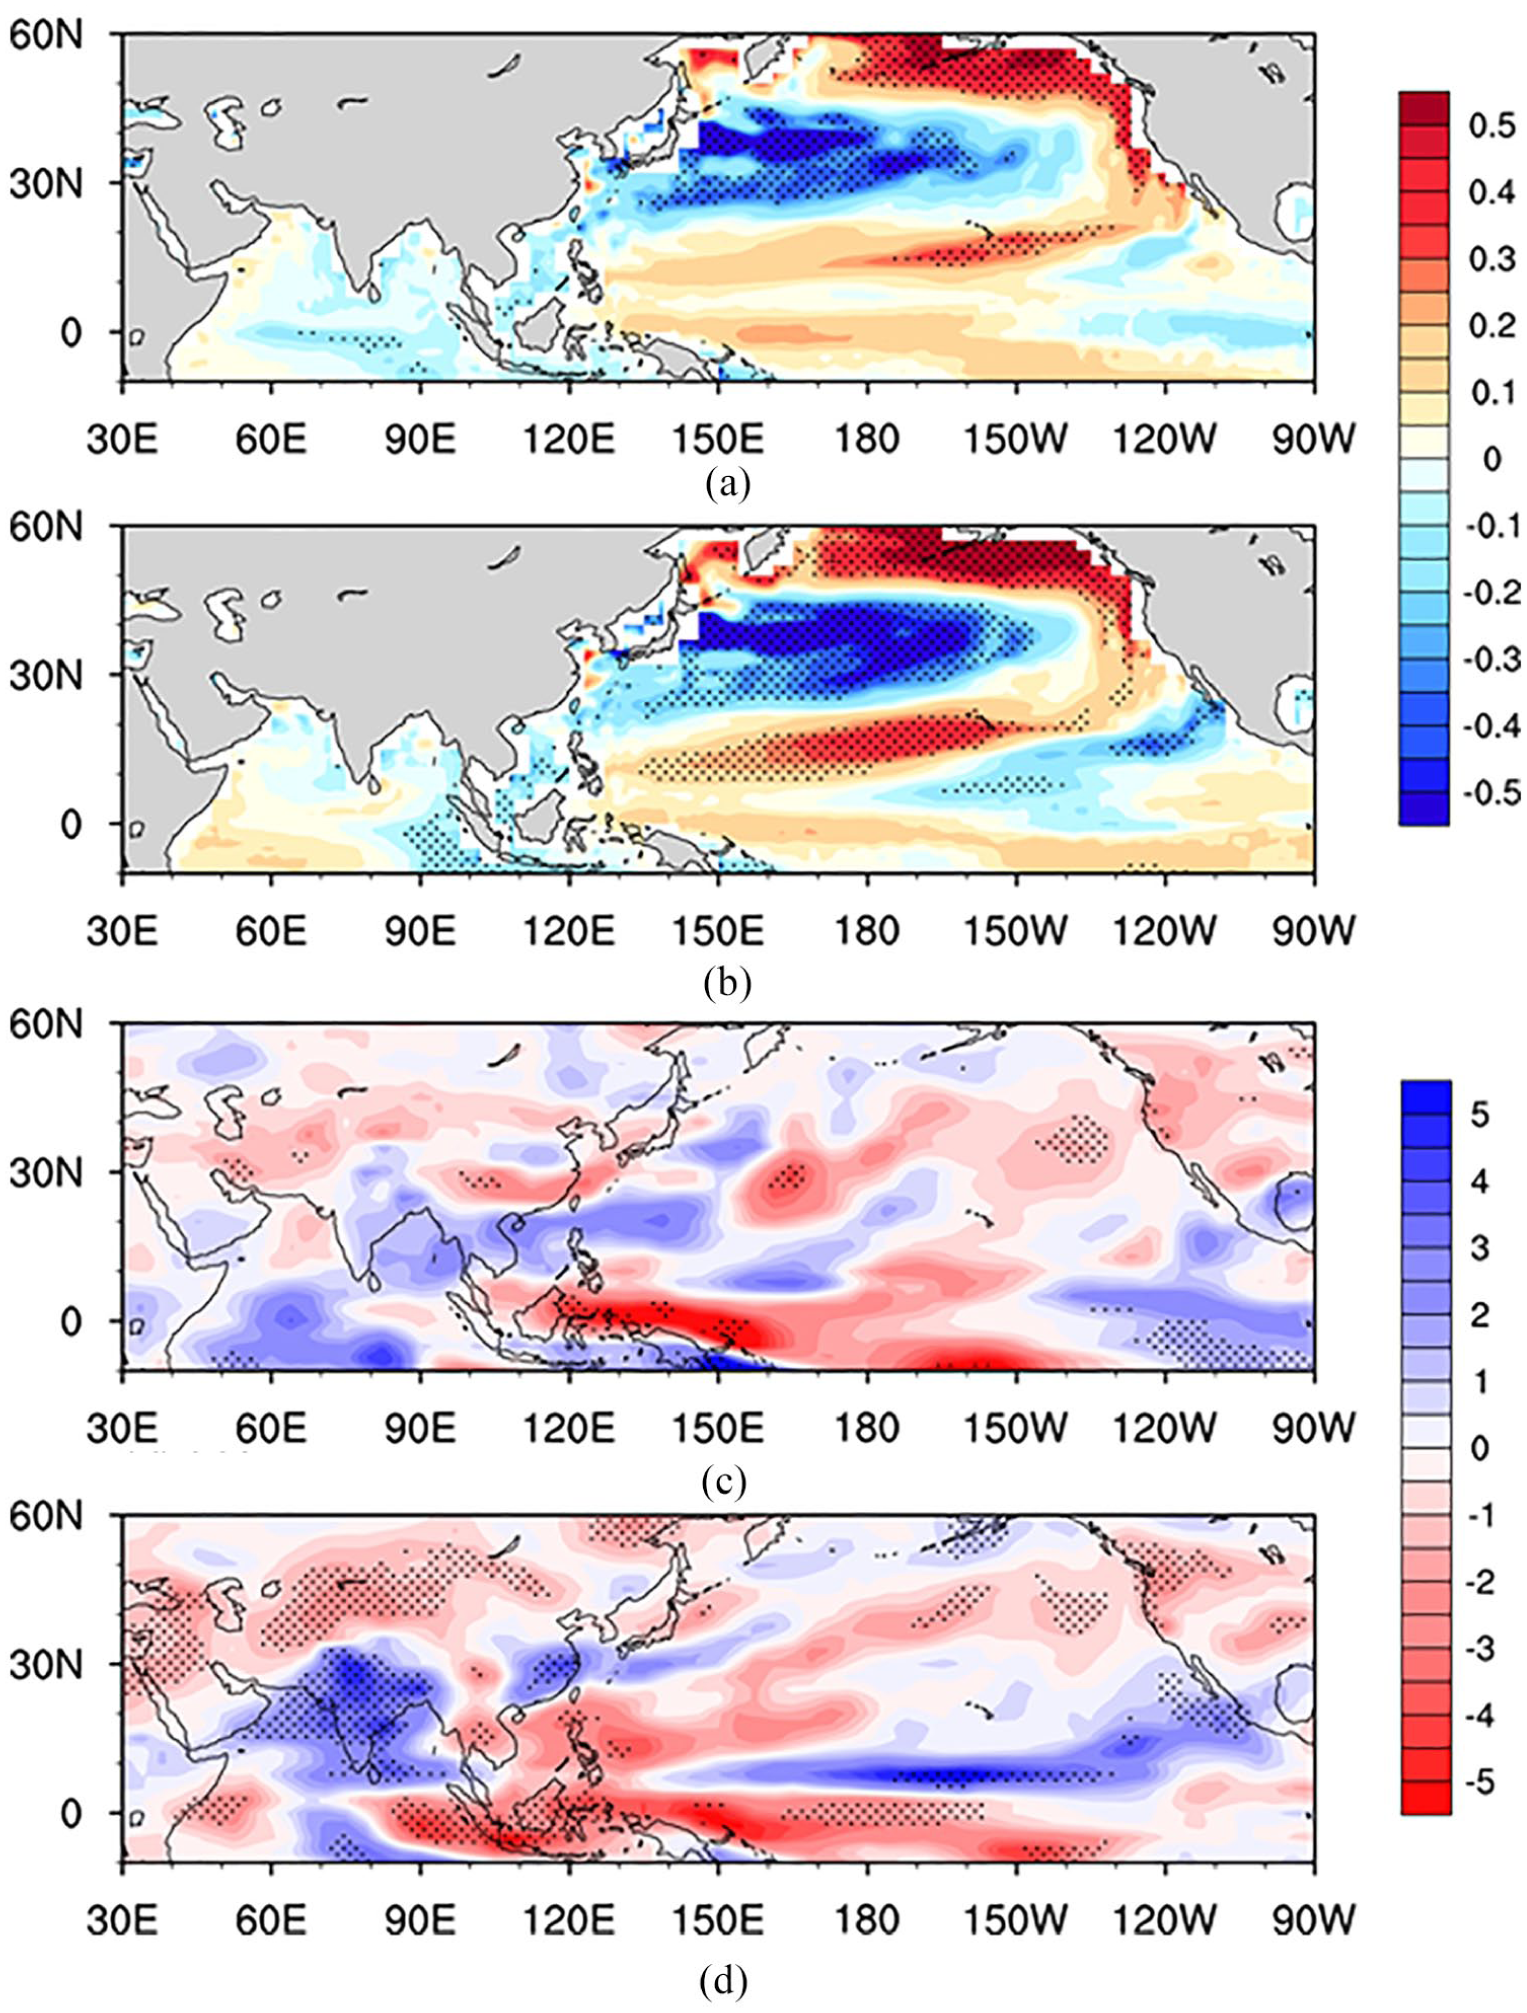
Composite positive-minus-negative PDO differences of SST (°C) and OLR (W m−2) during the (a and c) MCA and (b and d) LIA. The dots indicate areas with statistically significant anomalies at the 90% confidence level.
In addition to the Pacific SSTAs, summer precipitation change over India could also act as a supplementary factor to the formation of the anomalous circulation over eastern China (Gill, 1980; Greatbatch et al., 2013; Sun et al., 2010). During the LIA, there are decreased precipitation and convective heating over India in the positive PDO phase (Figures 4b and 7d). Therefore, the subcontinent and surroundings become a cooling source, exciting an eastward Kelvin wave that propagates into the SCS–Philippine Sea. This promotes the convective heating and reinforces the cyclonic anomaly in 120°E and 25°N. During the MCA, because of the insignificant precipitation change over India (Figure 4a), this process seems to make less an effect.
The local circulation changes are affected by upstream teleconnection waves over Eurasia, which could be modulated by PDO-related North Pacific SSTAs (Mao et al., 2011; Yoon and Yeh, 2010; Zhu et al., 2011). Figure 8 shows the composite differences of the 300 hPa geopotential height and wave activity fluxes. Compared with the negative PDO phase, the positive phase during the MCA features an Eurasian-like teleconnection wave train (Wallace and Gutzler, 1981) in the middle–high latitudes over the Eurasian continent (Figure 8a); meridionally, there is a high-pressure anomaly in north of China and a low-pressure anomaly to its south, corresponding to the PJ/EAP structure. A combination of the Eurasian-like and PJ/EAP patterns facilitates the high-pressure anomaly to the north of China and further the PJ/EAP structure (Bueh et al., 2008; Hirota and Takahashi, 2012). During the LIA, the upper troposphere features two anomalous zonal wave trains over the Northern Hemisphere in positive PDO phases compared with negative phases (Figure 8b). One locates over high-latitude Eurasia and manifests as a Eurasian-like wave train but with different shape and phase position compared with that during the MCA. This wave train forms an upper-level low-pressure trough anomaly over the east of Lake Baikal. The other locates in the northern middle latitudes with several zonally arranged low-pressure anomaly centers and resembles the negative phase of the interannual circumglobal teleconnection (CGT) pattern (Ding and Wang, 2005), establishing a low trough anomaly over the southeastern coast of China. These two upper-level trough anomalies contribute to the precipitation deficit over eastern China, as discussed in the ‘Local circulation’ section.

Composite positive-minus-negative PDO differences of geopotential height (shading, m) and wave activity fluxes (vector, m2 s−2) at 300 hPa during the (a) MCA and (b) LIA. Only the wave activity fluxes greater than 1 m2 s−2 are drawn. The dots indicate areas with statistically significant geopotential height anomalies at the 90% confidence level.
Summary and discussion
This study examines the stability of the relationship between the PDO and eastern China summer precipitation by comparing the MCA with LIA. The HadCM3 model is selected for analysis from nine PMIP3 models that have been applied to historical and last millennium experiments. This is because HadCM3 can not only reproduce the observed SST distribution and interdecadal cycles of the PDO but also PDO-related summer precipitation pattern over eastern China in modern times, whereas simulation of the latter remains a challenge for other eight models. The results show that the relationship between the PDO and eastern China summer precipitation is unstable, although little change is observed for the PDO in the past. For the positive (negative) PDO phase, summer precipitation is found to be excessive (deficient) over South and North China and deficient (excessive) over the Yangtze–Huai River Valley during the MCA, which is nearly opposite to that in the instrumental period, and it decreases (increases) over all of eastern China during the LIA.
The different PDO-related precipitation changes are accompanied by distinct local atmospheric circulation anomalies. For the composite differences of local circulation during the MCA, a PJ/EAP pattern occurs across East Asia with anomalous tripole circulation from the lower to middle troposphere and dipole circulation in the upper troposphere. Following this pattern, an anticyclonic anomaly over the west of Taiwan in the mid–low levels enhances water vapor transport to South China, and the cyclone in the north favors a pluvial condition over North China. In the upper troposphere, the intensified westerlies center on 120°E along 25–30°N and contribute to excessive precipitation over South China and a deficit over the Yangtze–Huai River Valley. During the LIA, a cyclonic anomaly occurs over the SCS–Philippine Sea in the mid–low levels and weakens the moisture flowing into eastern China. Two upper-level low trough anomalies appear over East Asia, favoring the subsidence anomaly that aggravates the precipitation reduction.
These dissimilar local circulation anomalies are connected to different changes in low-latitude SSTAs, summer precipitation over India, and upstream wave trains over Eurasia. Significant low-latitude warm SSTAs arising from the west coast of North America extend westward to 135°E during the LIA, disturbing the low-level circulation over the SCS–Philippine Sea to form the cyclonic anomaly through the Gill response, while the warm SSTAs during the MCA only extend to 180°, leaving the cold local SSTAs to induce the PJ/EAP pattern over East Asia. Composite difference of summer precipitation in India exhibits little change during the MCA, but it significantly decreases during the LIA, which could trigger an eastward Kelvin wave to reinforce cyclonic anomaly over SCS–Philippine Sea. In the upper level, the anomalous Eurasian-like wave train during the MCA can promote the anomalous PJ/EAP structure, while two anomalous wave trains during the LIA spread to East Asia and induce the two upper-level troughs in that location.
It remains unclear why the PDO-related large-scale teleconnection wave trains and low-latitude SSTAs during the MCA exhibit changes different from those during the LIA. First, the basic flow has been recognized as an important factor in supplying energy for wave trains and governing the path of wave energy propagation (Li and Ji, 1997; Lu and Lin, 2009; Simmons et al., 1983). Therefore, the fairly distinct basic flows between the warm MCA and cold LIA (Mann et al., 2009) provide a potential explanation for the dissimilar patterns of the PDO-related teleconnection wave train between the two periods. Second, the CGT wave train is closely related to the summer precipitation over India (Ding et al., 2011; Ding and Wang, 2005). Significant precipitation anomaly over India occurs only during the LIA, presumably explaining the CGT-like wave train for that time.
The PDO is thought to be a combination derived from several climate processes, and one of which is recognized as tropical variability, such as ENSO (e.g. Alexander, 2010; Newman et al., 2016; Schneider and Cornuelle, 2005). Therefore, the different low-latitude SSTAs during the MCA and LIA might come from a changing relationship between the PDO and ENSO, similar to the process under future warming climate (Kwon et al., 2012). Toward addressing the specific ENSO–PDO relationship during the two periods, the composite SSTAs of in-phase ENSO–PDO events are compared with that of the out-of-phase ENSO–PDO events following the method in Kwon et al. (2012). Here, the SST variability linked to ENSO is measured using the Niño3.4 index (SSTAs in 5°S–5°N and 170°W–120°W), and El Niño (La Niña) years are defined when the index is greater than 0.5 (less than −0.5) standard deviation. During the LIA, the tropical Pacific SSTAs linked to El Niño events tend to be greater (smaller) when there are positive (negative) PDO events simultaneously (Figure 9b and d); Likewise, the La Niña events are stronger (weaker) during negative (positive) PDO events (not shown). This demonstrates PDO events could facilitate the in-phase ENSO events and thus are closely linked to the SST variability over tropical Pacific during the LIA. However, during the MCA, the tropical SSTAs linked to El Niño events are comparable no matter during what phases of PDO events (Figure 9a and c), indicating the ENSO events are less coupled to the PDO. In comparison with the MCA, the PDO–ENSO linkage during the LIA is closer, possibly responsible for the stronger warm low-latitude SSTAs related to positive PDO events.
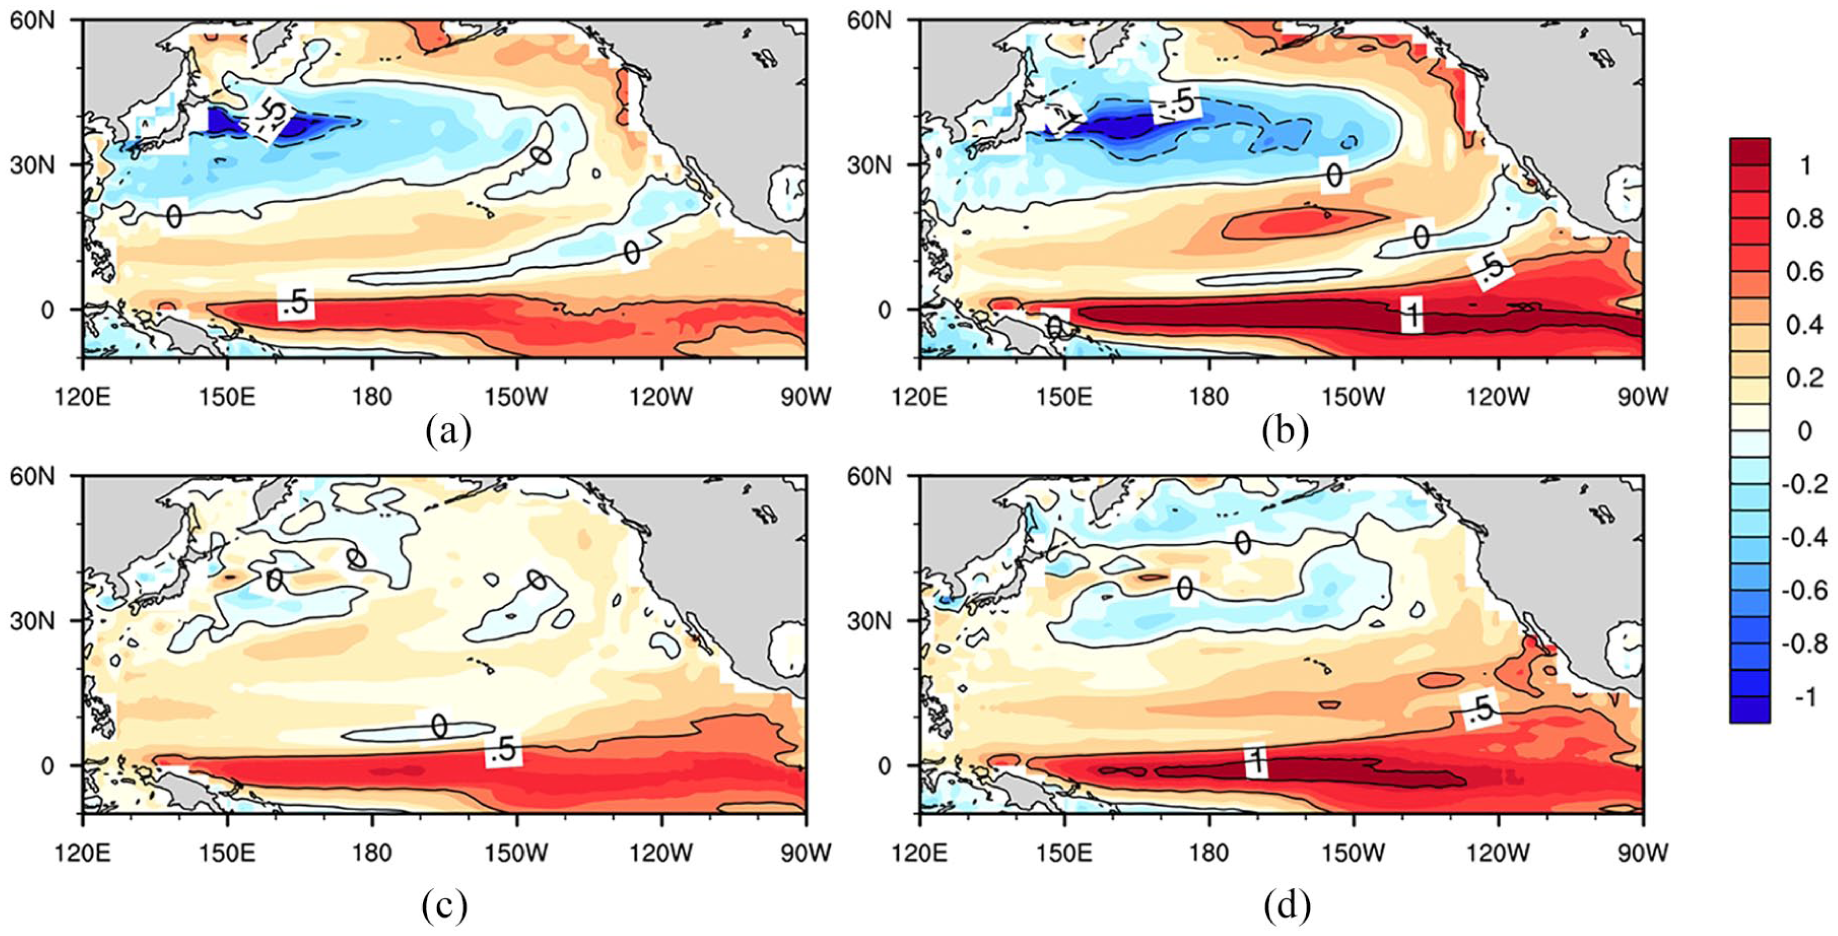
Composite SSTAs (°C) for El Niño–positive PDO phase and El Niño–negative PDO phase during the (a and c) MCA and (b and d) LIA.
To enhance the credibility of our single model analysis, the average state of all models (multi-model median, MME) is added to supplementary materials. Comparing the HadCM3 and MME, the composite difference of summer precipitation over eastern China and surroundings shows high similarity during both the MCA and LIA (supplementary Figure S4, available online). Related to the precipitation change, low-level local circulation (supplementary Figures S5a and S6a, available online), vertical motion (supplementary Figures S5d and S6d, available online), SST (supplementary Figures S7a and S7b, available online), and convective heating (supplementary Figures S7c and S7d, available online) anomalies in the HadCM3 and MME are also largely accordant. However, for the high-level local circulation (supplementary Figures S5c and S6c, available online) and upstream teleconnection waves (supplementary Figure S8, available online), the MME results exhibit somewhat diversities with those in the HadCM3. This may be caused by different parameterizations and external forcing datasets used and imperfections in simulating the precipitation (Lei et al., 2014) and PDO (Park et al., 2013). On the whole, the MME results are consistent with the simulation of HadCM3, meaning the selected model is representative.
To sum up, both the HadCM3 and MME indicate that the PDO–eastern China summer precipitation relationship is unstable in the past, which has implications for PDO reconstruction. The PDO reconstruction is calibrated using the observed relationship between the PDO and proxy and assumes a stability of the relationship throughout the past. The unstable PDO–eastern China summer precipitation relationship in the past makes this assumption untenable and might partly explain the inconsistencies among the reconstructed PDO indices. Indeed, several recent studies have questioned the fidelity of the stability assumption in PDO reconstruction and emphasize that the use of PDO reconstructions for explaining past climate should be considered with caution (Coats et al., 2013; Kipfmueller et al., 2012; McAfee, 2014; Newman et al., 2016).
Supplemental Material
20191118-supplementary_material – Supplemental material for Unstable relationship between the Pacific Decadal Oscillation and eastern China summer precipitation: Insights from the Medieval Climate Anomaly and Little Ice Age
Supplemental material, 20191118-supplementary_material for Unstable relationship between the Pacific Decadal Oscillation and eastern China summer precipitation: Insights from the Medieval Climate Anomaly and Little Ice Age by Xuecheng Zhou, Dabang Jiang and Xianmei Lang in The Holocene
Footnotes
Acknowledgements
We sincerely thank the two anonymous reviewers for their insightful comments and suggestions to improve this manuscript. We also acknowledge the climate modeling groups participating in the CMIP5/PMIP3 for producing and sharing their model outputs.
Funding
The author(s) disclosed receipt of the following financial support for the research, authorship, and/or publication of this article: This research was supported by the National Key R&D Program of China (2017YFA0603302 and 2017YFA0603404) and the National Natural Science Foundation of China (41625018).

Supplemental material
Supplemental material for this article is available online.
References
Supplementary Material
Please find the following supplemental material available below.
For Open Access articles published under a Creative Commons License, all supplemental material carries the same license as the article it is associated with.
For non-Open Access articles published, all supplemental material carries a non-exclusive license, and permission requests for re-use of supplemental material or any part of supplemental material shall be sent directly to the copyright owner as specified in the copyright notice associated with the article.
