
Abstract
The rise and fall of human cultures are strongly modulated by the strong environmental changes taking place during the Holocene. Here, we use the sedimentological and geochemical records of a core taken in the Arabian Sea, west of Kerala, to identify potential factors that may reflect on-land history of local civilizations, in particular the Harappan culture which appeared and collapsed in the Indus Valley during the early and middle Bronze Age. The 14C record highlights a fourfold increase in sedimentation rate at ~5380 cal. yr BP. The short duration of this event (~220 years) suggests a steep regional increase in erosion at the beginning of the Bronze Age. Factor analysis of downcore changes in geochemistry identified two distinct detrital components dominated by silt and clay, respectively, and a component characteristic of chemical erosion. This interpretation is consistent with sediment mineralogy. Comparison with the known climatic record indicates that increased erosion rate at 5380 cal. yr BP around the Arabian Sea is because of the advent of farming. The development of tillage associated with both wheat and barley crops and animal husbandry was favored by trade between Mesopotamia and India. Human activities, therefore, were the trigger of major changes in the sedimentological and geochemical records at sea at the onset of the Bronze Age.
Introduction
The Indian continent experienced climate fluctuations that allowed the rise of major cultures as well as their downfall. For example, Singh (1974) and Giesche et al. (2019) argue that increase in rainfall related to the Indian Summer monsoon (6–4.3 ky BP) contributed to the growth of the Harappan culture in the Indus Valley, while Staubwasser et al. (2003) and Giesche et al. (2019) associated its demise to a major episode of drought (~4.2 ky BP). The question posed in this work is whether human factors can be separated from the environmental and climate influences which modulate the Holocene sedimentary record in the Bay of Bengal and Arabian Sea.
Previous work on drill cores taken close to the Indus delta by Deplazes et al. (2013, 2014) and west of Kerala (DSDP site 219) by Whitmarsh et al. (1974) do not focus on the middle and late Holocene, which is the period where human influence may become potentially significant. This work investigates the marine geochemical and mineralogical record in the gravity sediment core SLK148/6 located at the foot of the continental slope near the Kerala coast and which covers this period (Figure 1). In addition to standard fraction analysis and x-ray diffraction, whole-rock samples were dated by radiocarbon and their major and trace elements, 143Nd/144Nd, δ18O and δ13C measured in order to define secular changes, which were further examined to extract a potential anthropic signal from the modulation by environmental and climatic factors.
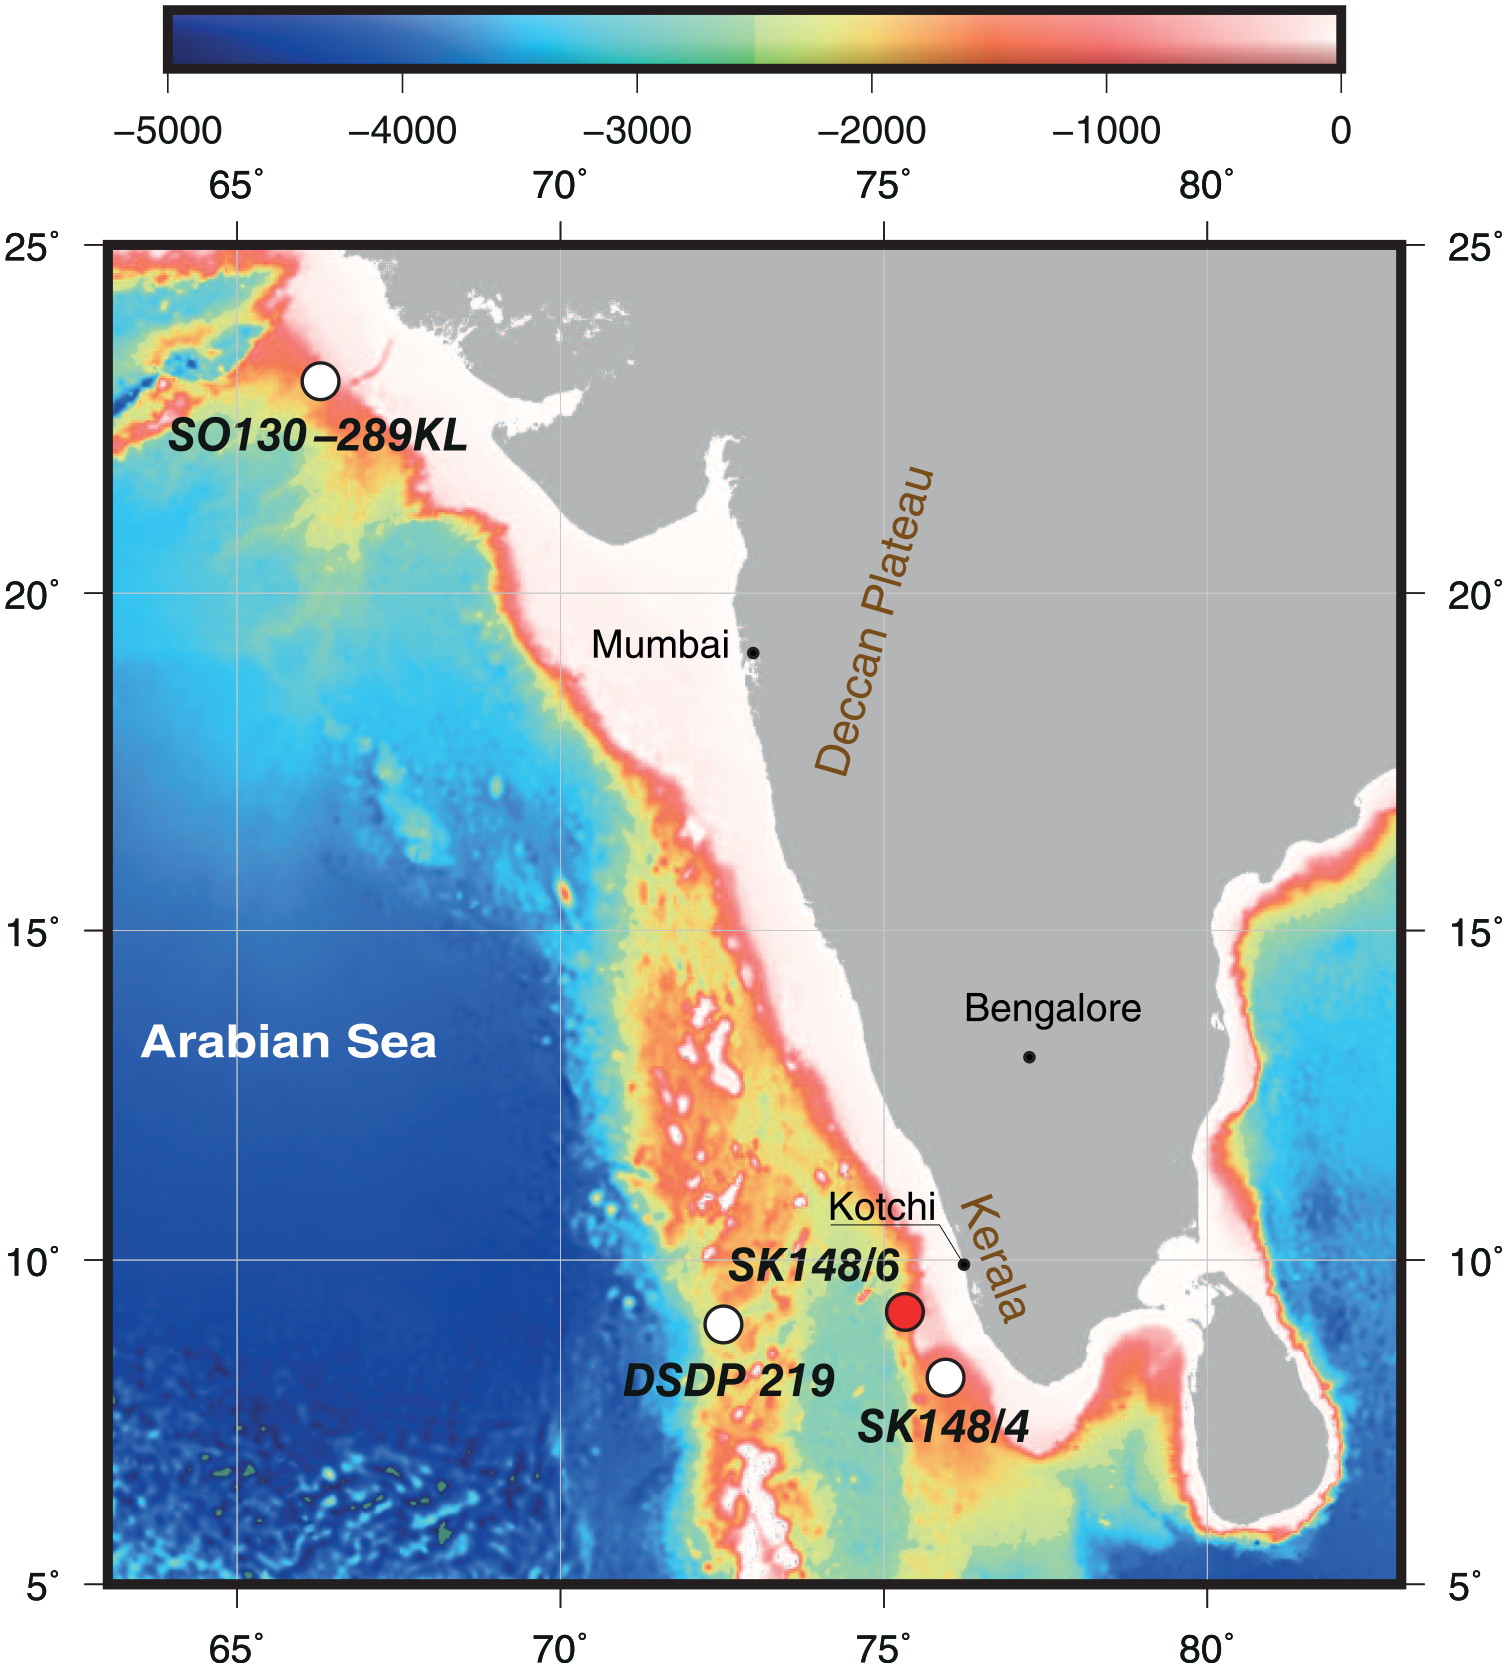
Position of the SK-148/6 core in the Arabian Sea and of the other cores mentioned in the text. Figure drawn by GMT (Wessel and Luis, 2017).
Material and methods
Lithology
Site SLK148/6 was retrieved on 13 September 1999 by the ORV Sagar Kanya and located at 9°20′N and 75°33′E at a depth of 890 m (Figure 1). The marine sediment core retrieved from the Arabian Sea was only 2.40 m long and was selected for various analysis. The core was cut open and its lithology described with reference to the Munsell color chart, sediment texture, structure and sediment sorting. Samples were taken at 2 cm intervals and stored for further analyses, such as the estimation of sediment texture, geochemistry, and radiocarbon dating. The sedimentary texture is dominated by silty clay and clay with gray to dark gray color. Shell fragments are observed in the top 40 cm. Texture was analyzed on 40 samples using the pipette method of Krumbein and Pettijohn (1938) to calculate the weight fraction of sand, silt and clay and assess the distribution of grain sizes and its variation with depth. Using color and texture, the sediment core was divided into three litho-units. At the bottom, Unit I (240–140 cm) shows black (2.5Y 2/1) to olive (5YR 5/4) colors. It is made of silty and sandy clays and contains shell fragments. Unit II (140–63 cm) is gray or olive black (5Y 3/2) with a lithology of very fine silty clay and clayey silt, studded with grayish brown patches. Unit III (63–0 cm), is grayish brown to grayish black colored, silty clay with organic materials consisting of shell fragments from the depth of ~40 cm to the top. Based on Shepard’s (1954) classification using the ternary diagram that is divided into 10 classes of sediment texture, the sediment samples of this study are dominantly silty clay and clayey silt.
Sample 14C chronology
Fifteen organic carbon-rich fraction samples taken throughout the core were radiocarbon dated by AMS following acid washes at Beta Analytic Limited, London. The ‘Conventional Radiocarbon Age’ was calculated using the Libby half-life (5568 years), corrected for total isotopic fraction, and was used for calendar calibration where applicable. Conventional Radiocarbon ages and sigmas are rounded to the nearest 10 years per the conventions of the 1977 International Radiocarbon Conference. Results greater than the modern reference are reported as percent modern carbon (pMC). The modern reference standard was 95% the 14C signature of NIST SRM-4990 C (oxalic acid). Quoted errors are 1 sigma counting statistics. When counting statistics produce sigmas lower than ±30 years, a conservative ±30 cal. yr BP is cited for the result δ13C values are on the material itself (not the AMS δ13C). δ13C and δ15N values are relative to VPDB-1. References for calendar calibrations are Bronk Ramsey (2009) for the probability method and Reimer et al. (2013) for Database INTCAL 13. Calibrated ages and Bayesian binned errors were calculated using the OxCal interface (https://c14.arch.ox.ac.uk/oxcal.html). With one exception, the δ13C of the mean organic material is consistent with the local results of Fontugne and Duplessy (1986). Reservoir ages have varied through the Holocene (Southon et al., 2002; Staubwasser et al., 2002) and, therefore, the ages reported are those of equilibration with the atmosphere given by INTCAL 13.
Chemical and isotope compositions
For major elements, about 100 mg of rock powder were dissolved in a concentrated HF-HNO3 mixture and evaporated to dryness, then analyzed on a Thermo Fischer Scientific iCAP 7400 Duo ICP-AES in Lyon using Sc as the internal standard. A total of 100 mg of rock powder were weighted and dissolved in steel Parr bombs using a mixture of high-purity grade 28M HF and 14M HNO3 with a few drops of HClO4 and their trace elements analyzed on a Thermo X serie2 ICP-MS in Grenoble. Upon evaporation, the residues were dissolved in 2% HNO3 with traces of HF and diluted by a factor of about 2000. A multi-elementary solution of Be, Ge, In, Tm and Bi was added as the internal standard such as to correct for the drift of the ICP-MS. Analyses were performed in both no-gas mode and Collision Cell Technology (CCT) mode depending on the element to be analyzed. The CCT was used to reduce polyatomic interferences with 5% H2 in the He gas. Rock standards (BHVO2, BEN, BR24, JSD2, JSD3, and LKSD1) were analyzed with each batch and the BHVO2 standard used as external calibration. Samples were analyzed in duplicate. Reproducibility and accuracy are estimated at <±5%.
Neodymium isotopic compositions were determined using standard techniques described in Chauvel et al. (2011). Rare-earth elements were separated as a group from the rock matrix using columns filled with 10 mL cationic resin (AG50 W-X8, 200–400 mesh) and Nd was isolated from the other rare-earth elements (REE) using Ln-spec resin. Nd isotopic compositions were obtained at ENS Lyon on a Nu Plasma MC-ICP-MS and normalized for instrumental fractionation to 146Nd/144Nd = 0.7219. The Nd AMES-Rennes reference standard was analyzed every two or three samples and yielded an average value of 143Nd/144Nd = 0.511976 ± 20 (2σ, n = 51) over all sessions and was corrected after every session to the published value of 0.511961 ± 13 (54). Reproducibility between duplicates is better than 0.23 εNd. The Nd isotopic ratios are expressed in the epsilon notation,
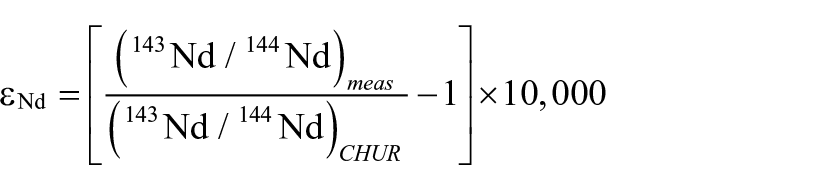
where the present value of chondritic uniform reservoir (CHUR) = 0.51263 (Bouvier et al., 2008). Procedural blanks were <56 pg on average (n = 8) and can be neglected given the quantities of Nd isolated (129–2300 ng).
Results
Mineralogy
In the non-carbonate fraction (e.g. without calcareous shells), clays increase rather smoothly from ~53% to 64% and the very fine silt fraction correlatively decreases from 45% to 36% (Supplemental SI Appendix, Table S1, available online). Calcium carbonate fluctuates between 25% and 35% with slightly higher values in the uppermost part of the core. The x-ray diffraction results (Figure S1, available online) show that smectite and kaolinite increase above ~105 cm, whereas aragonite abundance decreases.
Geochemistry
With one exception, the δ13C (Table S3, available online) of the mean organic material is dominated by marine carbon (δ13C ~20‰). Oxygen isotopes in the carbonate fraction show a drop in δ18O of 1‰ as expected at the Last Glacial Maximum (LGM) (Adkins et al., 2002) as a result of the massive meltdown of high-latitude and mountain ice sheets (Table S2, available online, Figure 2). The major element results show rather low Mn and Fe abundances and moderate increase of Mg, Na and P abundances during the Holocene (after the Younger Dryas, Table S3, available online). The Holocene is further characterized by an increasing clay/silt ratio and organic C steadily ramping up after the LGM. In contrast, organic H, which collapsed at the Younger Dryas (YD), steeply increases in chaotic steps up to ~5 ky BP, then smoothly increases to the present-day level (Table S1, available online, Figure 2).

Downcore variations of percentage of C and percentage of H of Hf/Sm, La/Yb and Ce/Co ratios, as indicators of erosional regimes, and of δ18O, εNd.
Trace elements likewise evolve upcore, with an average variability over the core length of 10–15% (except for Zr and Hf for which variability reaches ~50%, Figure 3) and form coherent groups. In order to assign each element to a group in an objective way, we applied factor analysis to the correlation between elements and concluded that three factors account for 83% of the variance (Figures 4 and 5, Figure S2, available online). We relied on the elements with the largest loading modulus (factor loading is the correlation coefficient between the variable and factor, here >0.8) to characterize ‘groups’. The first factor (42%) is dominated by the light REE which includes La-Eu, Th, Zr, Hf and As. The second factor (29%) is dominated by Y and the heavy REE, Dy-Lu, Cu, Ni and Zn, while the third factor (12%) is dominated by alkali elements (Li-Cs), Sc, Co and V. We will refer to this third factor as the ‘Co group’. Dividing all concentrations by Co minimizes artifacts because of dilution effects: Nb can be added to the first group and Ba to the second group. When the concentrations of these elements are plotted against the 14C ages, it becomes clear that factor 1 differs from factor 3 (Figure 5), essentially because of a remarkable peak just after the LGM and by the absence of a peak at the YD, which is found for both factors 2 and 3.
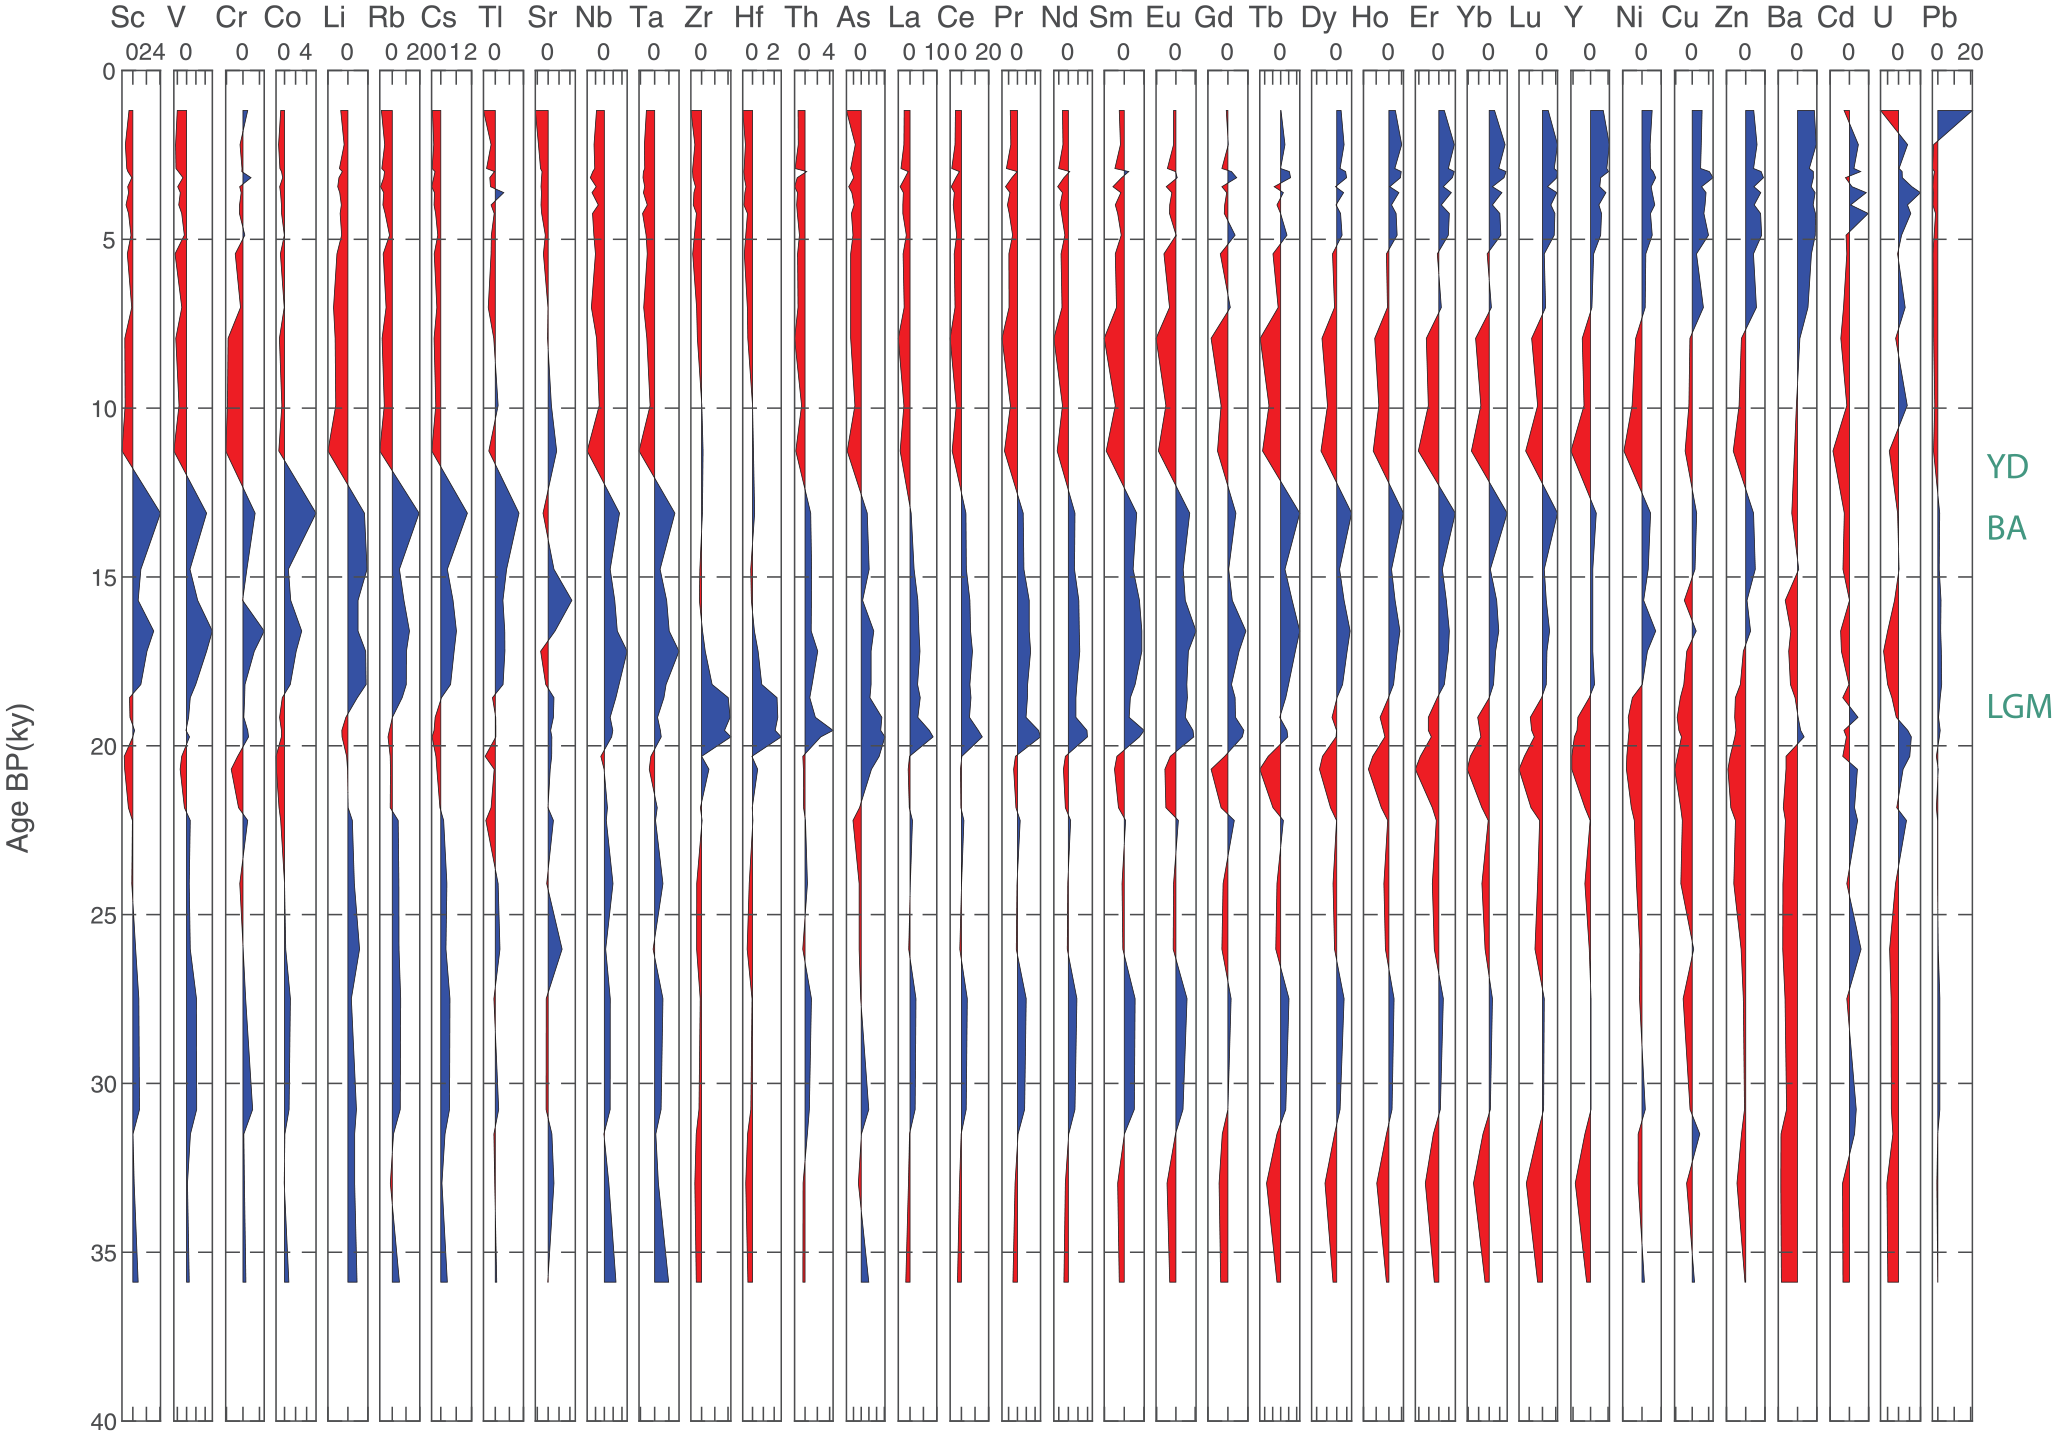
Downcore variations of trace element concentrations. Data were normalized by UCC (Upper Continental Crust) (Rudnick and Gao, 2003). On the right in green, three main steps of paleoclimatic changes: the Last Glacial Maximum (LGM), The Younger Dryas (YD) and Bølling-Allerød (BA).
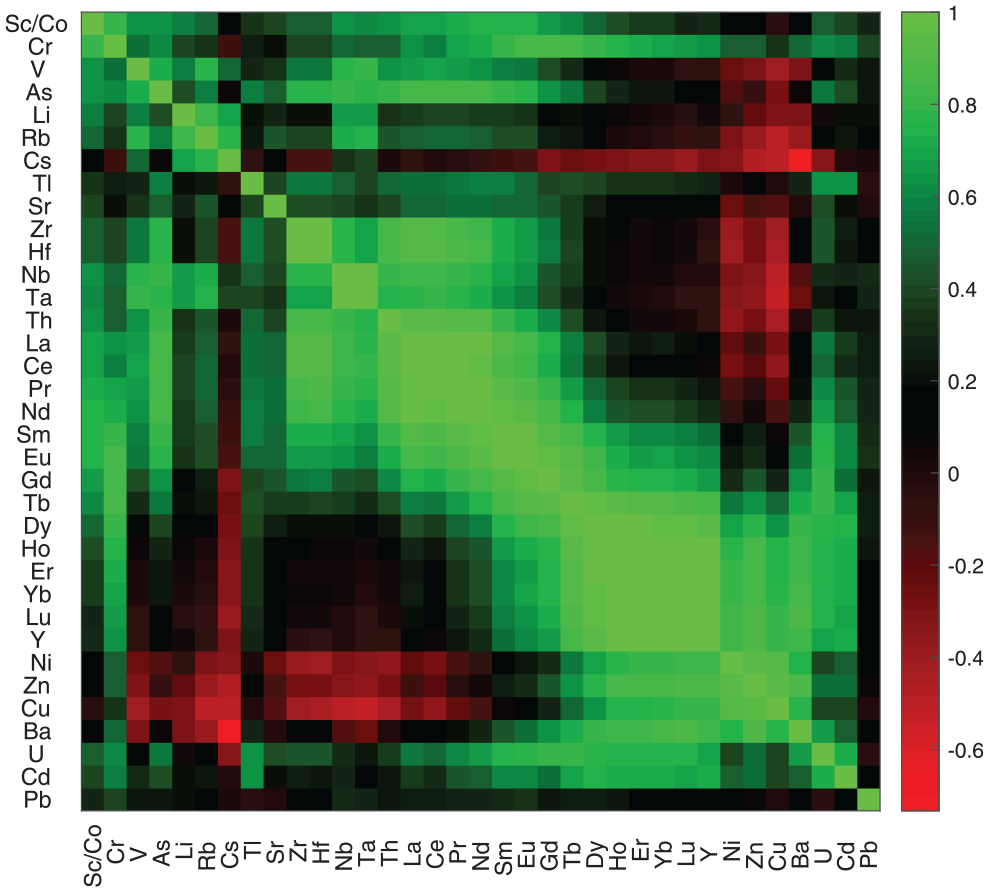
Correlation matrix of co-normalized trace elements in the SK-148/6 core. The order of elements was organized to enhance readability.
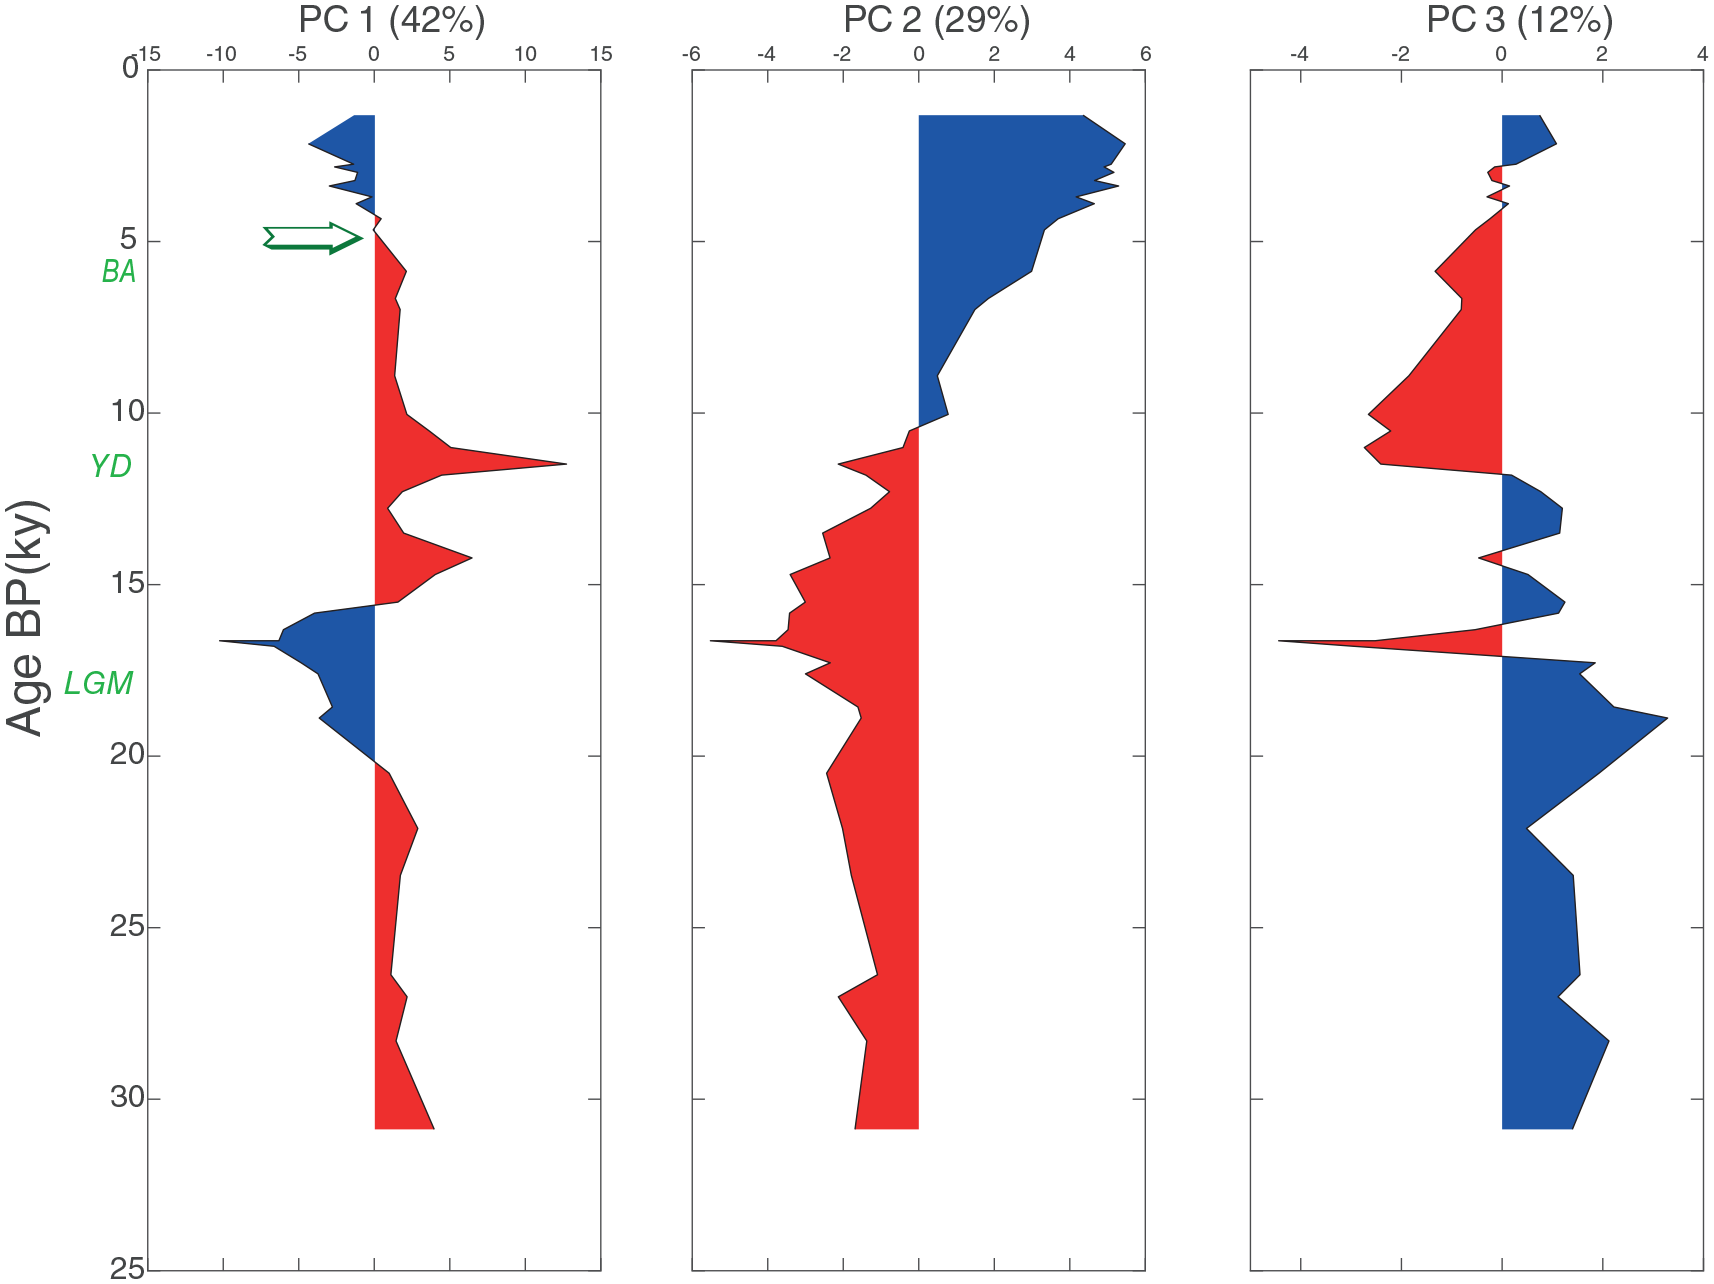
Downcore variations of the principal components for the correlation matrix displayed in Figure 4. Units are one standard deviation in the direction of the component. In parentheses, variance proportion accounted for by each component. The first three components account for 84% of the variance. The green arrow indicates the onset of the Bronze Age (BA), YD = Younger Dryas, LGM = Last Glacial Maximum.
Finally, the Nd isotopic compositions of the marine core sediments show that the range of εNd(0) in the sediments is rather narrow (εNd(0) = −14.1 to −17.4, Table S3, available online, Figure 2), consistent with the range of values measured on clays from the western margin of India by Kessarkar et al. (2003). The model ages are mixed ages and do not relate to particular events affecting the Southern Indian basement (Collins et al., 2007; Kumaran et al., 2014; Moyen et al., 2003; Santosh et al., 2005). The model ages show some scatter up until the YD, then start increasing smoothly from 1.85 Ga to 2.0 Ga, largely because of increasing Sm/Nd and the decrease of εNd(0) over the same period. These values are coherent with those of Collins et al. (2007) and Santosh et al. (2005) who show that granulite-facies metasedimentary rocks from southern India are sourced from the Mesoarchean Dharwar craton and a Paleoproterozoic source with predominantly Neoarchean to Proterozoic ages (average values being ∼1900 Ma and ∼515 Ma, respectively). The ages of surface rocks in this region therefore are heterogenous. As terrigenous input to the Arabian Sea may come mainly from close rivers draining the south India region, but also from coastal currents or upwelling carrying sediments from lands surrounding the Arabian Sea, it is difficult to identify the exact origin of the sediments deposited at site SK148/6. Nevertheless, the relatively stable mean age obtained since the YD suggests that material at this site corresponds to the integration of material over a large area.
Discussion
Sediment geochemistry
In order to relate the downcore geochemical variability with a time-dependent signal, information provided by the elements defining the factor groups can be refined by using particularly informative ratios. In particular, Hf/Sm, La/Yb and Ce/Co involve elements which are known to discriminate the role of mechanical versus chemical erosion (Babechuk et al., 2014, 2015; Patchett et al., 1984) and are particularly high in refractory accessory phases. These ratios show sharp peaks at the LGM and the Young Dryas (Figure 2). The nature of the three dominant factors may be understood in the following way:
Factor 1 (42% of the variance) clearly correlated with the very fine silty fraction and transports a detrital component rich in heavy minerals such as zircons, phosphates and Nb-rich Ti-oxides (Figures 3 and 4 and Tables S1 and S3, available online). This factor represents refractory elements preserved during mechanical weathering, such as Nb, Zr, Hf, Th, As, and light REE. The values of εNd(0) negatively correlate with light REE through the Sm/Nd ratio (r = 0.5), which reflects that basaltic rocks tend to have higher εNd(0) and lower Sm/Nd ratios than felsic continental rocks.
Factor 2 (29% of the variance) gathers Ba, Ni, Cu, Zn and heavy REE (Figure 3) which are elements most easily desorbed from particulates in estuaries (Balls, 1989; Chiffoleau et al., 2013; Fu et al., 2013). Although Ba is commonly used as a proxy of biological productivity (Paytan and Griffith, 2007), the residence times of these elements (~1000 years, for example, Millero, 2013) are an order of magnitude shorter than the time scale (>10,000 years) over which these elements evolve. Changes in these elements, as well as changes in Cd, cannot therefore be because of changes in biological productivity in the southeastern Arabian Sea, as recorded during the Holocene (Bassinot et al., 2011; Naik et al., 2017; Thamban et al., 2001), but reflect a change in the source of these elements. This interpretation is consistent with the small Ca variations observed during the same period (Table S3, available online). Factor 2 is also identifiable by its correlation with some diagnostic elemental ratios, notably Ba/Sr, Ce/Ce* and Y/Ho. The correlation between the scores (coordinates in the factor coordinate system) of factor 2 and Ba/Sr, a potential tracer of weathering (Buggle et al., 2011; Liu et al., 1993), is fairly strong (r = 0.79). The Ce anomaly, measured as Ce/Ce* (normalized Ce/La½ Pr½), goes through a peak at a near-chondritic value of 0.96 at the LGM, then decreases to 0.87, with another smaller peak at the YD (Table S1, available online). It is well-established (e.g. Braun et al., 1994) that Ce4+ is more resistant to lateritization than any of the trivalent REE. Also, in laterites, it has been recognized that the Y/Ho ratio, another tracer of weathering, is negatively correlated with the Chemical Alteration Index (Babechuk et al., 2014). The strong negative correlation of Ce/Ce* with Y/Ho (r = −0.75) and Ni/Co (r = −0.81), the superchondritic Y/Ho values (>28) and the subchondritic values of Ce/Ce* clearly indicate that factor 2 represents chemical weathering, with labile elements being removed from the soil or desorbed from particles and eventually absorbed by clays (Figure 6).
Factor 3 (12% of the variance) represents a different group of residual metals, most notably alkali elements, which are not hosted by refractory accessory minerals, but by fine micas and clays, most likely removed from continents as suspended load (Figure 5 and Figure S2, available online). Alternatively, it may indicate an effect of dilution of the clay component by carbonates, but the objections are the same as for component 2.
After the YD, both factors 2 and 3 rise at the expense of factor 1, yet with factor 2 become predominant: the modulus of factor 2 rises through time to values in excess of 4, whereas the modulus of factor 3 decreases substantially. These changes attest to steeply enhanced chemical erosion of soils over the mid and late Holocene (Figure 5).

Correlation between Ni/Co (blue, r = 0.75) and Y/Ho (red, r = 0.81) vs Ce anomaly. The red star indicates the chondritic values of Y/Ho and Ce. The correlation argues for strong chemical weathering of the source rocks.
Sedimentation rates
The sedimentation rates inferred from the depth-14C age plot seem to be piecewise constant and increase by a factor of about four at ~6000 cal. yr BP (uncorrected for reservoir effects). To evaluate the time of the upturn with better precision, we assumed that the sedimentation rate v can be approximated by a logistic function of time t:

in which
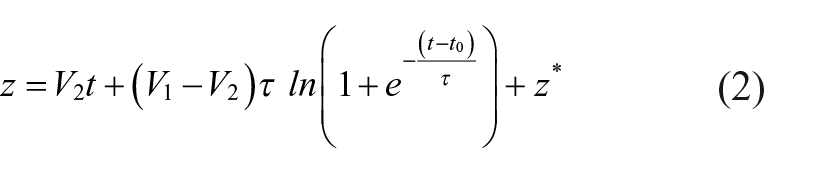
where
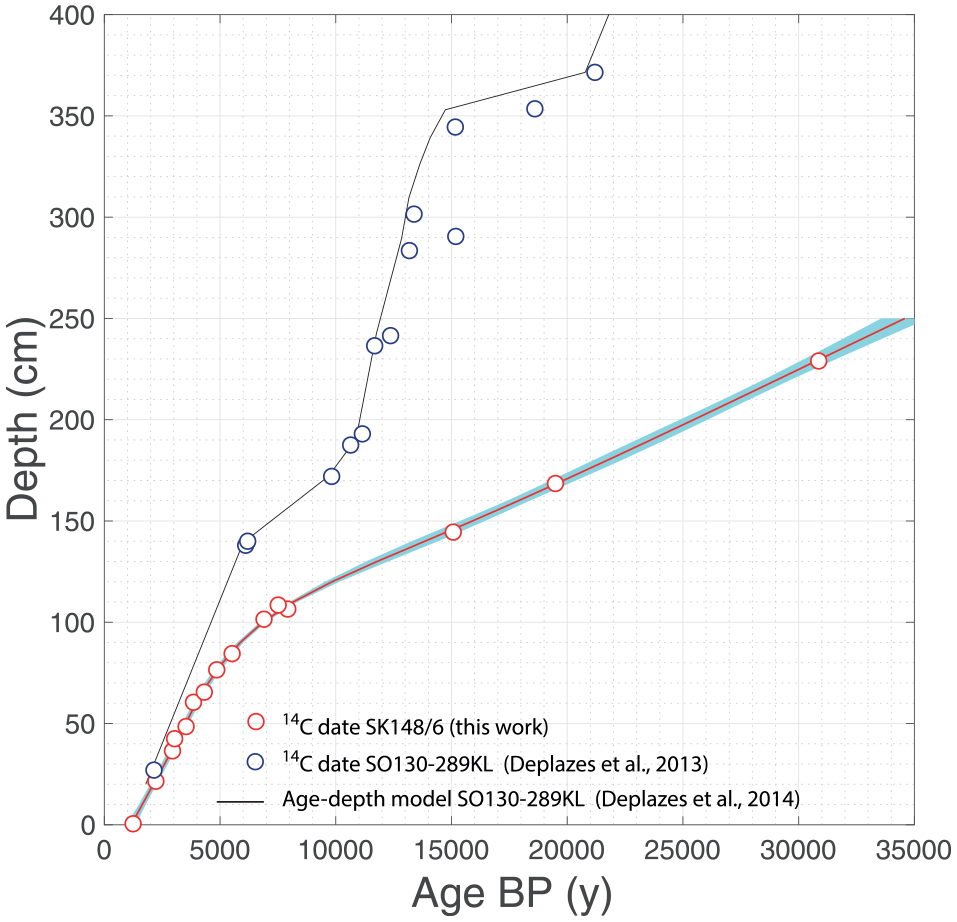
Sedimentation rates calculated from the depth-14C age relationship and Eq. 2. Errors are propagated from the errors on 14C ages (assumed to be normally distributed) using 2000 Monte-Carlo loops.
A puzzling observation is that this sudden increase in sedimentary accumulation at ~5380 cal. yr BP does not reflect in a sharp change in the relative abundance of geochemical components. This observation is consistent with the small variation of εNd(0) observed by Kessarkar et al. (2003) and in our own data. The source of sediments apparently remained similar over the last 22 ky but the proportions evolved. Comparing the present εNd(0) data on the present core (εNd(0) = −5 to +5) (Figure S3, available online) with the Deccan trap data compiled from the GEOROC database (http://georoc.mpch-mainz.gwdg.de/georoc/) shows that sediments (εNd(0) = −14.1 to −17.4) are dominated by components from the Precambrian and Paleozoic pre-Deccan trap basement. An abrupt but short event took place between 16 ka and 17 ka, at the onset of the LGM. This event is identifiable through the high concentrations of Zr, Ti and Hf, the high Hf/Sm, and the drop in the silt proportion (Figures 2, 3 and Table S3, available online): we associate this short pulse with an event, or a series of events, of turbidite emplacement, probably triggered by the rising sea level and the loosening of the shelf material. After the YD, this evolution remains smooth and the abrupt change in sedimentation rate taking place at ~5380 cal. yr BP is accompanied by a sudden rise of factor 1, which we adopted as a proxy of mechanical erosion.
Given the increasing strength of chemical erosion after the YD, the possibility that PCO2 could be involved through temperature variations and erosion rates should be considered. Again, PCO2 changes rather smoothly from the LGM onwards (Köhler et al., 2017) and does not seem to be a determining factor for the 5380 cal. yr BP event (Table S3, available online). As for sea level changes on the west coast of India, they are progressive between 9 ky BP and 7 ky BP (Camoin et al., 2004; Rajendran et al., 1989). Changes in the monsoon regime, with two short phases of intensification recorded at 9.9 ky BP and 8.8 ky BP in marine sediments from the Arabian Sea (Sirocko et al., 2000) do not seem to account the kink of Figure 7. Although the monsoon regime may affect local oceanic currents and deep-water upwelling, its record does not fit the abrupt (~200 years) and irreversible character of the changes in sedimentation rates at ~5380 cal. yr BP. The abrupt upturn of sedimentary discharge, therefore, suggests that what is recorded by the irreversible fourfold increase in sedimentation rate is a long-lasting change, and should rather be discussed in the light of other factors, namely human impact, possibly under the influence of a weakening Monsoon regime (e.g. Clift et al., 2012; Gupta et al., 2006; Kessarkar et al., 2013; Rajendran, 2013; Rashid et al., 2011). Among the human factors, we suggest that the most important is farming, namely agriculture and pastoralism, and that the trigger was the beginning of connections with Mesopotamia.
The impact of climate on the development of Indian societies
Attempts at reconstructing the rainfall history of the Indian summer monsoon show contrasting records from the north to the south of India during this period (see Achyuthan et al., 2016; Veena et al., 2014). For Gupta et al. (2006), however, the hot and humid conditions of the Indian summer monsoon reached their extreme at the beginning of the Holocene (10–7 ky BP), after which a gradual weakening is observed. During this period, rivers, such as the Indus, swell with water, which allows the development of agriculture and pastoralism. As the Indian summer monsoon weakened, a drier phase began around 5 ± 1 ky BP with archeological records indicating that local populations were affected: dams, ponds and other structures allowing water to be controlled were built, the number of small settlements drastically increase in Himalayan Foothills on the plains of the upper Ghaggar-Hakra interfluve and mass migrations began in the East toward the plain of the Ganges (Dixit et al., 2018; Enzel et al., 1999; Giosan et al., 2012, 2018; Ponton et al., 2012; Possehl, 1997, 2002; Staubwasser and Weiss, 2006; Staubwasser et al., 2003). This phase of weakening monsoon coincides with periods of cooling in the north of the Atlantic Ocean suggesting a strong link between climate there and the Asian monsoon (Gupta et al., 2003). Other factors also impacted population dynamics. The rapid rise of sea level at 8.2 ky BP not only in response to rapid ice discharge in Greenland, but also melting of Antarctic ice sheets (Cronin et al., 2007), modified the coastline, in particular in the arable lowlands of the Indus and Narmada deltas, which may also have contributed to the migration of population by the submergence of agricultural crops before its stabilization around 5 ky BP. In the south of India, the Kerala coast experienced rise in sea level between 8 ky BP and 6 ky BP flooding parts of the mangroves prospering during this period. This was followed by a slight regression around 5 ky BP (Cronin et al., 2007) allowing emergence of the coastline. Although climate became arid and warm around 5–4 ky BP, several humid phases with increased precipitation linked to strengthening of South West Monsoon (SWM) (Ajaykumar et al., 2012; Limaye et al., 2014; Rajendran, 2013; Rajendran et al., 1989; Veena et al., 2014) occurred. A study of the high rainfall and chemical erosion record in Southwestern India well after the collapse of the Indus Valley civilization (Rajendran, 2013) seems to suggest new demographic and cultural development.
Different climatic events are thus concomitant with the event recorded in the present core. A significant weakening of the monsoon took place at about 6–5.5 ky BP (Gupta et al., 2003, 2005; Sarkar et al., 2000; Thamban et al., 2007, 2001) This event is associated with a global climate transition associated with a re-reorganization of atmospheric and oceanic circulations (Mayewski et al., 2004; Wanner et al., 2008) and is concomitant with the onset of more arid conditions and a contraction of lakes across subtropical Africa (e.g. Gasse, 2001; Gasse and Van Campo, 1994). A mid-Holocene dry phase (5–4 ky) was also recorded in the Indian subcontinent and coastal marine sediments (e.g. DeMenocal et al., 2000; Fleitmann et al., 2007; Goodbred and Kuehl, 2000; Gupta et al., 2003, 2006; Naidu and Malmgren, 1996; Sirocko et al., 1993; Staubwasser et al., 2003; Sukumar et al., 1993; Von Rad et al., 1999). All these events, however, are climatic excursions that do not qualify as major irreversible climatic changes that would result in a long-term shift in erosion regime.
The spread of agriculture
If the sudden increase in sediment accumulation rate is not a direct result of climatic or oceanic events, it may reflect a human cause of regional significance, whether this human impact may indirectly be triggered by climatic or environmental factors. Hints of trade between Mesopotamia, notably Sumer, and the Indus Valley already appears in the third millennium BC. Exchange between the two cultures has been seen as a positive factor for the emergence of the Harrapan civilization in Pakistan and the northwestern part of India (Dales, 1977; Fuller, 2006; Khol, 2007). On the Kerala coast, the first signs of Muziris, an ancient seaport and urban center believed to have been located close to Pattanam (10°N 76°E) (Gurukkal and Whittaker, 2001; Shajan et al., 2004), starts from early 5 ky BP, when Babylonian, Assyrian and Egyptian merchants sailed to the Malabar Coast in search for spices (Kunnappilly, 2018). In the Levant and Mesopotamia, abrupt drops in humidity have been advocated at 5.2 ky BP (Bar-Matthews and Ayalon, 2011; Weiss, 2000). Regardless of the uncertainties on the origin of drought events (Kushnir and Stein, 2019), they should induce agriculture to introduce more resistant crops, notably with tilled fields of wheat, barley and millet replacing rice paddies. In chronological order, wheat and barley culture, then sheep herding for wool production and goat herding for milk developed between 6000 BP and 5000 BP in Mesopotamia. By the middle of the Bronze Age, they spread to the Indus Valley (Khol, 2007). Winter crops of barley, wheat and millet complemented summer rice and cotton crops until the well-known dry period beginning around 5–4 ky BP. As winter crops are associated with plowed agriculture fields and grazing and trampling of the soil by animals, and perhaps with the use of fertilizers leading to soil acidity, croplands know since this period a rapid runoff of rainfall causing their destabilization.
The impact of agriculture and grazing
In Rajasthan, crops appeared before the emergence of the Harappan civilization (before 4500 cal. yr BP), in contrast to the region of Gujarat (NW of India) where they were delayed until the Harappan mature phase (4500–4000 cal. yr BP) (Fuller, 2006). Although rice seems to have developed ca. 6000 years ago in the Ganges plain, the introduction of rice as a staple from Harappa centers seems to have happened in the early third millennium (Fuller, 2006). Contrary to Rajasthan, the Gujarat region does not appear to have known peri-annual river irrigation. Although grains of rice have been observed in the northwest of India during the Chalcolithic (Fuller, 2006), they were few relative to grains of barley and millet. In the south and the center of India, the crop composition was slightly different because of the influence of the monsoon which allowed development of plant millets, pulses and other species (wheat and barley). Dogs were the first animals to be bred in the south and southwest of India, then cattle, goats and sheep followed (Allchin and Allchin, 1997; Fuller, 2006; Gupta, 2004). In the south of the Deccan and Gujarat region, cattle dominate and sheep and goat make up a smaller proportion of the animal husbandry (Fuller, 2006). As agriculture expanded on lands around the Arabian Sea, it had an impact on erosion. Montgomery (2007) showed that the rate of soil loss by conservative agriculture (terraces such as rice paddies) was almost exactly compensated for by the rate of soil formation. However, when tillage was adopted, as for the culture of wheat and barley, the net loss of soil (diminished from soil production) was increased by up to two orders of magnitude, which is much larger than the observed increase in sedimentation rate. Grazing sheep and goats wear out the vegetation, break the vegetal cover down by trampling and greatly increase soil erosion (Evans, 1998). Newly colonized land in Argentina, Australia, the United States and New Zeeland show the negative impact of grazing on soil preservation. Evidence of herding sheep and goats in India in the sixth millennium is strong (Meadow, 1998). We, therefore, conclude that the observed rise in sedimentation rates at the foot of the continental slope is because of the introduction of tilling-based agriculture, thereby providing alternatives to rice as a main staple, compounded to an unknown extent by grazing animals. It is remarkable that the change in sedimentation rates approximately coincides with the major cultural changes and dynamic population migrations of the early Bronze Age and with the expansion of Indo-European languages and new farming practices.
Finally, an unknown factor is the introduction of organic fertilizers in the form of animal manure and human waste to compensate for soil erosion and make pastures more productive. It is well-established that nitrification of ammonia-rich fertilizer causes soil acidification and decreases the cation exchange capacity of soils, which in turn favors soil weathering, carbonate dissolution and cation loss (Barak et al., 1997; Rengel, 2003; Thamban et al., 2002). Soil acidification being most frequently inevitable in the agricultural process, which relies on organic fertilizers, it may increase the impact on erosion and therefore the release of terrigenous input into the Arabian Sea since the Bronze age.
Conclusion
The sedimentation rates and compositions presented here indicate some simultaneity between a strong and abrupt shift in sedimentation rates at ~5380 cal. yr BP and the development of tilling on lands surrounding the Arabian Sea in the Bronze Age. The geochemical trends observed on the present core suggest that changes in agricultural practice at that time resulted in enhanced chemical erosion. The development of human societies at the onset of the Bronze Age and their needs for stable sources of food and textile increased the terrigenous inputs to the Arabian Sea by a factor of four at site SK148/6. Since then, this high sedimentation rate has remained at steady-state.
Supplemental Material
FigS2modif – Supplemental material for The marine record of the onset of farming around the Arabian Sea at the dawn of the Bronze Age
Supplemental material, FigS2modif for The marine record of the onset of farming around the Arabian Sea at the dawn of the Bronze Age by Alexandra T Gourlan, Francis Albarede, Hema Achyuthan and Sylvain Campillo in The Holocene
Supplemental Material
Fig_S1 – Supplemental material for The marine record of the onset of farming around the Arabian Sea at the dawn of the Bronze Age
Supplemental material, Fig_S1 for The marine record of the onset of farming around the Arabian Sea at the dawn of the Bronze Age by Alexandra T Gourlan, Francis Albarede, Hema Achyuthan and Sylvain Campillo in The Holocene
Supplemental Material
Fig_S3 – Supplemental material for The marine record of the onset of farming around the Arabian Sea at the dawn of the Bronze Age
Supplemental material, Fig_S3 for The marine record of the onset of farming around the Arabian Sea at the dawn of the Bronze Age by Alexandra T Gourlan, Francis Albarede, Hema Achyuthan and Sylvain Campillo in The Holocene
Supplemental Material
Table_S1 – Supplemental material for The marine record of the onset of farming around the Arabian Sea at the dawn of the Bronze Age
Supplemental material, Table_S1 for The marine record of the onset of farming around the Arabian Sea at the dawn of the Bronze Age by Alexandra T Gourlan, Francis Albarede, Hema Achyuthan and Sylvain Campillo in The Holocene
Supplemental Material
Table_S2 – Supplemental material for The marine record of the onset of farming around the Arabian Sea at the dawn of the Bronze Age
Supplemental material, Table_S2 for The marine record of the onset of farming around the Arabian Sea at the dawn of the Bronze Age by Alexandra T Gourlan, Francis Albarede, Hema Achyuthan and Sylvain Campillo in The Holocene
Supplemental Material
Table_S3 – Supplemental material for The marine record of the onset of farming around the Arabian Sea at the dawn of the Bronze Age
Supplemental material, Table_S3 for The marine record of the onset of farming around the Arabian Sea at the dawn of the Bronze Age by Alexandra T Gourlan, Francis Albarede, Hema Achyuthan and Sylvain Campillo in The Holocene
Supplemental Material
Table_S4 – Supplemental material for The marine record of the onset of farming around the Arabian Sea at the dawn of the Bronze Age
Supplemental material, Table_S4 for The marine record of the onset of farming around the Arabian Sea at the dawn of the Bronze Age by Alexandra T Gourlan, Francis Albarede, Hema Achyuthan and Sylvain Campillo in The Holocene
Footnotes
Acknowledgements
The sediment cores were collected during the cruise ‘Sagar Nidhi’ organized by NIOT, Chennai and Institute of Ocean Management, Anna University Chennai. This research was funded by UGA, ISTerre and the INSU program ‘SYSTER’. The authors thank Florent Arnaud-Godet for help in dissolving the samples and Janne Blichert-Toft for English editing. Two anonymous reviewers were particularly constructive and helped improve the manuscript significantly.
Author contributions
AG, FA, H A designed research; AG and FA performed research; AG, SC and H A analyzed data; and AG, FA, H A wrote the paper.
Funding
The author(s) received the following financial support for the research, authorship, and/or publication of this article: Funded by UGA, ISTerre and the INSU program ‘SYSTER’.
Supplemental material
Supplemental material for this article is available online.
References
Supplementary Material
Please find the following supplemental material available below.
For Open Access articles published under a Creative Commons License, all supplemental material carries the same license as the article it is associated with.
For non-Open Access articles published, all supplemental material carries a non-exclusive license, and permission requests for re-use of supplemental material or any part of supplemental material shall be sent directly to the copyright owner as specified in the copyright notice associated with the article.