
Abstract
Imaging of charcoal particles extracted from lake sediments provides an important way to understand past fire regimes. Imaging of large numbers of particles can be time consuming. In this note we explore the effects of subsampling and extrapolation of area on estimates of sum charcoal area, using resampling of real and simulated data sets and propose a protocol in which all particles are counted with only the first 100 encountered being imaged. Extrapolated estimates of sum total area of charcoal for 40 real samples were nearly identical to actual values, and error introduced due to subsampling was low (Coefficient of variation <0.2) for all but samples originally containing fewer than 50 particles. Similarly, error was low for simulated data (CV <0.02). Extrapolation provided better estimates of charcoal area than did a regression-based approach. Our results suggest that imaging a fixed number of pieces of charcoal (n = 100) and counting any additional pieces represents a time efficient way to estimate charcoal area while at the same time retaining useful information on particle size and shape
Introduction
Reconstruction of past fire regimes is critical to understanding biodiversity in ecosystems today as well as predicting future responses to on-going management practices and changing climate (Cochrane, 2019; Hudiburg et al., 2017; Meddens, 2018; Pausas et al., 2017; Power et al., 2018). Analysis of fire scars provides important information on the role of past fires in shaping ecosystems (Bakker et al., 2019; Leys et al., 2019; Swetnam and Baisan, 1996; Walker et al., 2017) but the fire scar record is limited to areas where trees grow, tree life span and/or preservation of dead wood.
Charcoal extracted from lake sediments, peatlands or soils provide a means to extend fire records back in time 100s to 1000s of years, even in areas where trees or wood is not present; over 340 papers have been published over the past 10 years that rely, at least in part, on charcoal analysis (12/2020 search of Web of Knowledge; Topic, ‘charcoal analysis’). Recent reviews and syntheses of the charcoal record include Marlon et al. (2013), Marlon et al. (2016), Itter et al. (2017), Halsall et al. (2018), Leys et al. (2018), Vachula et al. (2018), and Gosling et al. (2019).
While much can be learned about past fire regimes from simple counts of charcoal, image analysis of individual particles can provide information on area burned, distance to charcoal source areas and fuel types (Crawford and Belcher, 2016; Halsall et al., 2018; Leys et al., 2015, 2017; Umbanhowar and McGrath, 1998; Vachula et al., 2018). When image analysis is employed, charcoal concentrations are measured as the sum of particle area and/or volume.
Image analysis typically involves manual identification of individual particles of charcoal because of overlap in size and colour with partially decomposed pieces of organic matter, even if samples are treated with hydrogen peroxide or bleach. Large numbers of pieces of charcoal in a sample (+200), typical for productive grassland sites (Commerford et al., 2016; Umbanhowar, 2004), can slow imaging considerably.
In this note we explore if charcoal area can be accurately estimated by imaging a subsample of particles. For example, estimating sum charcoal area for a sample containing 1000 particles by multiplying area imaged for 100 pieces by 10. Our efforts detailed in this note are divided into three parts. First, we quantify error associated with subsampling of 40 samples, varying widely in number of particles, extracted from 16 different lakes. Second, we explore error associated with a sampling protocol in which a maximum of 100 particles is imaged. Since number of pieces in a sample is not known initially, 100 is chosen as a compromise between imaging too few pieces versus expending too much time on individual samples. For this analysis, we use simulated data sets ranging in size from 100 to 2000 particles but all having the same size-frequency distribution. Finally, we compare extrapolated and regression-based estimates of charcoal area (Tinner et al., 2006) for a previously published charcoal record from Sharkey Lake in Minnesota (Camill et al., 2003).
Methods
Charcoal particles were analyzed for 40 sediment samples extracted from 15 different lakes (Supplemental Table 1) located in grassland (7), deciduous forest (4) or forest-tundra (4). Sediment samples were 1 cm3, soaked in 10% KOH, and washed gently through a 180 µm sieve prior to image capture and analysis (Clark et al., 1998; Higuera et al., 2007; Kelly et al., 2013; Umbanhowar et al., 2009). Individual charcoal particles were imaged at ×20 using a camera attached to a dissecting microscope and either NIH Image or ImageJ software (https://imagej.nih.gov/nih-image/).
Summary statistics for charcoal extracted from 40.1 cm3 sediment samples.

Summary statistics were computed for each of the charcoal samples (Table 1). We also fitted frequency distributions to each of the original 40 samples using the fitdistrplus package (Delignette-Muller and Dutang, 2015) implemented in R (ver 3.6.2), including normal, log-normal, Weibull and Exponential distributions. Best fit was determined based on lowest AIC (Akaike’s Information Criterion).
Effects of subsampling on error were explored by drawing, without replacement, subsamples of varying size from each of 40 samples. Subsample sizes were calculated as percentage classes (2%–98%) of the original number of charcoal pieces in each sample and draws were repeated 2000 times for each class for each sample. For example, if a sample contained 250 pieces of charcoal, then a 2% subsample would contain five pieces while a 98% subsample would include 245 pieces. Estimated sum charcoal area for each percentage class was calculated as the mean sum of particle area, based on the 2000 draws, multiplied by the fraction of actual / subsampled number of particles. Error was described as the coefficient of variation (CV), calculated by dividing the standard deviation of the estimates of sum charcoal for each subsample class by actual sum area (based on entire sample). Percent of error removed was also calculated as 100 *(1-CV of each subsample class/max CV for each sample).
We created simulated charcoal samples ranging in number from 100 to 2000 pieces. We used these simulated data to explore error associated with a sampling protocol in which a maximum of 100 particles are imaged, remaining particles counted and total area estimated as described above. A log-normal function (as implemented in R) was used to generate the simulated charcoal data based on which distribution provided the best fit to the 40 samples (Table 1). Error was quantified as the CV as described above.
To further explore our subsampling strategy, we reanalyzed charcoal samples (n = 38) extracted from Sharkey Lake, located in the Big Woods in southern Minnesota (Camill et al., 2003). We compared estimates of charcoal area based on (a) imaging of all particles (109–1000 pieces in a 1 cm3 sample), (b) extrapolation from imaging of the first 100 pieces encountered in each sample and (c) regression of particle number vs sum charcoal area (Tinner et al., 1998) based on a subset (n = 10) of the samples.
Results and discussion
Lake sediment charcoal samples ranged in number from 11 to 367 pieces with a sum area of 0.8–58.9 mm2 (Table 1). Particle size distributions were highly right skewed (Table 1), and the log-normal distribution provided the best fit for 37 of 40 samples based on AIC values. While less frequent, the largest 5% of particles contributed ~25% of sum charcoal area (Figure 1). These larger particles are likely dispersed over short distances (Clark et al., 1998; Vachula et al., 2018). Oris et al. (2014) found that shifts to larger particles likely indicated more local fires although differences in particle shape complicate relationships between size and dispersal distance (Vachula and Richter, 2018). The disproportionate contribution of large pieces to sum area likely explains the link between charcoal area and distance to fire (but see Tinner et al. (2006) for example of long distance transport of larger particles) and may obviate the need to work with smaller particle sizes contrary to Leys et al. (2017).

Charcoal area as a percent (mean ±1 SD) of sum area as a function of particle size quantiles. Data is based on 40 charcoal samples extracted from 15 different lakes.
Estimates of sum charcoal area were virtually identical to original values (typically within 1%).CV of estimates was less than 0.8 (Figure 2a) for the 40 samples, suggesting that extrapolation from subsamples is a useful approach to charcoal analysis. Percent error removed increased rapidly to 75% when subsample size reached 30% of original sample size (Figure 2a). Average CV (across all percent subsamples) was greatest for samples with fewer than 50 pieces (Figure 2b). This is likely due to an increased likelihood of missing large pieces with taking small subsamples from initially small samples. The proposed fixed maximum imaging sample size of 100 largely avoids this problem by including all pieces in small samples. Larger subsample sizes are possible but represent more time at the scope with likely little gain in terms of reduced error.
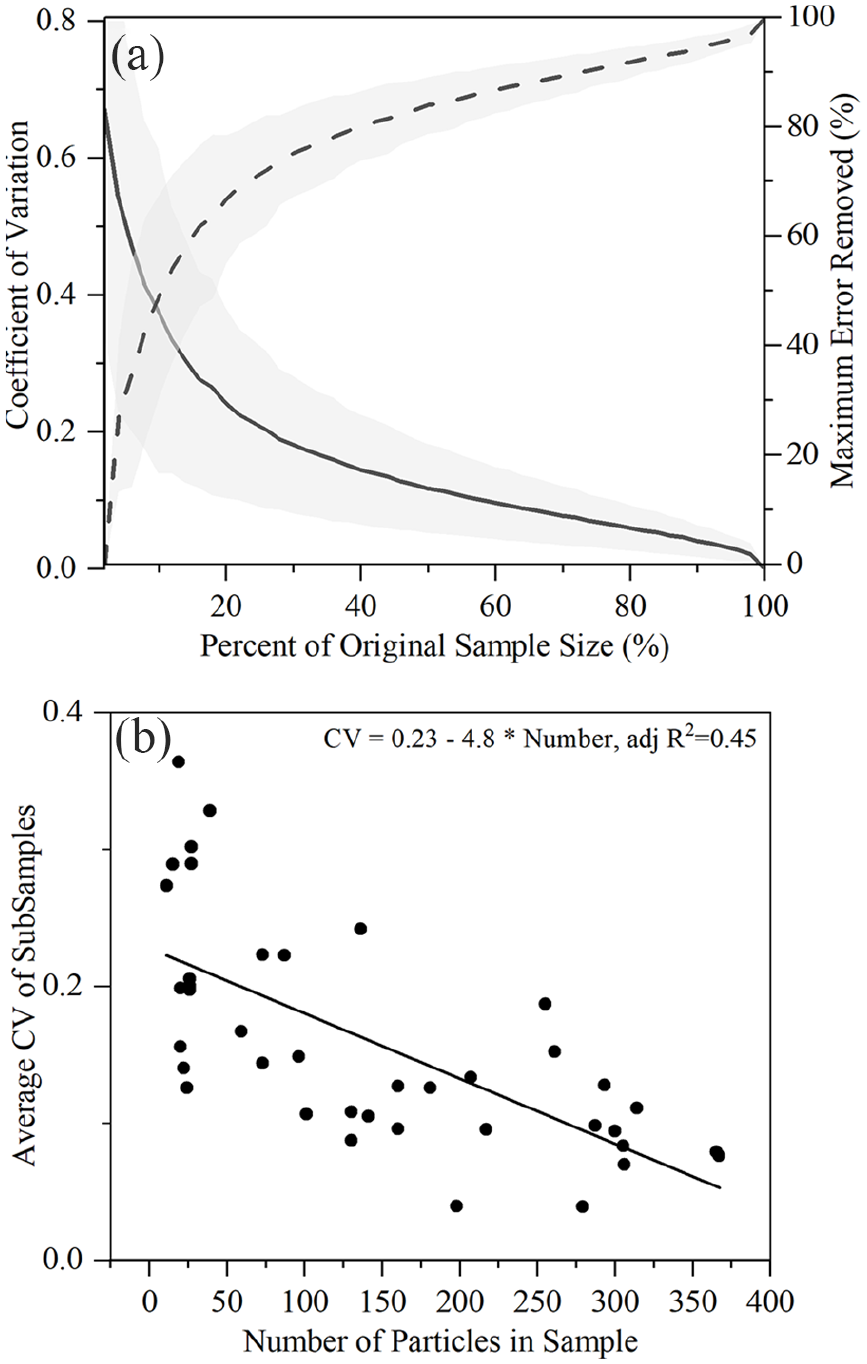
(a) Coefficient of variation (solid line) and percent Maximum error removed (dashed line) as functions of relative subsample size (% of original number of particles in sample). Error envelopes represent ±1 SD of the mean. (b) Average coefficient of variation of subsamples versus number of charcoal particles in original sample. N = 40 data sets.
Error for estimates of charcoal area based on fixed subsamples of 100 increased as the size of the simulated data increased from 100 to 2000 (Figure 3). But error remained low (CV <0.05) and increased only slightly as the size of the data set being estimated increased. That error does not increase linearly with sample size suggests that a subsample of 100 pieces may work with even higher concentrations of charcoal like the >3000 pieces cm–3 reported by Colombaroli et al. (2014). If error associated with 100 pieces was unacceptably high, a larger subsample, 300 for example, would still represent less work than imaging all pieces and provide considerable time savings.
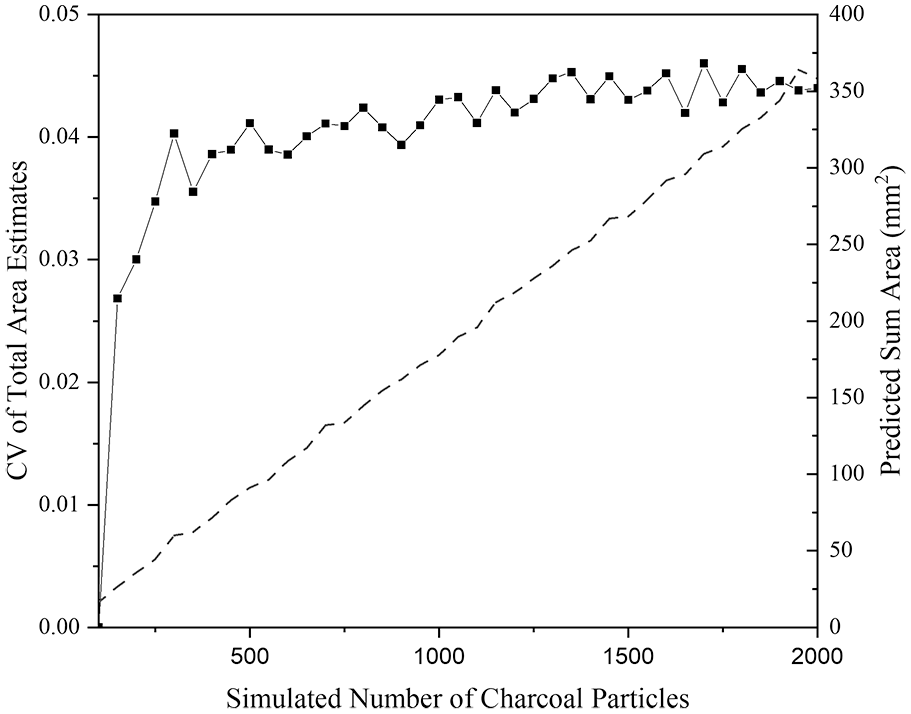
Coefficient of variation (solid line) and predicted sum of area (mm2, dashed line) for simulated charcoal data ranging in size from 100 to 2000 pieces based on a log normal size-frequency distribution (log mean = −2.88, log SD = 0.76). CV is based on the SD of estimates using a fixed sub-sample of 100 pieces.
For the Sharkey Lake samples, sum areas extrapolated from imaging of the first 100 pieces were on average within 1% of measured area (Figure 4a). Regression-based estimates (Figure 4b) were similarly close but differences between actual and estimated charcoal areas were twice as variable as the extrapolated estimates (Figure 4a). Differences in the size-frequency distributions from sample to sample, especially the number and size of the largest pieces, are likely key to understanding the greater variability of the regression approach. In the Sharkey data set, the average surface area of particles in the 95th percentile ranged from to 0.22 to 0.77 mm2 across samples, and these largest particles represented 13–35% of total sum area.
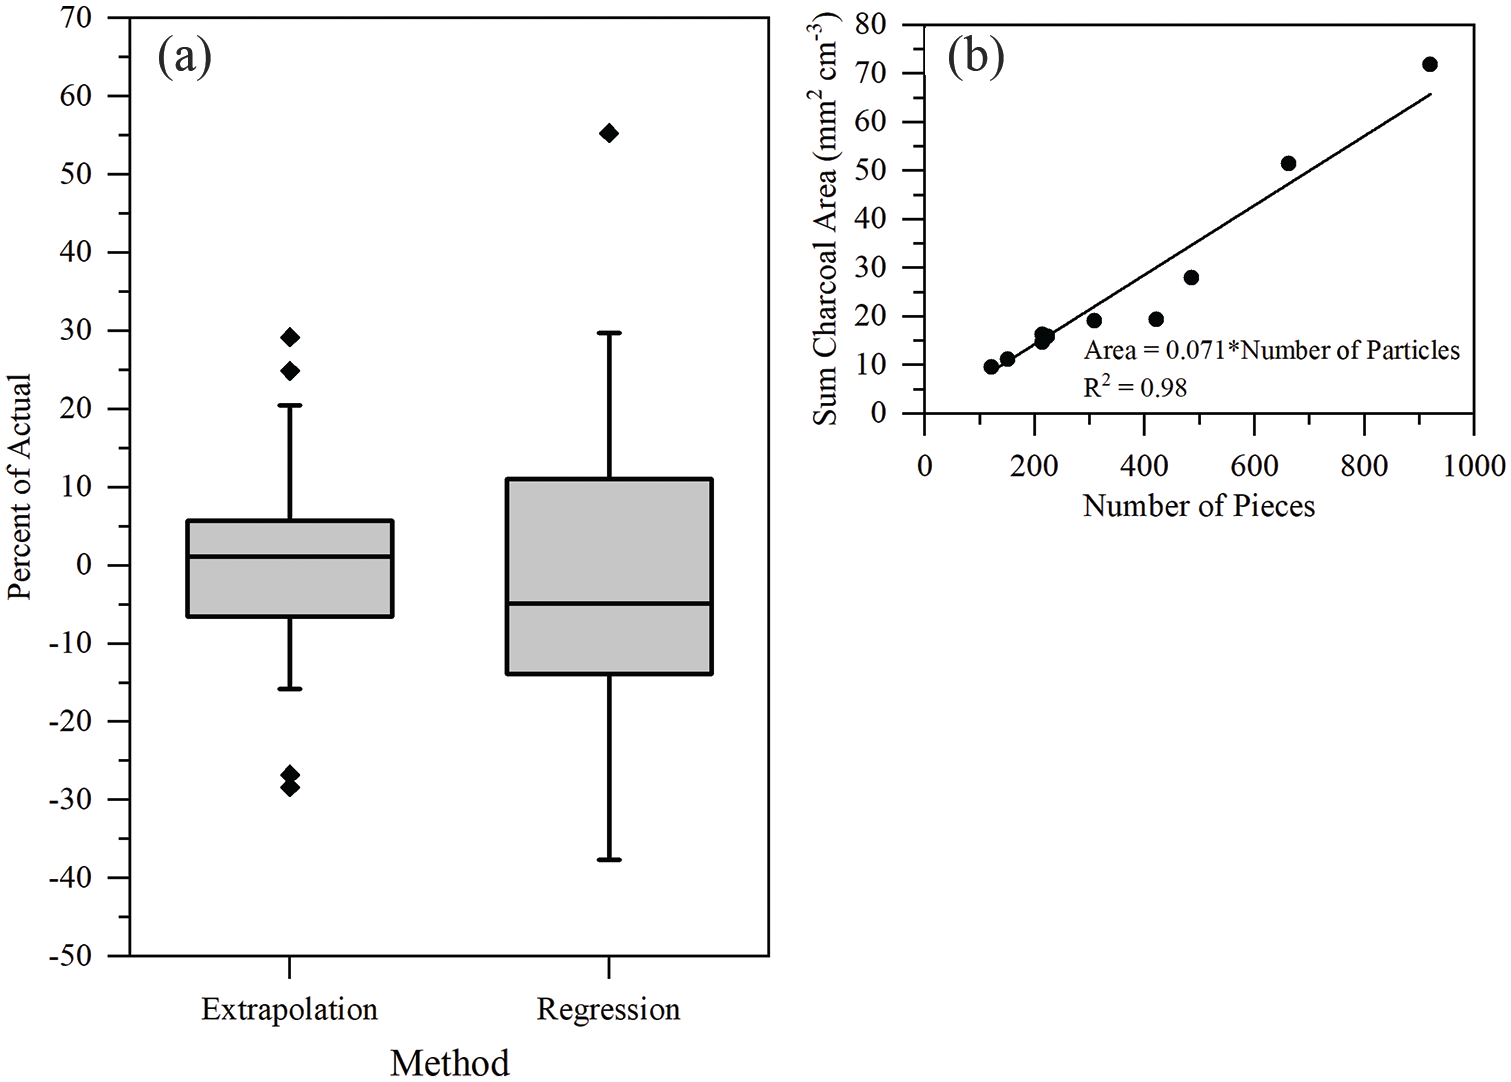
(a) Box plots for percent difference between actual and estimated sum charcoal area based on extrapolation or regression for Sharkey Lake (n = 38). Extrapolation was based on imaging 100 pieces/sample. (b) Total area vs number of pieces for 10 samples with equation used to estimate area.
Our results suggest that imaging a fixed maximum number of pieces of charcoal (n=100) and counting any additional pieces represents a time efficient way to estimate charcoal area as well as retaining sample-specific information on particle size (and shape) critical to interpretation of the charcoal record. Since this approach is based upon each sample’s particle size distribution it should work across a range of fuel types although its utility may be limited in the case of soil or peat samples where charcoal transport distances are essentially zero and extremely rare, but large (orders of magnitude), pieces of charcoal represent most of the measured charcoal area (P. Camill pers. comm.).
In many ways, use of a fixed maximum number of particles to be imaged mirrors standard sampling protocols employed for quantification of pollen and diatoms. Error is introduced as a result of extrapolation, but our results suggest that this error is small, especially when compared to differences in charcoal concentrations described between cores within the same lake or even samples taken from the same depth within the same core (Magne et al., 2020; Mustaphi et al., 2015).
Supplemental Material
sj-pdf-1-hol-10.1177_09596836211003226 – Supplemental material for Improving the efficiency of sediment charcoal image analysis
Supplemental material, sj-pdf-1-hol-10.1177_09596836211003226 for Improving the efficiency of sediment charcoal image analysis by Charles E Umbanhowar and James A Umbanhowar in The Holocene
Footnotes
Acknowledgements
We wish to thank Carole Adolf and an anonymous reviewer for many helpful questions and suggestions which greatly improved this manuscript.
Funding
The author(s) received no financial support for the research, authorship and/or publication of this article.
Supplemental material
Supplemental material for this article is available online.
References
Supplementary Material
Please find the following supplemental material available below.
For Open Access articles published under a Creative Commons License, all supplemental material carries the same license as the article it is associated with.
For non-Open Access articles published, all supplemental material carries a non-exclusive license, and permission requests for re-use of supplemental material or any part of supplemental material shall be sent directly to the copyright owner as specified in the copyright notice associated with the article.