



Abstract
The natural vegetation has been substantially changed over the last millenium, especially from forest to agricultural areas in Europe. To study the effects of deforestation on carbon and climate system, it is essential to construct spatially precise maps in forest cover. The current representative historical forest data sets are either derivatives of agricultural datasets or are produced based on the deforestation-population relationship. Almost no attempts have been made to use the inherently linked relationship between deforestation and cropland expansion that has run through Europe for millennia. This study created an approach based on the relationship between cultivation intensity and forest fraction to reconstruct forest cover changes in central and southeast Europe from AD 1800 to 2000 by the following steps: (1) To develop the spatial relationship curve (spatial resolution is 1°) between the “cultivation intensity (0–100%)” and the “forest fraction (0–100%)” derived from modern land cover datasets; (2) To generate the national-scale cropland data based on historical records from AD 1800 to 2000, and to allocate them to a 1° pixel; (3) To reconstruct the forest cover using the aforementioned relationship curve and the historical gridded cropland database. The results show that: (1) The forest fraction in central and southeast Europe decreased from 38.4% in AD 1800 to 27.0% in AD 1900, and then increased to 32.5% in AD 2000. (2) In AD 1800, large areas of forests can be primarily found in Luxembourg, Netherlands and Belgium, the south of France, the south of Germany, the Alps region, Poland, and the majority of the Balkans. (3) Throughout the 19th century, the entire region was generally subjected to deforestation, with large areas of forest coverage only being preserved in the Alps and the western and southern Balkans after 100 years of exploration. (4) The forest coverage in most of the study regions increased again at the end of the 20th century.
Introduction
Humans have extensively altered the natural landscape since the onset of agriculture for expanding the area used as cropland at the expense of forest and other natural vegetation, especially in the continents of Europe (Michael, 2006) and Asia (Yang et al., 2019a) over their long history of intensive human development. Forest is the major biome in Europe, and it has already been revealed that the anthropogenic land cover change (ALCC) caused by deforestation has had a profound influence on the soil characteristics, atmospheric components (e.g. greenhouse gases), and the climate system as well as on local human societies (Bouwman et al., 2013; Chambers and Artaxo, 2017; Eckmeier and Gerlach, 2012; Gatti et al., 2021; Houghton et al., 2012; Khanna et al., 2017; Lawrence and Vandecar, 2015; Ney et al., 2019; Pielke et al., 2011; Pongratz and Caldeira, 2017; Staal et al., 2020; Sterling et al., 2013; Strandberg and Kjellström, 2019). In particular, since the Industrial Revolution (AD 1750), the impacts of anthropogenic deforestation on terrestrial ecosystems and climate system have increased dramatically as a result of a strong increase in population. Large-scale deforestation and associated cropland changes also reflect the combined impacts of both natural environment changes and socio-economical activities (Chen et al., 2021; Yang et al., 2019b). To quantify these interactive effects spatially and temporally, it is essential to reconstruct the explicit forest cover changes over the last 200 years.
For the advent of remote sensing since the middle of the 20th century, satellite imagery has been applied as an important approach for assessing forest cover (Estel et al., 2015; Fuchs et al., 2015; Matasov et al., 2019; Wulder et al., 2012). Not only can it present the shifts in forest types and amounts but also specify where the change has occurred. However, satellites cannot distinguish natural from anthropogenic drivers of forest cover change, and the short time span covered by satellite imagery hinders the reconstruction of forest cover before the middle of the 20th century (Houghton et al., 2012; Jepsen et al., 2015; Kuemmerle et al., 2015; Munteanu et al., 2015). To reconstruct forest cover change in earlier time periods, a lot of efforts were made by employing various methods at the global and regional scales.
At the global scale, the methods are classified into two categories. On the one hand, Dynamic Global Vegetation Models (DGVMs) are commonly used to simulate the climate-induced vegetation distribution, but studies have shown that the vegetation simulations are strongly inconsistent among different DGVMs (Cramer et al., 2001). In addition, land-use related forest cover changes in DGVMs stem from land-use forcing such as LUH2. However, DGVMs cannot be used to predict forest cover changes accounting for land-use, unless the land-use is directly fed into the DGVMs as input. On the other hand, based on the historical inventory data and model assumptions, several representative global forest/woodland data sets spanning over centuries or even milleniums have been developed. For example, Ramankutty and Foley (1999) firstly generated spatially gridded reconstructions of cropland over the past 300 years by combining modern cropland pattern information derived from satellite images with historical data on agriculture. Later they constructed the geographically explicit maps of forested areas since 1700 by overlying the aforementioned cropland dataset over a potential vegetation dataset. Pongratz et al. (2008) synthesized a global database of natural land cover fraction (forest/woodland) for the last millenium using datasets of agricultural areas (cropland and pasture) from Ramankutty and Foley (1999) and HYDE database (Klein Goldewijk, 2001) with slight adjustments and overlaid them with a natural vegetation map. Kaplan et al. (2009, 2011) built a dataset of global deforestation for the historical period (8000 BP–AD 1850), in which the nonlinear relationship between population density and forest clearance was developed to reconstruct the area of losing forest land under deforestation using the historic population density from 8000 years ago to Pre-industrialization. However, different model assumptions and spatial allocation algorithms implemented in these forest datasets have caused large inconsistencies regarding the past extent and area of forest cover, especially at regional scales (Klein Goldewijk et al., 2011).
On a regional scale, a number of historical natural vegetation or forest/woodland cover datasets have been reconstructed using mostly statistics and historical maps, for example, in China (He et al., 2015; Li et al., 2022; Ye et al., 2009), Eastern Ghats in India (Ramachandran et al., 2018), Sudety mountains in Poland (Szymura et al., 2018), Italy (Camarretta et al., 2018), Switzerland (Leyk et al., 2006; Loran et al., 2016, 2018), the Carpathians (Kaim et al., 2016), the Prignitz region in Germany (Wulf et al., 2010), Czech Republic (Skaloš et al., 2011), Flanders in Belgium (Deckers et al., 2005), the Eastern Canada (Boucher et al., 2009), and the USA (Hanberry and Abrams, 2018; Rhemtulla et al., 2009). Pollen data has also been widely used to reconstruct historical vegetation distributions, although the distributions are generally limited to local scale or discontinuous (Fyfe et al., 2015; Gaillard et al., 2010).
The regional forest/woodland cover data sets can be used to assess and improve the accuracy of global forest datasets. However, almost no attempts have been made in previous work on reconstructing historical forest cover in Europe to use the inherently linked relationship between deforestation and cropland expansion that has run through Europe for millennia. Hence, this study aims to develop a new method based on the above relationship to reconstruct forest cover, using central and southeast Europe as a case study. First of all, on a 1 degree spatial resolution, we established a nonlinear relationship between cultivation intensity and forest fraction derived from modern land cover datasets. Then, the historical cropland dataset produced by the authors was used with this nonlinear relationship between cropland and forest cover to generate spatially gridded-based forest cover fractions for the historical period between AD 1800 and 2000 in the study area. Our implementation is based on the assumption that pastures have historically been preferentially established on former grasslands (mainly at the expense of natural grasslands) (Pongratz et al., 2008; Reick et al., 2013), so deforestation caused by pasture expansion is not yet taken into account.
Data and methods
Study area
The study area including 20 countries/regions is located in the central and southeast parts of the European continent (Figure 1). The topography of the study area is dominated by plains and mountains. High mountains are mainly distributed in the southern region, such as the Alps and the Carpathian Mountains extending eastward. In general, the climate in most of the central regions (the territory north of the Alps-Hungary border) is characterized primarily by moderately warm, frost-free summers and relatively cold winters, which promotes deciduous broadleaved trees like beech (Fagus sylvatica) and pedunculate oak (Quercus robur). Most of the southeastern region (Balkan countries) has a humid continental climate, and the vegetation types are temperate broadleaf and conifer forests that vary with altitude. Approaching the Mediterranean coastline, it is the dominant Mediterranean sclerophyllous tree species due to its typical climate characteristics of mild and rainy winters and dry and hot summers, as seen in the south of France (Koster, 2005; Lois-González, 2021). However, due to the strong influence of human activities in the past millenium, most of the natural vegetation has been destroyed by humans and changed into arable land or pasture. The virgin forest area was only preserved in some mountainous areas.

The study area of central and southeast Europe.
Research framework and input data
This study developed a model based on the modern relationship between the area of cultivated land and forest to reconstruct the historical forest extent and coverage. The fundamental aspects of this model are as follows:
To define the spatial extent of deforestation due to cropland (for cropland, the Food and Agricultural Organization (FAO) definition of “arable land and permanent crops” is adopted, and the former includes land under temporary crops, temporary meadows and pastures, and land with temporary fallow; the latter includes land cultivated with long-term crops that do not need to be replanted for several years, land under trees and shrubs producing flowers, and nurseries).
To establish a spatial relationship curve between the “cultivation intensity (0–100%)” and the “forest fraction (0–100%)” derived from modern land cover datasets (spatial resolution is 1° × 1°) within the extent of the deforested area. Here, the “spatial relationship” means the distribution of the pairs of cropland cover and forest cover.
Literature sources of historical cropland/forest fraction data on a national or sub-national scale are used to validate the applicability of the nonlinear curve for reconstructing the forest cover in the chronological dimension.
Historic cultivation intensity data on a
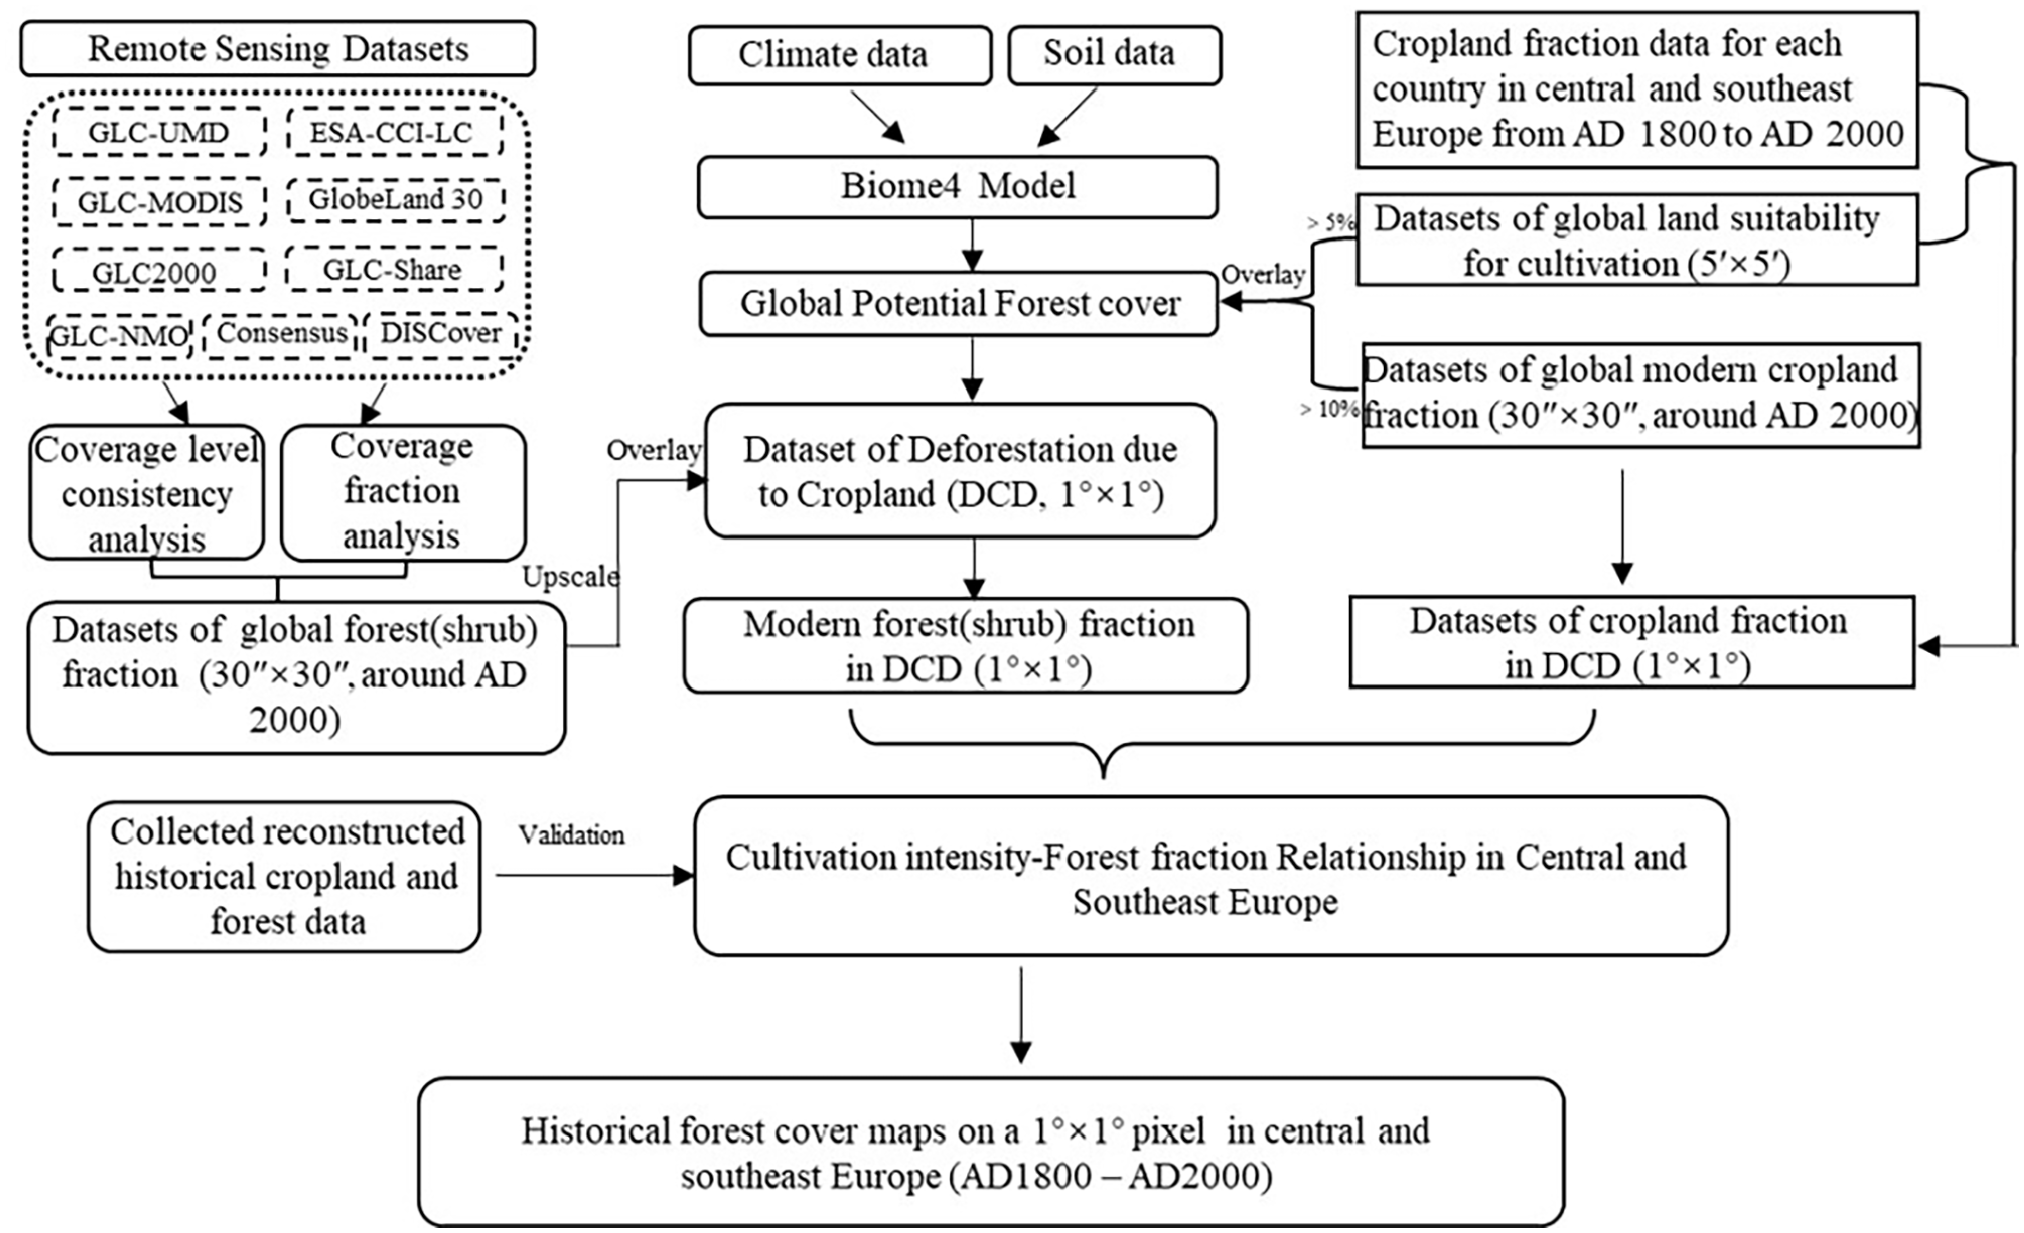
Applied steps for establishing a historical forest coverage reconstruction in central and southeast Europe on a 1° pixel (See Section 2.3, 2.4 and S1-2: Supplemental Materials, available online for explanations).
The data sets used in this study include, (1) a global 30″ × 30″ forest fraction data set around AD 2000 (AD2000 here is not a single year, but rather the period between AD 1992 and AD 2003. This is due to the fact that we developed a modern 30″ × 30″ percentage forest data sets that was fused with nine sets of satellite-derived land cover products spanning AD 1992 to AD 2003. The modern 30″ × 30″ percentage forest cover data set was fused based on multiple satellite-derived land cover products in order to avoid the uncertainty from each single land cover data set including some uncertainties for the classification, images interpretation, the possible an extreme year, and so on. The global land cover data from AD 1992 to AD 2003 were chosen rather than the data after AD 2000 for two reasons: First, more recent satellite-derived products are more affected by human activities, which can affect the accuracy of results when using them to reconstruct historical forest cover, that is the earlier the better for the historical reconstructions. Second, prior to AD1992, the spatial resolution of the global land cover dataset was low, and there was no available global land cover data with a spatial accuracy greater than 30″. See S1: Supplemental Material, available online for more information on the data set production process), (2) a global 30″ × 30″ cultivation intensity data set around AD 2000 (AD 2000 has the same meaning as above) (Zhang et al., 2019), (3) a 0.5° × 0.5° potential vegetation data set (See S2: Supplemental Material, available online for more details), (4) a global 5′ × 5′ dataset of global land suitability for cultivation (Zhang, 2021a), (5) a data set for verification (see 2.3.3 for more details), (6) a historical data set of cultivation fraction on a 1° pixel (see 2.4.1 and 2.4.2 for more details).
Construction and verification of the relationship between cultivated fraction and forested fraction
The data set of “cultivation-caused deforestation.”
The spatial relationship between cultivation intensity and forest fraction is highly interdependent within the deforested area which is caused by farming.
To identify the extent of deforestation, the following principles were given. (1) The potential vegetation type should be forest/woodland (including shrubs), but the modern land cover type is cropland (cropland is defined in this context as the proportion of cultivated area in a 30″ pixel which is greater than 10%). (2) Humans are assumed more likely to perform agriculture on the land suitable for cropland (the proportion of land suitability for cultivation in a 5′ pixel is greater than 5%). The detailed specific operations are: (1) To extract eight types of potential forest/woodland (including shrubs) biomes (temperate evergreen needleleaf forest, warm-temperate evergreen broadleaf & mixed forest, cool mixed forest, cool evergreen needleleaf forest, cold evergreen needleleaf forest, tropical xerophytic shrubland, temperate sclerophyll woodland, temperate evergreen needleleaf open woodland) from the potential vegetation data set (sub-database I); (2) to extract the grids with cropland fraction greater than 10% from global 30″ × 30″ fusion cropland dataset developed by Zhang et al. (2019) (sub-database II), and the grids with values greater than 5% from the global 5′ × 5′ land suitability for cultivation data set (sub-database III); (3) using the ArcGIS 10.6 software, to clip all sub-databases based on the study area and to scale them up to 1° × 1°; (4) to generate the deforestation data as a result of the Cropland Dataset (hereinafter, DCD) with 328 pixels by spatially overlaying all of the upscaled data sets.
Spatial relationship between “cultivation intensity and forest fraction.”
Based on the DCD, a total of 328 pixels of “cultivation fraction-forest fraction” were obtained by matching the modern cropland and forest fraction data sets. After removing the pairs of 38 abnormal values, which were mostly found in coastal areas, there are 290 valid pairs of values. Owing to the influence of specific climate and topographical conditions, the forest and cultivation intensity of the 12 pixels in the Alps is lower than that in other regions. To eliminate the disparity, this study modified the cultivation fraction of the 12 pixels by assuming that the primary forest fraction in one pixel was 100% before being affected by humans, and the proportion of deforestation (subtract the modern forest fraction from 100%) converted to cropland is equal to the proportion of modern cropland area in the total area of modern cropland plus forest. Equation (1) depicts the specific formula.
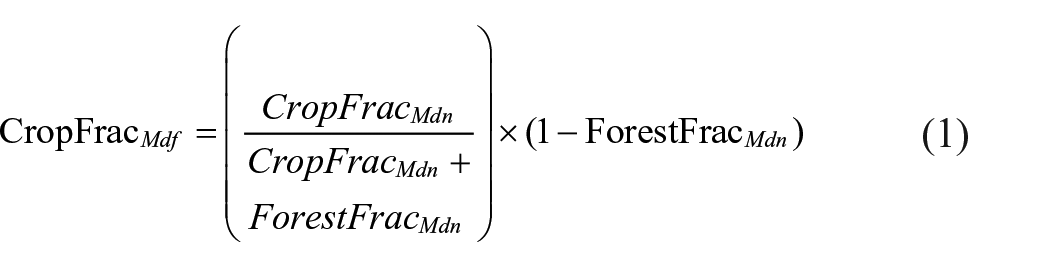
Here,
Finally, based on the principles that match common knowledge about the history of deforestation in the study area and that have a high correlation coefficient, both the exponential and binomial relationship curves were fitted using the OriginPro2021 software (Figure 3). Equations (2) and (3) are the equations for the negative exponential and binomial relationship fitting curves, respectively. The correlation coefficient of the negative exponential relationship curve (R = 0.81) is similar to that of the binomial relationship curve (R = 0.82). Both curves exhibit a non-linear trend in which the proportion of forests converted to cultivated land was lower in the early stages of deforestation than in the later stages. This phenomenon can be attributed to the fact that, while agricultural expansion is the biggest direct cause of deforestation, the cause of deforestation is not single, and the process of deforestation is not random. Deforestation was primarily used for non-farming activities such as road building and urbanization during the early stages of occupation. Road construction not only allows settlers to follow roads to previously inaccessible areas and complete the subsequent deforestation for cropland, but it also attracts more people to settle there. As the population grows, more and more forests are being replaced by arable land to meet the daily needs (Lindsey and Simmon, 2007; Malhi et al., 2014).


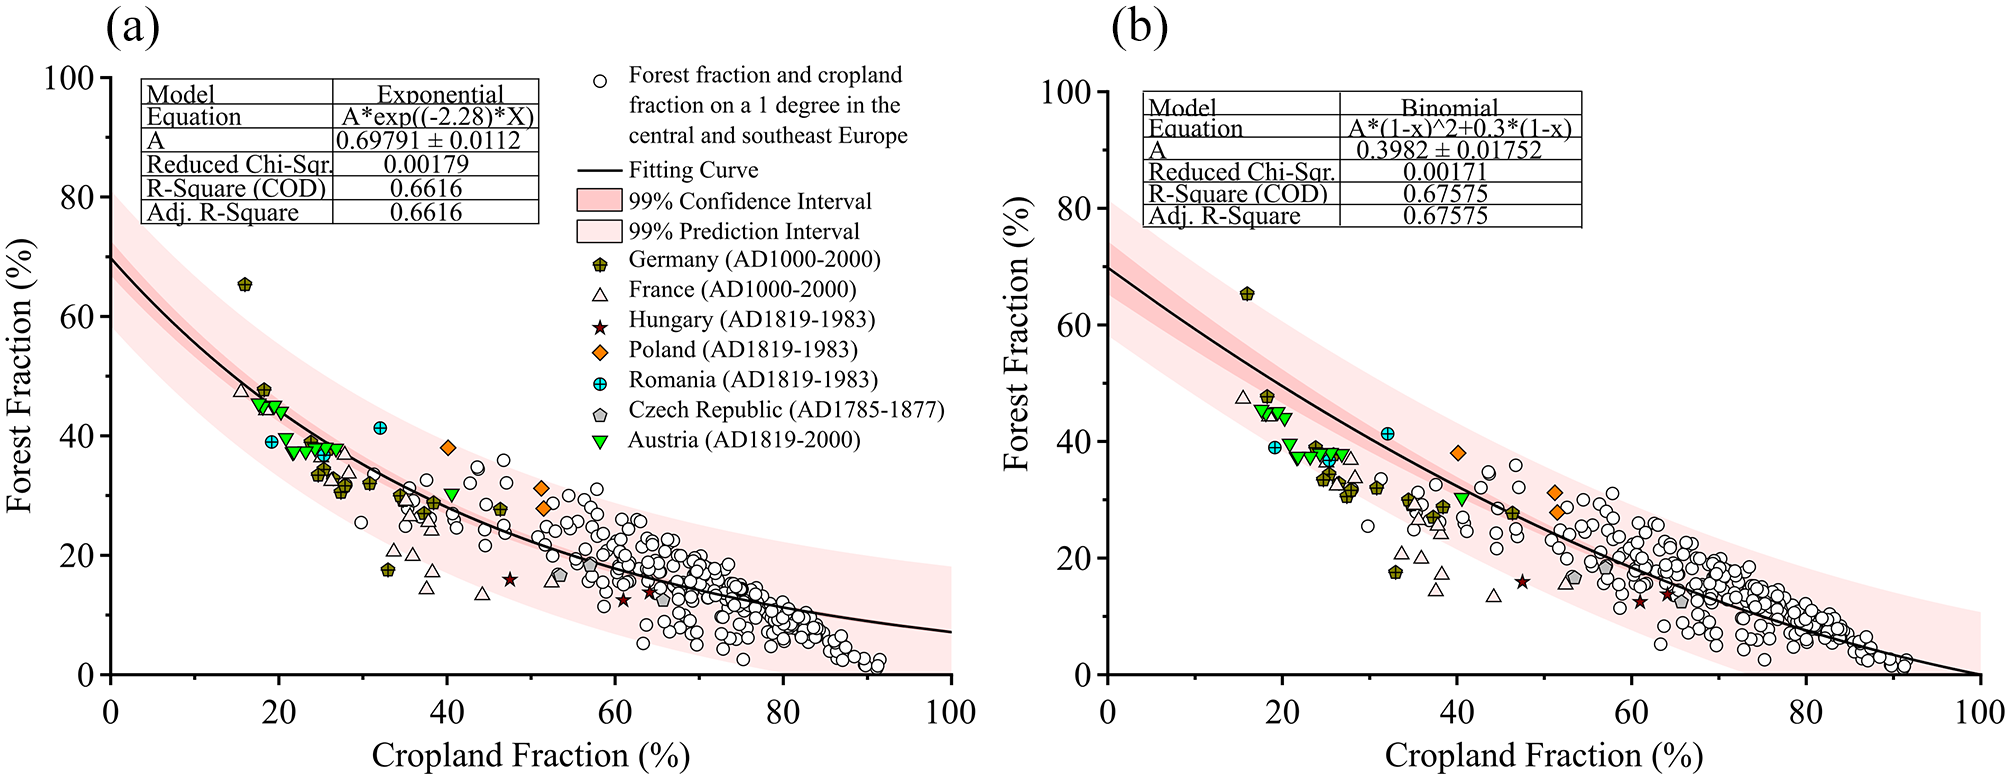
Modeled spatial non-linear relationship between cultivation intensity and forest fraction in central and southeast Europe. (a) negative exponential curve. (b) binomial curve.
Validation
To test the applicability of the exponential (equation (2)) and the binomial relationship curve (equation (3)) for reconstructing forest cover over the last 200 years and even the millenium, a validation data set of the pairs of the cropland and forest fractions, where the data are time points spanning centuries or even milleniums on the national or sub-national scale, was created by collecting data from published literature (Table 1). The additional information of the validation data set includes land cover type, area, period, and data sources. There are 56 pairs of samples covering more than 70% land area of the whole study area, which includes Germany, France, Hungary, Poland, Romania, the Czech Republic, Austria. The time span ranges from past millennia to a 100 years.
Data collected for the purpose of validating the applicability of the exponential (binomial) relationship in the chronological dimension.
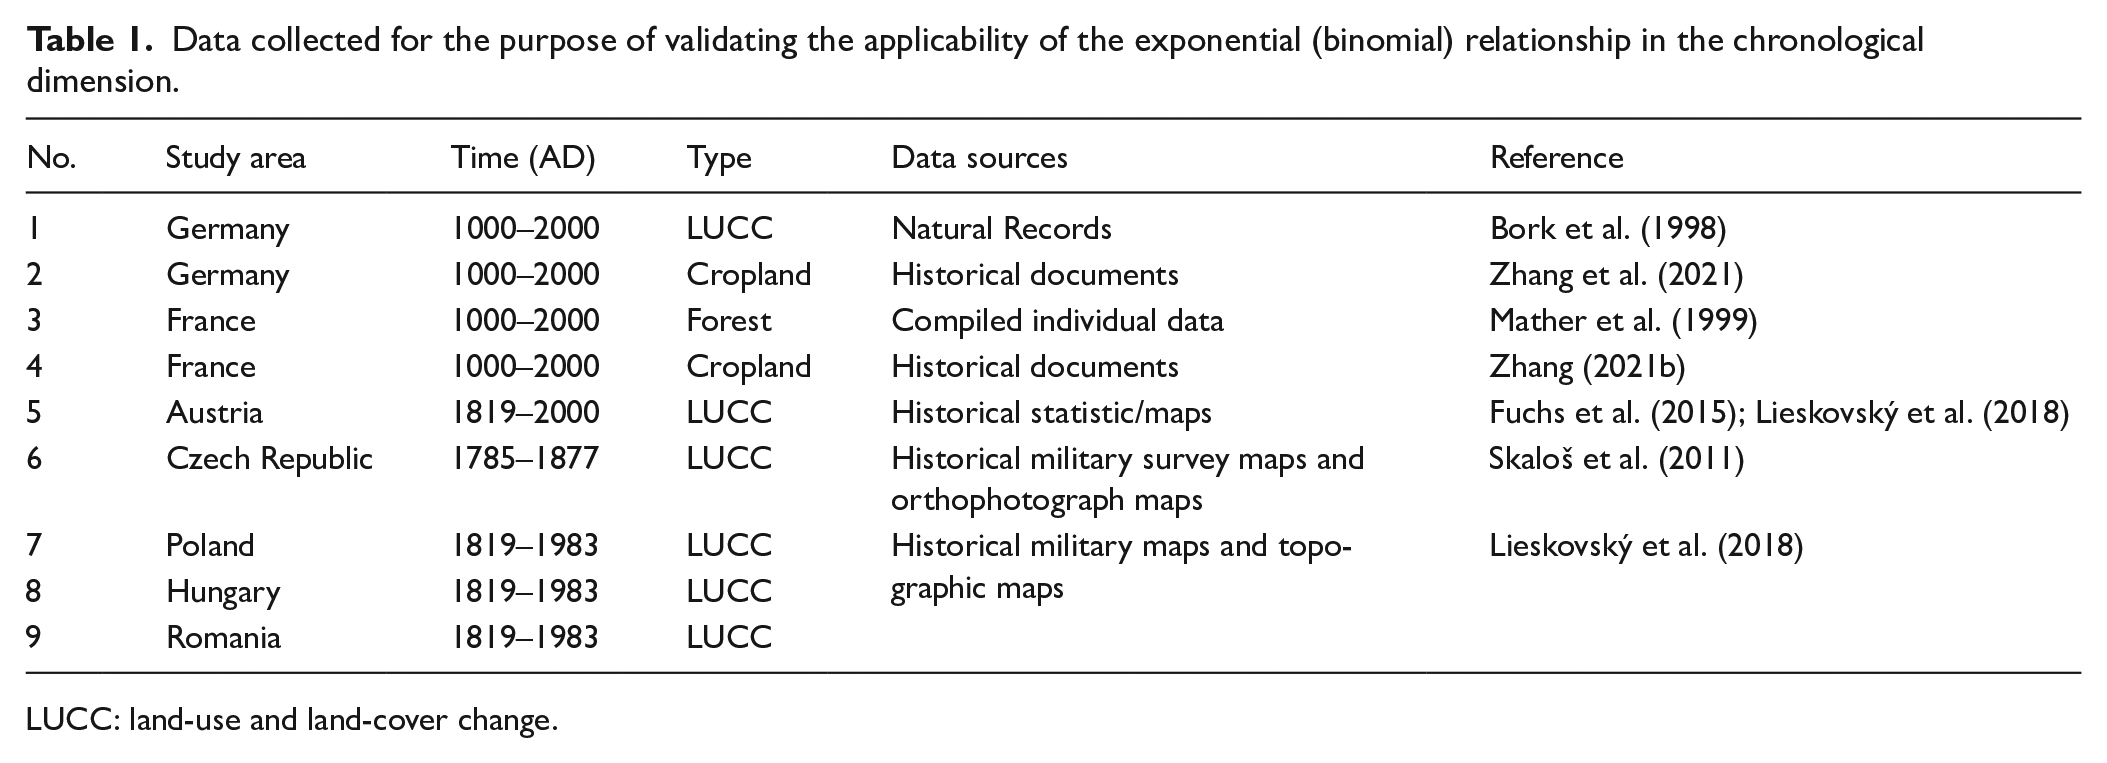
LUCC: land-use and land-cover change.
Almost 88% of the collected historical verification sample points (colored points in Figure 3) that can be considered true value falls within the prediction value range (light pink area in Figure 3a) with a 99% confidence level based on the exponential model, but only nearly 75% of them fall within the prediction value range (light pink area in Figure 3b) with a 99% confidence level based on binomial model’s prediction. As a result, this study believes that the negative exponential relationship curve (y = 0.7 × e(−2.28x)) is more reliable for describing the relationship between the forest fraction and the cultivation fraction over the last centuries or even millenium, and it is selected as the only curve for reconstructing forest fraction on a 1° pixel scale in central and southeast Europe over the last 200 years.
Production and gridded-allocation of country-based cultivation fraction data
The FAO statistic data for cropland area in Europe in AD 2000 was adopted (http://www.fao.org/faostat/en/#data/RL) in this study. Furthermore, we developed a method for integrating various indexes to produce a new set of historical cropland datasets based on multi-sourced data in Europe for the years AD 1800, 1850, and 1900. The materials and the methods used for cropland reconstruction are as follows.
The cropland data in AD 1900
Two sets of independent historical cropland or agricultural land statistic data were used for the reconstruction of cropland in Europe in 1900. They are official agricultural land area statistics for 1900 in Meyers Conversation Encyclopaedia of 1909 (hereinafter referred to as “MCE”) (Bibliographisches Institut, 1909) and agricultural land area statistics in Land and Labor in Europe in the Twentieth Century (hereinafter referred to as “LLE”) by Dovring (1965). There are disagreements between the two sets in cropland definition and statistical unit. For example, the cropland area in MCE includes orchards and agroforestry under not-modern administrative units; while in LLE contains agricultural land area which includes all rough pasture grazing and no forestry land area under modern boundaries. For comparison, in LLE, agricultural land area was converted into cropland data by subtracting MCE’s grassland, and cropland fractions in each old administrative unit of MCE were corrected to modern national-level boundaries using the land area weighting value assignment method based on historical subordination. Then correlation analysis was conducted on the two calibrated data sets. The result showed that among the 20 countries/regions in the study area, the two sets in 12 countries correlated well and could be replaced with each other. For these 12 countries, MCE data with cropland definition more similar to the modern cropland dataset we used in this study were adopted. For the remaining 8 countries/regions, the data were reconstructed based on the following two principles according to the difference in availability of source data: (1) adopted MCE data preferentially between LLE and MCE for the 6 countries/regions; (2) adopted existing research results for Switzerland and Hungary (Supplemental Table S2, available online).
The cropland data in AD 1850 and 1800
Three types of methods for reconstructing the cropland in European countries in 1850 and 1800 based on multi-source data are adopted. They are (1) adopting existing cropland data derived from historical statistics and research results; (2) quantitatively converting different cropland proxy indexes into cropland areas, including the change of average landholdings, and sow/yield ratio and the relationship between sowing area and cropland area; (3) interpolating the value estimated by the temporal or spatial trend. In the last case, temporal interpolation is assumed that the cropland area per capita in a country is less changed if without advancement of agriculture, and spatial interpolation is assumed that the change rate of cropland area per capita in a country is the same as its representative neighboring countries with similar development backgrounds (Supplemental Table S2, available online).
Gridded allocation algorithm of the historical cropland
The gridded dataset of cultivation intensity on a 1° resolution in central and southeast Europe of the past 200 years was generated from the data set of country-based historical cropland area by the model of land suitability for cultivation developed by Zhang (2021a). Zhang (2021a) identifies the factors that can effectively indicate land suitability for cultivation by calculating the correlation between the cultivation intensity and the physical geographic elements of climate, topography, soil, and NDVI, on the 0.5° × 0.5° resolution, and then creates the cultivation suitability data set. The model allocates the cropland based on the principle of “the higher suitable land for cultivation there is, the more cultivated land should be allocated.” The formula is depicted in equation (4).

Here,
Reconstruction of historical forest cover on a 1° resolution
Using the gridded data set of cultivation fraction over the last 200 years as the input data, this study reconstructed the forest fraction in central and southeast Europe on a 1° scale four time points (AD 2000, 1900, 1850, and 1800) based on the negative-exponential relationship between cultivation fraction and forest coverage described in equation (2).
Results
The cultivation-caused deforestation
The distribution of potential forest
According to the spatial distribution of potential vegetation based on the Biome4 model, the potential vegetation type in most areas of Europe should be forest, with the exception of high latitudes north of latitude 55° (mainly tundra) and southeast Eastern Europe (mainly grassland). This study extracted all forest layers (only considering whether it is a forest, not forest types) from potential vegetation dataset in the study area (Figure 4). The result shows that forest covered a large portion of the north area of the Alps, including France, Germany, Poland, the Czech Republic, and Slovakia, as well as the majority of the Balkan Peninsula in southeast Europe.

The distribution of potential forest, cultivation-caused deforestation regions, modern forest cover and the percentages of three levels forest cover cells in central and southeast Europe. (a) the distribution of potential forest. (b) cultivation-caused deforestation regions. (c) modern forest cover. (d) the percentages of three levels forest cover cells in central and southeast Europe).
The amount and distribution of modern forest in central and southeast Europe
The modern forest cover fraction is relatively high in the mountainous area and relatively low in the riverside area at a 5′ pixel scale(Figure 4c). The cells with a fraction of forest cover over 40% account for about 30% of the total amount. They are primarily concentrated in the central uplands and alpine mountains, including the uplands in western France and the plateaus in southern France; the Czech Republic; the Alps, the Pyrenees, the Carpathians and the Pindus in the western Balkans, etc. The forest cover cells with fractions less than 10% are approximately 34% of the total amount, which are mainly concentrated at the plain areas along the middle and lower reaches of the Garonne R., the Loire R., the Seine R., the Rhine R., the Weser R., the Elbe R., the Vistula R., and the Danube R, etc. The cells with 10%−40% forest cover fractions are about 36% of the total amount, which are primarily scattered around the areas with high forest fractions with hardly any discernible characteristics.
The history of “cultivation-caused deforestation” before AD 1800
The literature review showed, that the ratio of primary forest/woodland cover in Europe (except the countries in the Former Soviet Union) 2000 years ago was approximately 80%, but it is only about 30% at present (around AD 2000) based on our study results. This study shows that deforestation has been widespread in around 70% of central and southeast European regions (Figure 4b), with increased cropland cultivation being the primary cause of forest and woodland clearing.
Earliest “cultivation-caused deforestation” on a larger scale occurred during the time of the European classical period (1000 BC–AD 500). It first appeared along the Mediterranean coasts of southern Europe. Later, as population grew during the Greek and Roman periods, deforestation became more common. Around 200 BC, the Rome empire gradually expanded, bringing with it both immigration and deforestation, to the central and northern Balkans, Gaul (France), Spain, and the United Kingdom. However, the scale and intensity of deforestation were slight due to the relatively small population size. At that time, forests still cover approximately 80% of the land in Central Europe (Michael, 2006).
More severe deforestation started around 1000 years ago caused by a newly developed agricultural system in the eighth and ninth centuries (Medieval Agricultural Revolution). At the same time, the hotspots of cultivation-caused deforestation had shifted northward to the large areas with flat terrain and fertile soil in central Europe, including the basins along the Loire R., the Seine R., the Rhine R., the Elbe R., the Danube R. and the Bode plain. After the 11th century, Europe entered a two-century period of massive deforestation, particularly in France and Germany. It was not until the Black Death broke out in the 14th century when Europe’s population plummeted, a large amount of arable land was abandoned, and forests in many areas were restored. However, the population has gradually recovered in less than a few decades, and the Renaissance, which appeared in the 15th and 16th centuries, had once again triggered a surge in Europe’s population and economy. Between AD 1500 and AD1750, the expansion of arable land was the most significant factor contributing to the loss of forests and woodland in central and southeastern Europe. Because of the high intensity of deforestation that persisted until the 19th century, most pristine forest in central and southeast Europe had been cleared out (Leuschner and Ellenberg, 2017; Schlueter, 1952; Thomas, 1956; Tucker and Richards, 1983; Turner et al., 1990).
Changes of the cropland fractions since AD 1800
Change of the cropland fractions on a national scale
The model results indicated, that over the last 200 years, the cropland fraction in the entire study area has increased from 27.8% in AD 1800 to 44.8% in AD 1900, then decreased to 35.3% in AD 2000. During the 19th century, cropland expansion varied in more than 90% of the countries in the study area. However, in the 20th century, only about 25% of the countries maintained the increasing trend, while most other countries’ cultivation intensity decreased. For example, the cropland fraction of Poland increased by 30.8 percentage points during the 19th century, while it decreased in Switzerland by 1.4 percentage points. There are 4 countries/regions with an increase between 20 and 30 percentage points, nine countries/regions with increasing coverages between 10 and 20 percentage points (Serbia and Montenegro are referred to as Serbia together with Montenegro in this study), four countries with increasing less than 10 percentage. For the 20th century, the cropland continually increased in most countries in the Balkans, such as Albania, North Macedonia, Romania, Serbia together with Montenegro and Bosnia and Herzegovina. The cropland fraction of the other 14 countries/regions decreased within the range from 19.8 to 1.3 percentage points. The countries in the northern part of the Alps have declined significantly, with the majority falling by more than 10% (Supplemental Table S3, available online).
The cropland fractions on a 1°×1° resolution
The 1°×1°cropland fractions in central and southeast Europe in AD 1800, 1850, 1900, and 2000 are shown in Figure 5. In AD 1800, the areas with high cropland fractions were mainly located in northwestern France, northern Germany and central Poland, while the areas with lower cropland fractions were distributed in the Alps and its southern regions. Between AD 1800 and 1850, in addition to further increase in the aforementioned regions, cropland expanded southward to the south of France and the Hungary. In AD 1900, the cultivation intensity has peaked in western and northern France, northern Germany, and Poland. The south boundary of the high cultivation intensity had essentially reached the central Serbia, and the cropland in southern Romania also showed high intensity. However, 100 years after, the cultivation intensity in the areas north to the Alps showed a sharp drop, while it has increased in the eastern and southern Balkans.

The 1°×1° forest cover fraction (left) and cropland fraction (right) in central and southeast Europe in AD 1800, 1850, 1900, and 2000. (a), (c), (e) and (g) depict the forest cover fraction in the study area in AD 1800, 1850, 1900, and 2000, respectively. (b), (d), (f) and (h) depict the cropland cover fraction in the study area in AD 1800, 1850, 1900, and 2000, respectively.
Changes of the forest cover fraction
The temporal and spatial pattern of the forest cover fraction
In general, the forest fraction in central and southeast Europe decreased from 38.4% in AD 1800 to 27.0% in AD 1900, and then increased again to 32.5% in AD 2000 (Supplemental Figure S2, available online). In terms of spatial distribution, the majority of areas north of the Alps have transitioned from deforestation to forest recovery since AD 1900, whereas forest cover has continued to decline in most areas of the Balkan over the last 200 years.
In AD 1800, high-coverage forests can be primarily found in the LowLand countries (The Netherlands, Belgium, and Luxembourg), the south of France, the south of Germany, the Alps region, and the majority of the Balkans. Throughout the 19th century, whole regions were generally subjected to deforestation, with the high fractions of forest mainly being remained in southeastern France, west and south of the Balkans and the Alps region after 100 years of exploration. Deforestation has decreased or stopped since the 1900s, and forest cover fractions in France, Poland, and western Germany had increased even at the end of the 20th century (Figure 5).
The temporal change of the forest cover fraction on the pixel scale
The historical forest fraction in one pixel was divided into seven levels from extremely low to extremely high (Figure 6). From AD 1800 to 2000, the proportion of six of the forest fraction levels changed clearly, while the levels of “extremely low” did not exhibit large variations. In AD 1800, the proportions of most levels were between 4% and 37.2%, except for the “extremely high” level with less than 1%. The “moderate” and “low” levels are in the top two with proportions of 37.2% and 20.7%, respectively. In AD 1850, the proportion of “moderate,” “high,” and “very high” forest fractions decreased by 15.4, 4.4, and 5.5 percentage points, respectively, while the proportion of “very low” and “low” forest fractions increased by 11.1 and 14.1 percentage points, respectively. In AD 1900, the proportions of “moderate,” “high,” and “very high” levels decreased further by 5.8, 6.4, and 5 percentage points, respectively, while the proportions of “very low” and “low” levels increased by 12 and 4 percentage points, respectively. One hundred years later in AD 2000, the proportion of “moderate” and higher levels increased obviously, while the proportion of both “very low” level decreased significantly. The proportions of “moderate,” “high” and “very high” forest coverage were 14.8, 1.8 and 2.2 percentage points more than that in AD 1900, respectively. The “very low” level of forest coverage was 12.3%, representing a 18.5 percentage points decrease from AD 1900.
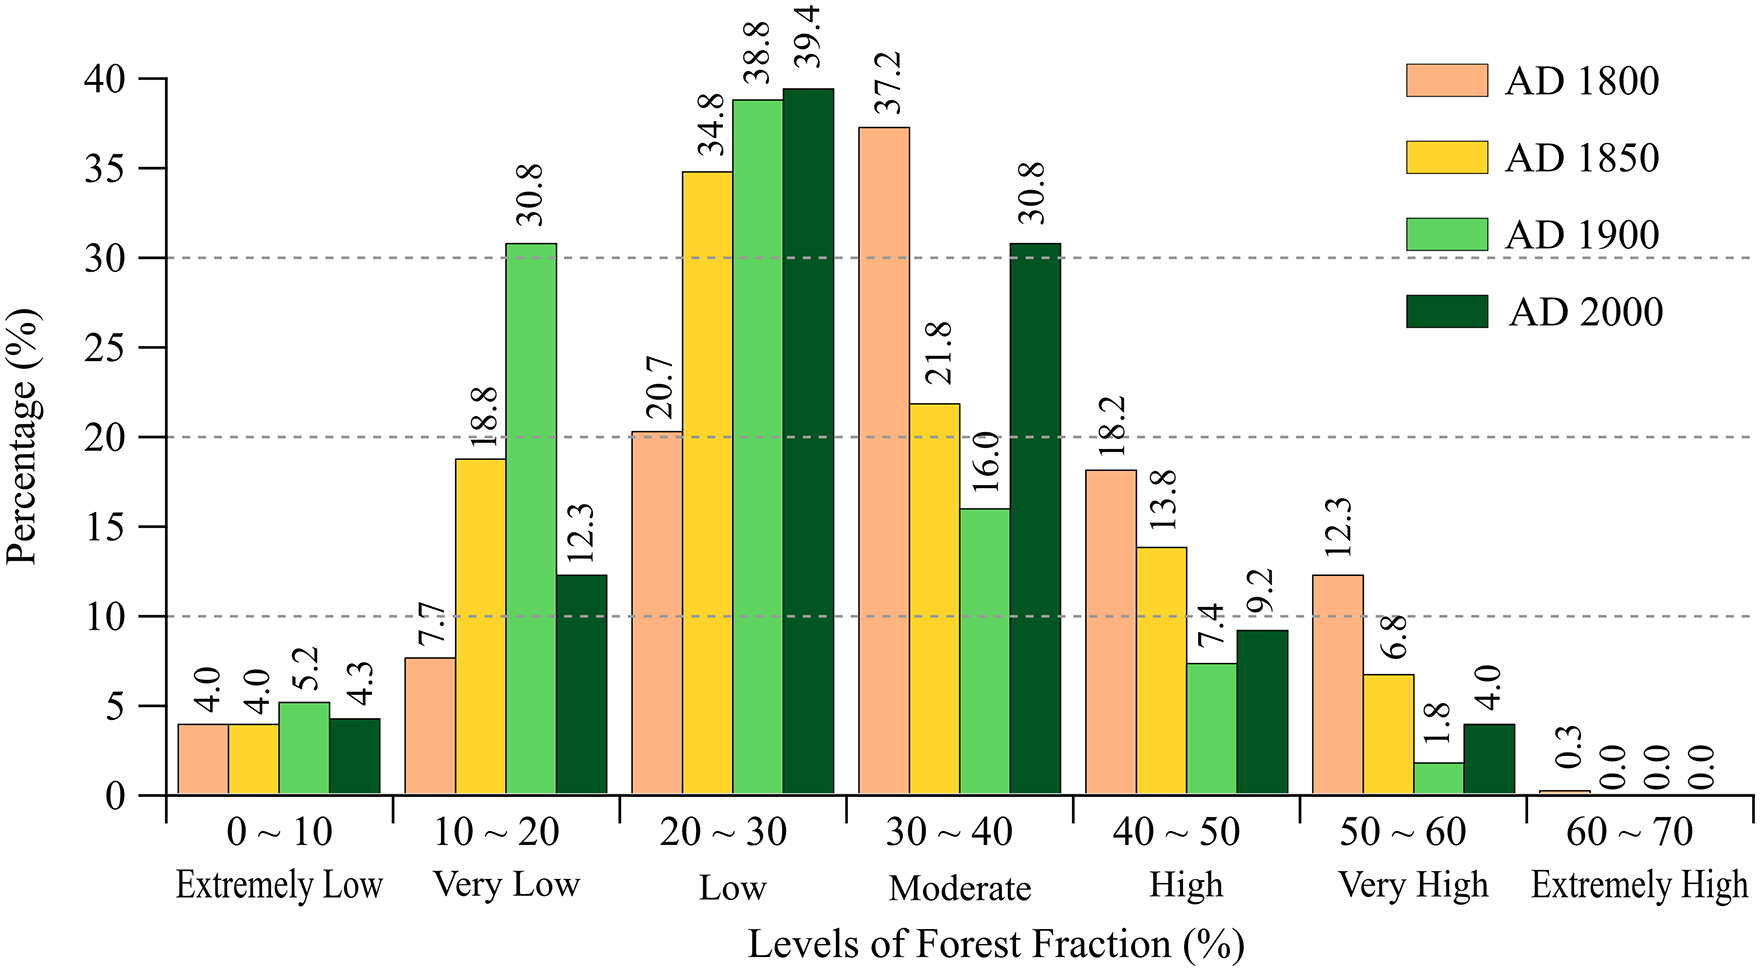
The proportions of the seven levels of forest coverage in AD 1800, 1850, 1900, and 2000 in the whole study area.
Changes in forest fraction at the national/regional scale
In order to analyze the changes of forest coverage in the European countries over the last 200 years, this study employed an upscaling method (to reduce the large error in the national forest area calculated by averaging the grid cells with 1° coarse resolution, we resampled the original raster data to 5 min, multiplied by the area of each 5 min grid cell, and finally calculated the national forest area using ArcGIS’s zonal statistic tool) to extract the forest coverage of the past 200 years at the national scale based on 1° forest coverage data (considering the similar characteristics of the physical environment and land use, the Netherlands, Belgium, and Luxembourg were merged as the “LowLand countries,” Switzerland and Austria were merged as the “Alpine countries,” and Serbia and Montenegro were also merged as “SRB&MNE”).
The forest coverage of all countries continuously decreased during the 19th century. For example, Croatia had the greatest decline of forest coverage (18.0 percentage points). Poland (17.9), Romania (16.5), Hungary (15.9), Bulgaria (15.4), and Slovakia (15.1) are among the countries/regions with a decrease in forest coverage of 15 to 18 percentage points. Serbia together with Montenegro (14.8), Bosnia and Herzegovina (13.2), Slovenia (11.9), North Macedonia (11.2), Albania (10.3), and Czech Republic (10.1) are among the countries/regions with a decrease in forest coverage of 10 to 15 percentage points. The countries with a decrease below 10 percentage points include France (7.7), LowLand countries (7.4), Germany (7.3), and Alpine countries (3.0).
Throughout the 20th century, the forest coverage fraction of the 11 countries/regions increased among the 16 countries/regions. For example, LowLand countries have seen the greatest increase in forest coverage, amounting to about a 11.6 percentage points increase since the 1900s. The countries/regions with forest coverage increase less than 11.6 percentage points include Croatia (11.5), Slovenia (11.0), France (9.3), Slovakia (8.4), Germany (7.9), Czech Republic (6.2), Poland (5.8), Alpine countries (4.4), Hungary (3.7), Bosnia and Herzegovina (1.6). The fraction of forest coverage in North Macedonia, Albania, Romania, Serbia together with Montenegro and Bulgaria has steadily decreased over the last century. Albania has the largest decrease by 6.1 percentage points (Supplemental Figure S2, available online).
Discussion
Comparison with other forest data
The comparison with statistical forest data in AD 2000
There is almost no difference between the reconstructed total forest area of central and southeast Europe in AD 2000 in this study and the statistics data of forest area derived from the 1996 to 2002 Global Forest Land Resources Assessment Report published by the FAO. The latter is slightly smaller than the former but the relative difference is only 0.5% (Table 2). Furthermore, the national-scale forest coverage data reconstructed in this study and the FAO country-scale statistics contain reasonable systematic errors as a result of different data sources, with the exception of LowLand countries and Alpine countries (Figure 7). It could be related to the fact that our model assumed that forest clearing was entirely supported by cropland (no pasture) for the whole study area, but this relationship was influenced in the above two regions by other factors such as (1) forest clearing for shipbuilding, which was primarily for commercial and strategic reasons in the LowLand countries near the sea; and (2) forest clearing for pasture, which was necessary due to the unique terrain and vegetation type in Alpine countries. In addition, the disparity in Netherlands may be caused by the fact that the Netherlands contains a large portion of “new land (sea reclamation)” that has never been forested.
Comparison of total forest area between this study and others.
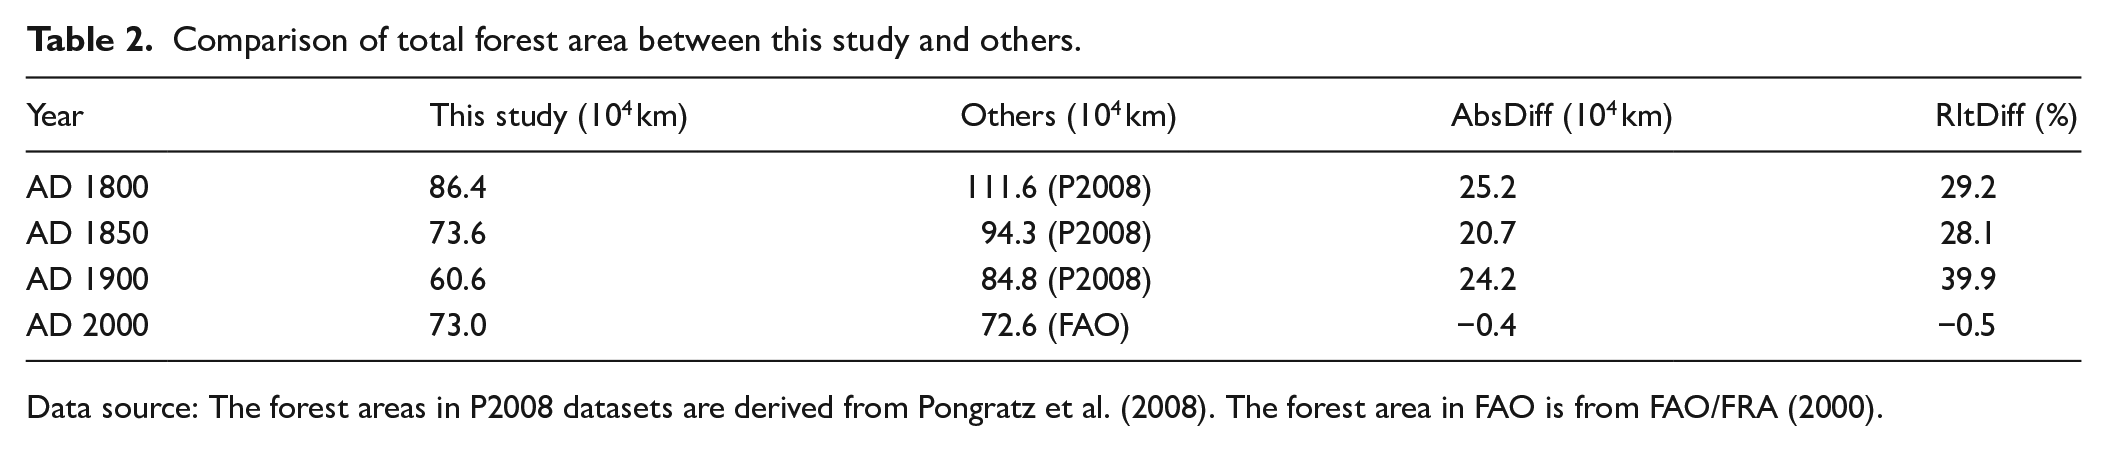
Data source: The forest areas in P2008 datasets are derived from Pongratz et al. (2008). The forest area in FAO is from FAO/FRA (2000).

Comparison of the forest fraction reconstructed in this study over the last 200 years with the P2008 and FAO. (a), (b) and (c) represent grid-scale comparisons of forest fraction in AD1800, 1850, and 1900 between this study and the P2008 dataset, respectively. (d) represents country-scale forest fraction comparisons between this study and FAO statistics in AD2000.
Comparison with P2008 data in AD 1800, 1850, and 1900
The P2008 dataset (Pongratz et al., 2008) was compared with the forest fraction data set reconstructed in this study for AD 1800, 1850, and 1900 (We did not compare our dataset with KK10 and HYDE because neither had forest cover data after AD 1850). In terms of total forest area, the area reconstructed in this study in all time slices is less than that reconstructed by P2008 (Table 2), with a relative difference of up to 39.9% (AD 1900). We inferred that the discrepancy is primarily caused by two factors: (1) The historical forest data set in the P2008 was generated by subtracting agricultural land (cropland plus pasture) from potential forest vegetation based on the modern 1 km Boolean representation of the land cover dataset, that is, each grid cell is either 100% occupied by only one type of land cover or not at all. To put it another way, the high potential vegetation coverage leads to a high forest coverage. (2) Cropland and pasture areas in P2008, which was another factor causing the difference, were compared separately with the results of this study and other land cover reconstruction results. The comparison results show that, cropland areas in P2008 were generally higher than in this study and other existing reconstruction results, but grassland and pasture areas were significantly lower (Supplemental Table S4, available online).
Furthermore, the estimated values of the P2008 dataset at AD 1800, 1850, and 1900 on a
The applicability of the modeled “cultivation fraction – forest fraction” relationship on a millenium-scale
In order to study the applicability of the modeled relationship between cultivation intensity and forest cover fraction prior to AD 1800, the modeled relationship in this study is compared with Bork et al.’s (1998) reconstruction of the cultivation intensity-forest fraction relationship curve in Germany over the last 1000 years.
The results showed that, (1) both curves have a Pearson Correlation Coefficient of 0.9; (2) they exhibit a similar negative exponential correlation, with the forest fraction decreasing as cultivation intensity increases, which is due to cropland expansion inherently resulting in forest clearing in Europe for millennia (Figure 8); (3) when the cropland fraction is less than 0.25, the corresponding forest fraction in the past millenium curve simulation scenario is greater than the simulation value of this study; when the cropland fraction is greater than 0.25, the opposite is true. It could be due to the fact that the lowest value (around 0.3) of modern cultivation intensity used to reconstruct the relationship curve in this study is greater than the lowest value of historical reconstruction results (around 0.15). It does not, however, affect the application of the past millenium curve to correct the relationship between cultivated land and forest land in this study, so that the reconstruction of forest fraction in the past millenium scale is expected to be completed in the future.
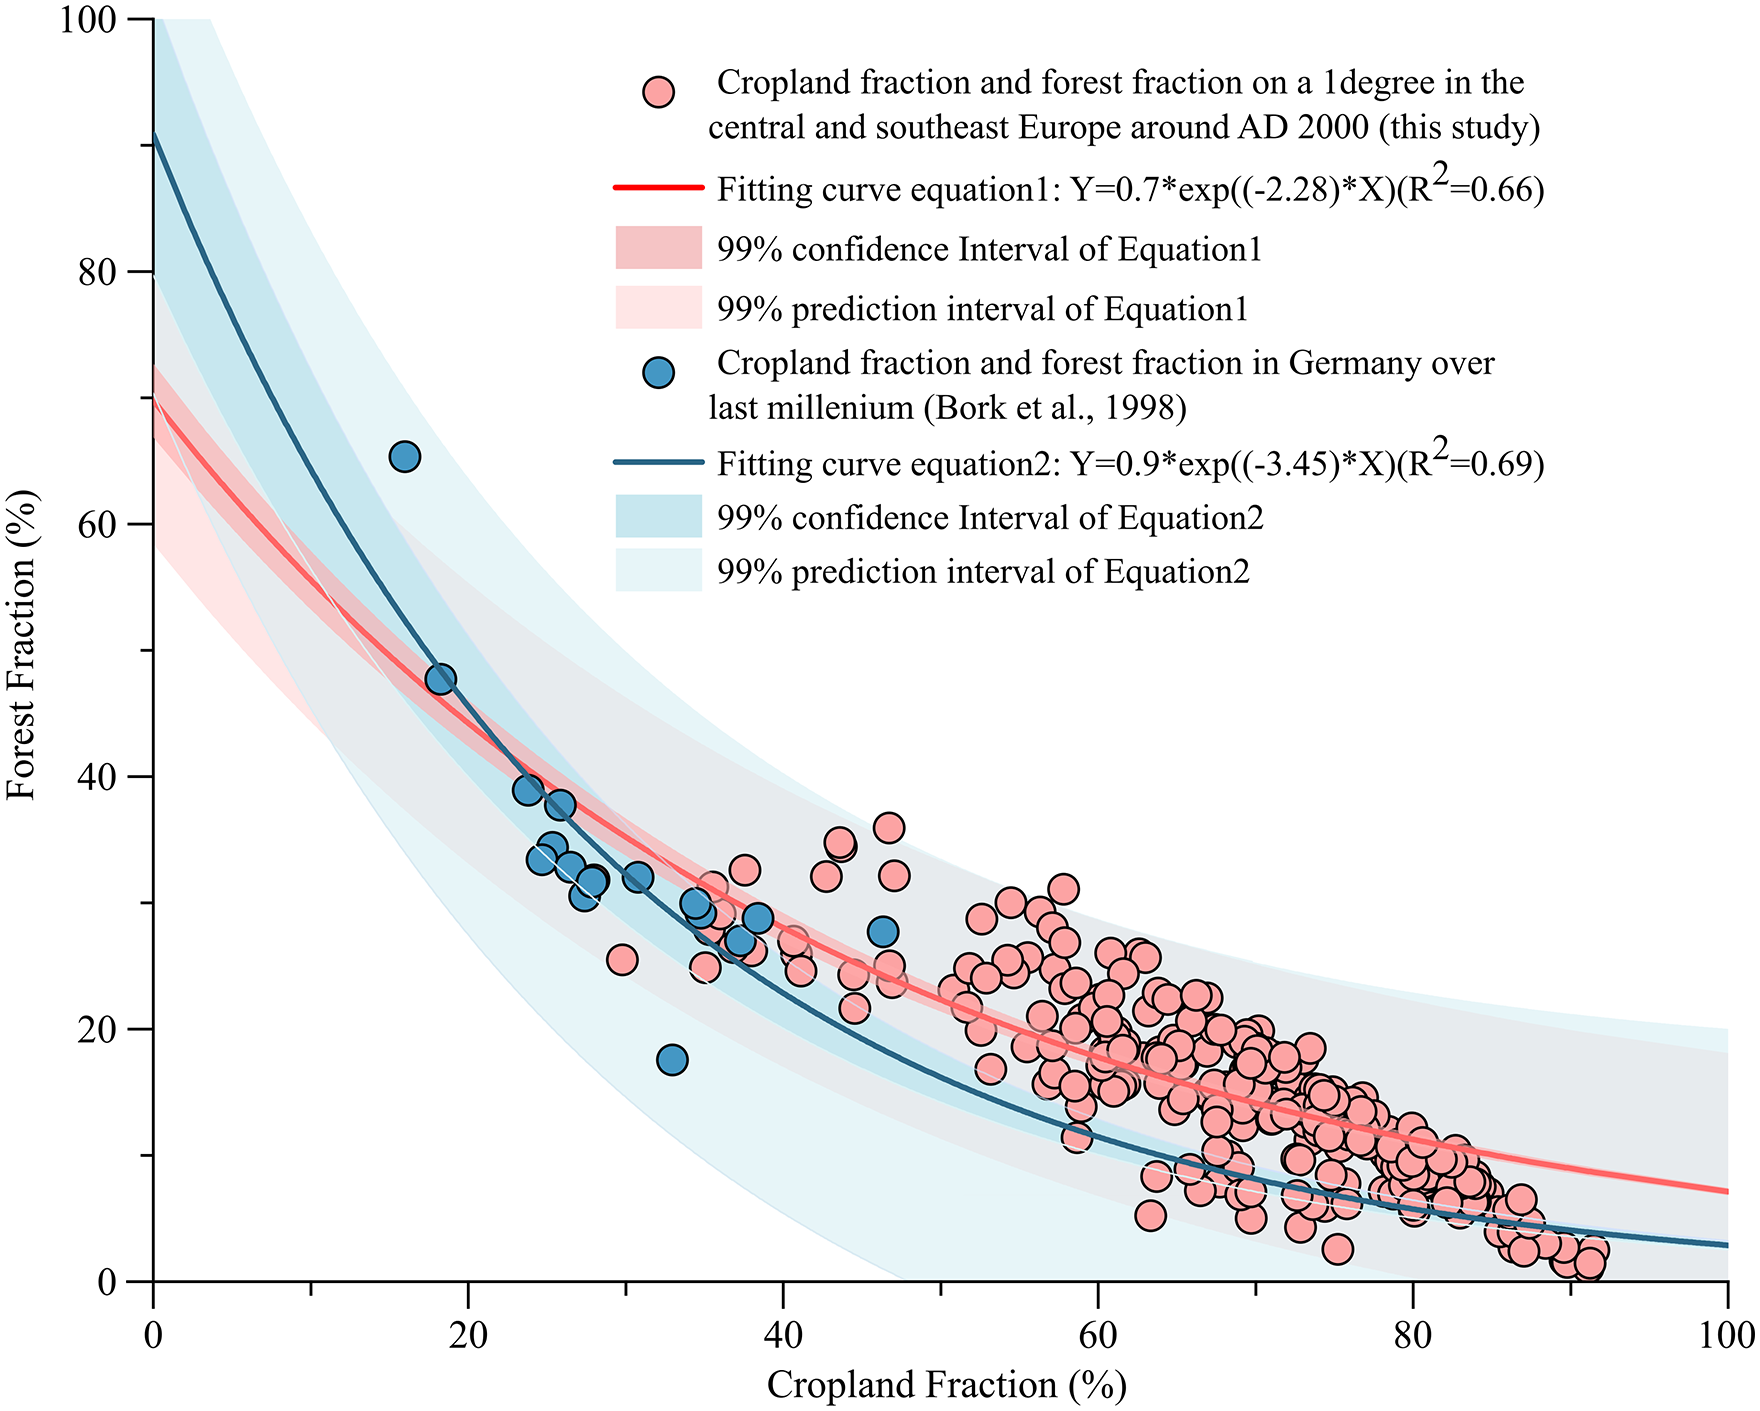
The comparison between the modeled relationship in this study and Bork et al.’s (1998) reconstruction relationship curve in Germany over the last 1000 years.
Limitation and future directions
We admit that the historical forest cover reconstruction model used in this study, which is based on the cultivation fraction-forest fraction relationship curve, has some limitations. First, the temporary land cover change caused by wood harvest for construction, shipbuilding and fuels, which was mostly local and will not result in a change in land cover type from forest to cropland, has not been considered. In addition, the relationship between cultivation intensity and forest fraction in this study is assumed to be stable over time. However, changes in land quality may have an impact on this relationship, such as the negative effects of long-term intensive agriculture on soil fertility, where forests may be cleared to replace unusable agricultural lands, but the abandoned agricultural lands do not revert to forest. Second, we ignore the human-caused shift in land type from forest to pasture. One reason is that it is difficult to distinguish pastures from grassland distribution using remote sensing methods. Another is that the proportion of forest converted to pastures is low in the study area, where deforestation happened primarily for cropland expansion. Third, the impact of major climatic changes, such as the Little Ice Age, on crop and forest area has not been taken into account.
The next step, our curve between cultivation intensity and forest coverage can be used to reconstruct forest distributions in areas with high proportion of forest cover and a similar history of deforestation, such as the tropical Amazon. Furthermore, we will carry out the following work to address some of the model limitations described above: (1) To focus on land cover change caused by wood harvest for construction, shipbuilding and fuels; (2) To further investigate the relationship between deforestation and pasture/grassland cover in Europe in order to improve the accuracy of historical forest cover data and create a historical grassland cover dataset; (3) To combine other data sources, such as dendrochronological temperature reconstructions from Europe or the Northern Hemisphere, to better understand the climatic drivers of crop production and forest cover over time. Then, we will provide data sets for the highest and lowest possible forest estimates, which can be used for sensitivity studies to climate change.
Conclusions
A new gridded reconstruction method was developed to reconstruct the historical fraction of forest cover in central and southeast Europe on a 1° scale, on the basis of the modern “cultivation intensity-forest fraction” spatial relationship curve. The main conclusions are:
(1) The fact that the deforestation is inherently linked to extension of cropland area in Europe is well known, but only rarely attempts have been made to investigate this specific relationship in existing work on reconstructing historical forest cover. In this study, we found a negative exponential relationship curve (y = 0.7 × e(−2.28x)) on a 1°pixel scale between cultivation intensity and forest fraction using 290 pairs of “cultivation fraction-forest fraction” points data derived from modern (around AD 2000) landcover data sets.
(2) The forest fraction in central and southeast Europe decreased from 38.4% in AD 1800 to 27.0% in AD 1900, and then increased to 32.5% in AD 2000. In AD 1800, high-coverage forests can be primarily found in LowLand countries, the south of France, the south of Germany, the Alps region and the south. After 100 years, the regions with high fractions of forest were only being seen in the Alps and the western and southern Balkans. The intensity of deforestation in the study area has decreased since the 1900s. Except for Albania, North Macedonia, Romania, Serbia together with Montenegro, and Bulgaria, the percentage of forest had increased by the end of the 20th century in other countries/regions.
(3) There is almost no difference between the reconstructed total forest area of central and southeast Europe in this study and the statistics data of forest area derived from FAO in AD 2000. The forest area reconstructed in this study in AD 1800, 1850, and 1900 is less than that reconstructed by Pongratz et al. (2008), especially for the estimated value of the high forest fraction (greater than 30%). One plausible explanation is that we used a different potential vegetation dataset and a negative exponential curve between cultivation intensity and forest fraction to simulate historical forest coverage rather than using more basic approaches to scaling anthropogenic land use.
(4) Our exponential relationship curve could be applied to reconstruct forest cover over the last millenium because it results in similar data as to Bork et al.’s (1998) reconstruction of the cultivation intensity-forest fraction relationship curve in Germany over the last 1000 years, with the same negative exponential correlation and a Pearson Correlation Coefficient of 0.9.
Supplemental Material
sj-docx-1-hol-10.1177_09596836221106963 – Supplemental material for Reconstruction of historical forest cover on a 1° grid in central and southeast Europe from AD 1800 to 2000
Supplemental material, sj-docx-1-hol-10.1177_09596836221106963 for Reconstruction of historical forest cover on a 1° grid in central and southeast Europe from AD 1800 to 2000 by Xue Zheng, Xiuqi Fang, Yu Ye, Julia Pongratz, Chengpeng Zhang, Jun Li, Liang Emlyn Yang, Yikai Li and Eileen Eckmeier in The Holocene
Footnotes
Author contributions
X Zheng: Conceptualization, Methodology, Historical evidences mining, Data processing, Writing-Original Draft, Writing-Review & Editing. XQ Fang: Conceptualization, Methodology, Writing-Review & Editing, Funding acquisition. Y Ye: Methodology, Historical cropland data, Writing-Original Draft. J Pongratz: Historical land cover data set (P2008), Writing-Review & Editing. CP Zhang: Writing-Original Draft, Modern cropland data, Writing-Review & Editing. J Li: Historical cropland data, Writing-Original Draft. LE Yang: Writing-Review & Editing. YK Li: Writing-Review & Editing. E Eckmeier: Supervision, Resource, Writing-Review & Editing.
Funding
The author(s) disclosed receipt of the following financial support for the research, authorship, and/or publication of this article: This research was supported by the National Key Research and Development Program of China (2017YFA0603304).

Supplemental material
Supplemental material for this article is available online.
References
Supplementary Material
Please find the following supplemental material available below.
For Open Access articles published under a Creative Commons License, all supplemental material carries the same license as the article it is associated with.
For non-Open Access articles published, all supplemental material carries a non-exclusive license, and permission requests for re-use of supplemental material or any part of supplemental material shall be sent directly to the copyright owner as specified in the copyright notice associated with the article.
