



Abstract
Madagascar is known for its high erosion rates in the central highlands, yet the role of human disturbance versus natural processes is not well understood and is a topic of ongoing debate. At present the necessary quantitative data to couple vegetation dynamics and sediment fluxes over time in Madagascar is scarce. This study aims to provide more insight in vegetation changes and sediment transfers over the last millennia in the Lake Alaotra region, and specifically on the role of human disturbances and natural processes. Our vegetation reconstruction is based on pollen records from two lake sediment cores, covering the last 2600 years. Sediment accumulation rates were calculated from cores obtained from the floodplains, from wetlands surrounding the lake, and from Lake Alaotra itself. Our data show an early opening in the landscape, between 2050 and 1700 cal a BP, with a transition from a wooded grassland or woodland/grassland mosaic towards open grassland and an increase in charcoal accumulation rates. (Indirect) human impact is suggested as the main driver for these vegetation changes. Floodplain and wetland sediment accumulation rates only increase in the last 1000 years and peak in the last 400 years. This increased accumulation can mainly be linked to the increased anthropogenic pressure (grazing and farming activities) that triggered increased lavaka (gullies) activity. No changes in accumulation rate were observed in Lake Alaotra, indicating that most sediments are buffered in the floodplains and wetlands. Overall, our pollen and charcoal data suggest an indirect effect of human disturbance on vegetation shifts whilst strong evidence was found for a direct effect of human disturbance on sediment accumulation through intensified use of the grasslands.
Keywords
Introduction
The relationship between human impact, vegetation changes and environmental degradation in Madagascar is a topic of ongoing debate. Firstly, the timing and extent of human impact on the different ecoregions in Madagascar is still debated. Whilst the earliest evidence of human presence on the island comes in the form of human-modified bones dating back to 10,500 cal a BP (Hansford et al., 2018), it does not imply continuous human presence over this period. Douglass et al. (2019) evaluated reported radiocarbon dates from archaeological sites and point to permanent human presence in Madagascar for at least 2000 years. Other estimates of the start of permanent human presence are between 1450 and 1150 cal a BP, based on palaeoecological, genomic and archaeological evidence (Anderson et al., 2018; Mitchell, 2020) and between 3000 and 2000 cal a BP based on genomic evidence (Pierron et al., 2017). Hence, large uncertainty remains on the timing of initial human colonisation in Madagascar. Secondly, not only the timing, but also the impact of human colonisation is still debated. Over the last two millennia, megaherbivores (e.g. elephant birds, giant lemurs, pygmy hippopotamuses and giant tortoises) disappeared on the island (Burney et al., 2004; Crowley, 2010). Whether this decline is attributed to an island-wide drought (Faina et al., 2021; Virah-Sawmy et al., 2010), human impact through overhunting and habitat modifications amplified by a drought-period (Burney et al., 2003), or a shift in human subsistence strategy from hunting and foraging to farming and herding in combination with an increase in human population (Godfrey et al., 2019; Hixon et al., 2021) is still uncertain. Similarly, there is no scientific consensus on how human activity has affected shifts in the island’s vegetation (see e.g. Irwin et al., 2010; Joseph et al., 2021; Klein, 2002). Currently, large parts of central and western Madagascar are covered with grassland. Traditionally, these grasslands were interpreted as the result of human activities, whereby Madagascar would have been covered by a dense, continuous forest prior to human arrival, and was gradually deforested by humans (Gade, 1996; Humbert, 1927). More recently, however, studies have shown that grasslands are endemic in Madagascar and that it is the relative extent of grassland versus forest that has changed over time in several parts of the island due to both human and natural factors (e.g. Burney, 1987a; Joseph et al., 2021; Vorontsova et al., 2016). However, the precise dates of these vegetation changes remain elusive. Thirdly, also the impact of vegetation changes on sediment fluxes across the landscape remain unclear. At present, Madagascar is characterised by intense erosion processes (e.g. Cox et al., 2009; Voarintsoa et al., 2012) and has one of the highest catchment sediment yield values in Africa (Milliman and Farnsworth, 2013; Vanmaercke et al., 2014). A recent increase in soil erosion rates might be linked to a reduction of the protective vegetation cover, due to deforestation and intensive grazing (Brosens et al., 2022). To fully understand how vegetation changes and environmental changes may have affected the sediment fluxes across the landscape, and how these changes are related to human impact, precise dating of these vegetation changes and the sedimentation record is needed as well as the quantification of the various sediment sources and sinks within a catchment (e.g. Foulds and Macklin, 2006; Verstraeten et al., 2009). Indeed, residence times in sediment sinks such as floodplains often exceed 1000 years which implies that the erosion response to environmental changes occurring at the centennial timescale may not be recorded in sedimentary environments downstream of such sediment sinks (such as lakes) (e.g. Hoffmann, 2015).
The setting of the Lake Alaotra region, located in the central highlands of Madagascar, makes it an ideal candidate region to disentangle the relationship between vegetation changes, human activity and environmental degradation due to erosion, because it is possible to assess how such changes are recorded in different sedimentary sinks (floodplains and lake) while also detailed information on erosion dynamics is available (Bakoariniaina et al., 2006; Brosens et al., 2022; Mietton et al., 2018). Lake Alaotra is located in a hilly region characterized by open grassland, large spectacular teardrop shaped gullies (locally called ‘lavaka’) and very high erosion rates (Brosens et al., 2022; Mietton et al., 2018). The high lavaka densities in the region are seen as the main reason for the silting of the rivers and irrigation canals, leading to a loss of crop productivity (Bakoariniaina et al., 2006). Some studies claim that these sediments have filled most of Lake Alaotra and predict the short term extinction of the lake due to this sediment influx (Bakoariniaina et al., 2006; Moreau, 1977), later countered by Mietton et al. (2018). High-resolution and well-dated records on past vegetation, climate and human activities are needed, as well as quantitative data on sediment dynamics to fully understand the specific role of human disturbance versus natural processes for the changes in vegetation and erosion rates in this region. Such information would not only be locally relevant: the Lake Alaotra region may be considered to be representative for parts of the central highlands, which are now almost completely covered by grasslands and are subjected to intense lavaka erosion (Cox et al., 2009; Voarintsoa et al., 2012). Therefore, this study aims to disentangle the relationship between vegetation changes, human activity and environmental degradation due to erosion in the Lake Alaotra region. As such, the study aims to provide additional insights on the role of human disturbances and natural processes on the vegetation changes and sediment transfers. More specifically, we studied the vegetation changes and fire regimes over the last 2600 years in the Lake Alaotra region, using two well-dated pollen and charcoal records from the lake. Sediment transfers and deposition in the landscape, and the specific role of floodplains and wetlands, are studied using 54 cores and 41 AMS radiocarbon dates in floodplains and the downstream wetlands and lake.
Study area
This study focusses on the catchment of Lake Alaotra (1800 km²), located ca. 200 km northeast of Antananarivo in the central highlands of Madagascar (Figure 1). The lake is situated at an elevation of 750 m a.s.l. and is part of the Alaotra-Ankay rift system, a NE-SW oriented basin close to the eastern escarpment (Kusky et al., 2010). With its surface of ca. 400 km² it is the largest freshwater lake in the country. The topography of the region consists of rounded hills in a mature relief (Riquier and Ségalen, 1949). The climate is characterized by an alternating dry and wet season, the occurrence of tropical cyclones and a mean annual precipitation of ca. 1200 mm (Danloux, 1981). The lake is surrounded by wetlands, which have been partly converted to irrigated rice fields (Figure 1). The lake itself is very shallow (maximum depth is ca. 2.5 m) with substantial variations throughout the year (Bakoariniaina et al., 2006; Mietton et al., 2018). It is fed by ca. 20 rivers and drains into the Maningory River. In this study, we focused on the catchment of the Sahaba river, one of the largest tributaries of the lake, and on the catchment of the Ranofotsy River, a tributary of the Sahabe River (Figure 1). The Sahabe river flows through the wetlands before reaching the lake (Figure 1). Current vegetation in the catchment of Lake Alaotra is dominated by open grassland on the hillslopes (used for cattle grazing; mainly Poaceae) and rice fields in the valleys. In the river valleys some bushes and trees (e.g. Celtis and Eugenia) are present. Vegetation in the wetlands surrounding the lake is mainly dominated by Cyperaceae and rice fields. Over the period 1960–2013, the human population has increased fivefold in the Lake Alaotra region. As a consequence, human demand for natural resources and agricultural land has steadily increased (Lammers et al., 2015). The Lake Alaotra region is currently the largest rice producing area and freshwater fishery of Madagascar. Data on past vegetation changes and human history are currently not available for the Lake Alaotra region. For the central highlands, estimates of the start of human presence are between 3000 and 2000 cal a BP based on genomic evidence (Pierron et al., 2017). Clear signs of human impact are reported from ca. 1050 cal a BP onwards, based on remains of butchered animals, short-lived plant remains, bird eggshell and other plants or animal remains recorded at archaeological sites (Douglass et al., 2019; Godfrey et al., 2019), and based on an increase in the abundance of fossil spores of the dung fungus Sporormiella upon the introduction of zebu cattle (Bos inducus) on the island (Burney et al., 2003). Between 1050 and 700 cal a BP peopled started farming and herding with the introduction of zebu cattle, that is, the so-called subsistence shift (Godfrey et al., 2019).
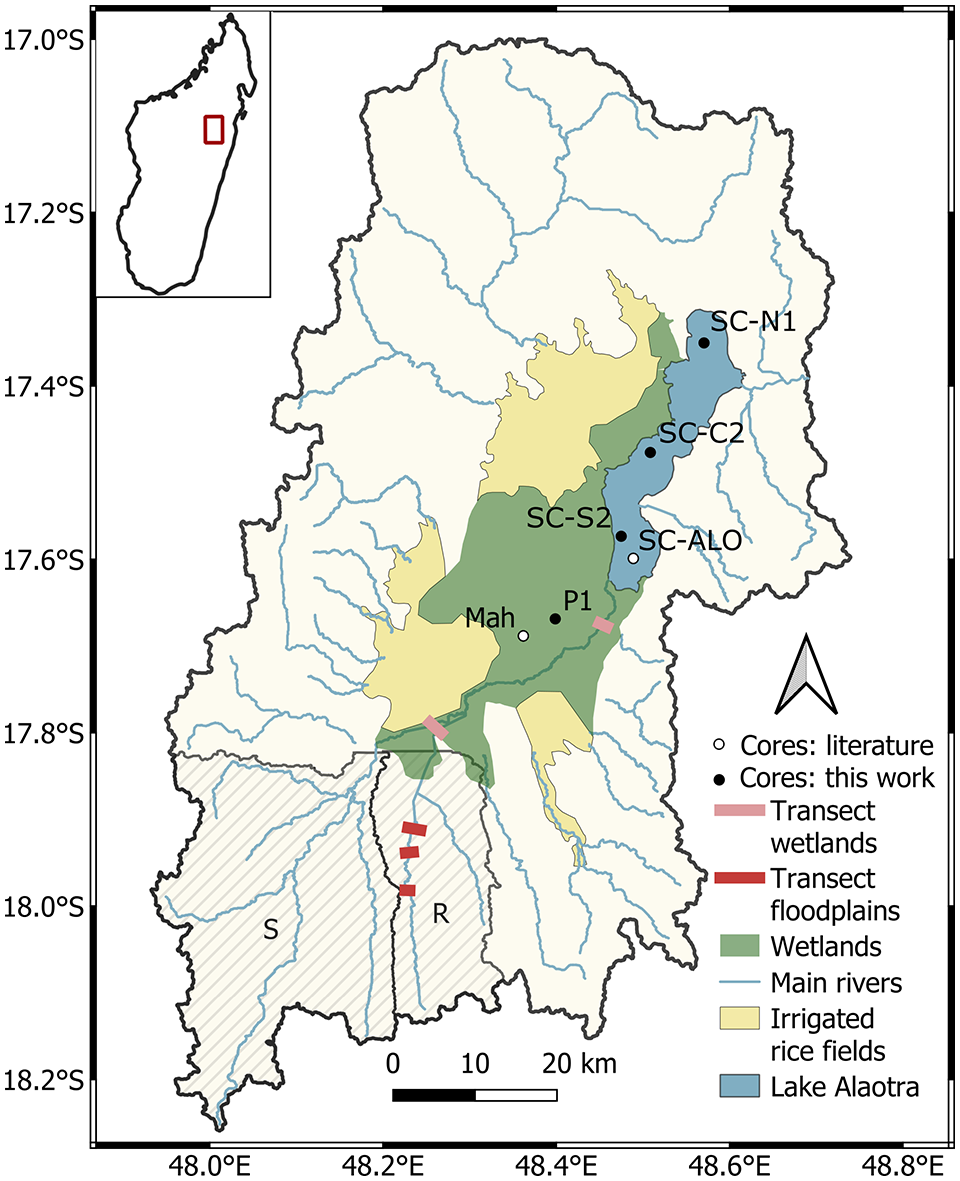
Location of the study area (Lake Alaotra catchment) in Madagascar, with indications of the lake, and the surrounding wetlands and irrigated rice fields. Blue lines indicate the location of the main rivers of the catchment. Floodplain transects from Brosens et al. (2022) are indicated in red, they are located in the Ranofotsy (R) and Sahabe (S) catchment indicated with hatched polygons. Coring transects in the wetlands are indicated with pink lines. Dots indicate the location of the cores in the wetlands (P1 (this study) and Mah (Mietton et al., 2018)) and lake (SC-C2, SC-N1 and SC-S2 (this study) and SC-ALO (Reyes, 1993)). White dots indicate previous published cores, black dots indicate cores retrieved for this study.
Material and methods
Reconstructing past vegetation changes
Two lake sediment cores were collected using a piston core (lake core SC-C2 and lake core SC-N1; Figure 1). The lake cores were subsampled at 1 cm resolution. Pollen samples from the lake cores were prepared following the standard technique of Faegri and Iversen (1989). A known quantity of Lycopodium spores were added, to allow the calculation of charcoal accumulation rates (CHAR). Pollen slides were studied under a 630× and 1000× magnification using oil immersion. Pollen types were identified using the ‘Palynologia Madagassica et Mascarenica’ series (Straka, 1964) and Burney (1988). Pollen data are expressed as relative frequencies of the regional pollen sum. Cyperaceae are interpreted as local marsh vegetation and are left out the pollen sum. A complete palynological study was applied to SC-C2, for which a minimum of 250 terrestrial pollen types were counted per sample (14 samples). SC-N1 was used to confirm the observed trends in SC-C2. Pollen counts for SC-N1 are therefore lower (ca. 100 pollen counts per sample), as well as the number of included samples (six samples).
A stratigraphically constrained cluster analysis was applied to the pollen record of SC-C2 to define regional palynological zones. The regional pollen signal was included in the cluster analysis and percentage pollen values were used. Euclidean distances were used for the distance matrix. Cluster analysis was performed in R software using package rioja (Juggins, 2020).
Samples for microfossil charcoal (<125 µm) analysis were prepared as part of the pollen extraction technique (Faegri and Iversen, 1989) for both lake cores. Microfossil charcoal particles were counted together with the pollen. Samples for macrofossil charcoal (>125 µm) were prepared following the standard techniques of Mooney and Tinner (2011) for both lake cores. Macrofossil charcoal particles were counted under 10× to 80× magnification. Both micro and macrofossil charcoal accumulation rates (CHAR, particles cm−2 year−1) were calculated by taking into account the sediment accumulation rates in the lake (see section 3.2).
Eight AMS radiocarbon dates of extracted pollen were used to provide a chronology for the pollen assemblages from the two lake cores, as no terrestrial macro remains were present in the lake sediment (Table 1). Dating extracted pollen avoids reservoir effects of incorporation of older organic material and are shown to provide more reliable radiocarbon chronologies than obtained by dating bulk sediment (Brown et al., 1989). Pollen were extracted from the lake sediments partly based on Brown et al. (1989), including heavy liquid separation but avoiding acetolysis. All obtained ages were calibrated using the SHCal20 calibration curve (Hogg et al., 2020) and Oxcal 4.4 software (Bronk Ramsey, 2009) (Table 1). Bayesian age-depth models were made based on the rbacon.R package version 2.5.0 (Blaauw and Christen, 2011). The resulting age-depth models of the two lake cores (Figure 2) were used to derive a timescale for the pollen and charcoal records, taking into account chronological uncertainties.
AMS radiocarbon dating results.

Ages were calibrated using the SHCal 20 calibration curve (Hogg et al., 2020) and Oxcal 4.4 software (Bronk Ramsey, 2009).

Age-depth models for: (a) SC-C2 and (b) SC-N1. Blue colours indicate calibrated AMS radiocarbon dates (Table 1), darker greys indicate more likely calendar ages, dark grey dotted lines show the 95% confidence ranges of the age-depth model, the red dotted line indicates the mean (‘best’) age-depth model.
Sediment accumulation data
Floodplain sediment accumulation was inferred using the coring dataset presented in Brosens et al. (2022). This dataset consists of 48 cores grouped in five floodplain transects across the floodplains of the Ranofotsy River and Sahabe River (Figure 1; catchment areas of 432 and 943 km², respectively). Three of these coring transects are located in the floodplains of the Ranofotsy River, before reaching the wetlands surrounding Lake Alaotra (Figure 1), and were used to reconstruct floodplain sediment accumulation. For each coring site, a lithological field description is available with a vertical resolution of 5 cm, containing texture and sorting determined by palpation, colour description, description of soil horizons and identification of inclusions. Floodplains were all categorized as aggrading, and most floodplain deposits have a low organic carbon content (<2%; Brosens et al., 2022). In total, 16 AMS radiocarbon dates of organic material embedded in floodplain deposits are available from Brosens et al. (2022) and Mietton et al. (2018) (Table 1). Radiocarbon dates from terrestrial plant remains and extracted pollen were preferably used. However, if no radiocarbon dates from plant remains or pollen were available, bulk samples (organic C residue) were also included (Table 1). Sediment accumulation in the wetlands surrounding Lake Alaotra was reconstructed based on six new AMS radiocarbon dates of organic material taken from the coring dataset of Brosens et al. (2022), three AMS radiocarbon dates of organic material from a new wetland core (P1, Table 1 and Figure 1), and three AMS radiocarbon dates from a wetland core from Mietton et al. (2018) (Mah, Table 1 and Figure 1). In total, 12 AMS radiocarbon dates of organic material embedded in the sediments in the wetlands are available (Table 1). Sediment accumulation in Lake Alaotra was reconstructed based on SC-C2, SC-N1 and SC-S2, for which 10 AMS radiocarbon dates of extracted pollen from the lake sediment cores are available (see 3.1 and Table 1). Three AMS radiocarbon dates from bulk samples from Lake core ALO (Figure 1) from Reyes (1993) were added to this dataset (Table 1). All obtained ages were calibrated using the SHCal20 calibration curve (Hogg et al., 2020) and Oxcal 4.4 software (Bronk Ramsey, 2009).
Accumulation rates (AR, mm yr−1) were calculated for each dated sample using equation (1):
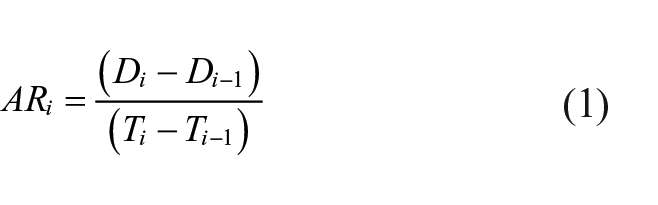
with Di (mm) and Ti (yr) the depth and age of the sample and Di-1 (mm) and Ti-1 (yr) the depth and age of the stratigraphic following sample or the top of the surface (age zero).
Results
Vegetation changes
Based on the dating results (Table 1), an age-depth model was made for both lake cores (Figure 2). The pollen record of SC-C2 spans ca. the last 8800 years (Figure 3). The time-resolution of the pollen samples is ca. 150 years between 2600 and 1800 cal a BP; and ca. 250 years between 1800 cal a BP and the present. Since our focus was mainly on the last 2600 years, we only have two pollen samples older than 2600 years (Figure 3). The pollen record of SC-N1 covers ca. the period 2200–1100 cal a BP, with a time resolution of ca. 200 years. The lake sediments consist of between 5% and 35% of organic carbon (Razanamahandry et al., unpublished data) and have a clay texture. Pollen preservation was relatively good, with indeterminates below 5% of the pollen sum (Figure 3). Pollen density ranged between 50,000 and 750,000 pollen grains cm−³.
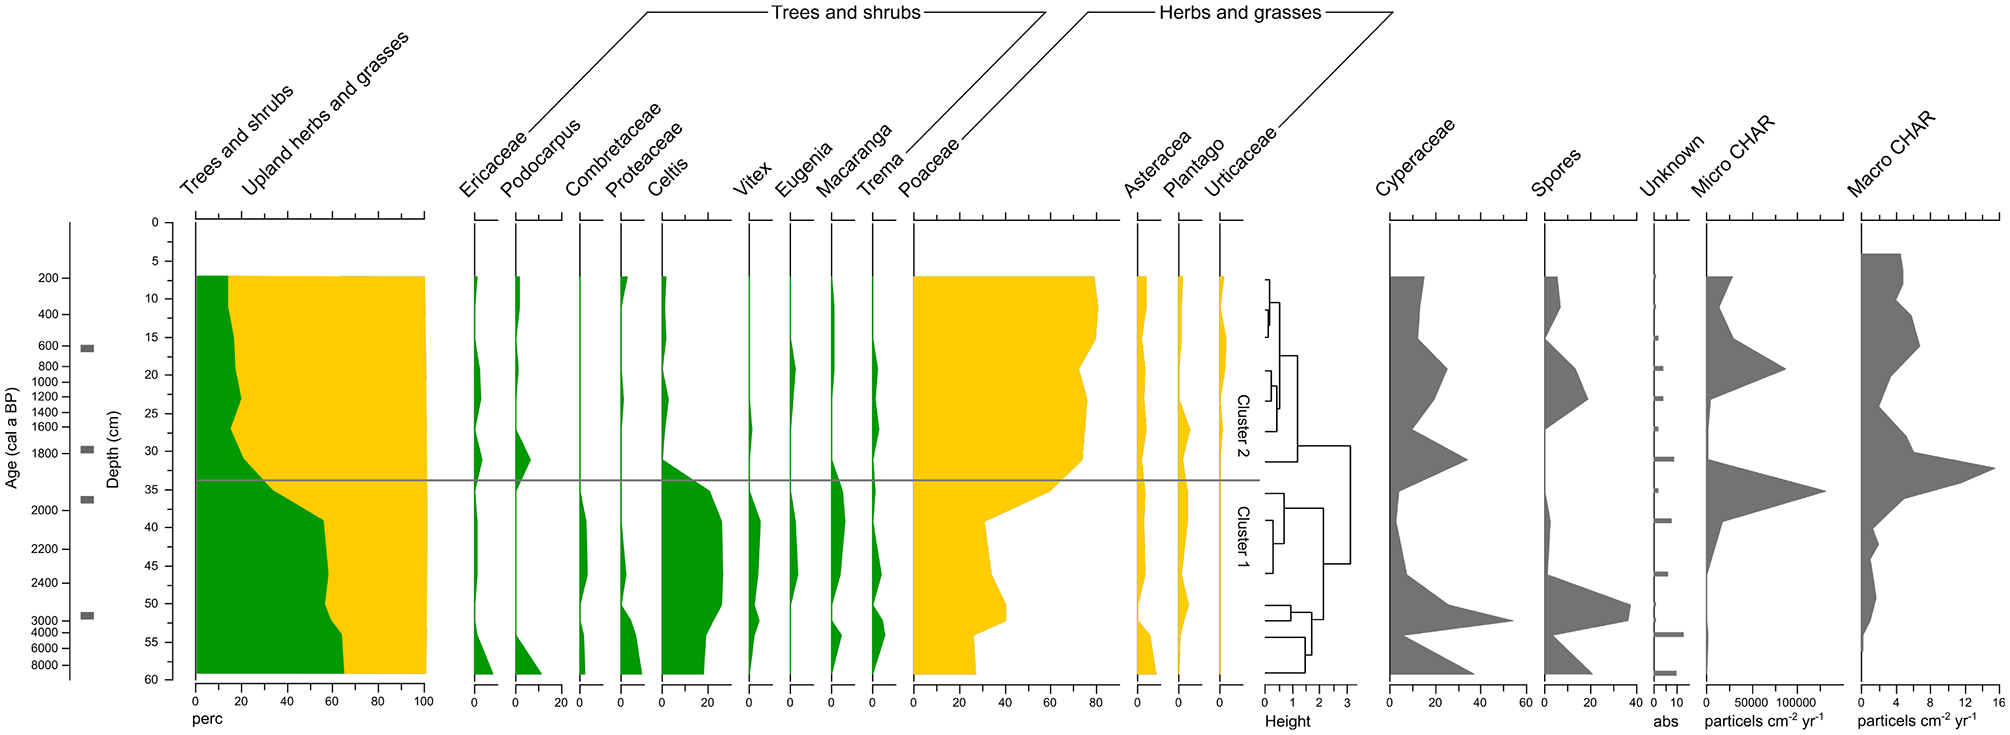
Simplified pollen diagram for SC-C2, including cluster tree and micro and macro fossil charcoal accumulation rates. Pollen data are expressed as relative frequencies of the regional pollen sum. Horizontal line separates cluster 1 and clusters 2, Black boxes indicate radiocarbon dates.
The regional pollen signal of SC-C2 can be split in two main clusters, identifying two regional palynological zones (Figure 3). Cluster 1 corresponds to the period from ca. 8800 to 1975 cal a BP and cluster 2 from ca. 1975 cal a BP until present. Cluster 1 contains high values of trees and shrubs (55–65%) and lower values of Poaceae (25–30%) and other upland herbs (10–15%). The high proportions of trees and shrubs includes Celtis (ca. 15–20%), Trema, Macaranga, Eugenia, Vitex, Ficus, Proteaceae, Combretaceae, Podocarpus and Ericaceae (mainly between 1% and 5%). However, these high values of tree and shrub taxa in cluster 1 cannot be seen as evidence of a dense forested landscape. Some tree taxa are mainly found in alluvial environments (e.g. Celtis and Eugenia (see Burney, 1987a, 1988)), others are often present in disturbed landscapes (e.g. Trema and Ericaceae (see Burney, 1988; Irwin et al., 2010)), whilst others have a low indicative value as these taxa can originate from different vegetation types (e.g. Combretaceae (see Burney, 1987a)), or can disperse over long distances (e.g. Podocarpus (see Burney, 1987a; Gasse and Van Campo, 2001)). Moreover, Poaceae is still significantly present (25–30%) within pollen zone 1. Although some Poaceae pollen can come from the wetlands surrounding Lake Alaotra, the high values of Poaceae pollen and the fact that the current wetland is mainly dominated by Cyperaceae suggest that a significant part of the landscape was covered by grasses. Thus, the presented pollen data does not indicate a dense forested landscape before 1975 cal a BP. Instead, the pollen assemblage in cluster 1 suggests a wooded grassland or a woodland/grassland mosaic (hereafter abbreviated as wooded grassland), as previously discussed for central Madagascar by Burney (1987a) and Gasse and Van Campo (2001). Cluster 2 contains low values of trees and shrubs (15–20%) and high values of Poaceae (70–80%) and other upland herbs (ca. 10%) (Figure 3). This pollen assemblage suggests an open grassland, following Burney (1987a) and Gasse and Van Campo (2001). Taking into account the chronological uncertainties shown in Figure 2, the observed transition from wooded grassland towards open grassland occurred between ca. 2050 and 1700 cal a BP (Figure 4).
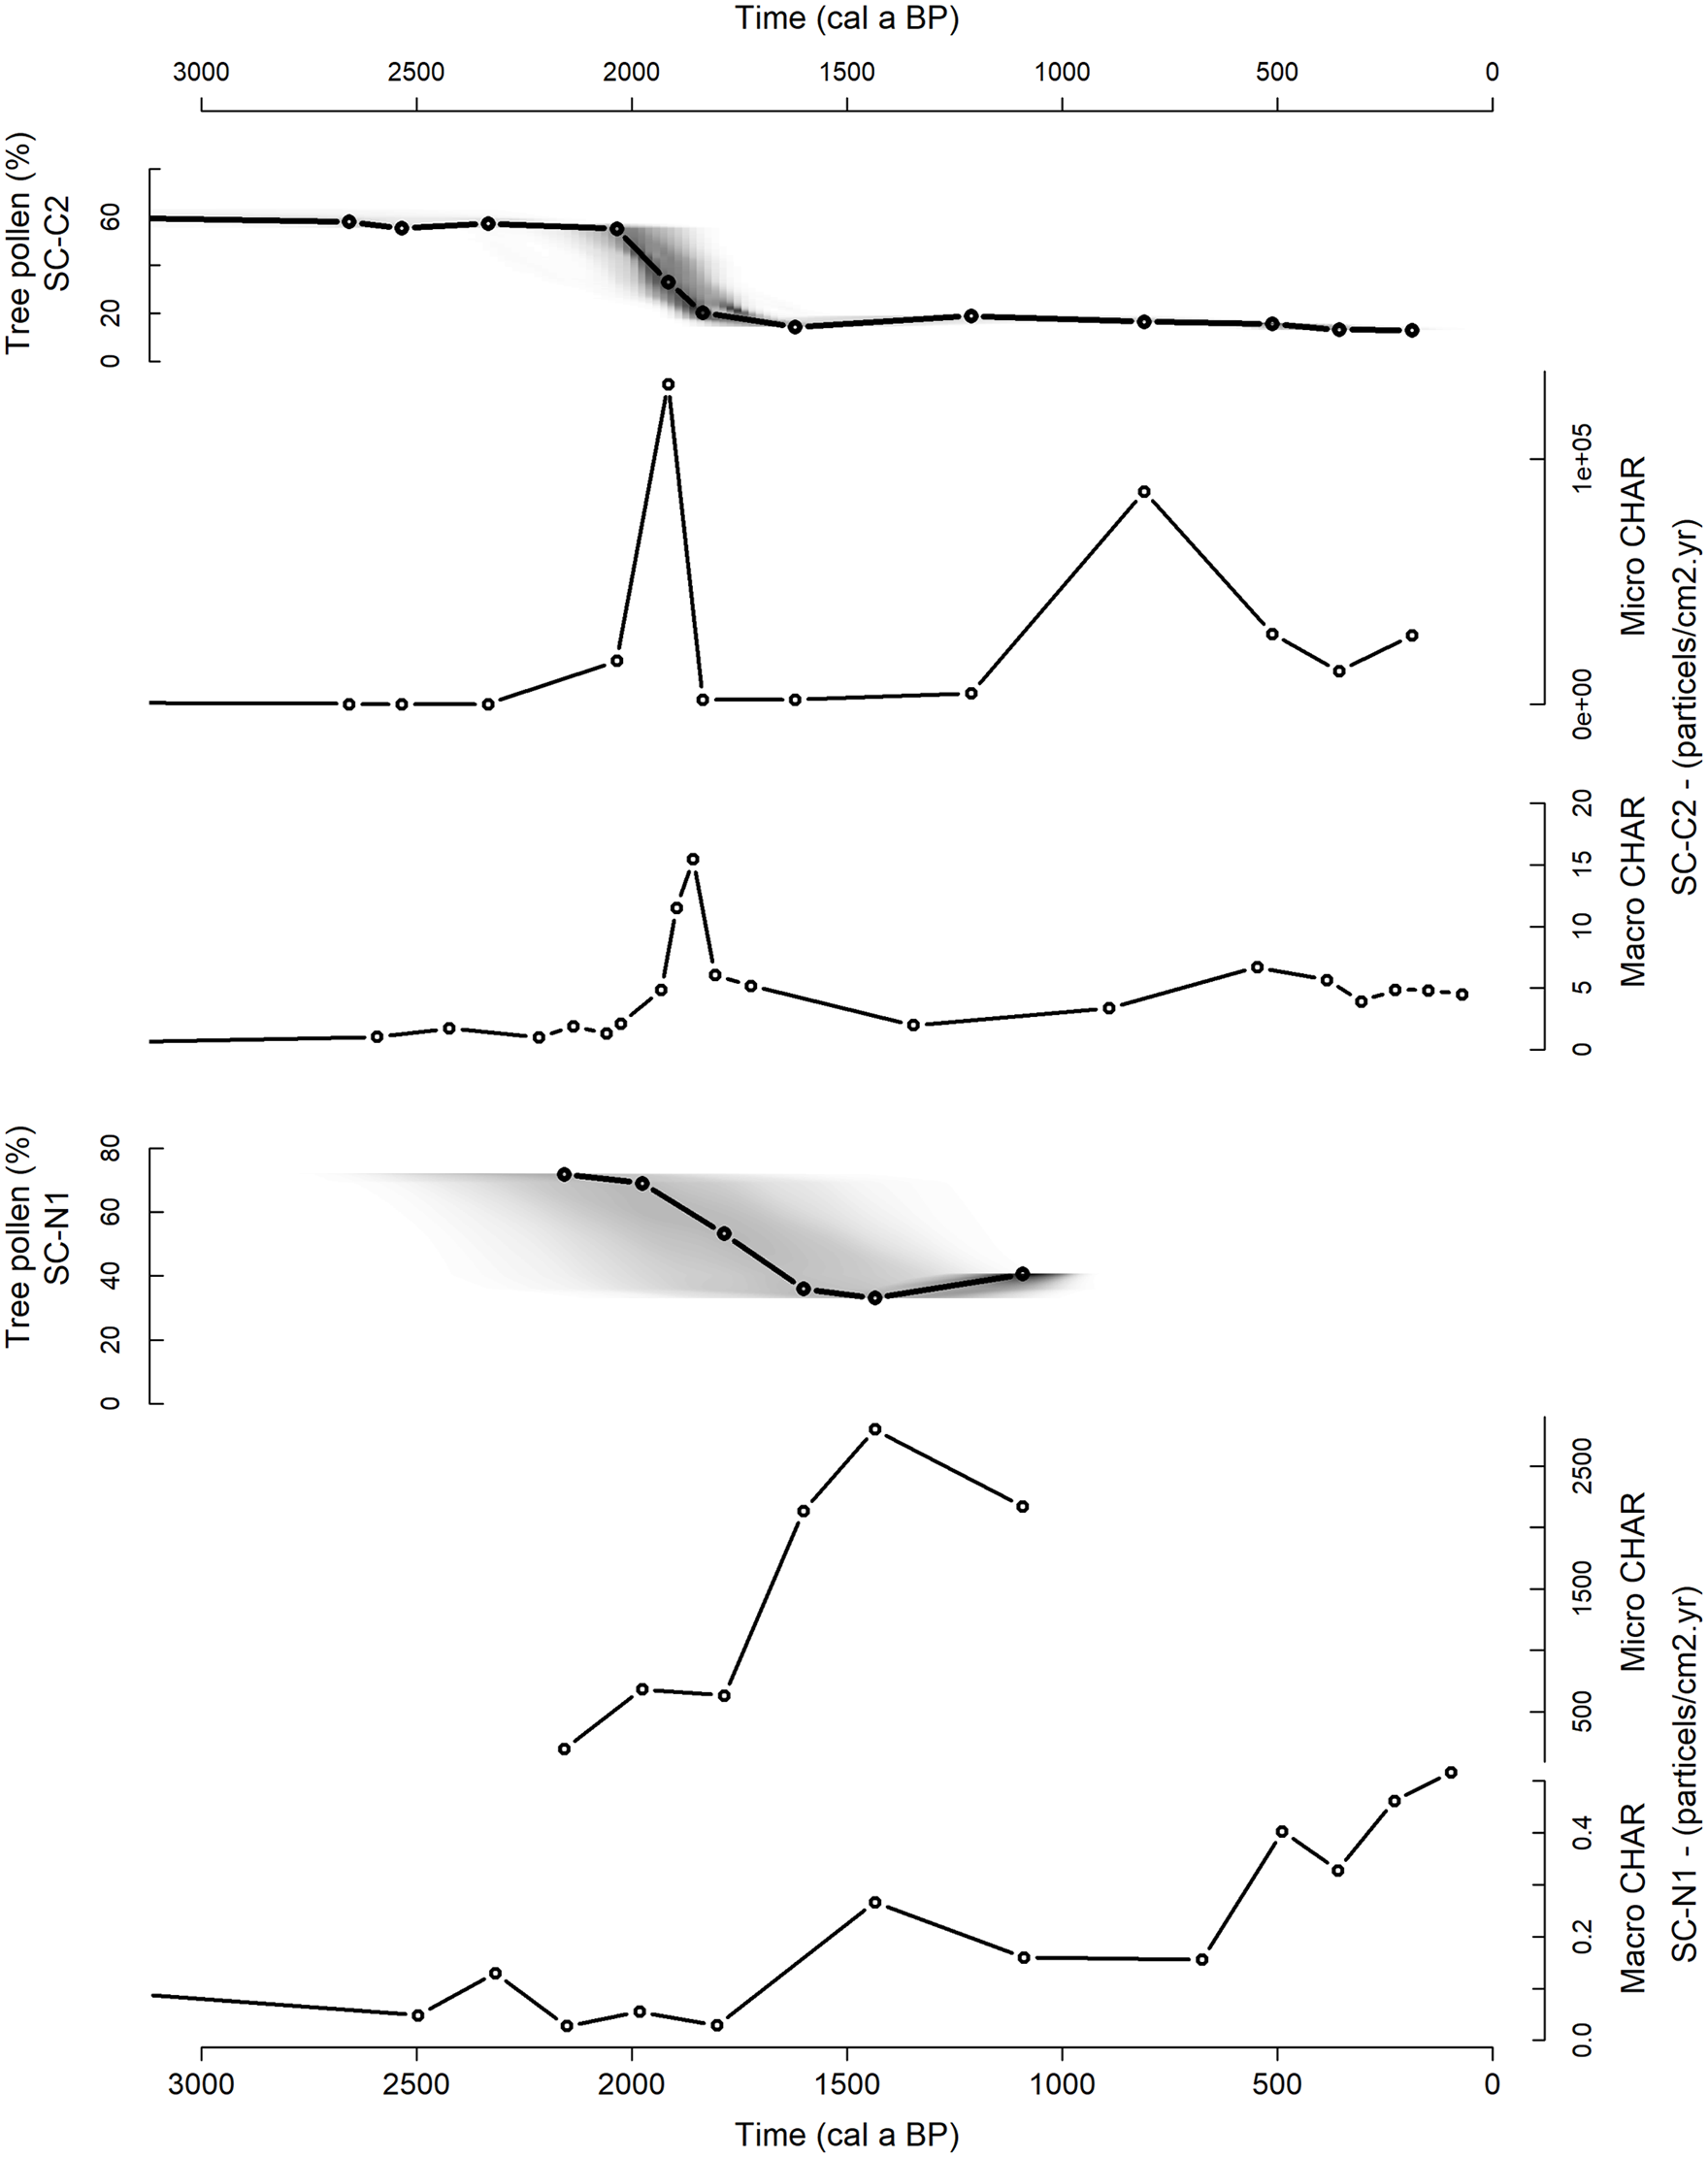
Percentage tree pollen (taking into account chronological uncertainties: darker grey indicates more likely calendar ages) and micro and macro fossil charcoal accumulation rate (CHAR) for SC-C2 (top graphs) and SC-N1 (bottom graphs).
Micro and macro fossil charcoal accumulation rates (CHAR) from SC-C2 are very low (<1000 micro particles cm−2 yr−1 and <2 macro particles cm−2 yr−1 respectively) until ca. 1975 cal a BP (Figures 3 and 4), indicating that fires were rare during that period. From ca. 1975 cal a BP onwards, micro and macro CHAR increases. Micro CHAR peaks at ca. 1915 cal a BP at a value of 130,000 micro particles cm−2 yr−1, macro CHAR peaks at ca 1850 cal a BP at a value of 15 macro particles cm−2 yr−1. These peaks fit within the time interval during which the pollen data point to a transition from wooded grassland to open grassland (Figure 4). A second peak in micro CHAR is apparent at ca. 810 cal a BP at a value of 80,000 micro particles cm−2 yr−1, although data resolution is lower for this period.
The timing of the vegetation transition observed from lake core SC-C2 is confirmed by the pollen record of lake core SC-N1 (Figure 4). Due to the lower pollen sums and lower temporal resolution of lake core SC-N1, only general trends are presented and discussed. The regional pollen signal of SC-N1 shows a decrease in trees and shrubs (from ca. 70% to ca. 35%) and increase in Poaceae (from ca. 20% to ca. 40%), dated between 2000 and 1700 cal a BP (Figure 4). Micro CHAR from SC-N1 starts to increase at ca. 2000 cal a BP, macro CHAR between ca. 1800 and 1450 cal a BP, ca. 100–400 years later than charcoal values from SC-C2.
To summarize, the pollen records from the two lake cores show a decrease in trees and shrubs (Figure 3), representing an opening in the landscape and a transition from a wooded grassland or a woodland/grassland mosaic to an open grassland. Taking into account the chronological uncertainties, this opening in the landscape occurred between ca. 2050 and 1700 cal a BP. Both micro and macro charcoal values increased in that time interval (Figure 4). After this decrease in trees and shrubs, the landscape is mainly dominated by an open grassland, as is observed today in the Lake Alaotra region.
Sediment accumulation in floodplains, wetlands and lake
Accumulation rates (AR) in floodplains, wetlands surrounding the lake and Lake Alaotra itself are presented in Figure 5. Long term floodplain accumulation rates in the Lake Alaotra region are estimated at ca. 1 mm year−1 for the last ca. 20,000 years (Figure 5a) (Brosens et al., 2022; Mietton et al., 2018). Floodplain accumulation rates show an increase in the last 1000 years and peak in the last 400 years with values up to 10–34 mm year−1 (Figure 5a).

Accumulation rates (AR) in the Lake Alaotra catchment: (a) floodplain accumulation rates (n = 16), (b) accumulation rates in the wetlands (n = 12) and (c) accumulation rates in Lake Alaotra (n = 13). Note the different scaling of the y-axes.
Also, an increase in accumulation rates in the last 400 year is suggested in the wetlands surrounding Lake Alaotra (Figure 5b).Long-term accumulation rates are ca. 0.1–0.5 mm year−1 over the last ca. 35,000 years and wetland accumulation rates seem to increase in the last 400 years, up to 1–3.5 mm year−1. However, more radiocarbon dates from several locations in the wetlands are needed to better quantify and support this increased sediment accumulation.
In Lake Alaotra sediment accumulation rates are constantly low at ca. 0.01 mm year−1 between 35,000 and 8000 cal a BP, and at ca. 0.1–0.2 mm year−1 between 8000 cal a BP and the present, with no relative increase over the last centuries (Figure 5c). Lake core SC-C2 suggests an increase in sediment accumulation rates from 0.01 to 0.1 mm year−1 at ca 2100 cal a BP and an increase to 0.45 mm year−1 at ca. 2000 cal a BP, but this increase is not sustained over the last centuries (Figure 2a).
Discussion
Vegetation changes in the Lake Alaotra region
The pollen data from Lake Alaotra suggest a wooded grassland or a woodland/grassland mosaic in the Lake Alaotra region before ca. 2050 cal a BP (Figures 3 and 4). Between ca. 2050 and 1700 cal a BP, an opening in the landscape and a change to grassland is indicated by the pollen records. Both micro CHAR, representing regional fire activities, and macro CHAR, representing more local fire activities, increased within or directly after this time period (Figures 3 and 4). This is in line with the findings of Burney (1987a) and Gasse and Van Campo (2001) that suggest a wooded grassland or a woodland/grassland mosaic in central Madagascar prior to human impact. Our data confirms that grasslands were present before human presence on the island. This implies that the hypothesis formulated by e.g. Humbert (1927) and Lavauden (1931) that Madagascar was covered by a dense forest prior to human arrival is not valid, at least not for the Lake Alaotra region (for this discussion see also Crowley et al., 2021; Irwin et al., 2010; Joseph et al., 2021; Solofondranohatra et al., 2020). The observed transformation from a woodland/grassland mosaic or wooded grassland to an open grassland between ca. 2050 and 1700 cal a BP in Lake Alaotra, pre-dates previous described openings in the landscape in Madagascar. The island-wide increase in grass pollen and decrease in trees and shrubs is dated by previous palynological studies between 1450 and 900 cal a BP (Burney, 1987a; Burney et al., 2003; Virah-Sawmy et al., 2010).
The observed changes in vegetation and fire activities are abrupt (less than a few centuries) and persistent, suggesting impact by humans. Although the timeline of human colonization in Madagascar is still under debate and is not well set for all regions (see introduction), Pierron et al. (2017) suggest human presence in the central highlands during the time of the observed vegetation change (i.e. between 2050 and 1700 cal a BP; Figure 4). Hunting and foraging were the main subsistence strategy during that time (Dewar, 2014; Dewar and Wright, 1993; Godfrey et al., 2019). It has been shown in Madagascar that hunter and forager communities could have an impact on the vegetation through the use of fire (Dewar, 2014). The results from our study suggest that also in the Lake Alaotra region fires played a key role in the vegetation transition, since the peak in charcoal values is in the same time interval as the vegetation change (Figures 3 and 4). Studies in Madagascar have previously shown that the human-induced increased fire frequencies could have had an impact on the balance between grassland and forest and could have triggered an expansion of the grassland area by preventing woodland succession (e.g. Burney, 1987b; Johnson, 2009; Vorontsova et al., 2016). Also in other parts of the world, studies have shown that fire was used as a tool by hunter and forager communities to modify plant communities for human benefit, for instance to enhance forage production, to attract pray, or to create good hunting conditions (e.g. Bonnicksen, 2000; Kay, 2000). These early human fires were often frequent and prevalent and as such became an important ecological driver in many parts of the world (e.g. Abrams and Nowacki, 2019; Bowman, 1998; Marlon et al., 2013).
An additional explanation of how humans could have (indirectly) impacted the vegetation in the Lake Alaotra region is through the decline in megafauna population. This decline is dated for the central highlands of Madagascar around the same period as our observed vegetation change (ca. 2000 cal a BP; Crowley, 2010). As previously described in several parts of the world (for a review, see Johnson, 2009) and in SW Madagascar (Burney et al., 2003; Domic et al., 2021), extinct megafauna (e.g. elephant birds, giant lemurs, pygmy hippopotamuses and giant tortoises) maintained wooded grasslands and woodland/grassland mosaics and played key ecological roles. Studies of living large herbivores show the potential impact of extinct megaherbivores on vegetation (see e.g. Johnson, 2009). For instance, intense grazing by white rhinos in current day African savanna maintain grass patches within grass-thickets mosaics and thereby hinders the spread of fire. The removal of white rhinos in a region, in turn, increases fuel loads and fuel continuity (Owen-Smith, 1988; Waldram et al., 2008).The extinct megaherbivores would have maintained grasslands, dispersed seeds of several tree species (Domic et al., 2021) and reduced the above ground biomass by grazing and browsing vegetation and leaf litter, and as such reduced flammable material and limited fire regimes (Pedrono et al., 2013). Consequently, a decline in these megaherbivore populations could have caused an increase in above ground biomass, and thus an increase in fires regimes. This could have resulted in more open and uniform grassland as the increased fire regimes may have prevented succession to woodland and the development of woodland/grassland mosaics (Johnson, 2009). This has been shown in SW Madagascar (Burney et al., 2003) where fossil spores of the dung fungus Sporormiella indicated high megafaunal biomass before human arrival and a decline after human arrival at ca. 2000 cal a BP. This was followed by an increase in charcoal values and a vegetation shift from a semi-arid wooded mosaic to grassland (Burney et al., 2003, 2004). Burney et al. (2003) hypothesized that also in the wooded grasslands and wet savannas in the central highlands of Madagascar the decline of megafaunal grazing and browsing pressure were responsible for the increase in fire intensities and the resulting open grassland vegetation. Our study provides new data for the central highlands that fits within this hypothesis. Indeed, Crowley (2010) showed that the extinct megafauna population declined in the central highlands by 2000 cal a BP. Right after this date, an opening in the landscape and an increase in charcoal accumulation rates are apparent from our data (Figure 4). This shows again the (indirect) impact that hunter and forager communities could have had on the vegetation cover in their surroundings, in this case by negatively impacting megafauna and their ecological function.
This (indirect) human impact on the vegetation pre-dates the significant increase in human impact during the subsistence shift, a shift from hunting and foraging to farming and herding with zebu cattle, starting between 1050 and 700 cal a BP in the central highlands (Godfrey et al., 2019). The cattle-raising in combination with tavy (a slash and burn cultivation, or swidden agriculture) is assumed to have induced the major increase in human impact on the landscape. Indeed, around this date, a second peak in charcoal accumulation rates is detected in our charcoal data (Figure 4). In many other regions in Madagascar an increase in grass pollen and charcoal rates are observed around the timing of this subsistence shift (see e.g. Godfrey et al., 2019; Virah-Sawmy et al., 2010; Voarintsoa et al., 2017).
Although indications for human impact as the main driver for the vegetation changes in the Lake Alaotra region are apparent, climatic drivers cannot be ruled out. Several drought-periods are reported in the last two millennia for Madagascar, which are well documented in the south-western (e.g. Razanatsoa et al., 2022; Vallet-Coulomb et al., 2006; Virah-Sawmy et al., 2010) and north-western part of the island (e.g. Godfrey et al., 2019; Li et al., 2020; Wang et al., 2019), and illustrated by the δ18O isotope records from a cave on the island of Rodrigues and speleothem records in NW Madagascar (Figure 6c; Li et al., 2020). Such drought-periods could have contributed to the observed changes in fire regimes and vegetation, as have been observed throughout the Holocene in central and southwestern Madagascar (e.g. Burney, 1987a, 1987b; Gasse and Van Campo, 2001), or could have enlarged the effect of the (indirect) human impact. However, we see two reasons why the relative contribution of climate variation on the observed vegetation changes is likely to be small. Firstly, there is no temporal match between the observed vegetation changes in the Lake Alaotra region and the major island-wide drought around 950 cal a BP (Godfrey et al., 2019; Razanatsoa et al., 2022; Virah-Sawmy et al., 2010) nor the drying trend between 700 and 200 cal a BP (Li et al., 2020) (Figure 6a–c). Secondly, the increase in micro and macro CHAR in our two lake cores differs between 100 and 400 years (Figure 4). This can indicate that regional climatic drivers, which have mostly synchronous effects on fire regimes in different sub-catchments, are less important. However, it is important to note that detailed and direct climate proxies for the central highlands are still lacking and that these proxies are needed to solve the discussion on the relative role of climatic drivers.
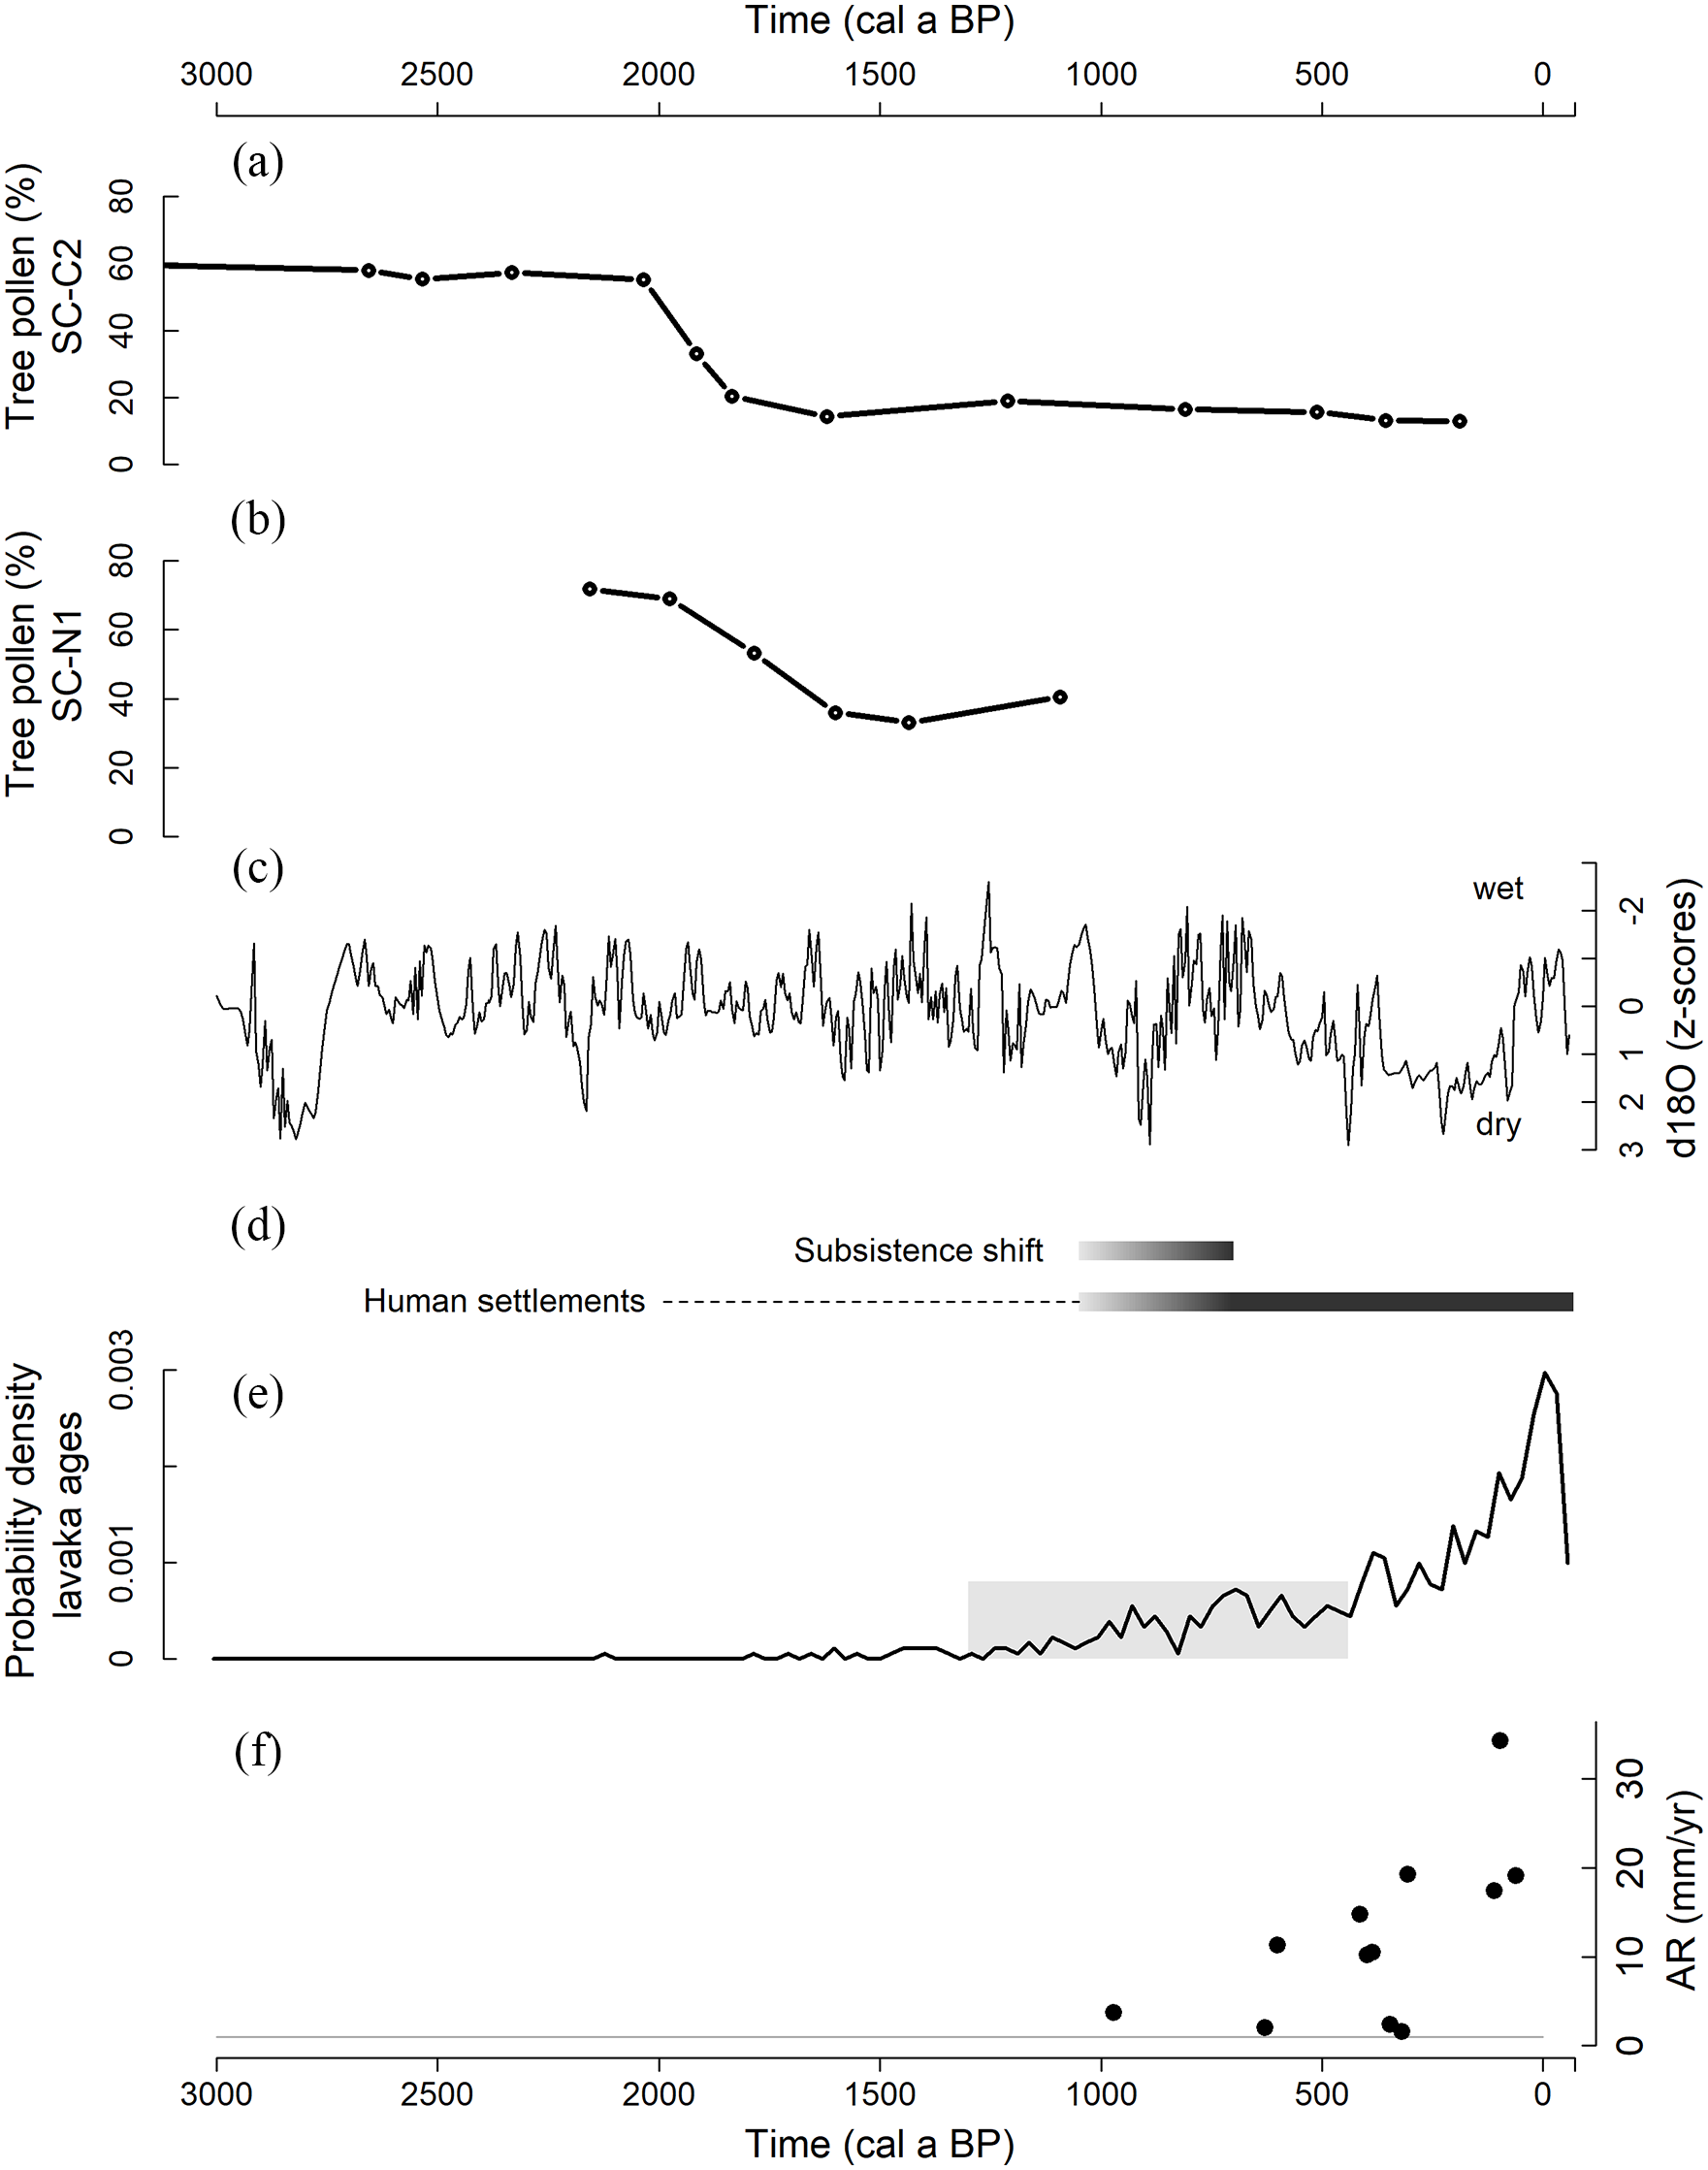
(a) Percentage tree pollen from lake core SC-C2, (b) percentage tree pollen from lake core SC-N1, (c) z-score-transformed δ18O speleothem record of Rodriguez, which can be used as a proxy for wet and dry conditions in Madagascar (Li et al., 2020), (d) timeline of human presence and human impact in the central highlands of Madagascar, based on Godfrey et al. (2019), Douglass et al. (2019) and Pierron et al. (2017). Dotted line indicates the uncertainty on the human history in the central highlands. (e) Probability density function of lavaka ages in the Lake Alaotra region. The onset of increased lavaka activity at 870 ± 430 cal a BP is indicated in grey (Brosens et al., 2022). (f) Floodplain accumulation rates in the catchment of Lake Alaotra. Grey line indicates long term floodplain accumulation rate (Brosens et al., 2022; Mietton et al., 2018).
Sediment transfers in the Lake Alaotra region
Floodplain accumulation rates in the Lake Alaotra catchment are ca. 1 mm year−1 for the last ca. 20,000 years (Brosens et al., 2022; Mietton et al., 2018), and increase up to 10–34 mm year−1 in the last 1000 years (Figure 5a). These recent floodplain accumulation rates are one order of magnitude higher than the long term accumulation rates and cannot be explained by the timespan dependent scaling of accumulation rates (i.e. a measurement artefact when studying accumulation rates on long time scales (Brosens et al., 2022; Sadler, 1981)). As Kemp et al. (2020) showed, floodplain accumulation rates are expected to increase on average by ca. 10% for a decrease in timespan from 1000 to 200 years under natural conditions. The tenfold increase in accumulation rates observed over this period in this study is therefore not due to a measurement artefact (see also Brosens et al., 2022). Moreover, we have no indications of high lateral river activity in the studied valleys. Recent high floodplain accumulation rates in the Lake Alaotra catchment were highlighted previously by Bakoariniaina et al. (2006). Lavaka (gullies) are the most important sediment sources for floodplains over these timescales, as demonstrated by the lavaka-dominated 10Be-signal of many river and terrace sediments in the central highlands (Cox et al., 2009). The increased accumulation rates in the wetlands, up to 1–3.5 mm year−1 in the last 400 years, is confirmed by the decrease in organic carbon content in the peat cores in these wetlands suggesting an increase in soil-derived sediment input at around the same age (Razanamahandry et al., unpublished data). The timing of the increase in floodplain and wetland sediment accumulation in the Lake Alaotra catchment (which started at ca. 1000 cal a BP and peaked in the last 400 years, see Figures 5 and 6 and Brosens et al. (2022)), does not match with the timing of the vegetation changes dated between 2050 and 1700 cal a BP (Figures 4 and 6). There is an indication of a higher sediment accumulation in the lake at ca. 2000 cal a BP (Figure 5c) possibly indicating a short period with high sediment mobilization from a nearby sediment source, although this should be confirmed with extra radiocarbon dates on extracted pollen from more lake cores. Overall, the transition from wooded grassland towards open grassland did not trigger direct changes in sediment mobilization and floodplain sediment accumulation, as there is a time lag of ca. 1600–1300 years (Figure 6). We argue that the open grassland was not more prone to large scale erosion processes than the replaced wooded grassland, and so erosion and corresponding floodplain and wetland accumulation rates remained initially constant after the shift in vegetation. Previous studies has shown that vegetation cover is crucial in preventing gully initiation (Gyssels et al., 2005; Prosser and Slade, 1994). Indeed, lavaka formation in the Lake Alaotra region is estimated to increase strongly since 870 ± 430 cal a BP (Figure 6d) (Brosens et al., 2022). Thresholds in protective vegetation cover, triggering large scale erosion processes and changes in floodplain sediment accumulation, were not crossed (Notebaert et al., 2018; Verstraeten et al., 2017). It is, however, possible that slopes trap sediments before reaching these thresholds and that sediments were buffered at vegetation barriers or at footslopes (see e.g. Lang et al., 2003; Notebaert et al., 2011). More data on all aspects of the sediment cascade, including colluvial storage, are needed to fully understand the role of this hillslope-floodplain connectivity for sediment transfers in the Lake Alaotra region. Also, more radiocarbon dates from several locations in the floodplains and wetlands are needed to cover all possible variability and fully understand and quantify these sediment transfers.
There is, however, a very strong agreement between the timing of increased floodplain and wetland sediment accumulation and increased lavaka formation, as demonstrated by Brosens et al. (2022) for the Lake Alaotra catchment. The main sources of the sediment stored in the floodplains in the central highlands are lavaka (Cox et al., 2009). Brosens et al. (2022) argued that this increased lavaka formation was triggered partly by the drying climate since at least 700 cal a BP (Figure 6c and Li et al., 2020; Virah-Sawmy et al., 2010), but mainly by the change in land management and the introduction of cattle from 1050 to 700 cal a BP onwards (with the subsistence shift; Godfrey et al., 2019). Increased grazing pressure following increased population size in the last 400 years has led to a reduced protective vegetative cover, which in turn made the landscape more prone to lavaka formation and resulted in the lavaka dominated landscape that can be observed today in the Lake Alaotra region. Thus, the drying climate and change in land management that likely triggered the increased lavaka activity seem more important for sediment fluxes and floodplain sediment accumulation than the vegetation shift observed between 2050 and 1700 cal a BP (Figure 6). Therefore, the intensity of grassland use seems to be more important than the surface area of grassland in controlling the initiation and activity of lavaka (Brosens et al., 2022) and thus floodplain and wetland sediment accumulation. This has implications for future conservation and management of the vegetation in the region. Soil conservation in the Lake Alaotra region does not necessarily require reforestation; a less intensive use and better management of the grasslands (e.g. reducing fires and a controlled fire management and less intensive grazing) might suffice in this context. The increased sediment delivery to the fluvial system, following the increased lavaka activity, caused an increase in floodplain and wetland aggradation but did not cause an increase in accumulation rate in Lake Alaotra. Although a very recent (<100 years) increase in lake sediment accumulation cannot be excluded due to limited data availability for that period, our data do not show an increase over the last centuries (Figure 5c). Thus, sediments produced by lavaka in the Alaotra catchment do not reach the lower sink in the sediment cascade, but are buffered in the floodplains and wetlands. According to the sediment cascade model (Lang and Hönscheidt, 1999; Zolitschka et al., 2003), these floodplain and wetland sediment sinks need to be filled before transfers to the next downstream sink (in this case the lake) can take place. Construction of drainage canals during the last decades in the wetlands surrounding Lake Alaotra have however created more direct links between the sediment sources and the lake. These drainage canals can bypass the buffering effect of the wetlands (Mietton et al., 2018) and can possibly increase the sediment accumulation in the lake. Thus, the preservation of the wetlands and measures against the drainage canals in these wetlands are needed to limit lake sediment accumulation in the near future.
The absence of an increase in accumulation rates in Lake Alaotra (Figure 5c) also indicates that the response time of the entire catchment to the lavaka erosion pulse is much larger than the duration of the erosion pulse. This means that accumulation rates in Lake Alaotra cannot be used as a measure for erosion processes nor as a proxy for human impact in the catchment of the lake. Instead, in order to unravel past sediment dynamics and the role of human impact on it, the various sediment sources and sinks within a catchment should be quantified through the construction of, for instance, time-differentiated sediment budgets (Notebaert et al., 2011; Trimble, 2009; Verstraeten et al., 2017).
Conclusions
This study shows the vegetation changes in the last 2600 years in the Lake Alaotra region, located in the central highlands of Madagascar, based on pollen records from two lake cores. A transition from a wooded grassland or woodland/grassland mosaic towards open grassland and an increase in charcoal data is observed between 2050 and 1700 cal a BP, which pre-dates previous described openings in the landscape in Madagascar. The presented data suggests human impact as the main driver for the vegetation changes, directly through the use of fire, and indirectly by negatively impacting megafauna and their ecological function. However, more detailed data on climate change, better records on human presence, and more detailed data on how hunter and forager communities impacted the landscape are needed for the central highlands in order to disentangle all driving forces for the observed vegetation transition.
The observed vegetation changes did not result in a direct destabilization of the landscape. In contrast with the timing of these vegetation changes, the increase in floodplain and wetland sediment accumulation in the Lake Alaotra catchment only peaks in the last 400 years, driven more by the intensive use of grasslands than the proportion of grassland area in the landscape, since the intensive use and management of grasslands triggers the initiation and activity of lavaka (Brosens et al., 2022) and thus the increased sediment fluxes. No increase in sediment accumulation is observed in the lake. It appears that sediments produced in the Alaotra catchment are buffered in the floodplains and wetlands and have not yet reach the lowest sink in the sediment cascade. This illustrates the importance of quantifying all sediment sources and sinks within a catchment to unravel past sediment dynamics and its driving forces.
Footnotes
Acknowledgements
We thank the local authorities of the districts of Ambatondrazaka and Amparafaravola for providing permission to and help during the fieldwork. Seth Callewaert and Lauren Ackermans contributed to generating the macro charcoal data. Veerle Verschoren is thanked for her valuable input and discussions on the topics discussed in this manuscript. The editor, Vivienne Jones, and the anonymous reviewers are thanked for their valuable comments and suggestions which have significantly improved the manuscript.
Funding
The author(s) disclosed receipt of the following financial support for the research, authorship, and/or publication of this article: This research is part of the MaLESA project, funded by a KU Leuven Special Research Fund grant (An integrated approach for assessing environmental changes in soil-covered landscapes: the case of Madagascar), and supported by Research Foundation Flanders (FWO; grants 11B6921N, 12Z6518N, V436719N and V436319N), YouReCa and VLIR-UOS.
