
Abstract
We propose a model that may explain long-term population growth and decline events among human populations: The intensification of production generates a tradeoff between the adaptive capacity of individuals to generate a surplus of energy to maximize their fitness in the short-run and the long-term capacity of a population as a whole to experience a smooth transition into a demographic equilibrium. The model reconciles the conflicting insights of dynamic systems models of human population change, and we conduct a preliminary test of this model’s implications in Central Texas by developing time-series that estimate changes in human population density, modeled ecosystem productivity, human diet, and labor over the last 12,500 years. Our analysis indicates that Texas hunter-gatherers experienced three long-term population growth overshoots and recessions into quasi equilibria. Evidence indicates that each of these overshoots and recessions associate with changes in diet and labor devoted to processing high density, lower quality resources to unlock calories and nutrients. Over the long-term, population recessions may be necessary for populations to experiment with social and physical infrastructure changes that raise the carrying capacity of their environment.
Introduction
Recent advances in the analysis of archeological radiocarbon now shed light on the long-term growth and decline of human populations throughout the Holocene (e.g. Bird et al., 2020; Brown and Crema, 2021; Freeman et al., 2018a, 2021a, 2021b; Kelly et al., 2013; Lima et al., 2020; Palmisano et al., 2019; Robinson et al., 2013, 2021; Shennan et al., 2013; Tallavaara and Seppä, 2012; Timpson et al., 2014; Zahid et al., 2016). Yet, despite these advances, as well as decades of modeling (e.g. Anderies, 1998, 2003; Brander and Taylor, 1998; Cohen, 1995; Lee and Tuljapurkar, 2008; Meyer and Ausubel, 1999; Puleston and Winterhalder, 2019; Puleston et al., 2014; Richerson and Boyd, 1998; Richerson et al., 2009; Wood, 2020), explanations that link the long-term growth and decline of human populations, economic behavior, and climate throughout the Holocene remain contested (Puleston and Winterhalder, 2019). In this paper, we contribute to understanding the interactions between population, economic behavior, and climate by proposing an Adaptive Capacity Tradeoff Model of population change among hunter-gatherers. We describe how the model reconciles the conflicting insights of dynamic systems models of human population change, and we conduct a preliminary evaluation of the model in Central Texas, generating hypotheses for future research.
An adaptive capacity tradeoff model
The Adaptive Capacity Tradeoff Model builds on the insights of a set of dynamic systems models that we call Malthus-Boserup models of human population growth. Malthus-Boserup models of human population growth all include three principles (e.g. Anderies, 1998, 2003; Cohen, 1995; Freeman et al., 2021b; Lee and Tuljapurkar, 2008; Lee et al., 2009; Meadows et al., 1972; Meyer and Ausubel, 1999; Puleston and Tuljapurkar, 2008; Puleston et al., 2014; Puleston and Winterhalder, 2019; Richerson and Boyd, 1998; Richerson et al., 2009; Wood, 1998, 2020): (1) Human populations display an amplifying feedback in which more individuals beget more individuals. (2) Human populations experience limits in which the competition for resources becomes so costly for individuals that net per capita fitness declines. (3) Human populations may innovate or adopt social and technological means that increase the productivity of their economies and, potentially, escape from limits. The pressure to innovate is defined by a minimum tolerable well-being that is greater than the minimum well-being necessary for a population to replace itself at a limit (e.g. Freeman et al., 2021b; Lee, 1986; Richerson et al., 2009; Wood, 1998, 2020). Whenever well-being crosses the minimum tolerable threshold, populations receive signals that might provide incentives for individuals to change how they construct their niche via social and technological means.
Although Malthus-Boserup models share the above principles, disagreement remains about how to conceptualize escapes that raise the limits of a population. First, Richerson et al. (2009) build a model of human population growth that subsumes all potential technological and social changes that might occur into a single parameter. This Boserupian parameter assumes that social and technological changes occur more slowly than population change and in an environment external to that of the modeled population. In their model, populations quickly approach carrying capacity (amplifying feedback), cross a minimum tolerable income threshold (well-being), and then adopt new technology and social forms, as long as the rate of cultural evolution outside the system is high enough. Based on this model, Richerson and colleagues argue that, over thousands of years, a population likely never approaches a population equilibrium. Rather, populations display slow and continuous growth that is proportional to the rate at which innovations raise the productivity of labor and/or land area. As Richerson et al. (2009) state, “we do not expect to see any systematic evidence of increased population pressure immediately before major innovations. Population growth is likely to result from innovations, not the other way around, on the time scales that we normally observe in the archaeological record.” This model raises key questions: Is innovation a constant process occurring as a linear function of the background rate of cultural evolution outside a population system; will individuals adopt any innovations that increase productivity whenever they experience population pressure; or do populations sometimes forgo innovations in favor of short-term fixes that entail tradeoffs?
Second, Wood (1998) proposes a ratchet model of human population growth. In Wood’s model, again, populations experience amplifying feedback, and this drives a system into a zone of population pressure. In this zone of population pressure, individuals have an incentive to adopt a new production system (collection of interacting social and technological traits) that expands the carrying capacity of an environment and leads to long-term population growth. So far, this is very similar to Richerson and colleagues’ model. However, there is a key difference. Wood uses the metaphor of a ratchet to describe the process of change in production systems. Rather than modeling innovation as proportional to a background rate of cultural evolution outside the population system and assuming that individuals will adopt any innovation that raises their well-being, the ratchet model proposes that changes in production systems display path dependence and diminishing returns.
Path dependence means that past changes in the production of resources have an inertia that constrains future changes. Diminishing returns, in this case, means that successive changes in production along a path dependent trajectory provide smaller and smaller increases in surplus production. To convey this process, Wood (2020) imagines the adoption of rice agriculture. At first, the adoption of shifting rice agriculture and associated changes in technology and social organization (e.g. storage, labor pooling) significantly increase the surplus production of a population. In turn, population grows and, eventually, population pressure induces individuals to shorten their fallow periods. Shortening fallows increases surplus production, and population, again, grows toward a new limit. As population density approaches the new limit, population pressure, again, provides an incentive for the construction of rock walls and tenure arrangements that isolate plots of land. Finally, isolated plots become wet rice paddies. Each successive change in this scenario builds upon previous landscape and institutional modifications (path dependence) and provides less and less increase in surplus production (diminishing returns). As Wood (2020) states, “As innovations accumulate, they may progressively narrow the field of further development and lead eventually to extreme specialization and little capacity for further change.” In short, a convergence of limits in the population and production systems that we call calcified (specialized and difficult to change).
To evaluate the plausibility of the MaB Ratchet model among hunter-gatherers, Freeman et al. (2021b) use approximately 1700 radiocarbon ages to create calibrated summed probability distributions (SPDs) in Central Texas. They then used loglet analysis to fit summed logistic models to the SPD of Central Texas, and the best fitting model contained three components of growth. Based on these results, Freeman et al. (2021b) proposed that the exponential shape of the SPD observed in Central Texas over 12,500 years results from three successive waves of large social and technological changes that created new production systems. In subsequent work, Freeman and colleagues attempted to test whether increases in estimated population from 8400 to 400 cal BP were driven by changes in technology and social organization related to resource extraction or climate changes that increased the productivity of Central Texas ecosystems. Their analysis indicates that, over 8000 years, changes in technology and social organization that increased the proportion of biomass extracted from ecosystems had a larger effect on increases in carrying capacity than changes in climate that impact the productivity of ecosystems (Freeman et al., 2023b). However, this result is so coarse grained that it does not distinguish between the population dynamics proposed by Richerson et al. (2009) and Wood (1998, 2020). Did Central Texas hunter-gatherers incrementally increase their carrying capacity over time, never entering into a Malthusian equilibrium where the limits of the population and production systems converged; or did populations and economies co-evolve along the trajectory imagined by the MaB ratchet? These questions remain unanswered.
Finally, both of the above models and the analysis of Freeman and colleagues assume that human populations experience smooth, continuous growth and, potentially, smooth transitions into population equilibria over the long-term. However, a third set of Malthus-Boserup models suggests that populations may experience cycles of growth and decline due to behavioral plasticity–the ability of individuals to adjust levels of labor and per capita resource extraction in response to immediate circumstances rather than waiting for slower evolutionary processes. For example, Anderies (2003, 1998) models the carrying capacity of agricultural economies from the bottom-up as a function of food independent and food dependent fertility and mortality. A basic insight derived from these models is that fast changes in labor that increase the productivity of agriculture creates population and ecosystem instability. Human populations do not find a stable population equilibrium but oscillate, often experiencing long-term population growth overshoots followed by recessions (Anderies, 1998, 2003). Behavioral plasticity generates this behavior by weakening the feedback between the state of a resource base and fertility and mortality. This means that crossing a minimum level of well-being that provides an incentive for changing a production system may not occur before the resource base degrades (see also Puleston et al., 2014). Because of the non-linear dynamics of ecosystems, this delay in feedback between fertility, mortality, and how quickly resources decline often results in a population overshoot and recession limit cycle: Long slow population increase followed by rapid decline of population and recovery of the resource, and, again, population increase (e.g. Anderies, 1998). These insights raise the question of under what conditions populations will respond to declines in well-being by focusing on behavioral adjustments in the short-run versus adopting/innovating major changes in their production system?
In sum, previous Malthus-Boserup models of human population growth suggest three potentially conflicting insights. Over thousands of years, (1) populations may experience continuous, incremental growth, limited only by the background rate of cultural evolution of production systems, or (2) populations may experience repeated cycles of long-term population growth driven by large changes in production systems followed by periods of saturating growth as the limits of production and population systems converge. (3) Over hundreds of years, holding a production system constant, behavioral plasticity might generate population overshoots and recessions by weakening the feedback signals from a resource base to a population’s fertility and mortality–the very same signals that are supposed to create incentives for innovations in the models proposed by Richerson et al. (2009) and Wood (1998, 2020). To help make progress on understanding these processes, we propose a graphic model that reconciles insights (2) and (3) and provides testable hypotheses that may allow researchers to distinguish between insights (1) and (2) among hunter-gatherers.
The model
The Adaptive Capacity Trade-off model proposes that, at minimum, we can write the change in a population’s limit over time as:
Following Anderies (1998), we propose that, especially in settings with fewer resource options, as changes in production systems calcify, human actors will double down on intensifying their extraction of existing resources. This means that foragers will increase their labor
For instance, consider the following Central Texas inspired scenario. Upon the initial occupation of Central Texas, foragers primarily harvested large to medium sized animals, say, hypothetically, for 60% of their diet from meat. Such a strategy requires a larger area per person because animals are a high quality, mobile, and sparse resource (Binford, 2001; Kelly, 2013), and, thus, have a lower limit where competition for resources impacts well-being. Over decades to centuries, foragers can adjust to declines in hunting returns by simply hunting more days and taking more animals per hunting trip. This adjusts
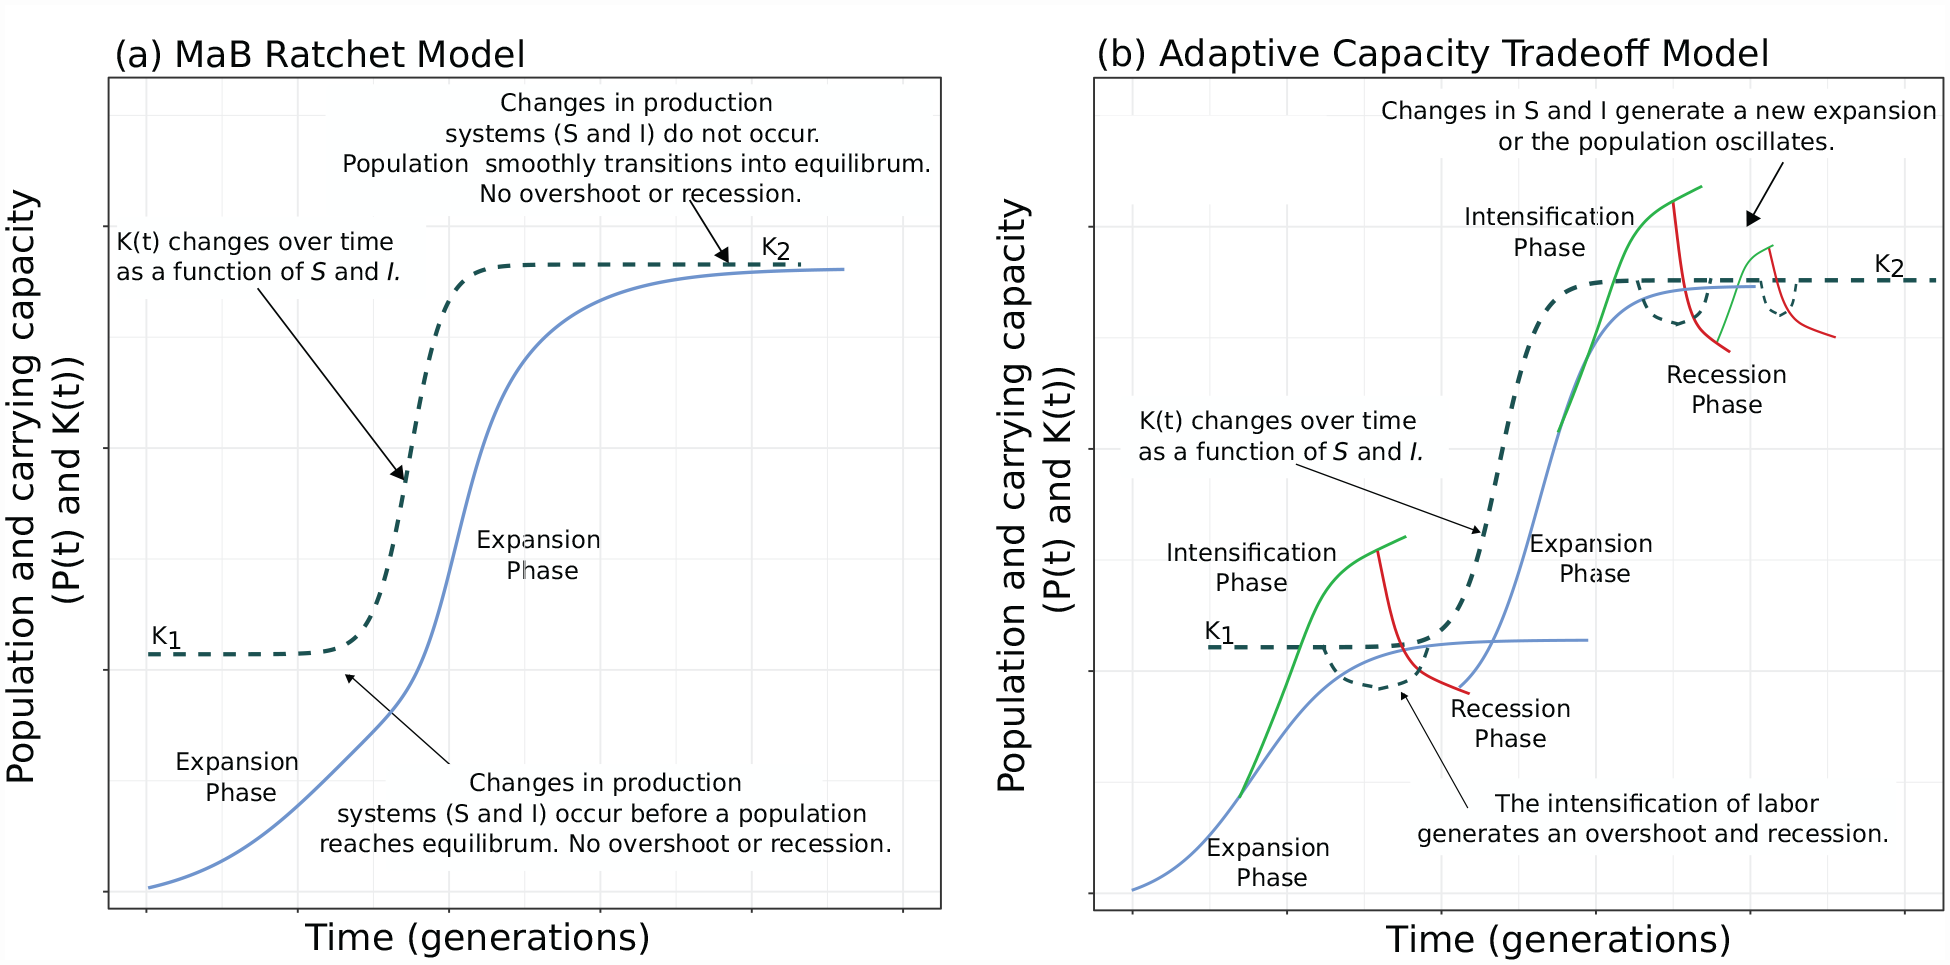
Proposed population dynamics. (a)-The Original MaB Ratchet Scheme following Wood (1998) and Freeman et al. (2021b).
In contrast, Figure 1b illustrates the Adaptive Capacity Tradeoff model. In this model,
This trade-off dynamic is illustrated in Figure 1b by coupled fluctuations of population
The Adaptive Capacity Tradeoff Model makes several predictions that differ from the original MaB Ratchet. (P1) In the original MaB Ratchet, we can model the expansion of
(P2) The MaB Ratchet predicts that within a component of growth, we should observe positive, diminishing returns in resource production followed by a large increase in resource production between components of growth. As noted, among hunter-gatherers in terrestrial ecosystems, shifting toward economies based on plants lowers the area necessary per person to live and reproduce. Thus, we should observe an increased consumption of plants and then a leveling off of increasing plant consumption within components and an overall increase in plant consumption between components. In the MaB Ratchet case, labor and ecosystem productivity should always have a much smaller effect on resource extraction than changes in
(P3) If the population growth–intensification–recession cycle described by the Adaptive Capacity Tradeoff Model drives regular, large population overshoots and recessions into quasi equilibria, then potential phases of overshoot and recession should repeat over time. The repeated growth overshoots and recessions should not always associate with changes in climate that first increase and then decrease the productivity of ecosystems. As noted above, when
Methods
We illustrate how the Adaptive Capacity Tradeoff Model can provide a framework for data collection and analysis among prehistoric hunter-gatherers in Central Texas (for details, see the Supporting Information and Freeman et al. (2023a) for underlying data). To evaluate P1, we collected a large sample of radiocarbon ages on organic materials associated with archeological remains from Central Texas. We assume that the distribution of these ages over time correlates with the distribution of people over time in a fixed area (e.g. Freeman et al., 2018a; Rick, 1987). To use the radiocarbon data, first we cleaned the data to remove geological and paleontological dates, dates without radiocarbon lab IDs, dates without errors reported, averaged dates, and dates without a site ID or site name. This left us with 1700 total radiocarbon ages from archeological contexts in Central Texas.
Second, using the R package rcarbon, we constructed unnormalized summed probability distributions (SPDs) for the 1700 radiocarbon ages to estimate changes in population over the last 12,500 years (Crema and Bevan, 2021). Note, radiocarbon records are subject to several potential biases that may impact the robustness of the assumed link between age frequency and population size, and archeologists have developed models and techniques to control for the biases of sampling intensity, preservation and the non-linear radiocarbon calibration curve (e.g. Crema, 2022; Crema et al., 2017; Crema and Bevan, 2021; Freeman et al., 2018b; Shennan, 2013; Surovell et al., 2009; Timpson et al., 2014; Williams, 2012). To help address these concerns, we constructed all SPDs using 100 year moving means, and we attempted to control for the over sampling of particular archeological sites by clustering dates by site using the h function (h = 100) in rcarbon. Both of these procedures smooth the SPD to capture the long-term trend over time and reduce large fluctuations over shorter time-scales induced by calibration and/or biases introduced by site over-sampling. In all cases, we used Intcal2020 to calibrate the radiocarbon ages (Reimer et al., 2020).
Based on previous work by Freeman and colleagues (Freeman et al., 2021b), we divided the last 12,500 years into three potential components of logistic growth (i.e. growth that occurs slowly, quickly, and then slows). This means that we created three separate SPDs for Central Texas and fit three separate logistic functions, which may be summed together to model the total SPD curve. Each SPD and fit logistic function represents a potential component of growth over a segment of the total SPD curve. Component I occurs from 12,500 to 8401 cal BP, Component II from 8400 to 3401 cal BP, and Component III from 3400 to 200 cal BP. In the Supporting Information, Part I we provide robustness checks that fit two and four component logistic models to the entire curve.
After fitting a logistic model to the SPD of each potential component of growth, we divided each component into three potential phases of growth: Expansion, Intensification, and Recession Phases. We predict that the Expansion Phase corresponds with growth in the logistic from a component’s initial SPD size until 50% of the fit logistic models’ estimated limit,
To assess P1 that the Intensification and Recession Phases exceed the values predicted by a logistic model, we generated random calendar year dates via Monte-Carlo simulation (n = 1000) and subsequently back-calibrated into
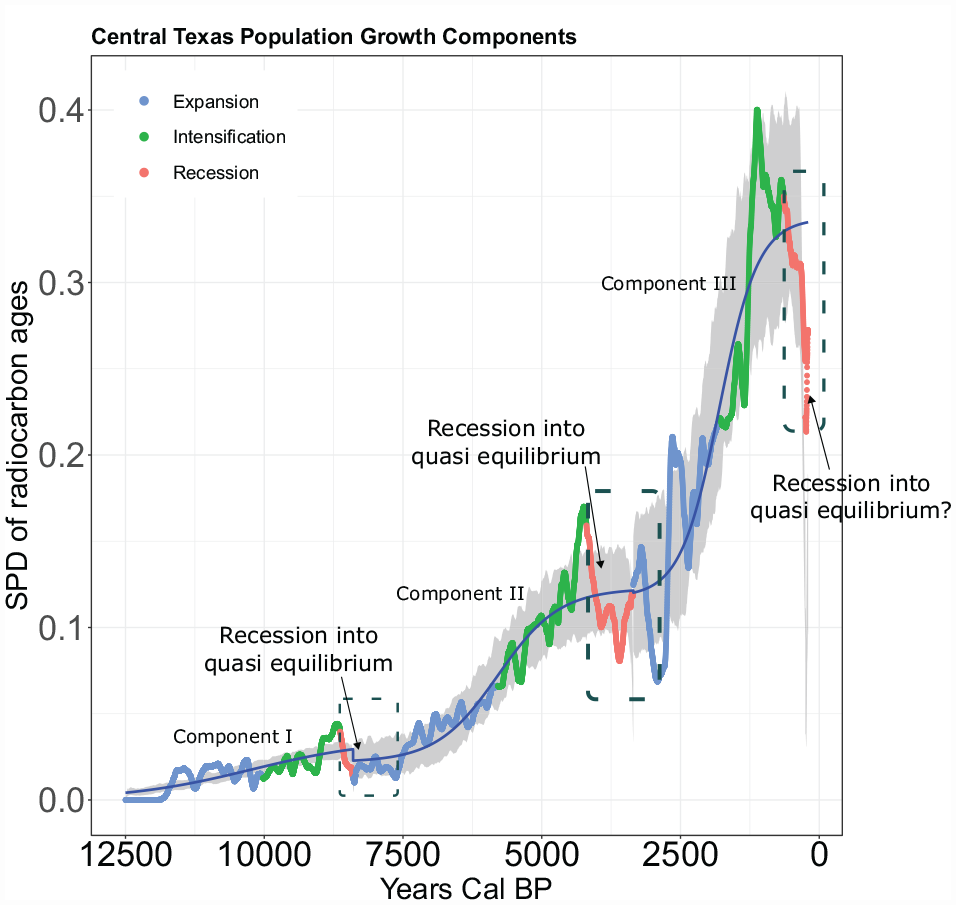
Three components of population growth in Central Texas from 12,500 to 8401 Cal BP (Component I, a 3 parameter logistic), 8400–3401 Cal BP (Component II, a 4 parameter logistic), and 3400–250 Cal BP (Component III, a 4 parameter logistic) first suggested by Freeman et al. (2021b). Gray shaded area is the 95% confidence envelop of each respective logistic model based on 1000 Monte Carlo simulations. Blue, green, and red curves indicate proposed Expansion, Intensification, and Recession Phases within each respective component of growth. Dashed boxes highlight potential quasi-equilibria discussed in the text.
To assess P2, we analyzed the association between changes in the frequency and surface area of ancient cooking features used to bake plants, human bone isotopes, and the proposed components and phases of population growth. In Central Texas, foragers primarily had access to terrestrial resources, such as: roots, tubers, seeds, deer, bison, and rabbits. Evaluating the Adaptive Capacity Tradeoff Model requires us to track changes in resource production and labor over time, both between phases within suspected components of growth and between components. We assume that in order for foragers in Central Texas to increase their resource production (lowered area needed per person), they must either invest more labor
Two processes may impact the frequency and surface area of ancient cooking features. (1) Holding
We use data on the frequency and surface area of fire-cracked rock features to estimate changes in
Finally, we synthesized previous reports (e.g. Bement, 1994; Bousman and Quigg, 2006; Cargill, 1996; Freeman et al., 2023b; Hard and Katzenberg, 2011; Huebner, 1991, 1994; Mauldin et al., 2013; Quigg, 2000) to construct a database of stable isotopes from human bone on 160 individuals from Central Texas over the last 7800 years cal BP. In Central Texas, changes in isotopes of
As noted above, again, the Adaptive Capacity Tradeoff Model predicts a complex pattern of decreasing values of
To assess P3 we constructed time-series of modeled net primary productivity (NPP) and calculated the association between changes in modeled NPP and proposed phases of population growth. To calculate modeled NPP, we used PaleoView (Fordham et al., 2017) to estimate mean annual temperature and precipitation in Central Texas. PaleoView generates outputs from the TRaCE21ka experiment (Liu et al., 2009, 2014; Otto-Bliesner et al., 2014), a Community Climate System Model, version 3 (CCSM3), and a global coupled atmosphere-ocean-sea ice-land general circulation model (AOGCM) with 3.75° latitude-longitude resolution on land. To estimate NPP, we generated datasets that estimate temperature and rainfall every 50 years over the past 12,500 years for one 2.5° raster square over Central Texas. We then used the Miami model to convert the temperature and precipitation estimates into NPP estimates (Lieth, 1973) at 50 and 200 year time-steps. Importantly, we assessed the relationship between modeled NPP values over time, changes in paleoclimate, and paleoecological records (see SI Part II). The modeled NPP values, paleoclimate, and paleoecological syntheses in Central Texas (Cordova and Johnson, 2019; Wong et al., 2015) show a remarkable association. In particular, changes in precipitation control shifts from more productive mixed grassland and woodlands to less productive
Next, we calculated the mutual information of the modeled NPP time-series and a smoothed SPD, summing the SPD and modeled NPP into 50 year and 200 year bins (Freeman et al., 2018a) (see SI Part II for details on the mutual information calculation). Mutual information provides a method for calculating the association between fluctuations or the rhythm of time-series, and is appropriate when assessing the association between non-linear series of discrete and noisy data (Cazelles, 2004; Freeman et al., 2018b). We also calculated Spearman’s associations between the 50 year sums of modeled NPP and the SPDs by proposed components and phases of growth. For example, we calculated the association between modeled NPP and SPD values during the Component I, Expansion Phase, Component II, Expansion Phase and so on. This provides a complementary measure of association to mutual information at longer time-scales.
Results
Inferred population trends
Figure 2 illustrates logistic models and confidence envelopes fit to three potential components of population growth in Central Texas. In this figure, predicted Expansion, Intensification, and Recession Phases are colored blue, green, and red. Figure 2 documents evidence mostly consistent with P1.
First, in all three components of population growth, the peak of the predicted Intensification Phase (green curve) exceeds the confidence envelope (gray shaded area) of each null logistic model. These redundant patterns of population increase above what one would expect from a logistic model support P1: Intensification may extend population growth and temporarily evade a population limit. Second, in the first two components of growth, the SPD of the proposed Recession Phase transcends the bottom of the 95% confidence envelope of each respective logistic model. In Component III (Figure 2), although the predicted Recession Phase does display decreasing SPD values, these values do not transcend the 95% confidence envelope. These patterns partly support P1, that a significant population overshoot driven by intensification would be followed by a recession into a quasi-equilibrium.
Finally, the SPD in Component I (Figure 2) often transgresses the confidence envelope of the logistic model. In Component II, the SPD transgresses the confidence envelope three times, and in Component III the SPD transgresses the confidence envelope four times. Clearly, the SPD may transgress the confidence envelope for reasons other than intensification extending population growth above a social and technological limit and subsequent recession. However, we do observe significant deviations, repeatedly, associated with predicted Intensification and Recession Phases. More important than individual peaks and valleys is the shape of the curve. For example, at 8800 cal BP, the SPD recesses into a period of small oscillations around a constant mean for 1000 years (8800–7800 cal BP). This time period encompasses the Recession Phase of the first logistic component of growth and the very beginning of the proposed Expansion Phase of the second component of growth. In the culture history chronology of Central Texas, the period of 8800 to 7800 coincides with the transition from Late Paleoindian to Early Archaic projectile point technologies (Lohse, 2013; Lohse et al., 2014). The same pattern occurs at the end of Component II and the very beginning of Component III. The Recession Phase of Component II begins at the transition from Middle to Late Archaic technological traditions (4200–4100 cal BP) (Lohse, 2013; Lohse et al., 2014) and oscillates around a constant mean until about 3000 cal BP. The Recession Phase of Component III associates with the end of the Late Archaic Transition Interval (1250–651 cal BP, Austin Phase) and beginning of the Late Prehistoric Toyah (650–300 cal BP) (Lohse, 2013; Lohse et al., 2014). It is, of course, unclear whether the final Recession Phase would have settled into a roughly 1000 year quasi equilibrium because the sequence was truncated by Euroamerican colonialism. Nonetheless, the transitions between Components I and II (8800–7800 cal BP) and II and III (4150–3000 cal BP) look very much like populations oscillating to various degrees around a long-run limit (Figure 2 gray dashed boxes).
Population and resources
Figure 3 illustrates evidence mostly consistent with P2 that foragers display cycles of labor intensification on more dense, but lower quality plant resources. During Component I, the frequency and surface area of cooking features increases from the Expansion to Intensification Phases and then declines during the Recession Phase (Figure 3a and b). We observe the same pattern during Component III: The frequency and surface area of features increase from the Expansion to the Intensification Phase and then decline during the Recession Phase (Figure 3e and f). During Component II, we observe the expected increase in frequency and surface area from the Expansion to Intensification Phases (Figure 3c and d). However, during the Recession Phase, although the frequency of dated features declines, the surface area increases slightly. Finally, we observe an increase in the frequency and mean surface area of FCR features between components of growth. This indicates an increase in plant production and consumption from Component I to II to III.
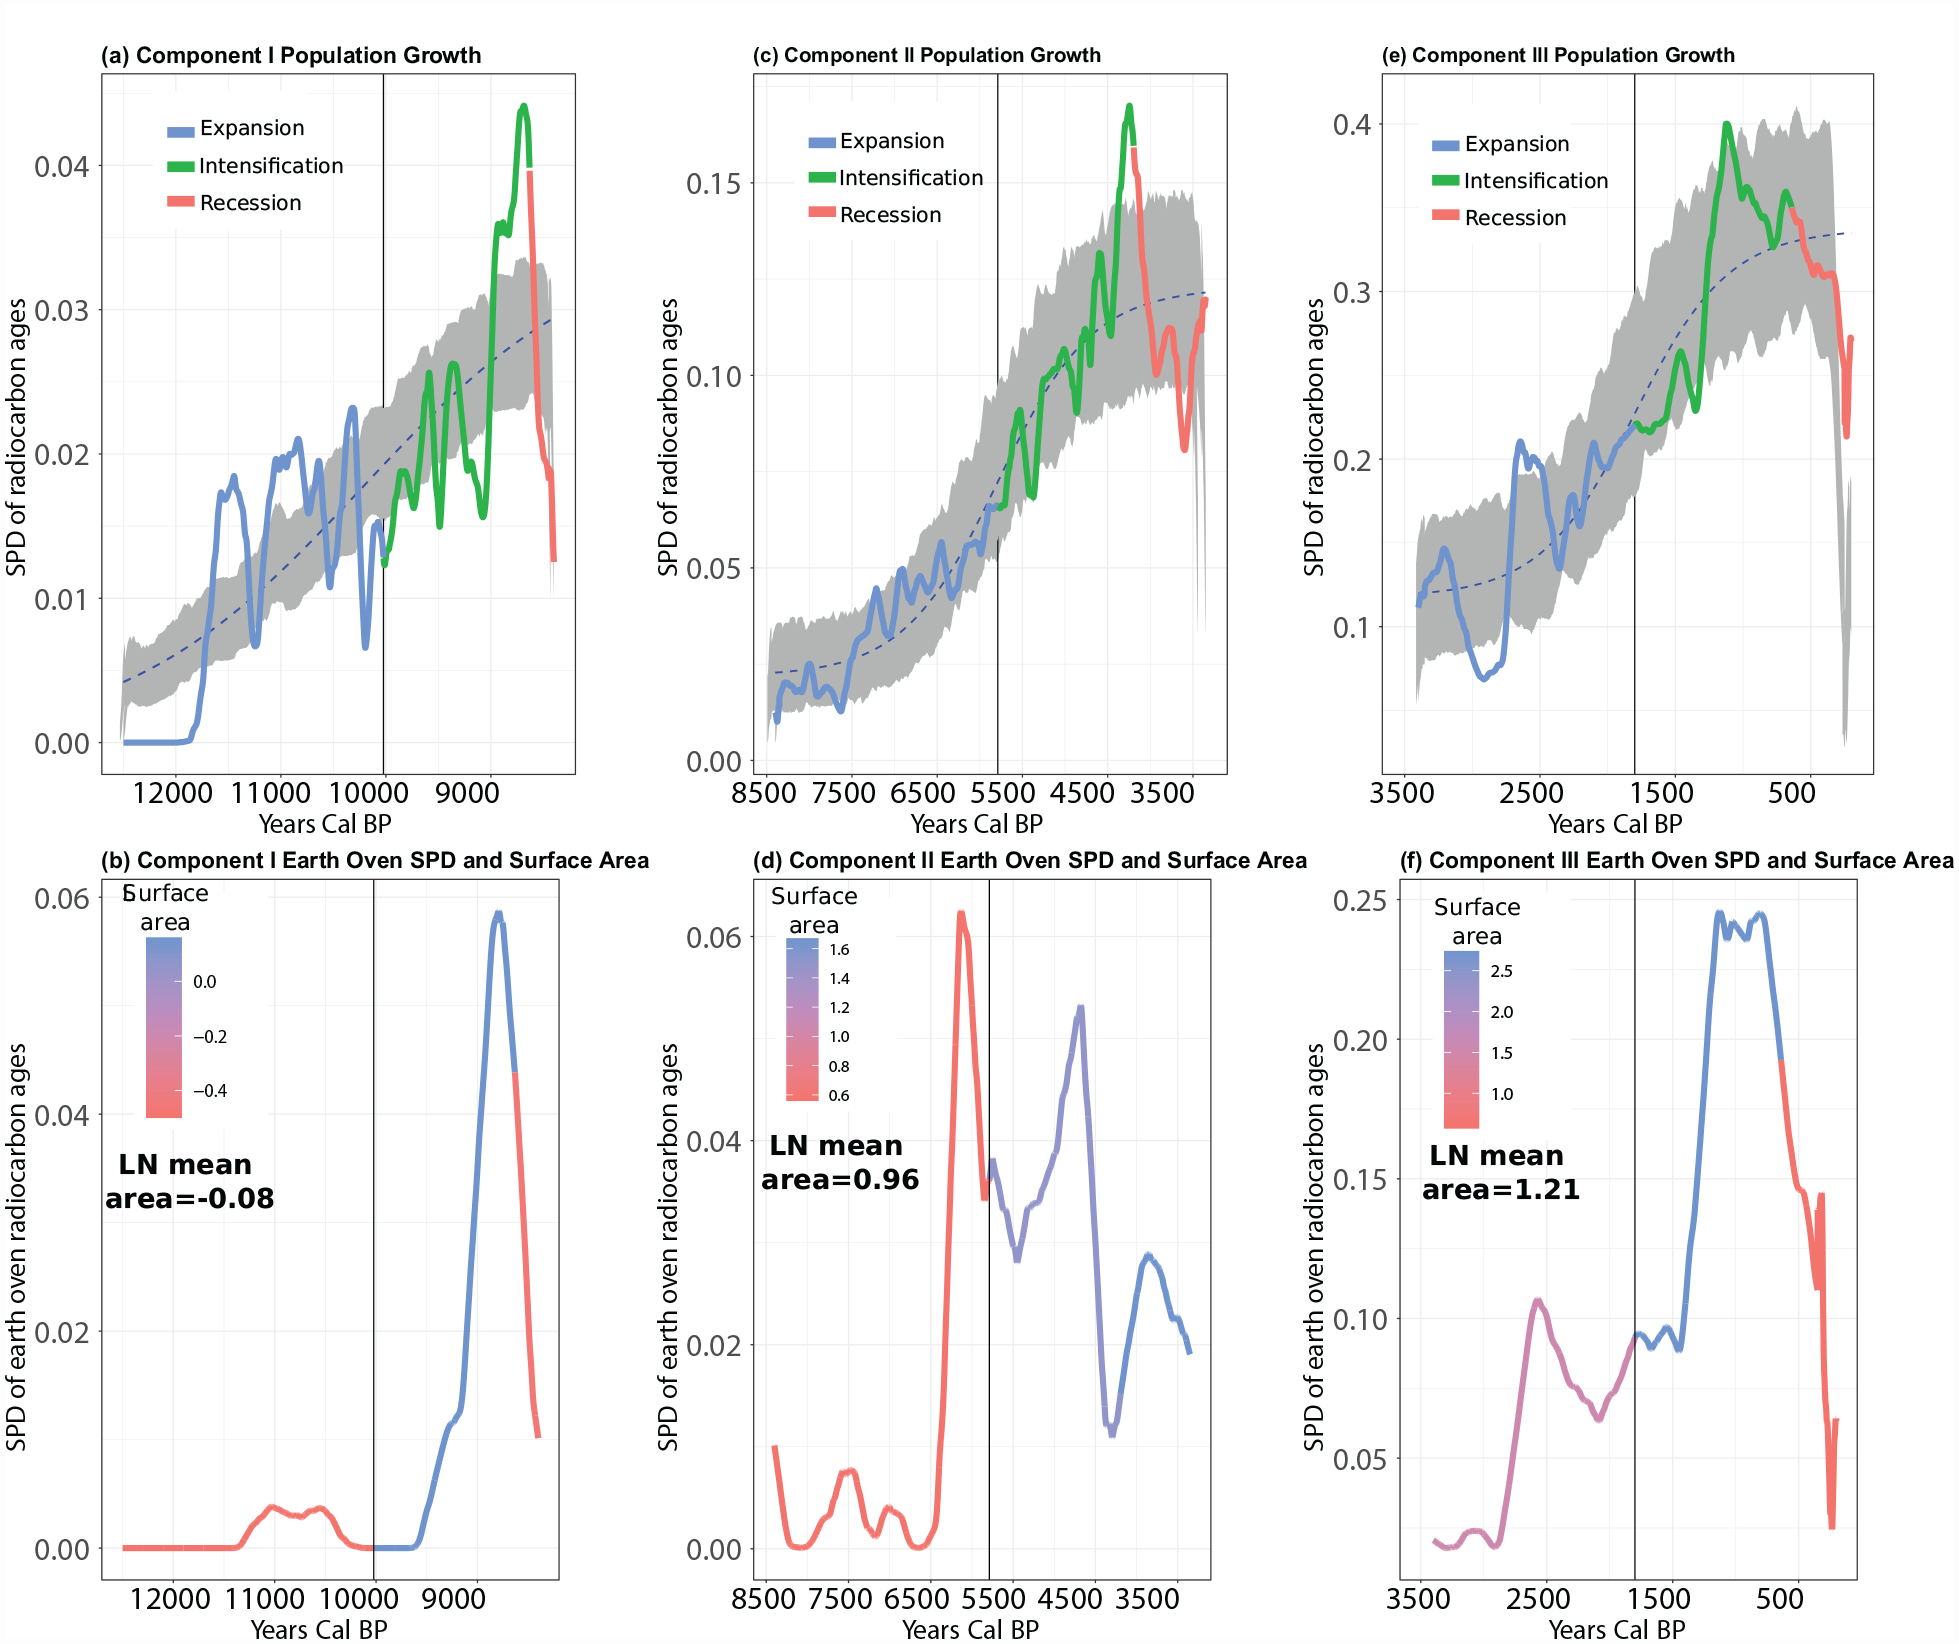
A comparison of population growth, frequency of directly dated suspected earth ovens, and the mean surface area of cooking features by each growth component (Component I: (a and b); Component II: (c and d); Component III: (e and f). In (b, d, and f), red = smaller features and blue = larger features. Feature surface area is calculated on the log scale in square meters. The SPD of large cooking features and the surface area of all cooking features provide complementary lines of evidence for investment in more labor intensive resource processing.
Figure 4 illustrates a complex pattern of change both within and between Components I and II of population growth and corroborates the evidence displayed in Figure 3. Within Component II (Figure 4a–d), values of all three isotopes significantly decline from the Expansion to Intensification Phase. This indicates an increased consumption of

Box and violin plots comparing the distributions of stable isotopes by proposed Expansion (blue), Intensification (green), and Recession (red) Phases in Components II and III of population growth. (a and e)–
Between components of growth, we observe a step-wise, non-linear pattern consistent with the Adaptive Capacity Tradeoff model. We observe a shift toward more
Modeled NPP and population associations
Figure 5 documents the change in modeled NPP and estimated changes in population, and illustrates an inconsistent association between changes in modeled NPP and the proposed Intensification and Recession Phases. For example, to assess the association between modeled NPP and fluctuations in population during each component, we calculated the mutual information shared by the time-series of NPP and the SPDs in each respective component. In all three components, we find that modeled NPP and SPD time-series do not share mutual information. Further, note the very different trends in the curves when comparing NPP (upper) versus SPD (lower) paired graphs (5a–5b, 5c–5d, and 5e–5f) for each component. In only 3/9 cases do we observe significant Spearman associations: (1) A positive association between modeled NPP and the SPD during the Component II, Intensification Phase; (2) a positive association during the Component III, Expansion Phase; and (3) a weak association during the Component III, Recession Phase.

A comparison of modeled NPP (a, c, and e) and population dynamics (b, d, and f) by each growth component. There is no significant association between the rhythm of the modeled NPP and SPDs. There are three significant associations between the long-term trends in modeled NPP and the SPDs. In (a, c and e) loess splines illustrate trends in modeled NPP. Spearman’s associations: Component I, Expansion:
Figure 5 also illustrates an inconsistent direction of association between modeled NPP and the SPDs. For example, during Component I (Figure 5a and b), the proposed Recession Phase (red curve) occurs after a 1400 year consistent decline in modeled NPP. During this entire 1400 year period, the SPD indicates a growing population during the Intensification Phase, including the expected overshoot. The proposed Recession Phase occurs in conjunction with the bottoming-out of the decline in NPP.
Conversely, during Component II (Figure 5c and d) a long-term increase in modeled NPP of 1100 years correlates with the proposed Intensification Phase (significant and moderately strong association of
Finally, in Component III (Figure 5e and f) modeled NPP exhibits no trend for the 1000 years prior to the proposed Recession Phase. Yet, we see the expected overshoot of the logistic null model during this period, and then a decline in the SPD during the proposed Recession Phase coincident with a very small long-term decline in modeled NPP.
In sum, changes in modeled NPP may contribute to the overshoot and recession dynamic observed during Component II. However, there is no clear long-term increase and decline in modeled NPP associated with the end Intensification and Recession Phases in Components I and III. These patterns are consistent with P3: Intensification and Recession Phases repeat over time and do not always associate with changes in climate that would increase the productivity of ecosystems during the Intensification Phase and then decrease the productivity of ecosystems during the Recession Phase.
Discussion and conclusion
In this paper, we contributed to understanding the interactions between population, economic behavior, and climate by proposing a multi-level model of population change among hunter-gatherers. The Adaptive Capacity Tradeoff Model reconciles the conflicting insights of dynamic systems models of long-term human population growth. Specifically, the model proposes that changes in resource production controlled by social organization
To build a framework for testing the Adaptive Capacity Tradeoff Model, we conducted a preliminary evaluation of the model’s implications in Central Texas. Our analysis indicates that Central Texas hunter-gatherers experienced repeated population overshoots and recessions into quasi-equilibria in the past (Figure 2). These patterns are consistent with the prediction of the Adaptive Capacity Tradeoff Model that human populations experience cycles of population overshoot and recession (P1). We argue that these cycles were, in part, driven by the intensification of labor into extracting resources (Figures 3 and 4). This argument is based on a convergence of multiple lines of evidence, not simply the SPDs used to estimate the shape of the prehistoric population curve.
For instance, consistent with prediction (P2), an examination of earth oven frequency and size (used to estimate labor invested to produce plants) and human bone isotopes (an estimate of shifts in resource consumption) indicates that foragers expended less labor per unit area and consumed more animal protein during proposed Expansion Phases and worked harder and consumed less protein during Intensification Phases (Figures 3 and 4). During proposed Recession Phases, foragers shift their diets back toward more protein consumption and less labor intensive plant resource processing (Figures 3 and 4). Finally, consistent with prediction (P3), in only one of three cases does an increase and decrease in NPP associate, over the long-term, with the overshoot and recession of the SPD into a quasi-equilibrium (Figure 5). This does not mean that climate driven changes in the productivity of resources don’t matter; rather, the implication is that we cannot rule out the intensification of labor as the prime driver of the overshoots and recessions.
The convergence of evidence above supports the proposition that the intensification of labor provides a temporary evasion of resource limits when social organization and physical infrastructure remain stable, but also generates population instability. Central Texas hunter-gatherers experienced multiple population growth overshoots and recessions into quasi-equilibria. Some of these, we argue, were driven by the process of individuals intensifying their use of resources to maintain a robust supply of resources in the face of increasing population density rather than adopting innovations. However, this process itself made Central Texas foraging populations more vulnerable to population recessions into quasi equilibria. As several authors argue, this may occur because intensification masks the limits on resource production, for a given set of social and technological conditions (e.g. Anderies, 1998, 2003; Freeman et al., 2019; Puleston et al., 2014).
Though this argument fits the available data, at least three important issues require additional research. We begin with empirical issues, and we end with a discussion the theoretical challenges of Malthus-Boserup models.
First, as with any data, the data used in our analysis have limitations. (1) We do not have human bone isotope data that extend beyond 7800 years cal BP. The practical consequence of this fact is that it is more difficult to estimate changes in resource consumption and diet during the first component of growth (12,500– 8401 cal BP). Thus, we cannot corroborate that the increase in earth oven feature frequency and surface area during the Intensification Phase of Component I correlates with a shift toward more consumption of plants. (2) There is high variation during Component I in the SPD. Thus, what we call the Intensification boom above the confidence envelope and bust below could just be a consequence of the fact that the SPD is more variable due to either sample biases, or the fact that at low population densities population dynamics are more controlled by exogenous factors and less so by endogenous factors. Targeted work on dating fauna assemblages, however, could help with this problem. By tracking the ratio of large to small game in fauna assemblages, researchers can make inferences about encounters and the harvest of large, higher ranked game relative to smaller, lower ranked game by human foragers (Broughton et al., 2011). With targeted work to date fauna assemblages, we could develop a time-series of this ratio that covers the 12,500–8401 time period, and we would expect higher values of this index during the Expansion and Recession Phases relative to the proposed Intensification Phase.
Similarly, the proposed Recession Phase of Component III does not decline into and oscillate around a constant mean for 10–20 generation. This is the only empirical pattern not consistent with P1. This contradiction between the theory and evidence may be caused by an edge effect and how we truncated the radiocarbon ages to cope with the impacts of European Colonialism on populations. This truncation impacts both the SPD and the likelihood of samples used to construct the confidence envelope. It could also just be that the theory does not account for the population dynamics observed in Component III. However, given the sharp declines in cooking feature frequency, surface area, and isotopic evidence of more animal consumption during this proposed Recession Phase, we suspect that a real population decline occurred and was heading into a quasi equilibrium. More comparative work is needed to understand the recurrence of such population growth–intensification–population decline patterns among many sequences.
Second, more work is needed to build higher resolution paleoclimate and environmental records. As noted, the modeled NPP values in Central Texas correspond with the best syntheses of Central Texas paleoclimate and paleoecological records. However, these records only document very long-term trends. A better description of shifts in variability across scales may reveal a stronger role for climate variation in decisions to intensify production (e.g. Finley et al., 2020). Further, we observe an increase and then decrease of modeled NPP associated with estimated population growth and decline during Component II’s Intensification and Recession Phases. Thus, changes in the productivity of ecosystems during these phases may have contributed to the overshoot and recession of population relative to a logistic model. Given that NPP, as well as other ecosystem variables, associate with human population densities in the ethnographic record, it is important to consider potential synergies between ecosystem productivity and intensification (e.g. Binford, 1983; Freeman et al., 2020; Luck, 2007; Tallavaara et al., 2018). Climate driven changes in ecosystems should moderate (strengthen or weaken) the severity of population growth and decline dynamics driven by the process of labor intensification. More work is needed on such potential interactions by comparing many case studies of population change and changes in resource use.
Third, the Adaptive Capacity Tradeoff Model attempts to resolve an underlying tension between Malthus-Boserup models of long-term population growth. All such models assume that over thousands of years the limit on human population density is controlled by the organization of tenure and access rights in society and the physical infrastructure and tools used to modify ecosystems. However, it is not clear how or why social organization and physical infrastructure change in particular systems, nor how this process impacts the long-term population dynamics of human societies. Following Wood (1998), our research team proposed that hunter-gatherers in Texas experienced three periods of long-term population growth driven by changes in social organization and physical infrastructure, such as large earth ovens, that lowered the area necessary per person to harvest food, live, and reproduce (Freeman et al., 2021b). Yet, this argument was nothing more than informed speculation based on fitting summed logistic models to an SPD. We did not address, in any detailed way, whether changes in resource production and climate were consistent with the model. Further, we did not attempt to determine whether transitions from one component of population growth to another were smooth, and whether we could treat changes in climate and labor occurring at faster time-scales as negligible. If humans easily perceive and respond to declines in their well-being as assumed by Richerson et al. (2009) (and somewhat by Wood (1998)), then this might be a reasonable approach. However, if changes in social organization and infrastructure are path dependent and stagnate (Wood, 2020), then people may attempt to compensate by increasing their labor devoted to resource production. The effect of this process is to mask the feedback between resource production, well-being, and fertility and mortality (Anderies, 1998, 2003; Puleston et al., 2014)-the very feedback supposed to create incentives for innovations. Thus, in this paper, we have attempted to develop a model that takes this possibility into account. And our results indicate that overshoots and recessions into quasi-equilibria were critical processes in Central Texas ignored by the MaB Ratchet proposed by Freeman et al. (2021b). Recessions may be critical for periods of major innovation to occur.
Moving forward, we speculate that adaptive capacity tradeoffs are most important in environments where human populations specialize, such as on geophytes in Central Texas, or rice agriculture in Wood’s example. Where landscapes become highly managed to produce just a few critical resources over thousands of years, then we expect populations to become much more vulnerable to intensification driven population overshoots and recessions (Freeman et al., 2021a). Conversely, where populations maintain more diverse production systems, then we should expect less path dependence over thousands of years in the cultural evolution of social organization and physical infrastructure. As a consequence, population should not experience population overshoots and recessions, perhaps more easily transitioning to new periods of long-term population growth based on production systems that open new niches. In the end, we find evidence consistent with the Adaptive Capacity Tradeoff Model in Central Texas. More work is needed to develop more refined data sets and more integrated analyses of population, resource use, and climate to test this idea against alternative hypotheses in the future and across archeological regions.
Supplemental Material
sj-pdf-1-hol-10.1177_09596836231183065 – Supplemental material for Repeated long-term population growth overshoots and recessions among hunter-gatherers
Supplemental material, sj-pdf-1-hol-10.1177_09596836231183065 for Repeated long-term population growth overshoots and recessions among hunter-gatherers by Jacob Freeman, Raymond P Mauldin, Mary Whisenhunt, Robert J Hard and John M Anderies in The Holocene
Footnotes
Acknowledgements
The authors would also like to thank the Texas Archaeological Research Laboratory and staff for help accessing samples. This study was also undertaken by JF as part of PEOPLE 3000, a working group of the Past Global Changes (PAGES) project, which in turn received support from the Swiss Academy of Sciences and the Chinese Academy of Sciences.
Funding
The author(s) disclosed receipt of the following financial support for the research, authorship, and/or publication of this article: We are grateful for financial support from the National Science Foundation, grants: BCS-1535841 and IBSS-L:1520308.
Supplemental material
Supplemental material for this article is available online.
References
Supplementary Material
Please find the following supplemental material available below.
For Open Access articles published under a Creative Commons License, all supplemental material carries the same license as the article it is associated with.
For non-Open Access articles published, all supplemental material carries a non-exclusive license, and permission requests for re-use of supplemental material or any part of supplemental material shall be sent directly to the copyright owner as specified in the copyright notice associated with the article.