




Abstract
The use of archaeological proxy records representative of population dynamics is paramount for a richer understanding of prehistoric cultural change, but its use require a dialectic assessment between proximate climatic drivers and ultimate cultural responses. Focusing on the Stone Age archaeological record of Western Norway (11,500–4300 cal. BP), this paper presents an exhaustive empirical curation and statistical testing between changing climates and demographic responses among coastal hunter-fisher-gatherers. The results connect long-term demographic fluctuations with changes in annual mean temperatures and seasonality and the results are discussed in relation changes in technology, subsistence and mobility. The paper also highlights the process of population decline and cultural loss towards the end of the Late Mesolithic (ca. 7000–6000 cal. BP) and emerging cultural novelties and population re-growth during the Early and Middle Neolithic (ca. 6000–4300 cal. BP). However, despite its strong correlation, the archaeological record of Western Norway lacks sufficient detail to ascribe an exclusive explanatory role to climate change, especially in episodes of significant population decline. This helps to emphasise that changing climates, while evidently central, form but a part of a larger system of interactions leading to demographic fluctuations and cultural change, the substantiation of which requires significant empirical improvements to the archaeological record.
Keywords
Introduction
Humans make up the dynamo responsible for the diverse patterns and processes of biological and cultural evolution (Boyd and Richerson, 1985; Jordan, 2015; Metcalf and Pavard, 2007; Morin, 2015; Shennan, 2000; Sperber, 1996; Zhang and Mace, 2021). By and large, these patterns and processes vary as a result of demographic oscillations in population size or connectedness which, in itself, is driven by the many successful or unsuccessful ways that humans extract energetic resources from the environment (Binford, 2001; French, 2021; Morin, 2008; Smith and Winterhalder, 1992; Tallavaara and Seppä, 2012; Tallavaara et al., 2018; Tremayne and Winterhalder, 2017). However, significant re-configurations in the spatio-temporal distribution of resources can come about over both shorter and longer time-scales as a result of changing climates and social norms, and it forces humans to constantly and adaptively construct cultural solutions to help ensure their survival (Laland and Brown, 2006, 2011; Odling-Smee et al., 2003). Considering then that this dynamic resembles both current and predicted trends for the future (Vollset et al., 2020), a richer understanding of the interplay between climate change, population dynamics and societal change can be gained by situating such trends in much deeper (pre)historic contexts (Degroot et al., 2022). This is done by teasing out if, how, or why climate change affected long-term fluctuations in human populations and if those, in turn, occurred simultaneously to the sudden and significant changes that the archaeological record attests to (Ordonez and Riede, 2022). In recent years, a particularly fruitful analytical inroad to these concerns has been paved through explicit palaeodemographic modelling of archaeological proxy records (French, 2015), the relative changes of which are often leveraged to explain significant episodes of cultural change (French and Chamberlain, 2021; Ghirlanda and Enquist, 2007; Riede, 2009; Roth, 2004; Shennan and Sear, 2021; Strimling et al., 2009; Timpson et al., 2014).
In this paper, I will explore how Stone Age coastal hunter-fisher-gatherers in western Norway (ca. 11,500–4300 cal. BP) lived through changing climates as demonstrated through long-term demographic fluctuations and discuss their subsequent cultural responses. Drawing inspiration from previous work (Bergsvik et al., 2021; French, 2015; Jørgensen, 2020; Palmisano et al., 2017; Solheim and Persson, 2018; Tallavaara and Pesonen, 2020), I do this by presenting the most up-to-date data curation of four palaeodemographic proxy records and assess their degree of statistical co-variation between five different palaeoclimatic time-series. The archaeological proxies are radiocarbon dates, estimates on site size, stray finds, and site counts. The palaeoclimatic time-series account for annual and seasonal changes in temperature and precipitation from the marine and terrestrial realm. Results demonstrate a strong connection between demographic fluctuations and changing climates. The paper also highlights the process of population decline and cultural loss towards the end of the Late Mesolithic (ca. 7000–6000 cal. BP) and emerging cultural novelties and population growth during the Early and Middle Neolithic (ca. 5925–4300 cal. BP). However, despite its strong correlation, this paper falls short in ascribing an exclusive causal role of climate, inviting the possibility that climate formed but a part of a larger system of socio-ecological interactions that lead to cultural change (Mandryk, 1993), the substantiation of which requires significant empirical improvements to the archaeological record within and outside of Western Norway.
The role of palaeodemography in Scandinavian archaeology
In Scandinavian archaeology in general, and in Norwegian archaeology in particular, the connection between palaeodemography and cultural change has been central over the last five decades. While unquestionably important and laudable, pioneer work by Cullberg (1975), Welinder (1979) and Olsen and Alsaker (1984) pale in comparison to the numerous palaeodemographic studies undertaken within just the last decade. This strong trend has arguably been driven by increasing availability of large archaeological data sets and an increased use of advanced computational approaches to modelling (Apel et al., 2018; Bergsvik et al., 2021; Hinz et al., 2012; Lundström and Riede, 2019; Lundström et al., 2021; Manninen et al., 2023; Nielsen, 2021; Nielsen et al., 2019; Riede, 2009; Solheim, 2021; Solheim and Persson, 2018; Tallavaara and Pesonen, 2020; Tallavaara et al., 2015; Tallavaara and Seppä, 2012). What follows is in no way intended to detract from all previous work, but I nonetheless wish to highlight some significant methodological shortcomings that has prompted the analysis put forward in this paper.
In Norway, the work done by Olsen and Alsaker (1984) was the earliest attempt at providing any form of palaeodemographic inference through the Norwegian archaeological record. By analysing the distribution of axes for the latter half of the Stone Age on the west coast of Norway (Olsen and Alsaker, 1984: 99), absolute population numbers and densities were derived through the use of ethnographic reference data. However, due to the coarse resolution of the data, diachronic estimates could not be obtained, effectively curtailing any discussion relating to long-term trends and potential climatic co-variation. Much more detailed were the insights provided by Bergsvik (2001), who argued for population increase from the Late Mesolithic (ca. 8500–6000 cal. BP) to the Early and Middle Neolithic (ca. 6000–4300 cal. BP) resulting from a broadened subsistence basis, and from the analysis of shore-line dated sites from the early Preboreal by Breivik (2014: 1485) who assessed diachronic changes in relation to changing climates, albeit without explicitly addressing the notion of demographic change. Continuing the trend towards obtaining estimates of higher resolution, Bjerck and Åstveit (2008:549) produced histograms of radiocarbon dates within 500-year bins. Their estimates demonstrated how populations experienced a typical boom-and-bust pattern, but did not assess if these patterns were underscored by climate change.
Following the large-scale work performed by Shennan et al. (2013), Solheim and Persson (2018) provided long-term estimates on human population dynamics for the south-eastern parts of Norway using summed probabilities of radiocarbon dates and shoreline dated site counts but without any comparison of climatic data. The same analytical approach can also be identified in more recent work by Nielsen et al. (2019) and Bergsvik et al. (2021). And while the latter two have significantly pushed the envelope in palaeodemographic modelling by increasing the sample size of various archaeological proxies, little discussion has been directed towards long-term trends and their potential connection to climate change. In this regard, Jørgensen (2020), and Jørgensen et al. (2023) provide the only Norwegian examples of extensive testing of demographic estimates in relation to climate change, demonstrating climatically induced boom-and-bust cycles in the former (but see Brown et al., 2022 for a contrary interpretation) and the adoption of pottery through migrations in the latter. However, these latter examples utilise only one source of demographic proxy data (14C), creating a potential ‘blind spot’ for conflicting patterns and interpretations that could emerge if additional and complementary sources of data were used. Such an alternative approach will form the foundation for the results and discussion presented throughout the remainder of this paper.
Material and methods
The regional setting of Western Norway
Ever since 1825, the university museum of Bergen has collected and excavated prehistoric remains from the former administrational counties of Sunnmøre, Sogn og Fjordane and Hordaland (Figure 1).

Overview of the study area highlighting the three former administrational counties from which all data have been collected. The mini-map in the upper left corner situates the study area in its wider geographical context (red square) and pinpoints the location of the MD99-2284 marine sediment core (black dot).
The complex topography of the region contributes to highly variable climate and landscape types. The outer coast consists of smaller to larger islands and skerries with mild temperatures and high degrees of precipitation. It also comprises areas of kelp forests, strong tidal current channels, and high biological productivity. The islands of the outer coast provide shelter from winds and waves on the inner parts of the archipelago, allowing for easy maritime travel along a north-south trajectory, as well as to the east where large systems of fjords permeate the landscape. The eastern parts have traditionally been more suitable for agricultural practices due to less rugged topography and more favourable climatic conditions, even if the amount of land for arable farming in Norway amounts to only 3% (Solheim, 2021). These fjord systems eventually connect the western parts with vast ranges of high-altitude mountains in the east with tundra-like biomes and in combination, the ecology of western Norway is highly variable. In what follows is a presentation of the palaeodemographic proxies applied, as well as a justification for their use. Their respective abbreviations have been summarised in Table 1.
Overview of the respective palaeodemographic and palaeoclimatic proxies used and their abbreviations as mentioned throughout the text.

Archaeological proxies
Radiocarbon dates and their summed probabilities
To use large sets of radiocarbon dates as a proxy for population intensity was first proposed by Rick (1987), and the method has seen numerous statistical refinements ever since (Crema and Bevan, 2021; Shennan et al., 2013). This proxy was chosen as it is commonly sampled in most investigations and has, over time, been collected at such volumes to tease out robust long-term trends while suppressing short-term statistical noise. Anchored in absolute time, the resulting population estimates also become comparable to palaeoclimatic records at both inter-regional and global scales. This is a tall order for remains otherwise dated by typological means, making radiocarbon dates an indispensable proxy for palaeodemographic modelling. I therefore accept the premise that, other things being equal, varying intensities of dateable organic remains, over time, reflect changes in human population levels. The current data set of 1142 radiocarbon dates was sourced from excavation reports, regional databases, and previous work (Bergsvik et al., 2021). All dates come from a total of 345 unique archaeological sites, were all treated as unnormalised to avoid steep artificial spikes in the calibration curve and were binned at 100-year intervals to suppress intra-site sampling intensity and to align the estimates with the temporal resolution of the palaeoclimatic time-series. Furthermore, in order to assess the most likely trajectory of population growth, the models of uniform, linear, exponential, and logistic growth were assessed through 1000 simulations of each respective growth model as well as evaluating their resulting global p-values. However, the protocol of null-hypothesis testing, as performed through Markov Chain Monte-Carlo simulations, does not take into account the potential loss of datable radiocarbon as a result of taphonomic erosion. I therefore also decided to apply the mathematical correction as suggested previously (Bluhm and Surovell, 2019; Pelton et al., 2022; Surovell and Brantingham, 2007; Surovell et al., 2009) in order to qualitatively assess moments where the simulations might converge or diverge. The analysis was carried out with the statistical programming language R via RStudio (R Core Team, 2020) and can be reproduced with the code and data included in the article’s supplementary information.
Site counts, stray finds, and site size
Counts of sites and stray finds refers to any site or artefact that has not been dated by radiocarbon, and they are also hypothesised to fluctuate as a result of changing population levels. All sites and stray finds were retrieved from the national sites and monuments database of Norway, known as ‘Askeladden’, as well as an internal database called ‘MUSIT’ constructed for the university museum of Bergen. Dating of sites, unless already provided, relied on regional shoreline chronologies if available, as well as qualitative assessments on the composition of artefacts considered diagnostic for the respective time periods based on Bergsvik (2002: 288 and references within). The same procedure was carried out for stray finds and the same dating framework outlined in Bergsvik et al. (2021) was used. The quantification of site counts did not concern itself with what type of site that was counted, requiring only an indication of human activity, most often through scatters of worked lithics. Issues of cultural or temporal overlap was solved by binning sites accordingly: sites dating to ca. 11,500–10,000 cal. BP were placed into an ‘Early Mesolithic’ bin. Large degrees of trait overlap between the Middle and Late Mesolithic (Table 1) resulted in a ‘Middle/Late Mesolithic’ bin and taphonomic erosion caused by the tapes transgression (Fjeldskaar and Bondevik, 2020) reduced the duration of this bin to ca. 8000–6000 cal. BP. Finally, a merged bin was made for the Early (6000–5300 cal. BP) and Middle Neolithic (5300–4300 cal. BP). It is important to keep in mind that while this might be a useful compromise for generating time-series of large sets of archaeological data, the spatio-temporal distribution of different cultural traits make for such discrete and tidy bins highly unrealistic. Moreover, the uneven duration between each bin require standardisation in order for them to compared properly. This was done by using aoristic weights (Lawrence et al., 2021; Palmisano et al., 2017) and their calculation was performed in the same manner as in previous work (Bergsvik et al., 2021). This procedure was repeated for stray finds, with the additional binning across geographical space to suppress uneven sampling intensity. The coordinates of each site from which stray finds had been collected helped create a unique ID. Multiple counts per site were then reduced into counts of one using the dissolve function in QGIS 3.22.14. Just like the radiocarbon proxy, aoristic frequencies were corrected for potential taphonomic erosion. Finally, estimates on site size (m2) is deployed under the premise that the size of any given site should be, all else being equal, directly proportional to population size, even if it by no means is an unproblematic proxy on its own (French, 2015: 197). Estimates were retrieved from excavation reports or the sites and monuments registry. Sites with mention of disturbance were excluded as it may have exaggerated the horizontal extent of the site, and sites with several occupational phases were excluded unless separate phases were accurately delineated.
Palaeoclimatic time-series and correlation testing
Five palaeoclimatic records relevant to marine and terrestrial ecosystems were chosen for correlation testing. It is important to keep in mind that these are not intended to function as proxies for human population levels, but as potential drivers. For the marine realm, foraminifera-based temperature reconstructions of the sea were sourced from the MD99-2284 sediment core, extracted at a depth of 1500m right underneath the north-west Atlantic Current (Eldevik et al., 2014; Risebrobakken et al., 2011). Changes in OT correlate with community structure of marine ecosystems (Antão et al., 2020), and is therefore considered a highly relevant time-series. For the terrestrial realm, AMT, APR, TS and PS were chosen for the potentially positive and negative effects on resource availability and population densities (Ordonez and Riede, 2022; Tallavaara and Seppä, 2012). All terrestrial time-series were sourced from the CHELSA-TraCE21k data set (Karger et al., 2021) that provides palaeoclimate-data at 100-year intervals for the last 21,000 years in raster format. This is a globally downscaled data set based on the Community Climate System Model Version 3 (CCSM3). As such, it is important to keep in mind that time-series derived from this data set might not be as accurate as more regionally derived data sets (e.g. Bjune et al., 2005). However, its strength lies in the availability of several so-called ‘blioclimatic’ variables (seasonality, isothermality, temperature annual range etc.), many of which might be relevant to the geographical distribution, and temporal fluctuation, of human populations. Moreover, by relying on palaeoclimatologies that are reconstructed in space and time in the form of raster grids, time-series can be generated through more extensive sampling strategies (e.g. Barton et al., 2018). Such sampling strategies would simply not be possible through conventional methods, at least not from a logistical standpoint. Considering then that the performance of the CHELSA-TraCE21k data set has been thoroughly examined and verified through additional sources of evidence, I consider it a robust approach for the purpose of this paper. All rasters were downloaded, reprojected, and cropped according to the spatial extent of the study area and then sampled with two thousand random points with a 1 km spacing. Pixels intersecting with the Fennoscandian icesheet (Stroeven et al., 2016) at any given time or place were excluded. A custom R-script for downloading, cropping, and reprojecting the rasters, as well as a custom graphical model designed in QGIS 3.22.5 to sample them (provided in the supplementary) was designed to automate the workflow (but see Leonardi et al., 2023 for an alternative approach).
To establish the relationship between climate change and fluctuations in human population levels, correlation testing was performed in two ways. The first test was done with a multiple regression analysis (henceforth MLR). The advantage of performing an MLR (Carlson, 2017), as opposed to the standard linear regression (LR), lies in its ability to distinguish the relative contribution of several independent variables (palaeoclimate time-series) to the dependent variable (palaeodemographic proxies). Two hypotheses were put forward: (H0 & H1). H0 represents the null hypothesis, namely that none of the climatic variables have any effect on changing population levels, indicated by a p-value > 0.05. H1 on the contrary, suggests that one or several climatic variables affect changes in human population levels, indicated by a p-value of ⩽0.05. The second test draws on all demographic proxy records and palaeoclimatic records using a Pearson’s correlation matrix. This was done by extracting the central tendency for each variable in the form of median estimates, mainly due to the coarse temporal resolution for proxy records such as site counts, stray finds, and site size. For sake of comparison, the Pearson’s correlation was set up to mimic the two models performed with the MLR. However, it should be noted that the two methods rely on different measuring techniques. To start, negative values in the Pearson’s correlation are not insignificant unless the correlation is weak (<0.5, 0, <−0.5). Most importantly, however, is that by using median estimates for the Pearson’s correlation, as opposed to a century-by-century comparison as done in the MLR, a great deal of variation and nuance is lost. I do not wish to speculate as to what effects this could have on the resulting correlations, but its potential influence should be kept in mind.
Results
Results from the permutation test of the four theoretical growth models have been summarised in Figure 2. Aoristic frequencies of stray finds and site counts, as well as estimates on site size in Figure 3, a summary of the MLR is reported in Tables 2 and 3 and the results from a Pearson’s correlation matrix in Figure 4.
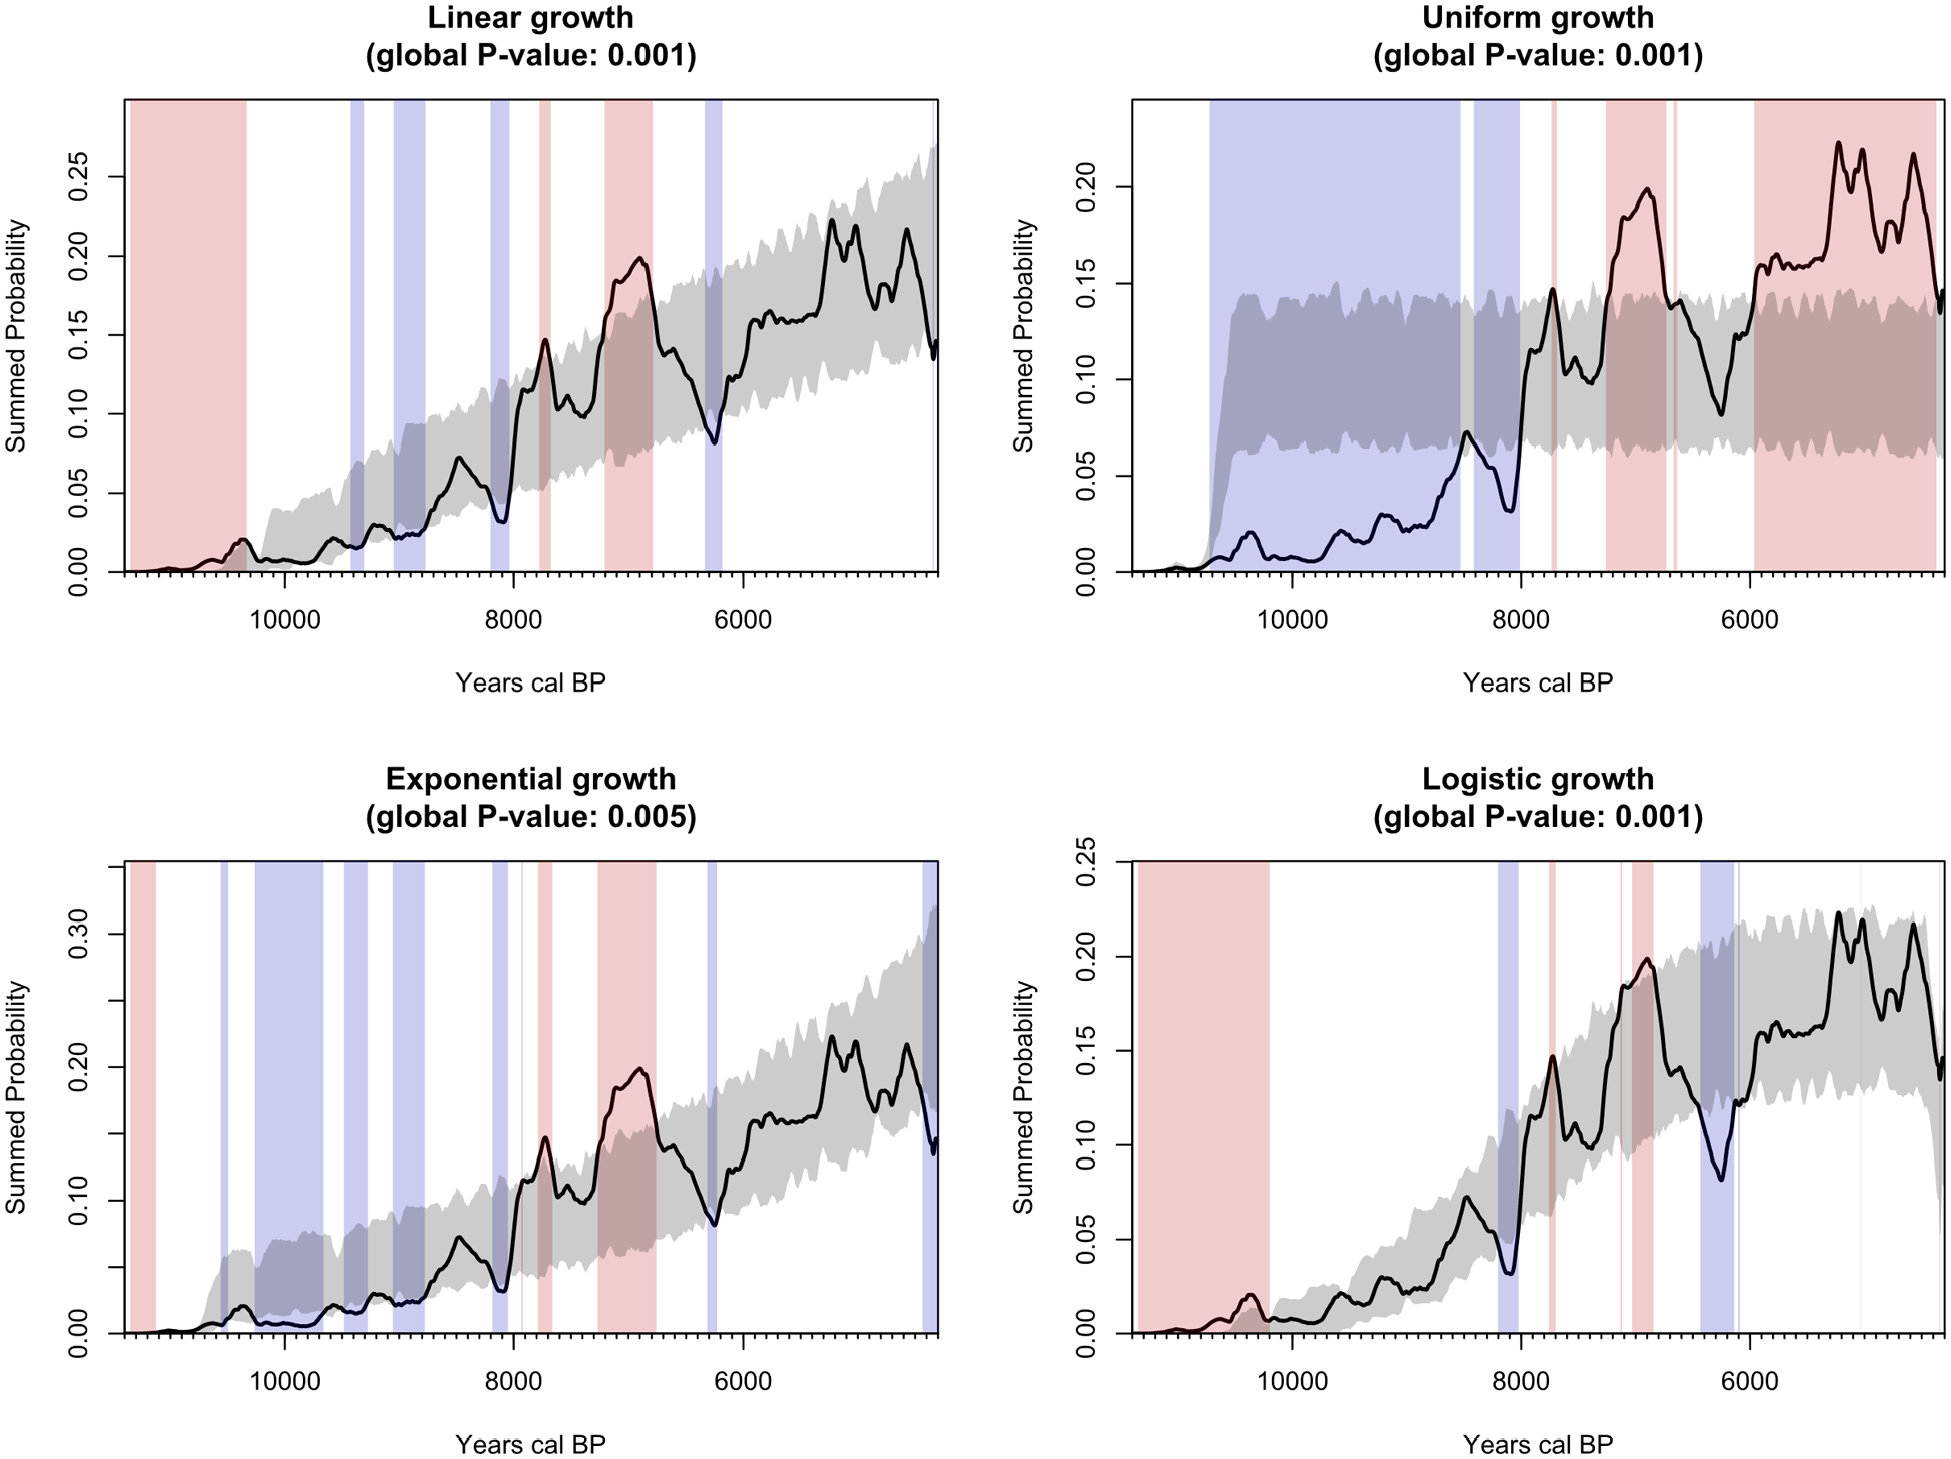
A combined plot of four theoretical null models of human population growth (ndates = 1142, nsites = 351, nbins = 746, nsims = 1000). The grey band represents a 95% critical envelope for each growth model. Points in time when the summed probability (solid black) deviates from the 95% critical envelope is highlighted with vertical bars, with significant episodes of population growth in red and declines in blue (but see Crema and Bevan, 2021: 30 for interpretative issues).
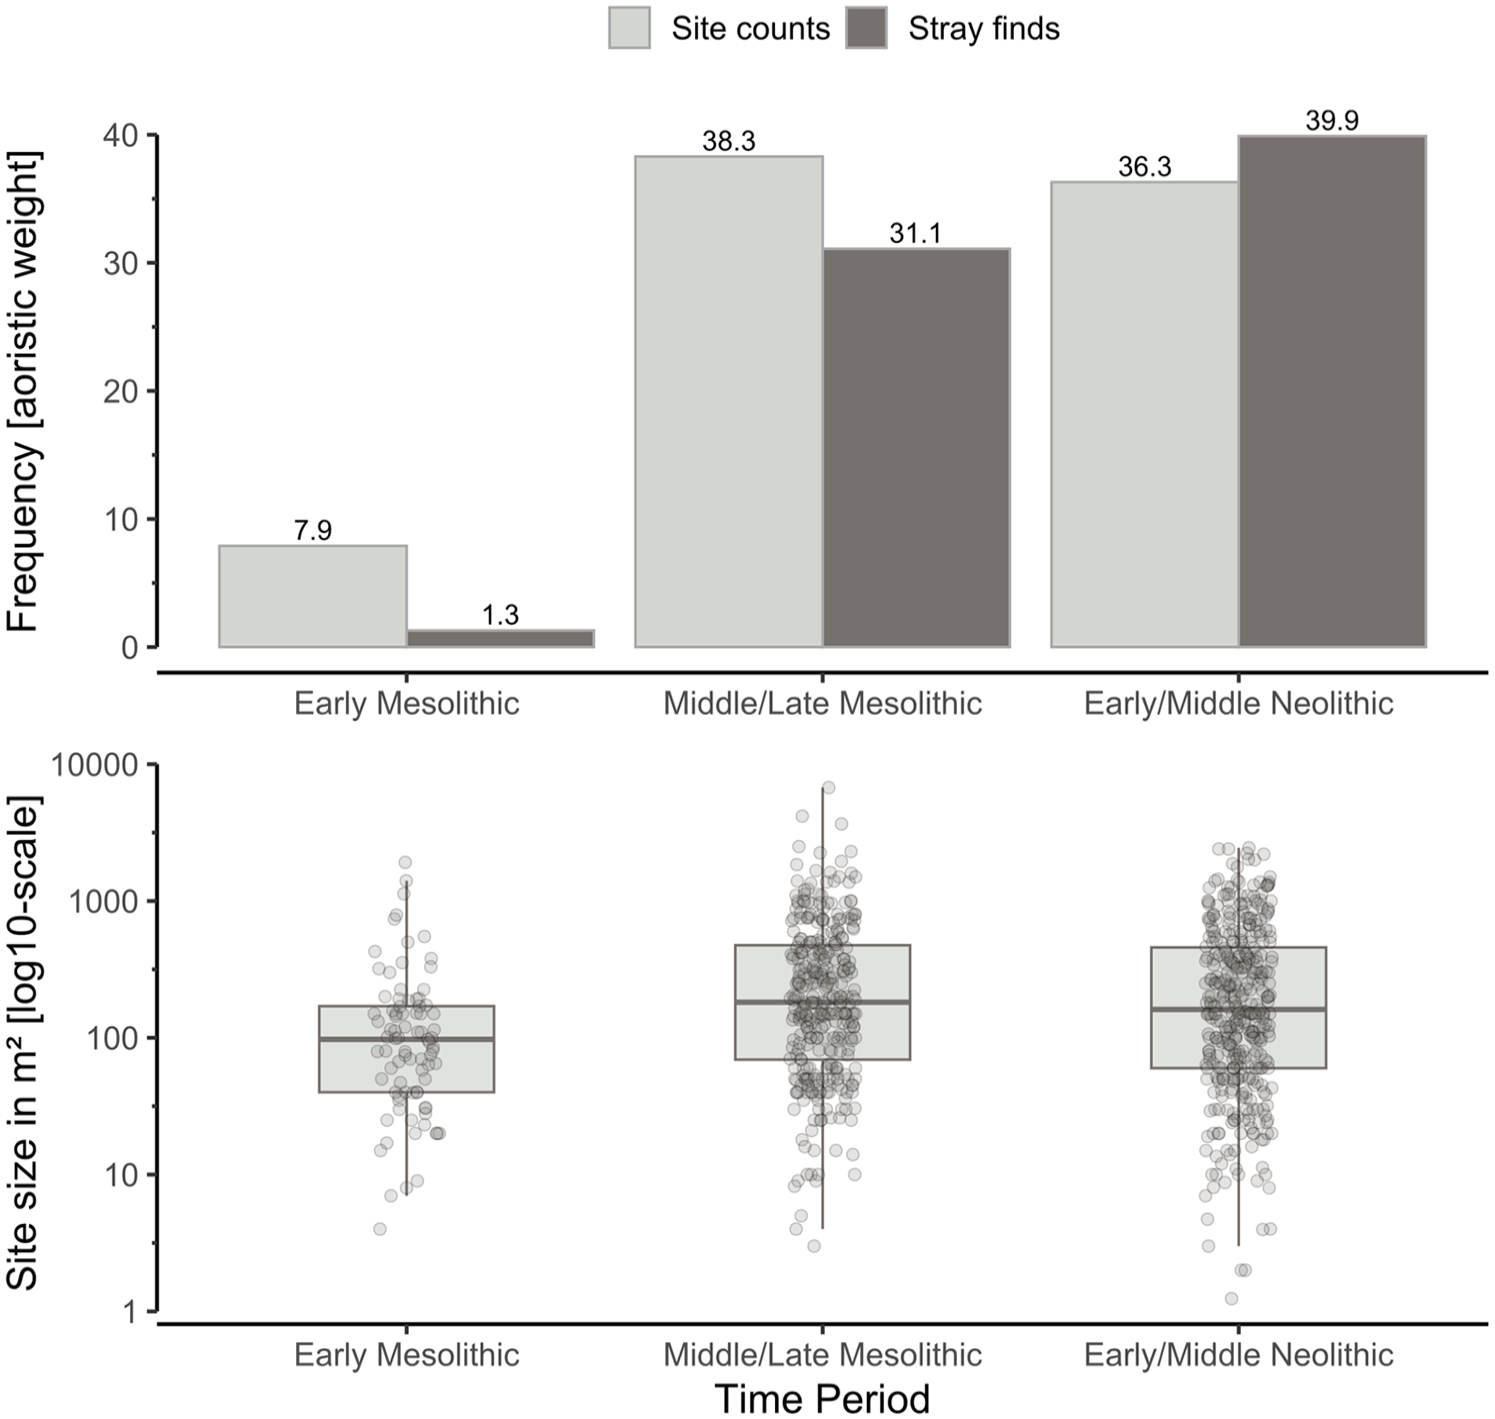
A stacked plot with aoristic frequencies of stray finds and site counts (top panel) and estimates on site size with a log10-scale (bottom panel).
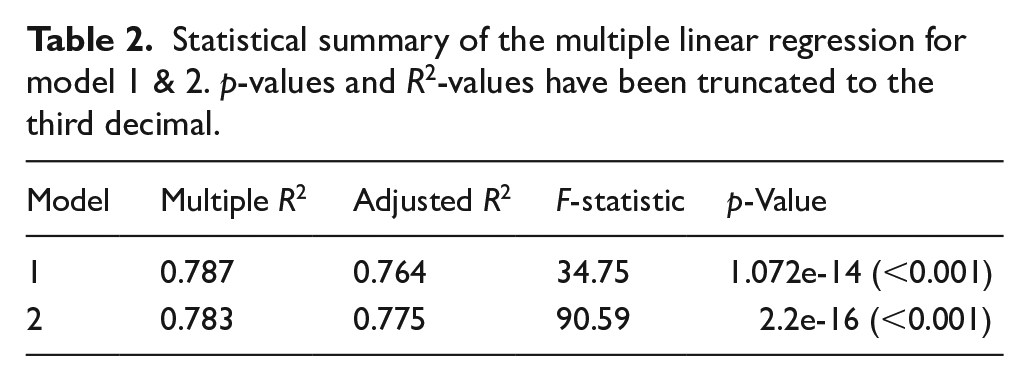
Statistical summary of the multiple linear regression for model 1 & 2. p-values and R2-values have been truncated to the third decimal.
Statistical summary of the coefficients for model 1 & 2.
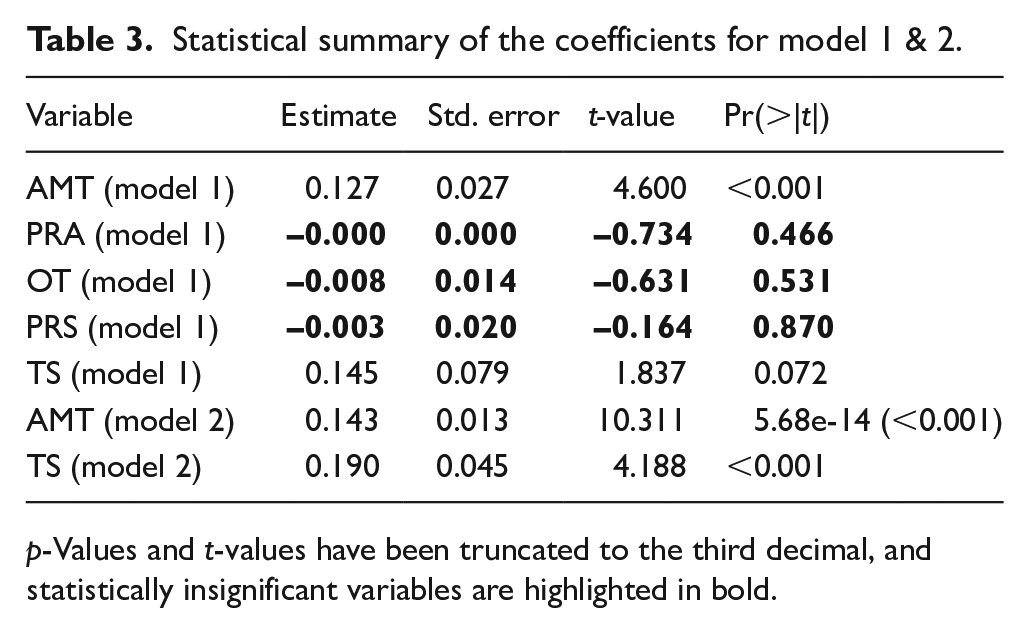
p-Values and t-values have been truncated to the third decimal, and statistically insignificant variables are highlighted in bold.
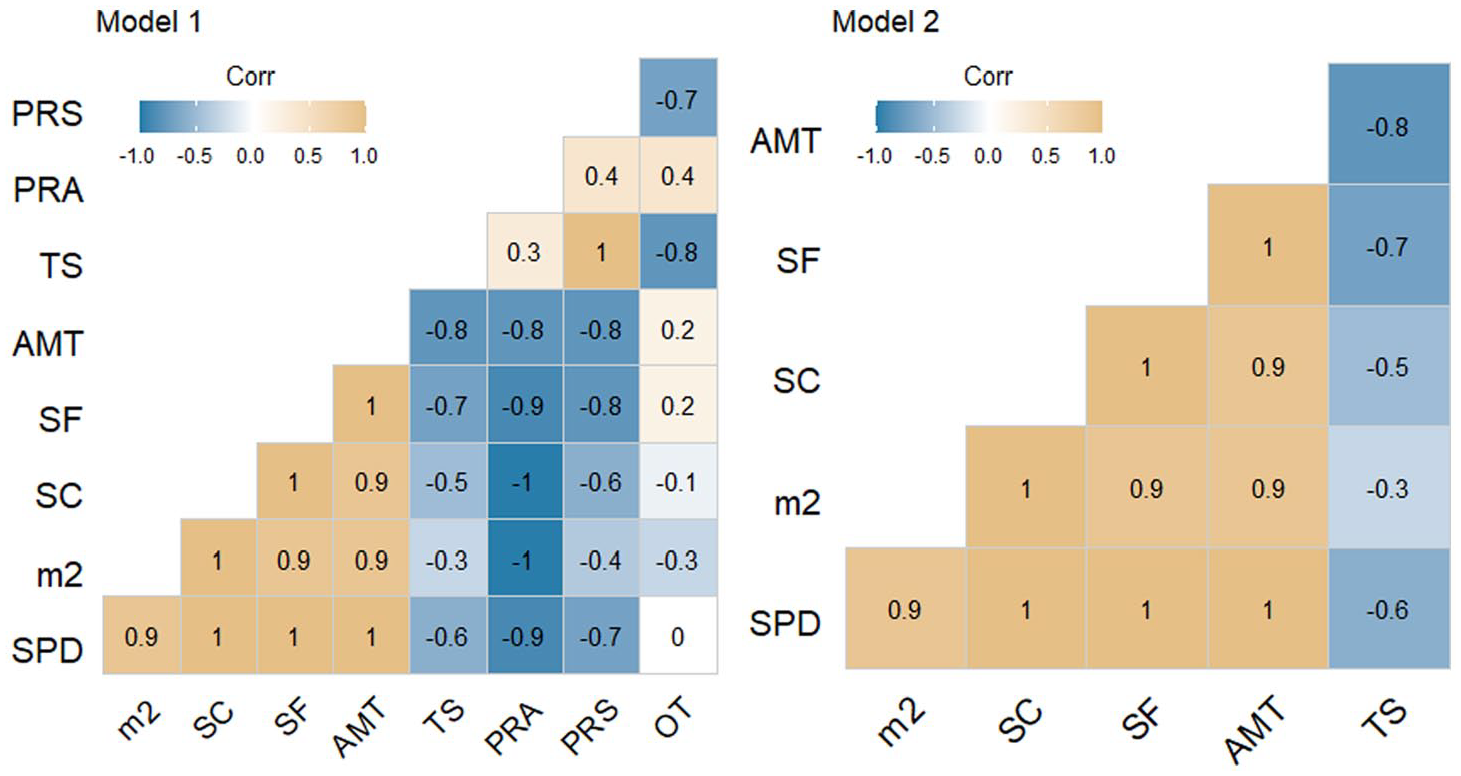
A Pearson’s correlation matrix highlighting how the various palaeodemographic proxies’ correlate with the palaeoclimatic record, ranging from a strong negative correlation (blue) to a strong positive correlation (yellow).
Permutation tests of four theoretical growth models
The results provide little to no support for any of the four null models. The closest, albeit still poorly supported (p-value: <0.05), fit is found in the model of exponential growth. However, exponential growth performs just as poorly as the models of linear and uniform growth, neither of which bears any resemblance to the shape of the observed SPD which, arguably, is much more akin to a typical logistic S-shaped growth curve that was found to provide a better fit for a comparable data set from neighbouring and interior regions to the east (see figure 3 in Manninen et al., 2023). It is possible that repeated peaks in population growth towards the last millennium of the analysis (ca. 5300–4300 cal. BP) that just barely surpassed previous levels of population growth in the Late Mesolithic (ca. 7200–6800 cal. BP) contributes to an edge effect where exponential growth is better supported. However, contrasting this result with the SPD that is corrected for taphonomic erosion (Figure 5) changes the picture considerably. Here, the inflection point in growth occurs during the population peak during the Late Mesolithic and it is never quite surpassed during the Early and Middle Neolithic (ca. 6000–4300 cal. BP). However, ‘eyeballing’ the simulation is not sufficient enough to determine the most likely mode of population growth, and thus the results should be treated with caution and as inconclusive until the problem can be resolved in the future, perhaps through exploration with other analytical protocols (e.g. Timpson et al., 2021). That being said, it is important to also keep in mind that the summed probability distributions for any given data set most likely does a rather poor job at capturing the dynamics suggested by any of the given theoretical growth models anyway. This is because the various theoretical trajectories of population growth are governed by highly complex and dynamic processes such as births, deaths, in and out-migration as well as environmental productivity, many of which the coarse archaeological record are simply unable to accurately capture (Tallavaara and Jørgensen, 2021).

Stacked plot with an uncorrected and corrected summed probability distribution (a). Marine and terrestrial time-series (b–f) are plotted with a smoothed trendline (solid) and their 95% confidence interval (dashed). Vertical bars from the exponential permutation test highlight significant episodes of population growth (red) and decline (blue).
Comparison with the remaining archaeological proxies
Without any formal statistical test, the remaining population proxies have to be inspected qualitatively. Moreover, due to their much coarser temporal resolution, this has to be done with caution. However, it is clear from the frequency diagram on site counts and site stray finds (Figure 3) that population levels did not grow uniformly, nor linearly. Once again, regrettably, whether populations grew exponentially or logistically is hard to determine. Site counts and site size, for example, exhibits an arguably logistically S-shaped pattern whereas stray finds indicate an exponential trend. While it is not expected that the different proxy records should all converge on one particular trend (French, 2015), the resulting and conflicting statistical noise, while preferable (Hamilton and Tallavaara, 2021), prevents any conclusive interpretation of the time-series, at least in terms comparing them to the four theoretical models of population growth.
Correlation testing with palaeoclimatic time-series
Multiple linear regression
A first run of the MLR (model 1) indicate that the long-term changes in human population levels correlate to changes in climate (Table 2). However, it also demonstrates that variables such as PRA, PRS and OT have little to no effect (Table 3), and that the model can be improved by omitting them. Model 2 improved the performance significantly (Tables 2 and 3), highlighting that AMT has the greatest effect on the SPD while TS has slightly weaker, albeit complimentary effect.
Pearson’s correlation testing
While not comparable methodologically, the results are replicated similarly to the MLR. AMT exhibits the strongest positive correlation on the SPD as well as all the other demographic proxies, whereas TS indicates a strong negative correlation on the SPD and stray finds, but less so for site counts and site size. The Pearson’s correlation matrix also indicates that AMT and TS is highly negatively correlated with each other, even if the directionality of this relationship remains unclear.
Results from the MLR and the Pearson’s correlation (model 2 respectively) testing from the archaeological record of Western Norway thus supports results found not only in the ethnographic record (Tallavaara and Seppä, 2012: 217) but from more recent work with a much deeper time-perspective and wider geographical scope (Ordonez and Riede, 2022). Given that the two statistical tests converged on similar results, albeit with varying strengths, I consider the co-varying relationship between climate and the palaeodemographic proxies to be reliable and robust.
Discussion
Despite the firmly established relationship between climate and demography in the previous section, population growth is not a given. While climate undoubtedly shapes the spatio-temporal structure of ecosystems (Binford, 2001; Tallavaara et al., 2018), the environment does not create the cultural responses that lead to population growth, it selects for those that are able to successfully persist within any given socio-environmental regime. It is therefore important to interrogate the archaeological record for responses, or lack thereof, that contributed to the projected demographic development.
For the earliest part of the Stone Age in Western Norway, low AMT and high levels of TS supressed population growth. Frequently changing sub-zero temperatures (Figure 5) contributes to shortened growing seasons and an increased and predominant reliance on meat consumption in northern latitudes (Binford, 2001). This results in negative outcomes for forager population densities regardless of their reliance on aquatic resources, as recently demonstrated in a global assessment by Zhu et al. (2021). This is supported by the demographic proxies presented for western Norway (Figures 4 and 5) and more recent modelling results (Lundström et al., 2021) that emphasise the presence of small groups mainly subsisting along the coast in cold and highly seasonal environments (Breivik, 2014) just above demographically viable population levels (Smith, 2014). Such demographic fragility would have been made worse by a seemingly conformist and inflexible technological tradition (Berg-Hansen, 2018) and a pronounced ecological homogeneity caused by the extent of the Fennoscandian ice-sheet (Mangerud et al., 2016). Thus, a largely unchanged coastal tradition (Berg-Hansen, 2018; Burdukiewicz, 2011; Cullberg, 1996; Fredsjö, 1953; Kindgren, 1996; Schmitt et al., 2009) slowly became a cultural and dysfunctional by-product (Laland and Brown, 2011) that repeatedly positioned foraging communities within reach of repeated and stochastic cultural and demographic collapse (Lundström and Riede, 2019; Riede and Pedersen, 2018), rather than successful coastal adaptations as has been suggested by Bjerck (2008, 2016) and Breivik (2014).
Much of the transition to the Boreal time period cannot be commented on due to taphonomic erosion caused by the tapes transgression (Fjeldskaar and Bondevik, 2020), and it also prevents further comment on potential demographic impacts of extreme events at ca. 8200 cal. BP (Daley et al., 2011) and the Storegga tsunami at ca. 8150 cal. BP (Nyland et al., 2021). However, if allowed to speculate, continued uninterrupted population growth is reasonable to hypothesise at this time period. The meeting between small migrating groups (Manninen et al., 2021b) would have resulted in significant fitness benefits to increases in population size and densities (Allee and Bowen, 1932), all the while temperatures continuously rose, seasonality decreased (Figure 5) and the Fennoscandian ice-sheet continued to melt (Stroeven et al., 2016). Moreover, groups would have had the possibility to receive or imitate technological innovations such as the reduction of microblades from conical blade cores (Sørensen et al., 2013) or the slotted bone point (Manninen et al., 2021a) through increased inter-group contact (Damlien, 2015, 2016; Günther et al., 2018; Kashuba et al., 2019). Together, these new ideas would help prevent subsistence risk and allow access to new ecological niches, as testified in the use of the rock-shelter of Saevarhelleren (Bergsvik and David, 2015).
What can be commented on, however, is a synchronous shift towards increasing annual mean temperatures and decreasing levels of temperature seasonality following ca. 8000 cal. BP (Figure 5). In tandem with warming and stabilising climates, groups utilised new and improved technological implementations, such as fishhooks and sinkers (Bergsvik and David, 2015; Bergsvik and Ritchie, 2020; Ritchie et al., 2016) in order to shift their settlement patterns towards channels with strong tidal currents like Skatestraumen in the north (Bergsvik, 2002) and Fosnstraumen in the south, both of which demonstrate an intense clustering of sites with thick cultural layers (Bergsvik, 2001; Olsen, 1992). A lateral shift towards the east with use of rock-shelters is also noticeable, and together these trends testify to a broadening of the resource base, with fishing as an important component (Bergsvik and David, 2015; Bergsvik and Ritchie, 2020; Boethius et al., 2020; Ritchie et al., 2016). This raises the question if the weak and insignificant correlation between the marine temperature proxy and the palaeodemographic proxies is caused by a potential distance decay that simply does not capture important and potentially driving changes in demography (Table 3 and Figure 4), similarly to what has been noted with the use of the Greenland ice-cores for co-variation testing in northern Norway (Jørgensen, 2020).
This is an important point to make, considering that the above-mentioned patterns of mobility and subsistence practices appear to have supported significantly high population levels, as is clearly reflected in the SPD (Figure 5), the volume of site counts, stray finds, and increases in site size (Figure 4). However, population growth eventually reached a peak and decline between ca. 7000–6000 cal. BP (Figure 5). A similar and more or less synchronous trajectory is noticeable also in central Norway (Sletvold, 2021: 44), the interior of northern Scandinavia (Manninen et al., 2023) as well as central (Riede, 2009: fig. 9) and southern Sweden (Friman and Lagerås, 2023). This decline transpires towards the end of the Holocene Thermal Maximum (HTM), which is represented by global warming and regional cooling (Bader et al., 2020; Kalis et al., 2003; Renssen et al., 2009; Seppä et al., 2009). In Norway (Bjune et al., 2004, 2005), summer temperatures decline towards the end of the HTM, and prior and successive melting of glaciers contributed to more frequent glacial outburst floods between ca. 6900 and 6000 cal. BP (Ekblom Johansson et al., 2020; Røthe et al., 2019).
However, the archaeological record of western Norway provides no compelling evidence for the triggering effects of extreme climates (Abbott et al., 2021; Groucutt et al., 2022; Jørgensen and Riede, 2019). Estimates of tree cover in western Norway is at its highest during the Late Mesolithic (Bergsvik et al., 2021: Fig. 12), thus there is no reason to suspect any widespread ecosystem collapse. In light of this, Nielsen (2021) has argued for migrating Ertebølle groups as a cause for this population decline. While intriguing as an hypothesis, to infer causality requires exhaustive statistical testing of several competing sources of evidence (Kavanagh et al., 2018; Tallavaara et al., 2018), neither of which has been adequately carried out in Western Norway, nor peripheral areas for that matter (Nielsen, 2021). Methodological adequacy aside, technological traces of such a potential migration pulse, such as the apperance of transverse arrow heads along the west coast of Norway (Bjerck and Åstveit, 2008) were short-lived and went extinct in parallel to more long-standing cultural traits, such as fishhooks, soapstone sinkers, polished and pecked chubby adzes, conical microblade cores, slotted-bone points, and the brief appearance and sudden disappearance of rock art (Hjelle and Lødøen, 2017; Lødøen, 2014). In their place emerged cultural novelties such as blank production from cylindrical blade cores, as did projectile technologies made from slate, to name just a few (Bergsvik, 2006; Eigeland, 2015: 379). Unravelling the mode and tempo of these technological changes, as well as investigating whether or not they relate to this Late Mesolithic population decline has not been adequately addressed up until this point and thus calls for further research.
Unlike eastern Norway (Nielsen, 2021), Western Norway did not experience a population boom at the Early Neolithic transition (Bergsvik et al., 2021). Instead, decreasing annual mean temperatures and increasing seasonality co-occurred with an inflection point towards population stability with three peaks in population growth followed by a decline throughout the remainder of the Neolithic (Figure 5). As such, these results stand in contrast to that of Bergsvik et al. (2021) who argue for a gradual and continued demographic growth up until the Late Neolithic transition (<4300 cal. BP). In fact, activities dating between ca. 6000–4300 cal. BP, if anything, points to short-term growth, stability with minor fluctuations, but ultimately a population decline and bust at ca. 4400–4200 cal. BP. Granted, stray finds from the Middle Neolithic B (ca. 4650-4300 cal. BP) would indicate continued growth, but these estimates, as opposed to those presented in this paper, were not corrected for increased visibility over time, or uneven surveying intensity across space (Figure 3).
Bergsvik et al. (2021: 14) caution that the somewhat modest demographic projections for the Early and Middle Neolithic could be due to a lack of radiocarbon dates. While that is certainly possible, it would stand in stark contrast to other Norwegian (Jørgensen, 2020: 43; Nielsen et al., 2019; Solheim and Persson, 2018) as well as south-Scandinavian and European examples of stability and population decline towards the end of the Middle Neolithic (Apel et al., 2018; Friman and Lagerås, 2023; Hinz et al., 2012; Shennan et al., 2013; Tallavaara and Pesonen, 2020). This conflicting pattern is encouraging as it suggests that other regional population projections could need a reconsideration with the help of additional proxy records, or alternative methods for palaeodemographic reconstruction (Lundström et al., 2021; Ordonez and Riede, 2022; Schmidt et al., 2021). A pattern from Western Norway that does stand out, however, is that the population peak at ca. 6900 cal. BP (Figure 5 forms an anomaly to an otherwise stable population level, possible already at ca. 7900 cal. BP until ca. 4300 cal. BP (Figure 5). This is also reflected by the inflection point in site size and site counts starting at the Middle and Late Mesolithic (Figure 4). Even if this could suggest that the social and economic organisation of coastal communities were better able at gravitating more frequently towards demographic equilibrium, change will shortly ensue if a resource ceiling has been reached, as Shennan (2009) rightly points out.
It is therefore not surprising that the Early and Middle Neolithic of western Norway testifies to a continued broadening of the subsistence base (Hjelle et al., 2006:156) and a diversification of raw material acquisition patterns (Maier et al., 2022). While sites neither became much larger in size nor more frequent in numbers compared to previous time periods, larger sites in general became more frequent than smaller ones, suggesting an increased sedentism with potentially intensified settlement re-use at the expense of establishing new ones (Figure 4). Many of these shifts have previously been interpreted as resulting from social displays of prestige (Hjelle et al., 2006). While prestige certainly could have been the ultimate justification, its proximate motivation and archaeological correlates are difficult to define. It also does not explain very well why such behaviours emerged in the first place. More in line with the available evidence, is the emergence of a dynamic where an antecedent increase in population packing along the coast during the Late Mesolithic, coupled with increased territorial control (Bergsvik, 2006; Skjelstad, 2003), pushed individuals towards lower ranked resource patches that would have required additional subsistence means in order to raise their habitat suitability.
Such subsistence means would have been culturally transmitted via expanding networks of social contact and exchange (Kavanagh et al., 2018: 481), a process also seen with foraging groups around the Lower-Scheldt basin (Messiaen et al., 2023), and the archipelago of eastern Sweden and Åland (Vanhanen et al., 2019). Due to less favourable climatic conditions (Figure 5), low amounts of arable farmland (Solheim, 2021) and the fact that new and additional subsistence components appear to only have been partially appropriated among groups in Western Norway (Hjelle et al., 2006), the demographic benefits of a fully agricultural way of life were left untapped (Shennan, 2009), at least up until they were more decisively introduced at the onset of the Late Neolithic (Bergsvik et al., 2021).
Conclusion
The results of this study demonstrate how four palaeodemographic proxies correlates strongly with changes in annual mean temperature and temperature seasonality, a result that is in accordance with previous studies on continental and global scales (Ordonez and Riede, 2022; Tallavaara and Seppä, 2012; Tallavaara et al., 2015, 2018), as well as in northern Norway (Jørgensen, 2020). The long-term trend of growth and subsequent population decline throughout the Early and Middle Neolithic are also in agreement with studies conducted in other parts of Norway, southern Scandinavia and parts of continental Europe (Apel et al., 2018; Bergsvik et al., 2021; Friman and Lagerås, 2023; Jørgensen, 2020; Nielsen et al., 2019; Shennan et al., 2013; Tallavaara and Pesonen, 2020) and the results have been discussed in light of previous research pertaining to technology, subsistence, and mobility. By focusing exclusively on the role of climate change in population dynamics, this work has not addressed other factors such as conflict and violence (Fibiger et al., 2023), or the spread of diseases or other pathogens (Fournié et al., 2017; Susat et al., 2021), all of which undoubtedly shape long-term demographic trajectories in general (French, 2021). However, these additional pathways to population dynamics, intriguing as they may be, especially in the absence of any severe climatic deterioration, ultimately relies on empirical evidence that is currently unavailable through the archaeological record of Western Norway.
Future work would therefore do well to target strands of evidence that could allow access to such aspects of demography, because while the correlation between climate change and long-term population fluctuations was significant, the resolution of the archaeological record does not allow for any definitive causal inferences to be made, especially the kinds pertaining to its deteriorating effect on surrounding ecosystems. This is unfortunate considering how this work also highlighted significant episodes of population decline towards the end of the Late Mesolithic (7000–6000 cal. BP) and the Middle Neolithic (ca. 5200–4300 cal. BP) with simultaneous and significant re-configurations of the archaeological record, where the former highlights population decline and cultural loss, and the emergence of cultural novelties and parallel population growth and stability in the latter. In the case of the Late Mesolithic population decline, bayesian phylogenetics (Gjesfjeld and Jordan, 2019; Prentiss et al., 2022) applied to radiocarbon dated lithic assemblages from this region and time period would allow for a synchronised analysis of the results presented here. As for the Early and Middle Neolithic, eco-cultural niche models (Whitford, 2019) would allow for a better understanding of the potential limitations or opportunities of dispersal, and to what extent such might have been affected by changes in demography.
Moreover, conducting further and future cross-regional studies in other Scandinavian coastal regions where comparable studies have yet to be conducted would help to further develop the methodology, and either strengthen or contrast the results from Western Norway. Future work would also benefit from establishing protocols for data retrieval in the field, or the analysis of pertinent archaeological, palaeoecological, or even pathogenic traces, that could indicate the occurrence of large-scale socio-ecological deterioration with resulting demographic declines (Molloy, 2022).
Supplemental Material
sj-docx-1-hol-10.1177_09596836231185839 – Supplemental material for Living through changing climates: Temperature and seasonality correlate with population fluctuations among Holocene hunter-fisher-gatherers on the west coast of Norway
Supplemental material, sj-docx-1-hol-10.1177_09596836231185839 for Living through changing climates: Temperature and seasonality correlate with population fluctuations among Holocene hunter-fisher-gatherers on the west coast of Norway by Victor Lundström in The Holocene
Footnotes
Acknowledgements
I am tremendously grateful to my supervisors Knut Andreas Bergsvik, Daniela Hofmann and Felix Riede for their patient guidance during this work. This work would also not have been possible had not certain people granted me access to numerous databases. As such, I am tremendously grateful to colleagues such as Jostein Aksdal, Camilla Zinsli, Kim Darmark, Leif Inge Åstveit, Trond Klungseth Lødøen, Hanne Bente Årskog, Trond Eilev Linge and Kristoffer Dahle. I am also very grateful to Miikka Tallavaara who shared the necessary R-code for performing a taphonomic correction of the SPD, Bjørg Risebrobakken for proving time-series data on ocean temperatures and Alejo Ordonez for some last-minute consulting on the TraCE21k data set and Multiple Linear Regression. Finally, I would like to thank the two anonymous reviewers whose comments helped to significantly improve the final manuscript.
Funding
The author received no financial support for the research, authorship, and/or publication of this article.

References
Supplementary Material
Please find the following supplemental material available below.
For Open Access articles published under a Creative Commons License, all supplemental material carries the same license as the article it is associated with.
For non-Open Access articles published, all supplemental material carries a non-exclusive license, and permission requests for re-use of supplemental material or any part of supplemental material shall be sent directly to the copyright owner as specified in the copyright notice associated with the article.
