




Abstract
The study presents a multi-proxy archive from hypersaline coastal Lake Chokrak in eastern Crimea, a steppe region which is particularly susceptible to moisture fluctuations. XRF, organic carbon and nitrogen, and palynological analyses are used to reconstruct the evolution of the lake and landscape development around it and to provide information about the driving forces behind those changes, such as climate and human impact. The findings show that the basin was an open marine bay between 7640 and 5500 cal. yr BP. After 5500 cal. yr BP, the low rates of sea-level rise led to gradual infilling of the basin. The prevalence of mesic herb-grass steppe around the site, as well as the expansion of broad-leaved trees in the Crimean mountains, indicate relatively warm and humid climate conditions during the Mid-Holocene. Elemental proxies and marine NPPs point to a transition to lagoonal conditions from 4270 cal. yr BP. The progressive shallowing of the basin was accompanied by the spread of more xeric Artemisia-grass steppe, which suggests a shift to arid conditions. The occurrence of cereal pollen from 3660 cal. yr BP may indicate the first signs of cultivation in the study area. The active build-up of a sand barrier from 3000 cal. yr BP led to a gradual separation of the basin from the sea. By 900 cal. yr BP, the fully-formed sand barrier resulted in a transformation of the lagoon into a hypersaline lake. The closing of the lagoon was accompanied by an expansion of halophytic communities around the site. Human-induced vegetation changes became more pronounced with the development of agrarian and pastoral activities around the site from ca. 750 cal. yr BP.
Keywords
Introduction
The Crimea is an area of palaeoecological and archaeological significance with a complex history of sea-level changes, coastline formation, vegetation evolution and human settlement (Cordova, 2016). The peninsula has a variety of contrasting natural environments ranging from halophytic communities on the coasts to broad-leaved forests in the mountains. Many coastal areas are influenced by dry climatic conditions, which create characteristic landscapes of grass steppe and saline lakes. Elsewhere these semi-arid environments are generally sensitive to hydrological changes and anthropogenic disturbances (e.g. Jones et al., 2018; Neugebauer et al., 2015; Schröder et al., 2018; Zhang et al., 2020) but there is a shortage of palaeoecological records in the Crimea.
Evidence of past environmental changes comes primarily from studies in the southwestern part of the peninsula. Multi-proxy studies of the sediments from lakes Saki and Dzharylgach demonstrated cyclic alternation of drier and wetter phases (each 300–600 years) over the last 5500 years (Gerasimenko, 2007; Gerasimenko et al., 2012; Gerasimenko, 2017; Subetto et al., 2009). To the northwest, pollen records from the hillfort Chaika suggest wetter conditions in the Greek and early Scythian periods (200–100 BCE), followed by aridification in the later Scythian period (100 BCE–100 CE) (Levkovskaya, 1970). Pollen and soil studies from the Heraklean peninsula (Cordova and Lehman, 2005) indicate multiple shifts between forest-steppe, steppe and sub-Mediterranean shrubland landscapes over the last 12,000 years.
Palaeoecological data from various sites in the Pontic steppe belt display similar trends of vegetation dynamics during the Holocene (Arap et al., 1992; Artyushenko, 1970; Bezusko et al., 2000, 2011; Bolikhovskaya et al., 2018; Gerasimenko, 1997a, 1997b; Kremenetski, 1995; Matskevoy and Pashkevich, 1973; Pashkevich, 1981). In general, the pollen records indicate relatively dry and cool conditions at the beginning of the Holocene with the prevalence of grasses with xerophytic and halophytic communities, dominated by Artemisia, Amaranthaceae and Asteraceae species, followed by warmer and wetter conditions during the Holocene climatic optimum, characterised by the prevalence of meadow steppe and the spread of riparian woodlands (Quercus, Ulmus, Tilia, Carpinus betulus, Fraxinus excelsior). In the Crimea, the Mid-Holocene was marked by the spread of forests from the mountains into the steppe (Gerasimenko et al., 2022), and in the Taman peninsula, mesic steppe and broad-leaved forests dominated the landscape (Bolikhovskaya et al., 2018). Several environmental shifts have been revealed in the Subboreal chronozone with the increase in humidity between 4500 and 4200 14C yr BP, followed by a significant reduction of forests with the disappearance of Acer from the Lower Dnieper (Kremenetski, 1995) and the spread of Artemisia-grass steppe in the interval 4200–3300 14C yr BP. The late Subboreal was marked by increased humidity and the expansion of mixed forests during the period 3300–2900 14C yr BP, whereas the phase 2900–2600 14C yr BP was characterised by the expansion of grass steppe and disappearance of Carpinus betulus and Ulmus laevis from the riparian woodlands (Kremenetski, 1995). The vegetation dynamics in the northern Black Sea region after 2600 cal. yr BP was mainly influenced by alternating phases of wetter and drier conditions (Bolikhovskaya et al., 2018; Gerasimenko, 2007), as well as human impact with the development of Scythian cultures and the Greek colonisation of the Black Sea coast.
The Crimean peninsula has >50 coastal lakes, but the history of their evolution remains largely unknown to this day. Initial studies suggest that most of these lakes are of marine origin and formed as a result of flooding of coastal valley mouths and subsequent separation by sand barriers (Ponizovskiy, 1965). In western Crimea, Subetto et al. (2009) have shown that Lake Saki was gradually separated from the sea around 5500 cal. yr BP, whereas the complete separation of Lake Dzharylgach occurred somewhat later – after 4800 cal. yr BP. In eastern Crimea, Kelterbaum et al. (2012), using lithological and microfaunal analyses, concluded that the complete separation of Lake Chokrak occurred in the second/first millennium BCE.
The goals of our study are: (i) to reconstruct changes in detrital input, productivity, lake levels and salinity in Lake Chokrak using x-ray fluorescence (XRF) and bulk carbon and nitrogen elemental analyses; (ii) to provide the first continuous ca. 7600-year-long record of vegetation changes and human influence around the lake using palynological analysis. Our palaeoenvironmental reconstructions will be put in the context of the interplay between sea-level changes, climate variability, vegetation changes and human settlement in the studied region.
Materials and methods
Study site
Lake Chokrak (45°27′N, 36°17′E, 0 m a.s.l.) is a hypersaline coastal lake in the northern part of the Kerch peninsula (Figure 1). The lake has an area of 8.5 km2 and its catchment area is 74 km2 (Ponizovskiy, 1965). The maximum depth is 1.3 m and the lake is prone to drying out in summer. The lake is separated from the Sea of Azov by a ca. 150-m-wide sand barrier. The salinity of the lake ranges from 132 to 270 psu (Zhilyaev et al., 2019), whereas the annual surface salinity of the Sea of Azov ranges from 8 to 15 psu (Boyer et al., 2013). Four small streams flow into the lake and provide an insignificant freshwater input (Lisovskyi et al., 2004).
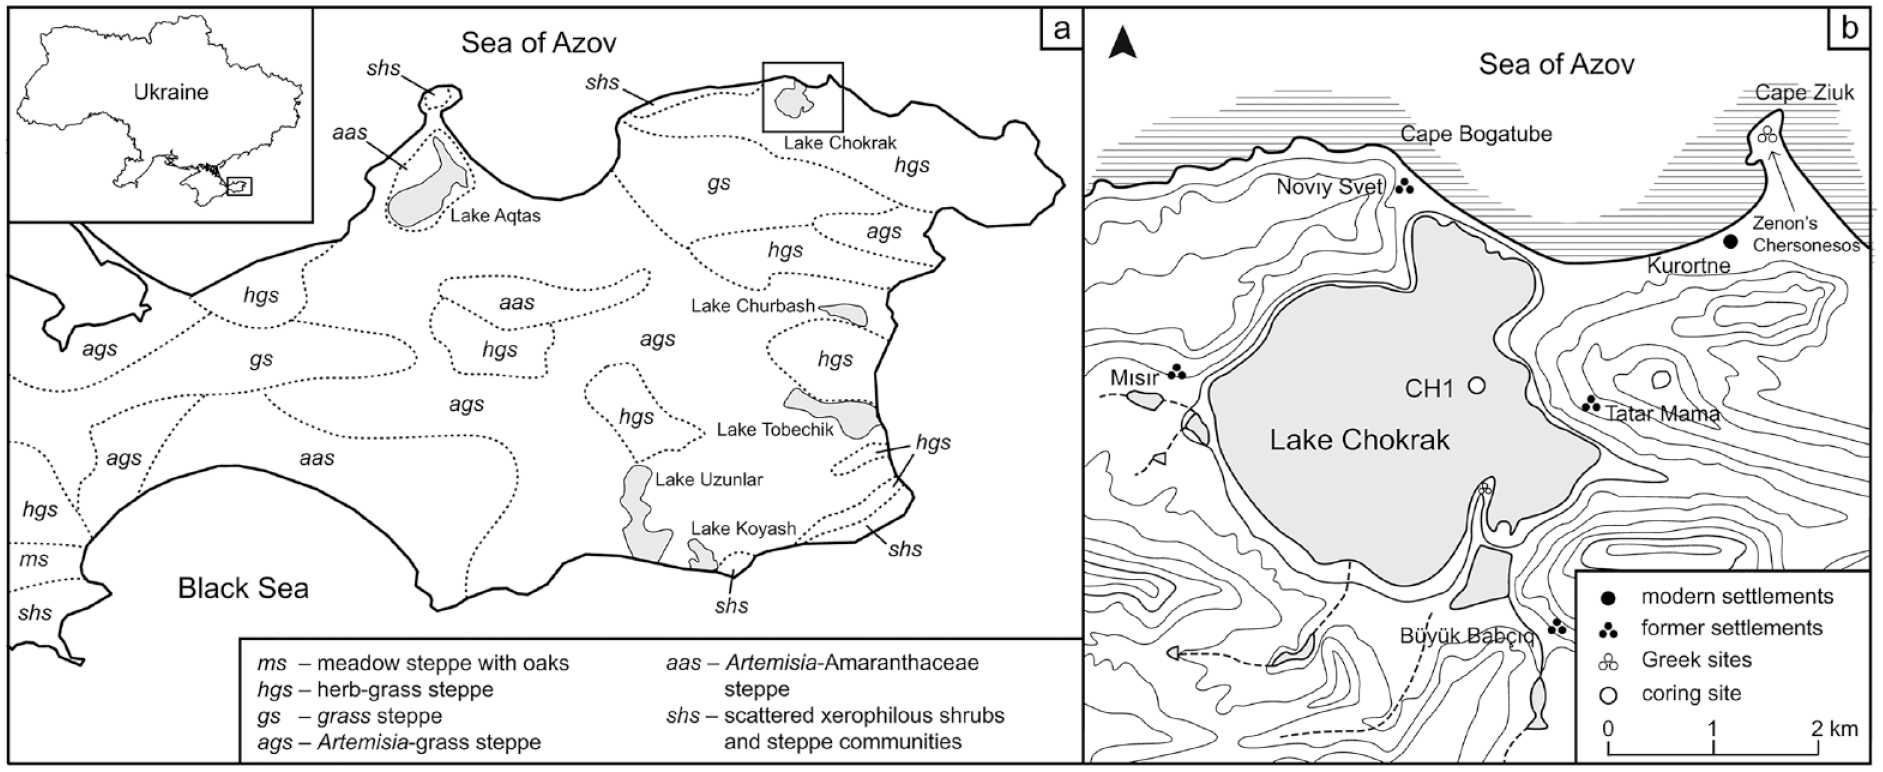
(a) The natural vegetation cover of the Kerch peninsula (after Protas and Dobrynin, 1940) and largest saline lakes of the region. (b) Topographic map of the study site with the core location and key archaeological and modern sites referred to in the text.
The territory of the Kerch peninsula is situated within the Indolo-Kuban trough, which is a part of the Greater Caucasus foredeep. The trough is filled by up to a 10 -km-thick sequence of sediments, represented mainly by clay and molasse complexes of the Oligocene-Miocene age and Eocene–Upper Cretaceous limestones and marls (Starostenko et al., 2015). The study region is characterised by hilly plains, which formed under an interaction of local tectonics and abrasion processes. The lake is surrounded by high cliffs (up to 100 m), composed of Neogene limestones, clays and marls. The soil cover is thin and represented by chernozem and solonetz soils (Dzens-Litovskaya, 1970).
The climate of the study region is temperate continental with a relatively short mild winter and a long hot summer. Mean annual temperature is 13°C, the monthly mean temperatures range from 2°C in January to 25°C in July, and the mean annual precipitation is 435 mm (Ved’, 2000). The prevailing winds come from the northeast, the northwest and the south (Lomakin et al., 2010).
The vegetation cover in the study region (see Figure 1) has been significantly altered by agricultural activities over the last century. The natural grassland communities are dominated by Stipa lessingiana, Festuca valesiaca and Agropyron cristatum. Apart from grasses, common species are Artemisia taurica, Linum austriacum, Euphorbia seguierana, Plantago lanceolata, Potentilla pilosa and Carduus uncinatus. The vegetation cover is characterised by the prevalence of halophytic communities on solonchak and solonetz soils, psammophytic communities (Stipa borysthenica, Festuca beckeri, Carex colchica, Agropyron cimmericum, Artemisia campestris) on sea coasts, and petrophytic vegetation (Thymus spp., Teucrium polium, Onosma taurica, Helianthemum salicifolium, Euphorbia petrophila) on thin soils and limestone outcrops (Dzens-Litovskaya, 1970). Patches of shrubs such as Crataegus spp., Cornus sanguinea, Sambucus nigra, Prunus spinosa and Rosa sp. are common in valleys and along coasts (Barbarych, 1977).
Coring, sampling and stratigraphy
Fieldwork was conducted in August 1995 from the dried-out salt bed. In total, 10 cores were retrieved from the lake, using a gauge corer, 0.5 m in length and 4 cm in diameter. The stratigraphy of the cores was studied in the field followed by a more detailed description in the laboratory. Part of the cores were taken to Lamont-Doherty Earth Observatory, and the rest were sent to Kyiv University. The most complete 11 -m-long sediment sequence (CH1), which was selected for analysis, was collected in the northeastern part of the lake (45°27′37″N, 36°18′10″E, Figure 1). The core was sub-sampled for multi-proxy analyses at 5 cm intervals. It should be noted that sediments in the interval of 625–600 сm were lost during the relocation of the cores.
Radiocarbon dating
The chronology is based on three radiocarbon dates of articulated mollusc shells (Table 1). Two dates on plant macrofossils (at 100 and 760 cm) were also obtained but gave modern ages and are excluded from the age model. The young ages of the macrofossils could be explained by either contamination in the field or material dragged down with the corer. The dates were calibrated using OxCal v.4.4.4. (Ramsey, 2017) and the marine calibration curve Marine20 (Heaton et al., 2020). A local reservoir age (deltaR) of –144 ± 35 was used for the calibration (http://calib.org/marine/, Jones and Gagnon, 1994). The chronology was constructed using the stratigraphically constrained age-depth model P_sequence in OxCal with a k-value of 0.2 (cm) (Ramsey, 2017). It must be noted that the exact marine reservoir effect of the Sea of Azov is not precisely known and has likely varied over time.
List of all radiocarbon dates obtained for core CH1.

fM: fraction modern.
Ages indicated with (*) were not included in the age-depth model. All ages are given in calendar years before present (cal. BP).
Elemental analyses (C and N)
In total, 215 subsamples for total carbon (TC), total nitrogen (TN) and total organic carbon (TOC) were measured on dried and homogenised samples at 5 cm intervals with a Costech Instruments ECS 4010 elemental analyser. Acidification of the samples was performed in silver capsules using 2 M HCl following the capsule method described in Brodie et al. (2011). The analytical accuracy was estimated to be better than 99% on reported values based on repeated measurements of standards (acetanilide). Total organic carbon is used to infer changes in organic matter accumulation. C/N atomic ratios were obtained by multiplying by 1.167 and are used to discriminate between terrestrial and aquatic organic matter sources (Meyers and Teranes, 2001). The terrigenous C/N values (20 and higher) are readily distinguishable from the corresponding marine values (from 7 to 12) (Bordovskiy, 1965; Emerson and Hedges, 1988), which was used as an indication of marine influence.
X-ray fluorescence
For the XRF measurements 215 oven-dried subsamples were analysed using a Thermo Scientific Niton XL3t GOLDD + XRF analyser set in the Cu/Zn mining mode. The subsamples were scanned using an 8 mm radius spot size and exposure time of 5 min. The XRF data are presented as parts per million (ppm) or as elemental ratios. The reported measurement error was 60–220 times lower than the reported values. In our study, we focussed on Ti, K, Rb, Zr, Si, Al and Fe as indicators of sediment influx from the catchment (e.g. Koinig et al., 2003; Kylander et al., 2011), and Ca, Sr, S and Ca/Ti are primarily interpreted as proxies for autochthonous precipitation of evaporites. Chlorine is analysed as a component of halite, as well as an indicator of sediment pore water (Neugebauer et al., 2015; Schröder et al., 2018). High Ba values are interpreted as representing increased marine productivity (Liguori et al., 2016). Changes in redox conditions are inferred from the ratio of Mn/Fe, and the changes in the grain size are indicated by the ratios Zr/Rb, Si/Ti, Al/Si and Ti/K (Dypvik and Harris, 2001; Koinig et al., 2003; Kylander et al., 2011; Marshall et al., 2011). The XRF data were analysed using Principal Component Analysis (PCA) to reveal the main geochemical groups and sedimentary processes in the basin. PCA was performed using PAST 4.0 software (Hammer et al., 2001).
Palynological analysis
For the pollen analysis 119 subsamples were selected from the core, however, seven samples were excluded from the analysis due to low pollen recoveries. Subsamples from the top part of the core (0–400 cm) were analysed at 5 cm intervals, while the lower part (400–1100 cm) was analysed at 15–20 cm intervals. The pollen samples were prepared using the conventional methods outlined in Berglund and Ralska-Jasiewiczowa (1986), with an additional step of density separation where needed. The aim for the minimum pollen count was set at 300. However, in eight samples it was not possible to reach 300 and the minimum pollen count was 200. On average 530 pollen grains were counted per sample, excluding spores, aquatics, unidentified and reworked taxa. Additional quantitative counts were made of non-pollen palynomorphs (NPPs), including fungal spores, algae, and dinoflagellate cysts, and the presence or absence of charcoal was noted. Identification of pollen types was based on keys and atlases (Kupriyanova and Aleshina, 1972, 1978; Moore et al., 1991; Reille, 1992), as well as the reference collection at the Department of Geology, Lund University. Identification of NPPs was based on Mudie et al. (2010, 2011) and Van Geel et al. (1989). In situ dinocysts were identified with reference to Marret et al. (2004), Mudie et al. (2001, 2017), Wall et al. (1973), and Zonneveld and Pospelova (2015). The terrestrial pollen data are expressed as percentages of total land pollen (TLP), with spores, aquatics, reworked taxa and NPPs excluded from the sum. The percentages of those groups are calculated from TLP plus the particular group. The pollen diagram was constructed and delineated using CONISS software as part of the Tilia and Tilia-Graph version 2.6.1 package (Grimm, 2015).
Results and interpretation
Chronology
With the stratigraphically constrained P_sequence and a k-value of 0.2, the age-depth model (Figure 2) has an agreement index of 70, which is above the limit of 60 proposed by Bronk Ramsey (2017). The bottom of the sediment sequence has a modelled age of 7641 ± 266 cal. yr BP. The sediment accumulation rate was constant between the radiocarbon-dated horizons and decreased in the upper part of the sequence. In the model we have assumed that the top of the sediment core represents the year of the collection of the core, however, we cannot completely exclude the possibility of erosion, or deflation during dry phases of the surface sediments. This would explain the lower sediment accumulation rate observed in our core, and also in sediment cores from previous studies (Kelterbaum et al., 2012). The number of radiocarbon dates limits the resolution of the age-depth model, and might not show rapid changes in the sediment accumulation rate. However, the obtained sediment accumulation rate shows a comparable pattern with the previous chronological models of sediment cores from Lake Chokrak (Kelterbaum et al., 2012), thus we consider the chronological control sufficient for reconstructing major palaeoenvironmental changes.
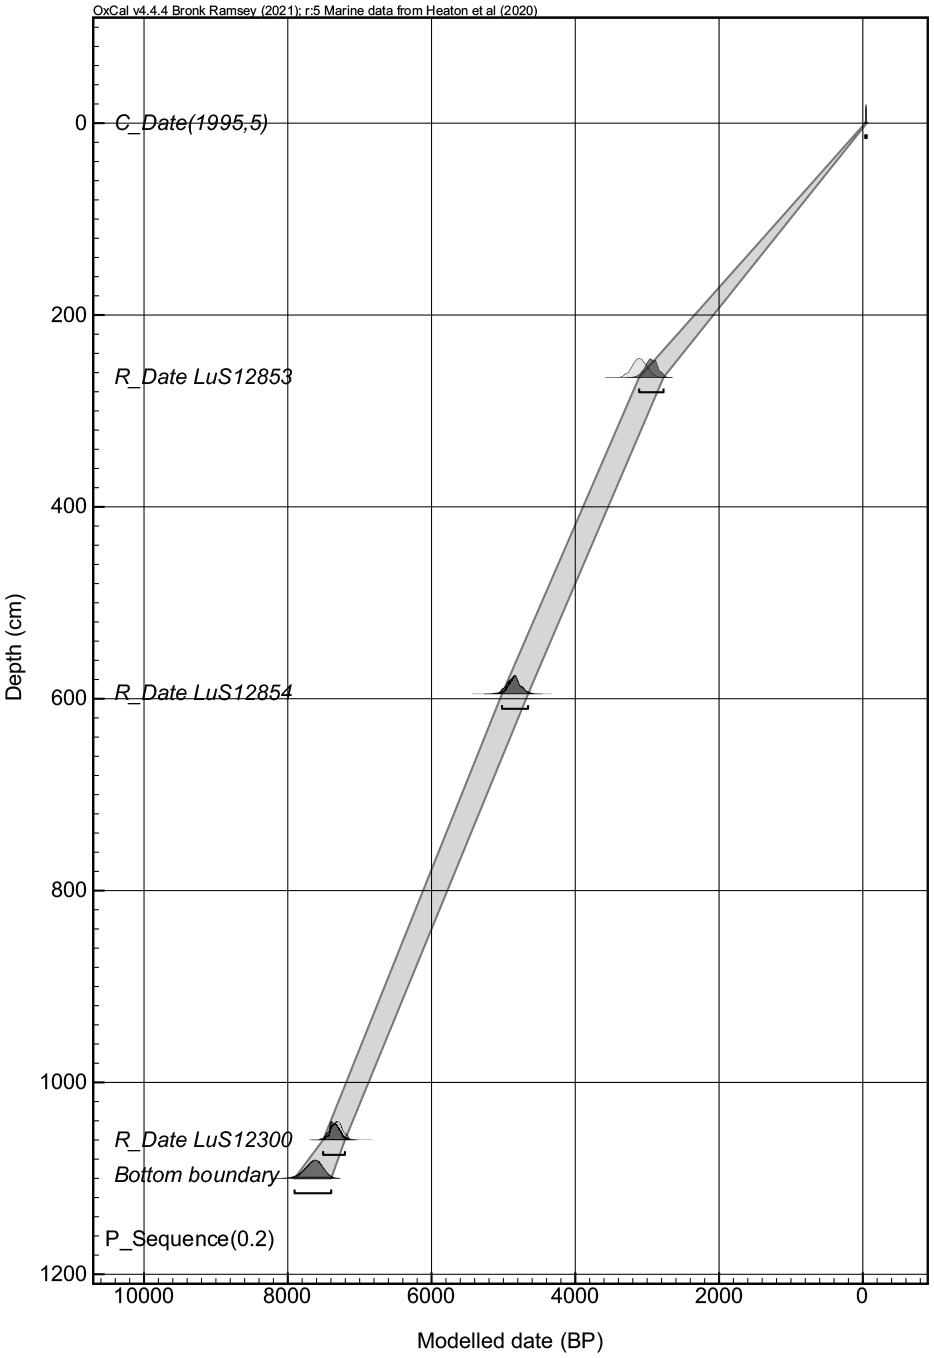
Bayesian age-depth model of the Chokrak Lake sequence.
Stratigraphy, TOC, C/N ratio and XRF geochemistry
Based on changes in lithological properties, elemental profiles of the XRF and C/N data, the sequence was subdivided into eight (1–8) units, using stratigraphically constrained cluster analysis. Unit 1 is represented by silty clay (1100–1005 cm, 7640–7060 cal. yr BP, Table 2). This interval is characterised by a high content of lithogenic elements, such as Si, Al, Fe and Ti, suggesting a prevalent deposition of detrital siliciclastic particles (Figure 3). The high Al/Si ratio is also indicative of dominance of clay particles. Titanium is consistently high and displays a decreasing trend upwards. The comparatively elevated Mn/Fe ratio suggests high water oxygenation. Calcium, Sr and S have relatively low values here. TOC values range from 0.66 to 1.41% with a mean value of 0.85%, whereas C/N ratios vary between 7.4 and 11.8 (9.8 on average). This interval is characterised by a regular occurrence of articulated shells of Cerastoderma glaucum.
Stratigraphy of the Chokrak sequence.

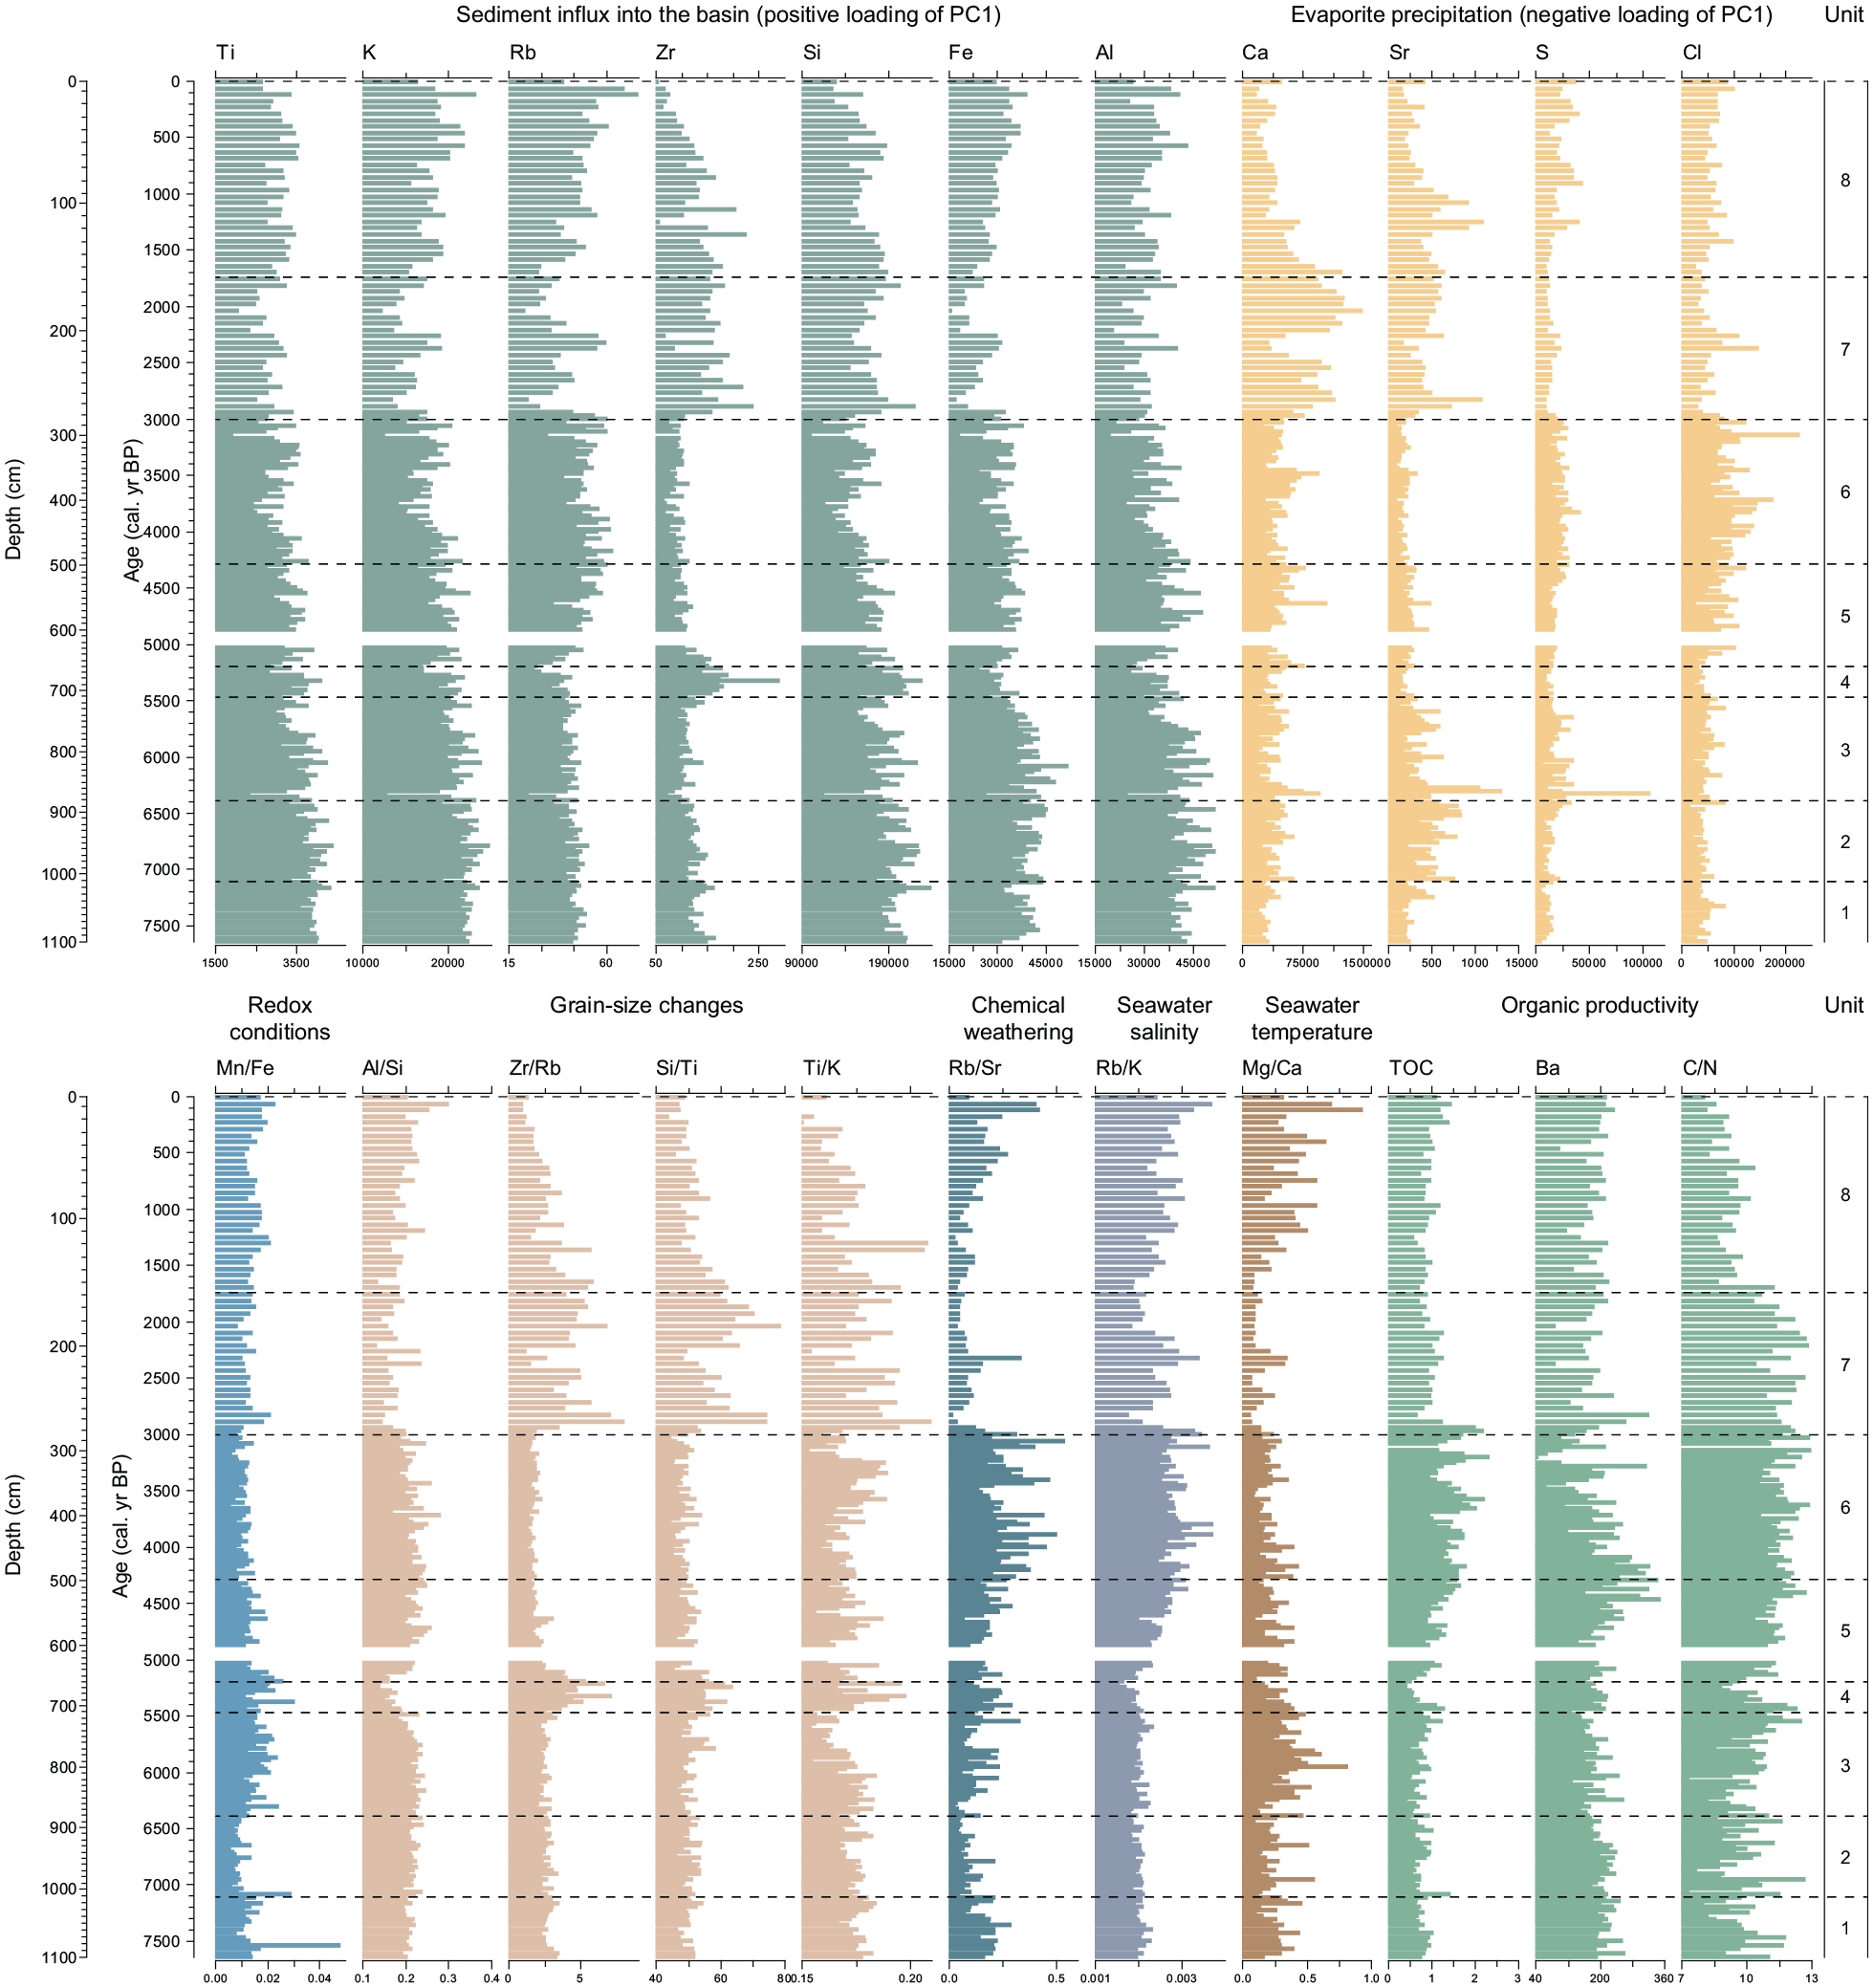
Depth profiles of the XRF elements and ratios selected for study along with TOC and C/N profiles. Geochemical units (1–8) are indicated as well. It was not possible to acquire data between 600 and 625 cm.
At 1005 cm (unit 2; 1005–875 cm, 7060–6360 cal. yr BP), the elemental curves of Si, Al, Fe and Ti start to fluctuate displaying both higher and lower values than at the base of the sequence. The relative increase in Si/Ti and Al/Si ratios, coupled with the decrease in Zr/Rb, suggests deposition of somewhat finer sediments in the basin. The increase in Ca, Ca/Ti and, particularly, Sr suggests increased carbonate precipitation, which is supported by the occurrence of visible carbonate layers between 890 and 888 cm. In this interval, only one mollusc shell was found at 930 cm. TOC values are somewhat lower, with a mean value of 0.75%, while the C/N ratios are similar to the previous unit.
Unit 3 (875–710 cm, 6360–5460 cal. yr BP) is characterised by the last instance of consistently high values of lithogenic elements, presumably marking the last stage of substantial input of detrital siliciclastics into the basin. The further increase in Al/Si ratio, coupled with the decrease in Ti/K and Zr/Rb ratios, is indicative of predominant deposition of finer sediments (a decrease in silt fraction). In the interval 879–864 cm, another carbonate layer is observed, which corresponds to local peaks of Ca, Sr and S in the XRF dataset. Upwards, between 775 and 725 cm, several gypsum layers were identified, which are marked by elevated values of Ca, Sr and, especially, S. The gradual increase in Mn/Fe might indicate a higher oxygen content during this stage. The TOC values remain low (0.77%) and the C/N ratio is 10.2 on average.
The following interval (unit 4; 710–660 cm, 5460–5190 cal. yr BP) is marked by the rapid increase in Zr, Si and, to a lesser extent, Ti values, which is attributed to the occurrence of fine sand layers in this interval. The drastic increase in Zr/Rb, Si/Ti and Ti/K ratios also demonstrates a shift from clayey to predominantly silty and sandy sediments. TOC values (0.71% on average) are reduced here, suggesting lower organic matter transport from the catchment, whereas the average C/N ratio is somewhat higher (10.4) than in the previous unit.
From 660 cm (unit 5; 660–495 cm, 5190–4270 cal. yr BP), the elemental curves of Fe and Al display an increase. The decrease in Zr/Rb and Si/Ti ratios, coupled with the increase in Al/Si, suggests accumulation of finer sediments, as the sand component was significantly reduced. Between 650 and 630 cm, the sediments have visible lamination. There were only infrequent occurrences of shells above 1005 cm, whereas from 585 cm (4780 cal. yr BP), C. glaucum shells have a virtually continuous occurrence with a high proportion of articulated specimens. The increase in TOC (from 0.65 to 1.64%) might indicate higher organic productivity in the basin, which is also mirrored in the Ba curve. The average C/N ratio is also reaching a higher value – 11.3. Higher values of Cl could point to increased porosity and/or an increase in water salinity and subsequent precipitation of halite.
Unit 6 (495–265 cm, 4270–2940 cal. yr BP) is characterised by a general decline in Ti, K, Zr, Si, Al and Fe, which suggests a gradual reduction in terrigenous influx into the basin. The minimal values of Zr/Rb and Si/Ti ratios are indicative of accumulation of the finest sediments in the sequence. The occurrence of mollusc shells in the core is captured in the Ca curve, where elevated Ca values between 355 and 370 cm correspond to an increase in shell content. This section is also marked by the highest values of TOC (0.96–2.35% with a mean value of 1.55%), which points to a noticeable increase in organic productivity. Relatively higher values of the C/N ratio (up to 13) might suggest a slight increase in terrestrial organic matter input. The corresponding highest values of Cl may be interpreted as an increase in sediment porosity and/or salinity.
Unit 7 (265–150 cm, 2940–1650 cal. yr BP) is marked by the occurrence of thick sand layers, which are reflected in elevated Zr and Si values. Elemental ratios, which are indicative of grain-size changes (Zr/Rb, Si/Ti, Al/Si and Ti/K), also suggest the deposition of significantly coarser sediments. At the same time, many of the lithogenic elements, such as Al, Fe, Ti, and K, reach their minimal values in the sequence. This interval also has the highest occurrence of C. glaucum shells with a high proportion of articulated shells. The drastic rise in Ca is interpreted as a result of the occurrence of micro-fragments of shells in the samples. TOC values are reduced from 2.0 to 0.73% with a mean value of 1.03%, while the C/N ratio is stable (11.5).
The uppermost section (unit 8 ; 150–0 cm, 1650 cal. yr BP – present) is characterised by a gradual increase in Ti, K, Rb, Al, and Fe, and by a corresponding decrease in Zr and Si. C. glaucum shells are rare above 150 cm and completely disappear after 100 cm. Carbonate content is reduced as evidenced by declining values of Ca and Sr. Nonetheless, Ca has two relative peaks after 100 cm, which might suggest evaporite precipitation. The gradual increase in S and Cl may point to higher gypsum and halite precipitation. Based on the reduction in Zr/Rb, Ti/K and Si/Ti, as well as the increase in Al/Si, it can be suggested that the sand fraction was reduced. The TOC values remained stable (0.9%) since the previous interval but started to increase after 60 cm up to 1.47% at the top, whereas the C/N ratio was reduced to 9.2.
PCA of XRF data
PCA was used to highlight the main depositional processes in the basin. The first two components of PCA explain 60.8% of the variance. The results are represented in Figure 4, which contains the loadings and scores of the elemental composition of the core samples. PC1 explains 38.0% of the total variance, while PC2 – 22.8%. PC1 is characterised by positive loadings of Ti, K, Al, Fe, and Si, and negative loadings of Ca, S,and Cl. Therefore, PC1 might represent allochthonous mineral input into the basin (siliciclastic particles) as opposed to autochthonous precipitation of evaporites.
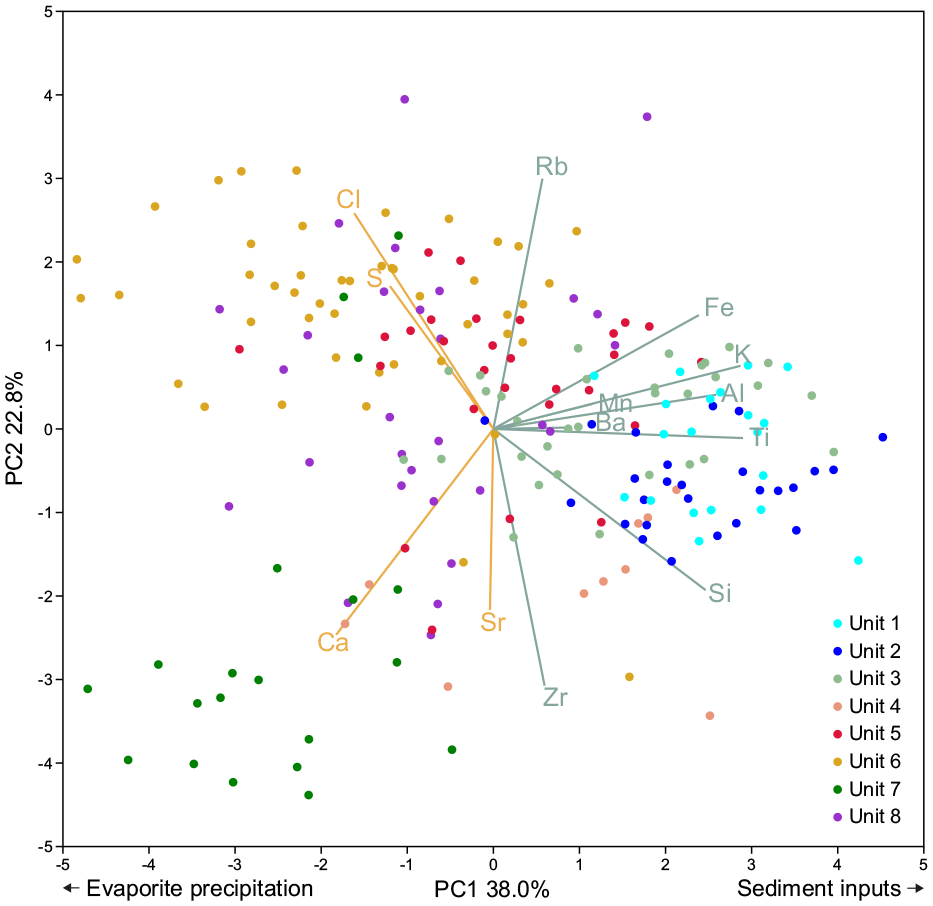
Biplot of distribution of PCA loadings of geochemical elements and core samples.
Positive loadings of PC2 are defined by Rb, Cl, S and Fe while its negative loadings are represented by Zr, Sr, Ca and Si. We assume that PC 2 is indicative of grain-size changes, carbonate content and salinity, where the positive loading is linked to fine-grained sediments with higher content of precipitates, whereas the negative loading is related to coarse-grained sediments and higher carbonate content.
The distribution of the core samples on the biplot (see Figure 4) shows that sediment influx was prevalent during the deposition of the lowermost units (1, 2, and 3). Unit 4 was characterised by deposition of coarse grain sediments and precipitation of carbonates, whereas unit 5 experienced deposition of finer sediments under more saline conditions. Units 6, 7, and 8 were primarily influenced by evaporite precipitation.
Palynological analysis
The core samples are dominated by non-arboreal pollen (NAP), including Poaceae, Artemisia and other Asteraceae, Amaranthaceae, Apiaceae, Plantaginaceae, Rosaceae and other herbs. Arboreal pollen (AP) is also present in considerable numbers and includes Picea, Pinus, Alnus, Betula, Carpinus betulus, C. orientalis, Quercus, Fagus, Ulmus, Tilia, Corylus and, less frequently, Juniperus, Ephedra distachya, Salix, Juglans regia, Fraxinus, Cornus, Rhamnus, Sambucus, and various Ericaceae. Most of these types probably represent long-distance transport from the Crimean (ca. 100 km) or Caucasian (ca. 120 km) mountains, where these taxa are widely distributed today. Aquatic pollen is occasionally present and represented by Typha latifolia, Sparganium, Potamogeton, Butomus, Hydrocharis, and rarely by Nuphar and Nymphaea alba. The pilot study of NNPs in the top 200 cm of the core was done previously and discussed in Rohozin (2019). Dinoflagellate cysts are represented mainly by Lingulodinium machaerophorum and Spiniferites sp. Prasinophyte Cymatiosphaera globulosa has frequent occurrence above 645 cm depth, whereas acritarchs Micrhystridium and Sigmopollis were rarely encountered. Colonial algae (Botryococcus, Pediastrum) were found only in two samples (at 1045 and 885 cm depth). The reworked taxa comprise up to 1% of the TLP and are attributed to the pre-Quaternary period (most probably Neogene) and include Polypodiaceae spores and pollen of Picea, Pinus, Tsuga, Alnus, Fagus, Ulmus, Carya, Pterocarya, Liquidambar and Ericaceae.
Based on CONISS and visual interpretation of the main herbaceous taxa, the pollen diagram was divided into 11 local pollen assemblage zones (LPAZ 1–11, Figure 5).
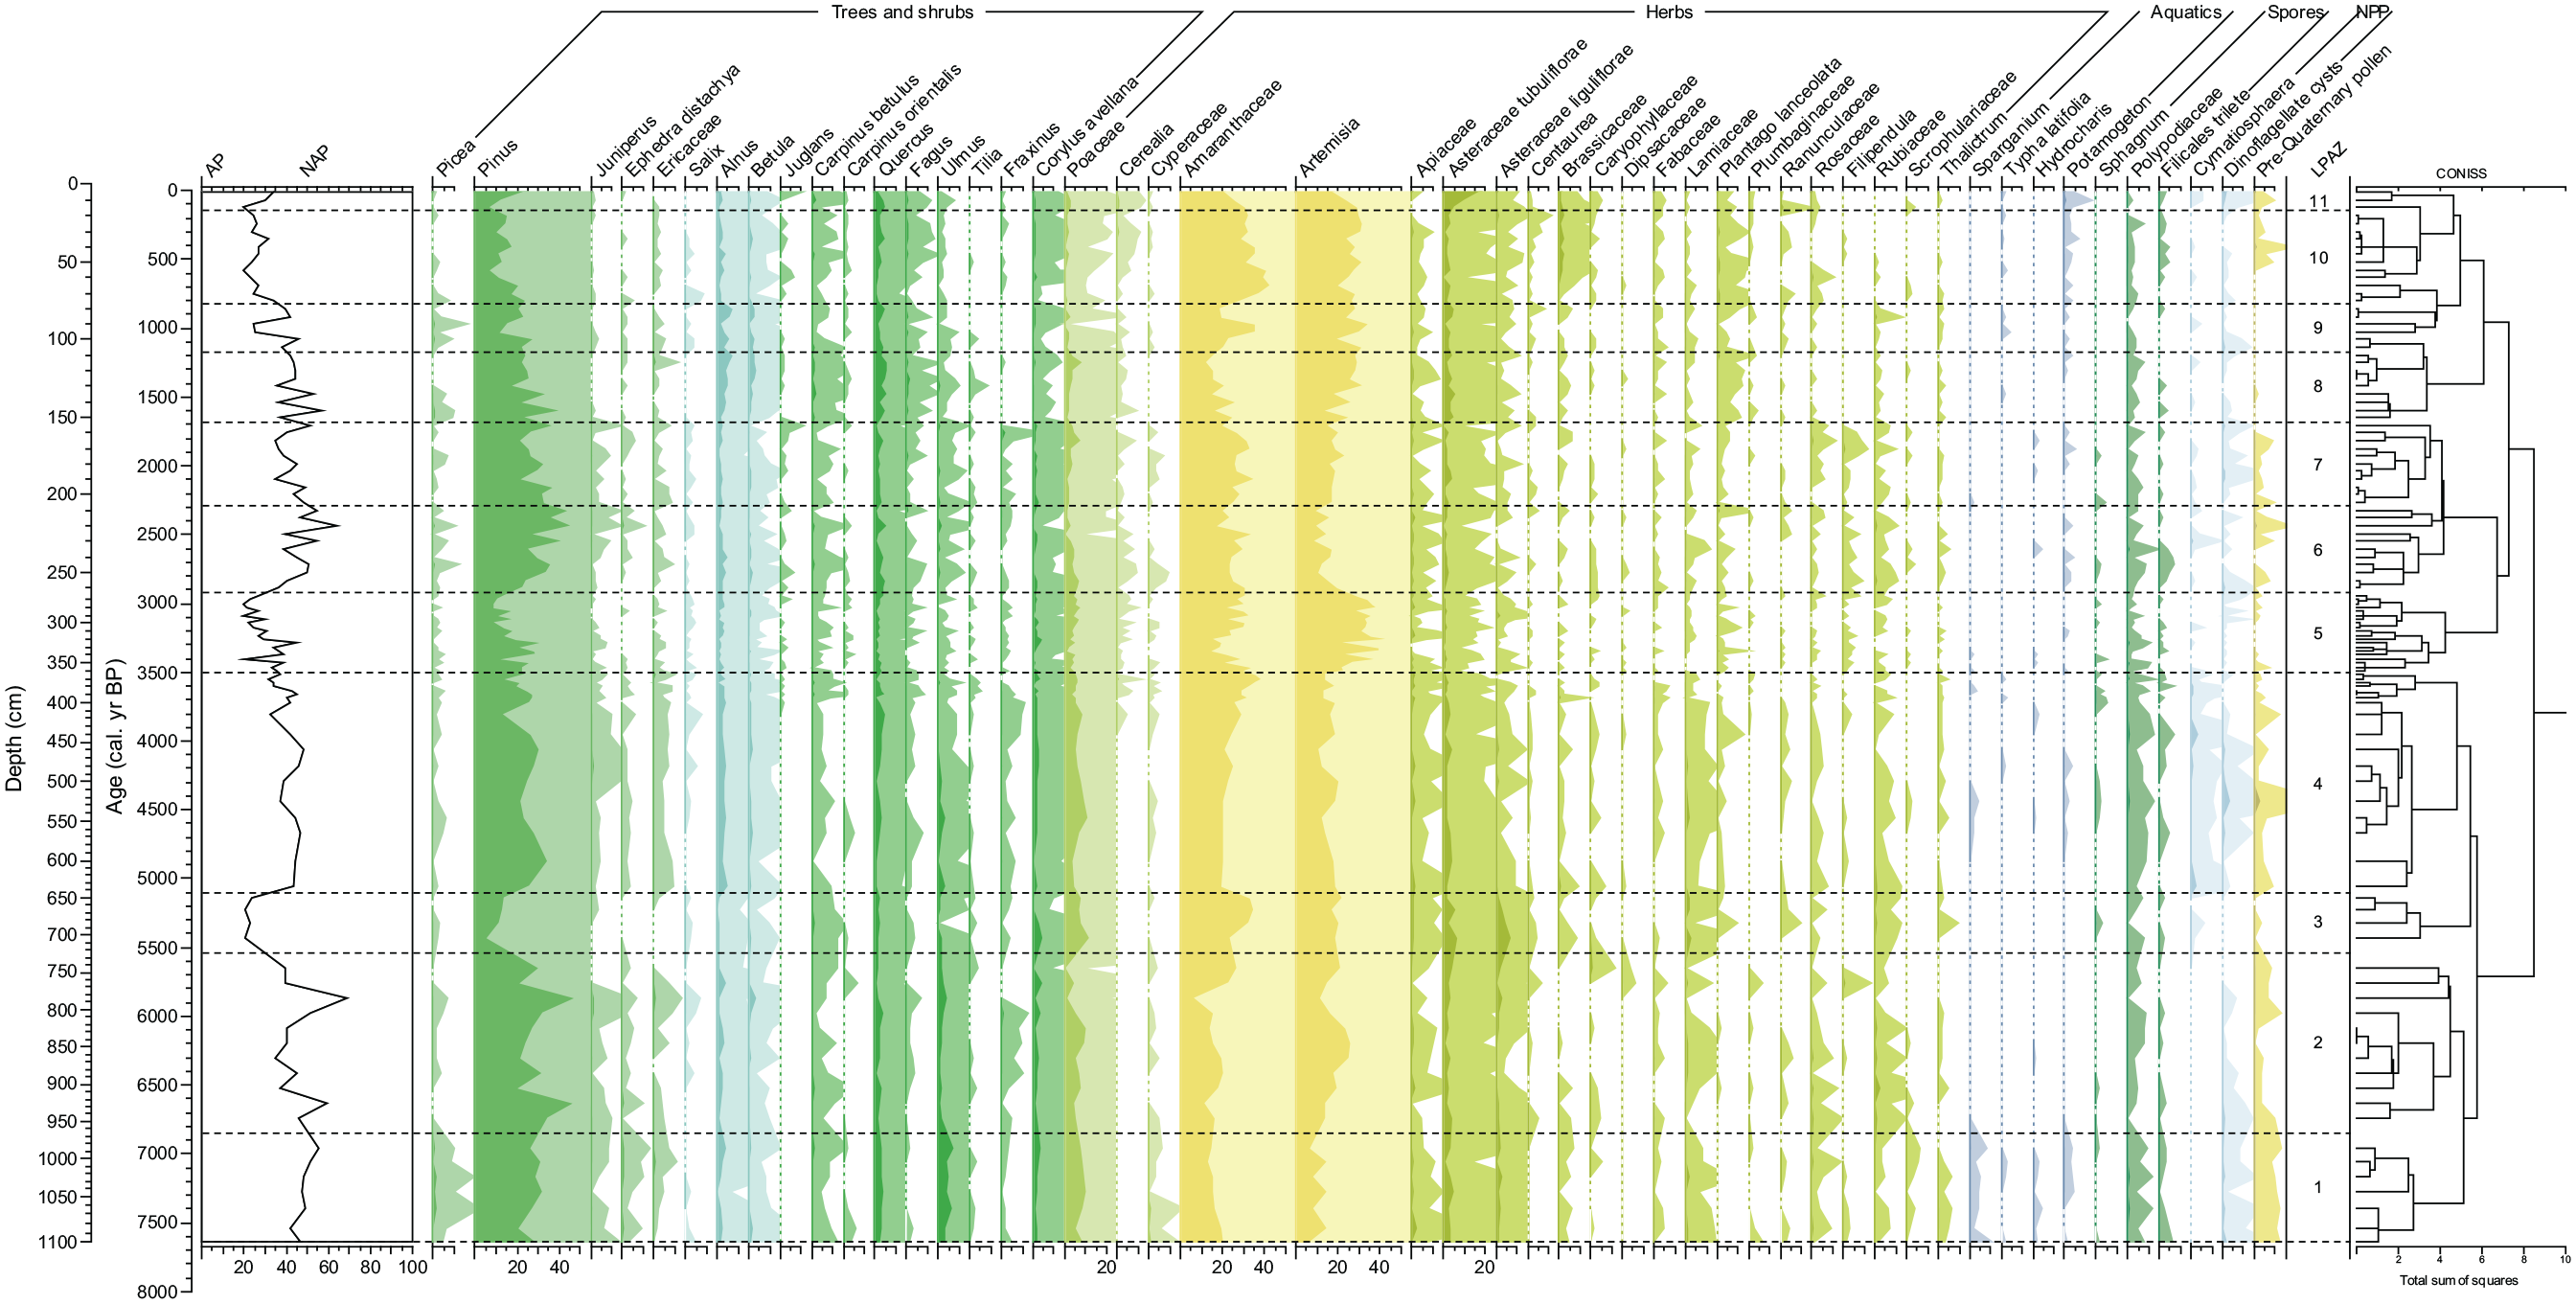
Summarised pollen diagram of core CH1 in percentages plotted on calibrated radiocarbon ages. Light-colour shades indicate ×10 exaggeration.
LPAZ 1 (1100–965 cm, 7640–6850 cal. yr BP, 5690–4900 BCE)
The beginning of the sequence is characterised by relatively high frequencies of AP (ca. 50%), which is dominated by Pinus (up to ca. 30%). The proportion of broad-leaved trees is the highest here (10%), which are dominated by Ulmus and Quercus with lesser values of Carpinus betulus and Fraxinus. Fagus and Tilia display rare occurrences, while Picea is regularly present. NAP is dominated by Amaranthaceae, Artemisia and Poaceae. Other NAP taxa are relatively diverse, although rarely exceed 10% in sum. Aquatic plants are represented mainly by Sparganium and Potamogeton pollen. Noteworthy is the occurrence of a pollen grain of Trapa natans at 1025 cm depth. Spores are dominated by the Polypodiaceae family. Dinocysts are represented by L. machaerophorum and Spiniferites sp. Pre-Quaternary pollen has the largest occurrence here (1% of TLP).
LPAZ 2 (965–725 cm, 6850–5550 cal. yr BP, 4900–3600 BCE)
The proportion of AP decreases slightly (ca. 46%). There are several peaks in Pinus values, particularly at 925 and 785 cm (up to 48%). Pollen frequencies of Ulmus and Quercus are reduced, whereas Corylus values remain largely unchanged. Picea, Fagus and Fraxinus show a continuous presence in the middle of the zone. Poaceae, increasing in the middle of the zone, fall to very low values at the top. Amaranthaceae display a relative increase towards the top, while Artemisia has a marked increase in the middle part (up to 26%). Aquatic plants are represented by a single occurrence of Hydrocharis.
LPAZ 3 (725–643 cm, 5550–5100 cal. yr BP, 3600–3150 BCE)
This zone is characterised by a significant increase in NAP (up to 80%). Pinus values fall from ca. 31% to 11%. Carpinus betulus displays a slight increase, whereas pollen frequencies of Ulmus and Alnus decline. Poaceae, Asteraceae tubuliflorae and Lamiaceae have higher percentages, while Amaranthaceae reach local peak values (33%). A. liguliflorae are most abundant in this LPAZ and reach 7%. No aquatic pollen or dinocysts are recorded in this zone, however acritarch Cymatiosphaera globulosa marks its first occurrence here.
LPAZ 4 (643–363 cm, 5100–3500 cal. yr BP, 3150–1550 BCE)
AP increases markedly (up to 40%) with Pinus values reaching ca. 25%. Alnus, Betula and Quercus increase slightly, whereas Ulmus decreases gradually towards the top. Poaceae increase halfway into the zone, whereas Amaranthaceae display a gradual increase reaching ca. 40% in the top part. Pollen frequencies of Asteraceae, including Artemisia, are reduced slightly. Plantago lanceolata has more regular occurrence here. The most remarkable feature of this LPAZ is the first occurrence of Juglans and Cerealia pollen in the top part of the zone. Pollen of aquatic plants is characterised by infrequent occurrences of Nuphar, Nymphaea, Sparganium, Butomus, Potamogeton and Typha latifolia (<1% in sum). C. globulosa is most abundant in this LPAZ. Dinocyst assemblages are dominated by L. machaerophorum, although Spiniferites sp. has infrequent occurrences.
LPAZ 5 (363–263 cm, 3500–2920 cal. yr BP, 1550–970 BCE)
AP content is reduced to ca. 30%. Pinus decreases significantly in the upper part of the LPAZ and broad-leaved trees fall to lower frequencies, however Carpinus orientalis and Juglans regia have a continuous occurrence. Artemisia reaches a maximum with regularly high values of up to 45%. Amaranthaceae fluctuate, but percentages remain largely unchanged, whereas Asteraceae fall to lower values. Poaceae are reduced slightly and Cerealia occur regularly. Cyperaceae and Plantago lanceolata are also more frequent in this zone. Pollen of aquatics have rare occurrences here. Spores and dinocysts are regularly present, whereas C. globulosa is rare.
LPAZ 6 (263–207 cm, 2920–2290 cal. yr BP, 970–340 BCE)
Pinus values increase, reaching up to 46%. Quercus, Ulmus and Carpinus increase slightly, whereas Corylus values are reduced. Tilia and Fraxinus are rare. Artemisia declines from ca. 33% to 14% while Amaranthaceae remain stable and high. A. tubuliflorae increase slightly (up to 3%) while A. liguliflorae fall to very low percentages. Poaceae values decrease gradually, but Cerealia is relatively more frequent. There is little change in spore and NPP values.
LPAZ 7 (207–153 cm, 2290–1680 cal. yr BP, 340 BCE–270 CE)
Pinus decreases gradually while Juniperus and Ephedra occur more frequently. Broad-leaved taxa display lesser values, however Ulmus and Fraxinus are more frequent. Poaceae percentages are stable with a slight increase at the top. Artemisia gradually rises while Amaranthaceae remain stable. There is a relative increase in the diversity of NAP. In LPAZ 6 and 7, aquatic plants are represented by infrequent pollen grains of Potamogeton, Hydrocharis and Sparganium. Dinocysts have a higher occurrence in this zone.
LPAZ 8 (153–108 cm, 1680–1170 cal. yr BP, 270–780 CE)
Pinus percentages continue to fall, but AP content remains unchanged (43%) due to a marked increase in Alnus, Betula, Quercus and, to a lesser extent, Carpinus betulus, while Corylus falls to lower values. Salix and Fraxinus are the least represented in this LPAZ. Artemisia continues to increase while Amaranthaceae slowly decrease. A. tubuliflorae increase slightly and A. liguliflorae are more frequent. Percentages of Fabaceae, Plantago lanceolata and Plumbaginaceae become more noticeable here. Pollen of aquatic plants has few occurrences. Virtually no reworked taxa are identified in this LPAZ.
LPAZ 9 (108–77 cm, 1170–820 cal. yr BP, 780–1130 CE)
AP content is slightly reduced here (ca. 36%), mainly due to the decrease in Pinus and broad-leaved taxa frequencies. However, Picea occurs regularly and Alnus and Betula percentages are relatively high. Poaceae values are reduced (to ca. 2%) and there is a relative increase in Artemisia and Amaranthaceae. Other herbs are relatively diverse, although do not exceed 4% in sum. Typha latifolia and Sparganium have sporadic occurrences. Spores fall to very low values and re-deposited pollen was not observed.
LPAZ 10 (77–17 cm, 820–150 cal. yr BP, 1130–1800 CE)
Pinus continues to decrease, whereas broad-leaved trees increase gradually, except for Tilia which marks its last occurrence halfway into the zone. Picea pollen becomes infrequent and frequencies of Alnus and Betula are reduced. Poaceae values remain low but Cerealia displays a steady increase after 60 cm (1320 CE). Amaranthaceae values become consistently high. Brassicaceae and Plantago lanceolata are most abundant in this LPAZ. Potamogeton has regular occurrence and Typha latifolia is more frequent. Pre-Quaternary taxa reappear in the middle of this LPAZ. Microforaminiferal linings and eggs of Artemia salina appear above 50 cm depth.
LPAZ 11 (17–0 cm, 150 cal. yr BP to present day, 1800–1995 CE)
At the top of the sequence, Pinus increases markedly (up to 24%). Pollen frequencies of Alnus, Betula and C. betulus increase slightly, while Salix and Tilia do not occur in this LPAZ. Poaceae decrease, while Cerealia reaches maximal values (1%). Amaranthaceae and Artemisia decrease gradually, whereas A. tubuliflorae display a marked increase (up to 17%). Other herbaceous taxa decline or disappear. Pollen of Potamogeton reaches its highest value (1%). Frequencies of dinocysts, which include Impagidinium caspiense, L. machaerophorum and Spiniferites cf. crusiformis, have a noticeable increase in this zone.
Discussion
Evolution of the Lake Chokrak basin
Numerous studies from the Black Sea shelf show that reconnection of the Black Sea to the Mediterranean Sea occurred between 9.8 and 9.0 cal. ka BP (Aksu et al., 2016; Hiscott et al., 2007; Ivanova et al., 2015; Yanko-Hombach et al., 2014). The Black Sea rose approximately 25 m between 10,500 and 7500 cal. yr BP, while in the following 7500 years the further increase was only ca. 10 m to reach modern conditions (Aksu and Hiscott, 2022). We assume that the Early Holocene reconnection of the Black Sea to the global ocean led to the inundation of estuaries and coastal depressions in the Crimea, which subsequently were transformed into lagoons and coastal lakes. In general, the declining trend of the PC1 curve of the XRF dataset (see Figure 6) suggests that the Chokrak basin primarily evolved in relation to its gradual separation from the sea. However, based on changes in lithology and geochemical properties of core CH1 (see Figures 3 and 4), eight main stages (I–VIII) in the evolution of the Chokrak basin can be recognised (Figure 6).

Summary of findings indicating main stages in the Chokrak basin evolution and corresponding vegetation changes along with inferred human impact on the vegetation. The prevalent steppe types were reconstructed based on the present-day variations in pollen composition within the Ukrainian steppe belt (Bezusko and Bezusko, 2000).
The obtained data from stage I (7640–7060 cal. yr BP) indicate that a shallow bay already existed in the place of Lake Chokrak by the start of the sediment sequence (Figure 6), which is evidenced by the occurrence of Cerastoderma glaucum shells in the core, which dwells in shallow calm waters with the salinity of at least 6 psu (Brock, 1979). The regular occurrence of marine dinoflagellates Lingulodinium machaerophorum and Spiniferites cf. cruciformis also points to fully marine conditions. The high concentration of lithogenic elements suggests intense accumulation of terrigenous and marine sediments in the bay. The prevailing accumulation of fine-grained sediments and the occurrence of fine lamination in the interval 7460–7030 cal. yr BP might also indicate relatively calm depositional environment.
From 7060 cal. yr BP, changes in the sediment sequence suggest a water-level rise in the bay (stage II; 7060–6360 cal. yr BP), indicating expanding marine influence. The relative sea-level rise is further supported by the slight increase in marine dinocysts, which is also observed in the NE Black Sea shelf around 7100–6500 cal. yr BP (Marret et al., 2019). The absence of marine mollusc shells also points to a deeper marine environment. The relative increase in Ca and Sr suggests slow precipitation of calcite and/or aragonite, which is supported by the occurrence of carbonates in the core.
The following stage III (6360–5460 cal. yr BP) was characterised by gradually decreasing sediment loads, which are attributed to slower rates of relative sea-level rise. Elemental grain-size indicators (Zr/Rb, Al/Si) suggest deposition of relatively finer sediments. The gradual disappearance of dinocysts might indicate decreased marine influence, possibly as a consequence of water-level lowering. The occurrence of carbonate and gypsum layers shows that the basin experienced several aridity events which led to precipitation of evaporites. The gradual increase in the C/N ratio may indicate a higher supply of terrestrial organic matter, which is also supported by higher frequencies of reworked pollen taxa.
From ca. 5500 cal. yr BP (stage IV; 5460–5190 cal. yr BP), the constant sediment loads transferred from the sea started the formation of a sand barrier between the Chokrak basin and the sea, which is evidenced by the occurrence of fine sand layers, combined with higher values of Zr and Si, as well as indicators of coarser grain size (elevated values of Zr/Rb, Si/Ti and Ti/K). This is in good agreement with the interpretation of Kelterbaum et al. (2012), who suggested that the sand barrier started to form in the third millennium BCE.
The formation of the sand barrier led to faster infilling and shallowing of the basin, which marks the transitional stage from a marine bay to a lagoon (stage V; 5190–4270 cal. yr BP). The shallowing of the basin led to the re-appearance of C. glaucum. The depositional environment also became calmer, which is suggested by the higher proportion of articulated shells. This stage is also characterised by a re-occurrence of marine dinocysts (predominantly L. machaerophorum) and the first noticeable occurrences of prasinophyte Cymatiosphaera globulosa and acritarch Micrhystridium sp. The decline in Spiniferites sp. frequencies and the dominance of L. machaerophorum and C. globulosa was also previously shown for the Black Sea in the Mid-Holocene (Mudie et al., 2001; Wall et al., 1973). These assemblage changes are indicative of higher temperatures and a steady increase in sea-surface salinities, which have also been reported from the Black Sea around this period (Mertens et al., 2012). The increase in marine plankton also indicates higher productivity that is further supported by elevated N and TOC values, as well as by high concentrations of Ba (Liguori et al., 2016).
From 4270 cal. yr BP (stage VI), an open lagoon was established (Figure 6), which was characterised by slower rates of sediment loads from the catchment and deposition of fine-grained sediments. The frequent occurrences of C. glaucum shells reflect the prevalence of shallow, calm and brackish environment. The high concentration of shells in the interval 370–355 cm might point to a decrease in sedimentation rates after 3550 cal. yr BP, which could be broadly correlated with the period of increased aridity in the Mediterranean between 3500 and 2500 cal. yr BP (Mayewski et al., 2004). The declining Ba concentration suggests a decreased influence of marine Ba cycle on the lagoon, whereas higher N and TOC values suggest a noticeable increase in both aquatic and terrestrial productivity. The decrease in C. globulosa and dinoflagellate cyst frequencies also points to decreased marine influence.
Abrupt changes in the depositional environment occurred from 2940 cal. yr BP (stage VII; 2940–1650 cal. yr BP), when the continued sediment supply from the sea led to an active build-up of the sand barrier and deposition of coarser sediments, which are evidenced by the occurrence of thick sand layers in the sediment core, as well as elevated Zr/Rb and Si/Ti values. The fluctuating character of lithogenic elemental curves suggests that the sedimentary processes in the basin were not stable, with changing rates of run-off in the catchment and marine sediment transport, as evidenced by intercalation of silt layers with sand ones. The highest concentration of C. glaucum shells in the core, in particular their fragments, might suggest that intense sediment transport from the sea was responsible for carrying those shells from the near-shore area into the lagoon. The noticeable occurrences of dinocysts in this interval suggest that the lagoon remained connected to the sea (Figure 6). The basin evolution model proposed by Kelterbaum et al. (2012) shows that the sand barrier formation occurred in the second/first millennium BCE and that the lagoon was still navigable during the Greek colonisation, which supports our interpretation.
The transition from the semi-open lagoon to a closed coastal lake occurred in the last stage VIII (1650 cal. yr BP until present). The gradual rise in S and Cl concentrations (presumably precipitation of gypsum and halite) is indicative of an increase in salinity. The gradual decrease in the concentration of C. glaucum shells also points to higher salinity, which presumably rendered the lake uninhabitable for this species. The occurrence of marine dinoflagellate cysts and microforaminiferal linings in the uppermost samples might indicate an increase in tidal activity and/or high-energy storm events. The occurrence of lamination from ca. 900 cal. yr BP testifies to the prevalence of a stable depositional environment. The increasing values of lithogenic elements such as Al, Fe, K and Rb might point to higher rates of sediment loads from the catchment. The relative increase in TOC values might also suggest an increase in run-off from the catchment. However, the decreasing values of the C/N ratio point to predominant accumulation of marine-derived organic matter (Emerson and Hedges, 1988).
Past vegetation and human influence
At 7640 cal. yr BP (LPAZ 1), the landscape around the site was dominated by herb-grass steppe with a variety of mesic communities, dominated by Apiaceae, Asteraceae and Lamiaceae (Figure 6). Xerophytic associations, which included types such as Artemisia, Ephedra and Sedum, were probably common on uplands. The bay shores supported halophytic communities with species of Amaranthaceae and Plumbaginaceae. The occurrence of pollen from aquatic plants suggests the presence of wetlands in the study area. The largest proportion of broad-leaved trees in the pollen record might indicate the expansion of broad-leaved forests in the Crimea (Gerasimenko et al., 2022) and the Caucasus (Connor and Kvavadze, 2009; Grachev et al., 2021) between ca. 7900 and 6800 cal. yr BP. Our pollen records from this period display the highest frequencies of Ulmus, which are also recorded around 7000 cal. yr BP from various sites in the Black Sea region (e.g. Filipova-Marinova et al., 2016; Marret et al., 2019; Shumilovskikh et al., 2012). High pollen frequencies of Pinus could be indicative of the development of pine forests in the river valleys of southern Ukraine at the beginning of the Mid-Holocene (Kremenetski, 1995). This vegetation composition, including the largest proportion of mesophilous herbs, suggests warm and humid conditions between 7640 and 6850 cal. yr BP.
From 6850 cal. yr BP (LPAZ 2), there was a relative decline in the proportion of mesophilous herbs and an expansion of Artemisia-grass communities. Nonetheless, mesic communities were rather diverse and included species such as Centaurea, Linum, Plantago, Filipendula, Thalictrum and others. The disappearance of aquatic pollen suggests a reduction in wetlands around the site. The noticeable increase in Artemisia frequencies between ca. 6300 and 6100 cal. yr BP might indicate a dry phase, which has also been recorded in the Crimean mountains (Gerasimenko et al., 2022). The role of Ulmus was reduced and mixed oak forest with a larger proportion of Fagus and Fraxinus dominated the northern slopes of the mountains. The relative expansion of riparian shrublands occurred during this period, as indicated by higher pollen frequencies of Alnus and Salix. Thus, it can be suggested that the progressive Mid-Holocene climate warming resulted in more arid conditions due to increased evaporation.
Between 5550 and 5100 cal. yr BP (LPAZ 3), herb-grass steppe spread around the site, as indicated by relatively high frequencies of grasses, as well as Asteraceae tubuliflorae and A. liguliflorae, Apiaceae, Lamiaceae and Rubiaceae (Figure 6). The absence of Ephedra pollen also suggests that steppe vegetation became more mesophilous. However, a notable increase in Amaranthaceae frequencies probably indicates an expansion of saltmarshes around the bay. In the montane forests, the role of Ulmus was further reduced and Carpinus became more abundant. These vegetation changes are indicative of warmer and wetter climate, which also prevailed in the Taman peninsula up to 5160 cal. yr BP (Bolikhovskaya et al., 2018).
Between 5100 and 3500 cal. yr BP (LPAZ 4), the vegetation around the Chokrak lagoon was characterised by the prevalence of grass steppe. The lowlands supported mesic communities, whereas on the uplands more xerophytic communities of Artemisia and grasses were dominant. Higher frequencies of Cyperaceae and various aquatic taxa might suggest an expansion of wetlands in the interval ca. 4670–4440 cal. yr BP. In the mountains, the higher proportion of Quercus, accompanied by more widespread Fagus, Tilia and Fraxinus, is indicative of the establishment of a mixed oak forest. In the interval ca. 3750–3550 cal. yr BP, a relative aridification of the climate occurred, as evidenced by the spread of Artemisia-grass steppe and the expansion of saltmarshes around the lagoon (Figure 6). Tilia is continuously present throughout this phase, which could suggest that the climate became warmer. Similar palaeoenvironmental conditions have been recorded in the Taman peninsula around 3780–3430 cal. yr BP (Bolikhovskaya et al., 2018) and between 1800 and 1700 BCE in the East Ukrainian steppe (Gerasimenko, 1997b).
The appearance of Juglans regia pollen at 3720 cal. yr BP probably does not reflect its distribution in the region. Its introduction to the peninsula is attributed to the Greek colonisation, and did not occur before the fifth century BCE (Cordova and Lehman, 2003). According to Bottema (2000), Juglans pollen may be re-deposited when it is found together with Carya, and considering the occurrence of walnut pollen with Pterocarya in the Chokrak record, it might be possible for it to be re-deposited after the erosion of the bedrock around the lagoon.
The important indicator of human influence around this period is the first occurrence of Cerealia pollen at 3660 cal. yr BP, which was followed by an increase in A. liguliflorae and Plantago lanceolata (see Figure 6). It is most probable that the Cerealia pollen recorded in LPAZ 4 marks the introduction of cultivation in the region. This interpretation is also supported by the studies from the Taman peninsula, where Cerealia pollen first appeared around 3500 cal. yr BP (Bolikhovskaya et al., 2018). In southern Ukraine, the earliest findings of Cerealia pollen are dated to 1400 BCE (Gerasimenko, 2019), whereas in southwestern Crimea Cerealia cultivation may have been practised since 2000 BCE (Cordova and Lehman, 2003).
Between 3500 and 2920 cal. yr BP (LPAZ 5), the landscape around the Chokrak lagoon was characterised by the dominance of grass-Artemisia steppe, which suggests a shift to arid conditions. Warm and arid conditions are also reported from the Sea of Azov between 3500 and 3000 cal. yr BP (Matishov et al., 2013), while Artemisia and Amaranthaceae communities were widespread in the Taman peninsula between 3430 and 2910 cal. yr BP (Bolikhovskaya et al., 2018). The extent of the Crimean forests was relatively reduced, as evidenced by the decrease in broad-leaved taxa pollen. The Cerealia pollen has a continued presence, but does not increase here, suggesting that the arable lands were present in the region, but not in the vicinity of the study site. On the other hand, pasturelands probably gained larger distribution, as indicated by the relative increase in Plantago lanceolata and A. liguliflorae.
More humid conditions were reconstructed from 2920 cal. yr BP (LPAZ 6), when the presence of Artemisia was reduced considerably and the vegetation was represented by grass steppe with saltmarshes around the lagoon, Artemisia-Amaranthaceae communities on uplands, and mesic communities on lowlands. Pollen records from the east Ukrainian steppe (Gerasimenko, 1997b) and the Taman peninsula (Bolikhovskaya et al., 2018) indicate the prevalence of warm and arid conditions with the expansion of grass steppe, whereas pollen data from the Sea of Azov display elevated values of arboreal pollen, particularly of Betula and Alnus (Matishov et al., 2013). The Chokrak pollen record displays consistently high Pinus frequencies for this time interval, which presumably originates from the northwestern forested regions and might suggest greater influence of the westerlies. The westerlies probably brought more humid air masses to the mountains, which is indicated by the relatively increased frequencies of Quercus, Carpinus betulus and Ulmus.
From 2290 cal. yr BP (LPAZ 7), the steppe vegetation became dominated largely by Artemisia-grass and halophytic communities. Pollen records from sites Marfovka and Sazonovka (fourth to third centuries BCE) also reflect the prevalence of rather xeric steppe vegetation in the Kerch peninsula (Kruglikova, 1975) and relatively dry conditions are reported from the Taman peninsula between 2600 and 2300 cal. yr BP (Bolikhovskaya et al., 2018). The beginning of this phase coincides with the establishment of early Greek colonies on the eastern Crimean shores (Hind et al., 1994). One of those sites, Zenon’s Chersonesos (see Figure 1), was on the cape Ziuk (3 km northeast of the site). At the beginning of the fourth century BCE the settlers of Zenon’s practiced farming, cattle breeding and fishing (Maslennikov, 1998). The obtained pollen records do not display a significant human impact on vegetation composition around this period, although higher occurrences of Asteraceae liguliflorae, Centaurea sp. and Plantago lanceolata pollen may point to an increase in pastoral activities. On the other hand, the increase in pollen frequencies of broad-leaved trees, grasses and Filipendula might point to slightly wetter conditions from 2100 cal. yr BP, which are also reported from 2000 and 2300 cal. yr BP in the Sea of Azov (Matishov et al., 2013) and the Taman peninsula (Bolikhovskaya et al., 2018), respectively.
The period after 1680 cal. yr BP was characterised by an increase in humidity as evidenced by higher frequencies of Alnus, Carpinus betulus, Quercus and Fagus. At present, birch has a very limited distribution in the Crimean mountains at elevations of 1000–1200 m a.s.l. (Didukh, 1992). Noticeably higher frequencies of birch in LPAZ 8 may reflect the larger distribution of Betula in cooler conditions. The decrease in Amaranthaceae pollen, coupled with the corresponding increase in Artemisia, might also reflect a transition to slightly cooler conditions and expansion of grass-Artemisia steppe with a higher proportion of other Asteraceae species. While the Cerealia curve does not display significant fluctuations to infer changes in farming practices, the increase in Plantago lanceolata may be indicative of intensified grazing (Figure 6).
Between 1170 and 820 cal. yr BP (LPAZ 9), relatively humid conditions prevailed in the region, which is evidenced by relatively high values of Picea, Alnus and Ulmus. The steppe communities were primarily composed of grasses and Artemisia, although mesophilous herbs were relatively widespread. Evidence from the Lower Dnieper (Kremenetski, 1995), southwestern Crimea (Gerasimenko, 2007) and the Taman peninsula (Bolikhovskaya et al., 2018) also indicate the dominance of warm and humid conditions. From 820 cal. yr BP (LPAZ 10), an aridification trend is observed, which is reflected in declining AP values and the increase in Amaranthaceae frequencies. We assume that the climate became cooler, which led to lower evaporation in the mountains and the expansion of mesophilous taxa, such as Carpinus betulus, Fagus and Ulmus. The hillsides around the lake supported diverse shrubs such as Cornus, Ribes and members of Caprifoliaceae and Rosaceae. However, the steppe landscapes were more affected by the decrease in moisture availability, where Artemisia and Amaranthaceae formed a significant proportion of the local vegetation. Human-induced vegetation changes also became more pronounced from 750 cal. yr BP, which is reflected in increasing pollen frequencies of Cerealia, A. liguliflorae, Centaurea and Brassicaceae. These changes suggest that arable lands were noticeably expanded around the site, in addition to already widespread pasturelands.
During the last ca. 200 years (LPAZ 11), there has been a steady increase in Pinus proportion, which is related to its plantation since the late 1940s. The relative increase in Carpinus, Quercus, Fagus and Ulmus frequencies may also point to relatively warm and humid conditions over the last century, which were also inferred by Gerasimenko (2007) and Bolikhovskaya et al. (2018). The increase in Poaceae values, combined with the reduction in Artemisia and Amaranthaceae values, might be indicative of the spread of more mesic herb-grass communities. The vegetation cover was also strongly influenced by human activities over the last two centuries. The rapid development of agricultural practices in Crimea since 1800 CE is evidenced by the highest frequencies of Cerealia pollen. This phase is also related to the establishment of several settlements around Lake Chokrak (see Figure 1). The considerable increase in A. tubuliflorae, which is also observed in pollen records from the Sea of Azov (Matishov et al., 2013), is therefore interpreted as a result of the development of ruderal communities around the lake. In the late 1940s, most of those settlements were abandoned, which supposedly furthered the expansion of Asteraceae species in the vicinity (Figure 6).
Conclusion
The multiproxy palaeoenvironmental study of core CH1 provides new insights into the Holocene climate and sea level changes, vegetation history and human activities in eastern Crimea. The main conclusions that could be drawn are: (1) around 7600 cal. yr BP a shallow marine bay existed in place of Lake Chokrak, which was progressively deepened by ca. 6400 cal. yr BP; the slower rates of sea-level rise and continued sediment supply from the sea were responsible for the slow infilling of the bay and its transition into a lagoon by ca. 3000 cal. yr BP, which was followed by an active build-up of a sand barrier and complete separation of the basin by ca. 900 cal. yr BP; (2) the Holocene vegetation history of the Chokrak area was characterised by the prevalence of steppe vegetation, although its composition, in particular the proportions of xerophilous and mesophilous taxa, has repeatedly changed; mesophytic communities were most widespread during the Holocene thermal optimum, while the subsequent climate changes influenced proportions of grasses and xerophytes; (3) the reconstructed changes in the aquatic and terrestrial environment have similar patterns, for example phases of basin-level lowering were usually accompanied by an expansion of more xeric vegetation and vice versa, which suggests that these changes were primarily induced by climate variations; (4) the first instance of human influence on the vegetation in the study area were increasing frequencies of Cerealia and pasture indicators pollen from ca. 3660 cal. yr BP, although farming did constitute a noticeable part of subsistence until ca. 750 cal. yr BP.
Footnotes
Acknowledgements
We would like to thank the late George Kukla, who initiated the project of investigation of salt beds in Crimea and who oversaw the extraction of the cores. We are also grateful to Natalia Gerasimenko, who kindly provided pollen data of the surface sample from the lake and gave valuable comments during the manuscript preparation. Many thanks to Petra Mudie for support and help with the identification of dinocysts and marine NPP. The paper was improved by valuable comments from two anonymous reviewers.
Funding
The author(s) disclosed receipt of the following financial support for the research, authorship, and/or publication of this article: This study was funded by a Visby Scholarship for PhD and postdoctoral studies by the Swedish Institute (SI).
