




Abstract
In semi-arid northeastern Brazil, where water is scarce, rainforest refugia can be seen along the coastal relief, where the trade winds bring in humidity from the Atlantic Ocean, or further inland, at the Araripe plateau where water comes from aquifer resurgence. In order to reconstruct past changes in water resurgence and in their associated vegetation types, we analyzed pollen, charcoal, and trace elements from sediment cores collected in the permanent swamps created by the resurgences. Our high temporal resolution analyses show that the vegetation was more sparse and drier than today until 2700 cal yr BP. Between 2700 and 2000 cal yr BP, palm swamp and evergreen forest tree taxa started to expand, suggesting an increase in water resurgence. At 2000 cal yr BP, the moist forest with Mauritia expanded and fire activity changed from mixed to woody fuel particles. During the last 200 cal yr BP, a decrease in the palm tree Mauritia flexuosa, an expansion of Poaceae and an increase in macrocharcoal particles are attributed to an increase in anthropogenic activities in the Araripe Basin. The Late-Holocene climatic trend seen at Araripe mirrors that of eastern Brazil and has controlled the aquifer activity, including during the major droughts that affected the region. This is highly relevant for the application of public policies that rely on the aquifers of Araripe for the 21st century.
Introduction
As semi-arid environments are characterized by a scarcity, even the absence, of surface water, the main source for drinking water supply, agricultural, and industrial purposes, is generally represented by groundwater (Dillon et al., 2022). In the semi-arid region of north-east Brazil (NEB), located between 3°S and 16°S latitude, due to shallow and stony soils originating from impermeable rocks of the crystalline basement (Sampaio, 1995), the water supply is predominantly from surface water basins (Ledru et al., 2020), except for a small region of central NEB which benefits from resurgences of water coming from the northeastern slope of Chapada do Araripe. Because of the natural dry conditions and increasing water demand, NEB is regularly confronted with water insecurity issues (Marengo et al., 2022). During the last century, NEB has experienced recurrent droughts, with dramatic effects on the environment (Marengo and Bernasconi, 2015). The Araripe plateau (Chapada do Araripe in Portuguese) is located ~500 km from the coast in the middle of a densely populated semi-arid region exposed to the effects of climate change (Marengo et al., 2020). However, the Araripe plateau sustains a forest refuge thanks to aquifer resurgence able to supply year-round water resources (Costa et al., 2023). Due to the high permeability of the soils of the plateau, the water is stored in aquifers with an exudation of perennial springs at ~700 m asl. The water of these aquifers results from a strong interaction between surface water and groundwater (Mendonça et al., 2004). What confers the perpetuity of the water flow in the exudation zones of Araripe is the residence time of the water in the suspended aquifer, which according to Mendonça (2001) is 180 years, and gradually guarantees the frequency of the outflow. However, demography, agricultural practices and the on-going temperature increase are putting a threat to this precious water resource and the Brazilian water agency estimated that the amount of groundwater extracted is much larger than the mean annual recharge (Mendonça et al., 2004). In addition, the progressive decrease in precipitation is also impacting the mean annual recharge of the aquifer as for instance observed during the last long period of drought, from 2012 to 2016 (Costa et al., 2023). During the Holocene, speleothem-based climate reconstructions show a progressive installation of drier conditions in NEB from early to Late-Holocene along an east-west moisture gradient (Cruz et al., 2009; Utida et al., 2020). However, little is known about the evolution of the forest refugia during the Holocene. The pollen record from the Maranguape refugia (Montade et al., 2014), a rainforest enclave near the coast, showed a major dry episode at ~4200 yr BP followed by a progressive return of humidity, although never returning to the pre-4200 yr BP level. Albeit with variable intensity, the 4200 years event was well observed from the west to the east of NEB (Utida et al., 2020). However, after the 4200 yr BP event, NEB was split into two climatic regions, with western NEB becoming more moist (Xavier et al., 2024) and eastern NEB becoming drier (Utida et al., 2020). Today, as the region is subject to progressive drying (Marengo and Bernasconi, 2015) it is urgent to conserve the forest to preserve the water quality. To better assess the future of the aquifers of the Araripe and their associated moist forest, we collected two sediment cores near the water resurgences and performed muliproxy analyses. We reconstructed the impacts of drought and of human activity on the vegetation dynamic and biodiversity of the Araripe plateau during the last 5300 years. Finally, we discussed the future of the forest refuge in the context of on-going climate change, the increasing demand for water in the upwelling areas for domestic and agricultural consumption and, the need to manage the provision of water for the local population.
Study area
Geology
The Araripe Basin is a highland “oasis” located in the middle of a semi-arid region (Figure 1). The residual relief of Araripe forms a plateau of 900 km² reaching an elevation of 1000 m asl (Morales and Assine, 2015), and is a unique area within the drought polygon represented by the State of Ceará (Figure 1). It is the largest inland basin in NEB and is formed from Paleozoic and Mesozoic continental and marine deposits. The lithostratigraphy comprises the Cariri Valley Group, with Cariri (Paleozoic), Brejo Santo (Jurassic), and Abaiara (Cretaceous) formations, and of the Araripe Group composed of Barbalha, Santana, Araripina, and Exu Cretaceous formations (Assine, 2007). The Araripe plateau was the first Brazilian national forest conservation unit, created in 1946 and has been included in UNESCO’s Global Geoparks Network (GGN) since 2006, because of the presence of important paleontological and geological sites (Cabral and Mota, 2010; Herzog, 2017). The superposition of layers with different thicknesses, lithologies, facies, and ages favored the formation of three levels of aquifers: a lower level with an average thickness of 100 m, a middle level with an average thickness of 500 m and an upper level with an average thickness of 320 m (DNPM, 1996). The upper aquifer of the Exu Formation, between 800 and 1000 m asl, is formed of fluvial sandstones with an average thickness of 320 m, situated within an exudation of perennial springs at ~700 m asl, which generate local moisture, feeding the surface hydrography and maintaining regional conditions that are in contrast to the surrounding semi-aridity (Guerra et al., 2020, 2023).

(a) A map of South America indicating the Brazilian biomes; (b) The location of the Araripe plateau (in black) and of the records discussed in the text: 1. Chapada das Mesas (Xavier et al., 2024); 2. Sete Cidades (Pessenda et al., 2010; Xavier et al., 2022; 3. Serra do Maranguape (Montade et al., 2014); 4. Catimbau (de Moraes et al., 2020); 5. Icatu (Oliveira et al., 1999); 6. Araripe National Forest (Pessenda et al., 2010); 7. Guaribas Reserve (Pessenda et al., 2010); 8. Apodi cave (Utida et al., 2020); 9. Lake Boqueirão (Utida et al., 2019). (c) A map of the Araripe plateau showing the distribution of vegetation and the location of the cores OAS-20 and CHA-20. (d) A topographical map of the Araripe plateau with the location of the cores OAS-20 and CHA-20; (e) A picture showing the northern edge of the Araripe plateau.
Aquifer recharge depends on annual rainfall and the time for the water to resurface varies depending on the location. On the western side of the plateau the water residence lasts ~180 years, with a mean flow of ~85 m3/year (Mendonça, 2001).
Climate
The local climate (with a dry summer, according to Alvares et al., 2013) is characterized by a mean annual precipitation (MAP) of 1100 mm, concentrated between January and May, a mean annual temperature (MAT) of 24°C with little variation throughout the year and a mean average annual potential evapotranspiration of ~120 mm (Supplemental Figures 1 and 2; SUDENE, 2021).
NEB rainfall patterns are modulated by four types of drivers that interact at different levels as a function of location (e.g. eastern NEB vs western NEB): the South American Summer Monsoon (SASM), the Inter Tropical Convergence Zone (ITCZ), cold surges activated by the temperature gradient between the southern pole and the equator, and the South Atlantic Subtropical Dipole (SASD; Marengo et al., 2012, 2018; Marengo and Bernasconi, 2015; Wainer et al., 2021). The interhemispheric sea surface temperature (SST) gradient controls the position of the ITCZ north and south of the equator in the tropical Atlantic Ocean with the ITCZ at its furthest south from March to May, when NEB experiences its rainy season during the negative phase of the SASD (Wainer et al., 2021). Abnormal rainfall seen at Araripe is also observed when moisture from the South Atlantic Ocean reaches the Araripe plateau, which is modulated by the strength of the south-east trade winds and of the Atlantic Subtropical High (Brahmananda Rao et al., 1993). The El Niño–Southern Oscillation Events (ENSO) can have a strong influence on the interannual variation of the regional climate (Marengo et al., 2017). The historical precipitation series for Crato and Missão Velha (Supplemental Figure 1) shows irregularities in their interannual distribution with, for example, two extreme droughts in 1919 and 1958 associated with an El Niño episode. Another driver of drought conditions is the anomalous northward position of the ITCZ during a positive phase of the SASD, when colder SSTs are observed in the Southern Atlantic (and inversely for extreme rainfall; Andreoli and Kayano, 2006; Marengo and Bernasconi, 2015).
Vegetation
The vegetation of NEB is dominated by the Caatinga phytogeographic domain (Moro et al., 2016) also known as the “drought polygon” (Polígono das secas in Portuguese). However, the flora of the Araripe plateau is under the influence of the northeastern phytogeographic Cerrado province (Moro et al., 2015; Ratter et al., 2003). It comprises typical species from several Cerrado physiognomies (Figure 2), such as a seasonal evergreen forest, which forms a type of headwater forest near the aquifers as a consequence of the water resurgence on the northeastern slope of the plateau, and also favors frequent fogs on the top of the plateau (Loiola et al., 2015). From the moist northern edge to the dry interior of the plateau, the succession of cerradão (a semi-deciduous forest), cerrado sensu stricto (a semi-deciduous woody savanna with a grass layer), and Carrasco (a deciduous shrubland) follows the soil moisture gradient (Guerra et al., 2020). Below 400 m asl, the Caatinga, a dry deciduous forest and the most characteristic vegetation of the semi-arid NEB, covers the bottom of the plateau (Figure 2; Guerra et al., 2020; Loiola et al., 2015; Pessenda et al., 2010; Ribeiro-Silva et al., 2012). In the seasonal evergreen forest, represented by both a headwater forest near the OAS aquifer at 700 m asl (Benício et al., 2023), and a semi-deciduous (cerradão) type of cloud forest at the top of the plateau between 904 and 967 m asl (Santos et al., 2019), the families Fabaceae, Myrtaceae, and Rubiaceae present the highest number of species, while Brosinum gaudichaudii (Moraceae), Talisia esculenta (Sapindaceae), Machaerium acutifolium (Fabaceae), and Ouratea sp. (Ochnaceae) are among the most represented species (Benício et al., 2023). Other families, such as Salicaceae, Annonaceae, and Chrysobalanaceae, are also well represented in both humid forest types (Supplemental Table 1). In the cerradão, the families with the highest species richness are represented by Myrtaceae and Fabaceae (Macêdo, 2014), while Ocotea nitida (Lauraceae), Protium heptaphyllum (Burseraceae), Licania sp. (Chrysobalanaceae), Cordiera myrciiflora (Rubiaceae), and Bowdichia virgiloides (Fabaceae) are among the most abundant species. In the cerrado sensu stricto, at 900 m asl, Fabaceae, Myrtaceae, Poaceae, Apocynaceae, Euphorbiaceae, and Malpighiaceae are the most represented families, and Protium (Burseraceae), Byrsonima (Malpighiaceae), and Solanum (Solanaceae) the most represented genera (Costa and Araújo, 2007; Supplemental Table 1). The phytosociology of an enclave of cerrado located within the Caatinga at a low elevation (200–400 m) represents a dry type of cerrado, with among others the genera Astronium and Curatella represented (Calixto-Júnior et al., 2021; Supplemental Table 1).

Schematic altitudinal profile showing the main vegetation physiognomies found between the lowlands and the summit of the Araripe plateau (Guerra et al., 2020; Loiola et al., 2015; Pessenda et al., 2010), the location of the aquifers at ~700 m elevation (blue star) and pictures of the vegetation types observed on the plateau: (a) Caatinga (during the dry season), (b) evergreen forest, (c) cerradão, (d) cerrado sensu stricto, and (e) Carrasco (see text for explanation).
In the Carrasco the dominant families are Caesalpiniaceae and Lauraceae, with Senegalia langsdorffii, Hymenaea eriogyne, and Manihot caerulescens among the most represented species (Ribeiro-Silva et al., 2012; Supplemental Table 1). The Caatinga is represented mainly by the families Fabaceae and Euphorbiaceae (Lemos and Meguro, 2015; Loiola et al., 2015; Supplemental Table 1).
Material and methods
Coring
Two sediment cores were collected in 2020 from the Mauritia swamps that today grow at the resurgence of the aquifers at ~ 700 m asl (Figures 1c and 2). The 170-cm core of Oasis Araripe (OAS-20; 7°13′52.69″S, 39°28′30.83″W, 737 m asl) was collected from the municipality of Crato, and the 130-cm core Chamu (CHA-20; 7°24′27.96″S, 39°12′10.40″W, 763 m asl) from the municipality of Missão Velha (Figure 1b), using a Russian corer. The sediment cores were transferred into PVC half-tubes and sealed in a plastic sheath for transport to the University of Montpellier, France. After performing the non-destructive analyses (X-ray Fluorescence; XRF), samples for radiocarbon dates were collected from along the cores (see below) and the cores were sliced every centimeter, with the samples kept in labeled plastic bags and stored at 4ºC.
Chronology, pollen, charcoal, and XRF scanning
A total of 11 samples from core OAS-20 and seven samples from core CHA-20 were extracted for radiocarbon dating by accelerator mass spectrometry (AMS) at the French Laboratoire de Mesure du Carbone 14 (LMC14). The age-depth models were built using the Bacon package (Blaauw and Christen, 2011), and ages were calibrated using the SHCal20 curve (Hogg et al., 2020).
For the macrocharcoal analyses, samples of 0.5 cm³ taken at 2 cm intervals were prepared using bases NaOCl and KOH for bleaching and a 160-µm mesh for sieving (Stevenson and Haberle, 2005). The charcoal particles were counted and measured under a stereoscope using WinSeedle software (Regent Instruments, Quebec, Canada). The results are expressed as particles accumulation (number of particles/cm²), surface area accumulation of CHARa (total area/cm²/year) and the average width/length (W/L) ratio. The W/L ratio is a measure of burnt vegetation, where W/L <0.5 indicates burnt grasses produced by large and intense fires in open grassland and W/L >0.5 indicates burnt woody material produced by forested ecosystems (Aleman et al., 2013; Haliuc et al., 2023).
For palynological analyses, samples of 0.5 cm³ were taken at 1 cm intervals and analyzed at 2 cm intervals using a combination of an acid-free protocol (Santos and Ledru, 2022) and standard techniques (Faegri and Iversen, 1989) to achieve better concentrations of the final residue using hydrofluoric acid when necessary to eliminate the remaining small silica particles. Two tablets of the exotic marker Lycopodium clavatum were added to the samples prior to chemical treatment, to calculate the pollen concentration (Stockmarr, 1971). At least 300 terrestrial pollen grains were counted, excluding aquatic and water level-related taxa. Pollen, spore and non-palynomorph percentages were calculated relative to the sum of terrestrial pollen sum. Pollen identification was carried out using the ISEM pollen reference collection, pollen atlases (Cassino and Meyer, 2011; Colinvaux et al., 1999; Escobar-Torrez et al., 2023a; Lorente et al., 2017) and an online database (Bush and Weng, 2007).
Graphics were built using Psimpoll, a pollen-diagram plotting software (Bennett, 2009), and zonation was based on hierarchical clustering using the CONISS method (Grimm, 1987).
The XRF core scanning was performed at a resolution of 0.5 cm at the Laboratoire EDYTEM Université Savoie Mont-Blanc – CNRS. Two runs were adjusted at 10 and 30 KV to measure the trace elements.
Results
Lithology
The sediment from core OAS-20 consisted of a laminated gray clay layer intercalated with sand and charcoal layers between 170 and 120 cm, and a brown organic clay layer between 120 and 20 cm. From 20 cm to the top there was a layer of vegetal fibers and roots, which was discarded. The sediment from CHA-20 consisted of fine grey organic clay intercalated with brown organic clay and black charcoal layers (Supplemental Figures 3–5).
Chronology
The age-depth model for core OAS-20 showed a hiatus between 138 and 125 cm, with an age of 5315 cal yr BP at the base of the core (Table 1 and Figure 3a). Pollen analyses indicated that the hiatus occurred at 128 cm (see for instance abrupt changes in Cuphea, Lindernia, Casearia on Supplemental Figure 6). Consequently, the results were considered in two parts, one for the bottom part of core OAS-20, representing the interval between 5300 and 4100 cal yr BP, and the other for the top of the core representing between 1100 and 0 cal yr BP.
Radiocarbon dates for core OAS-20, showing 14C calibrated BP ages (2σ ranges; Hogg et al., 2020).

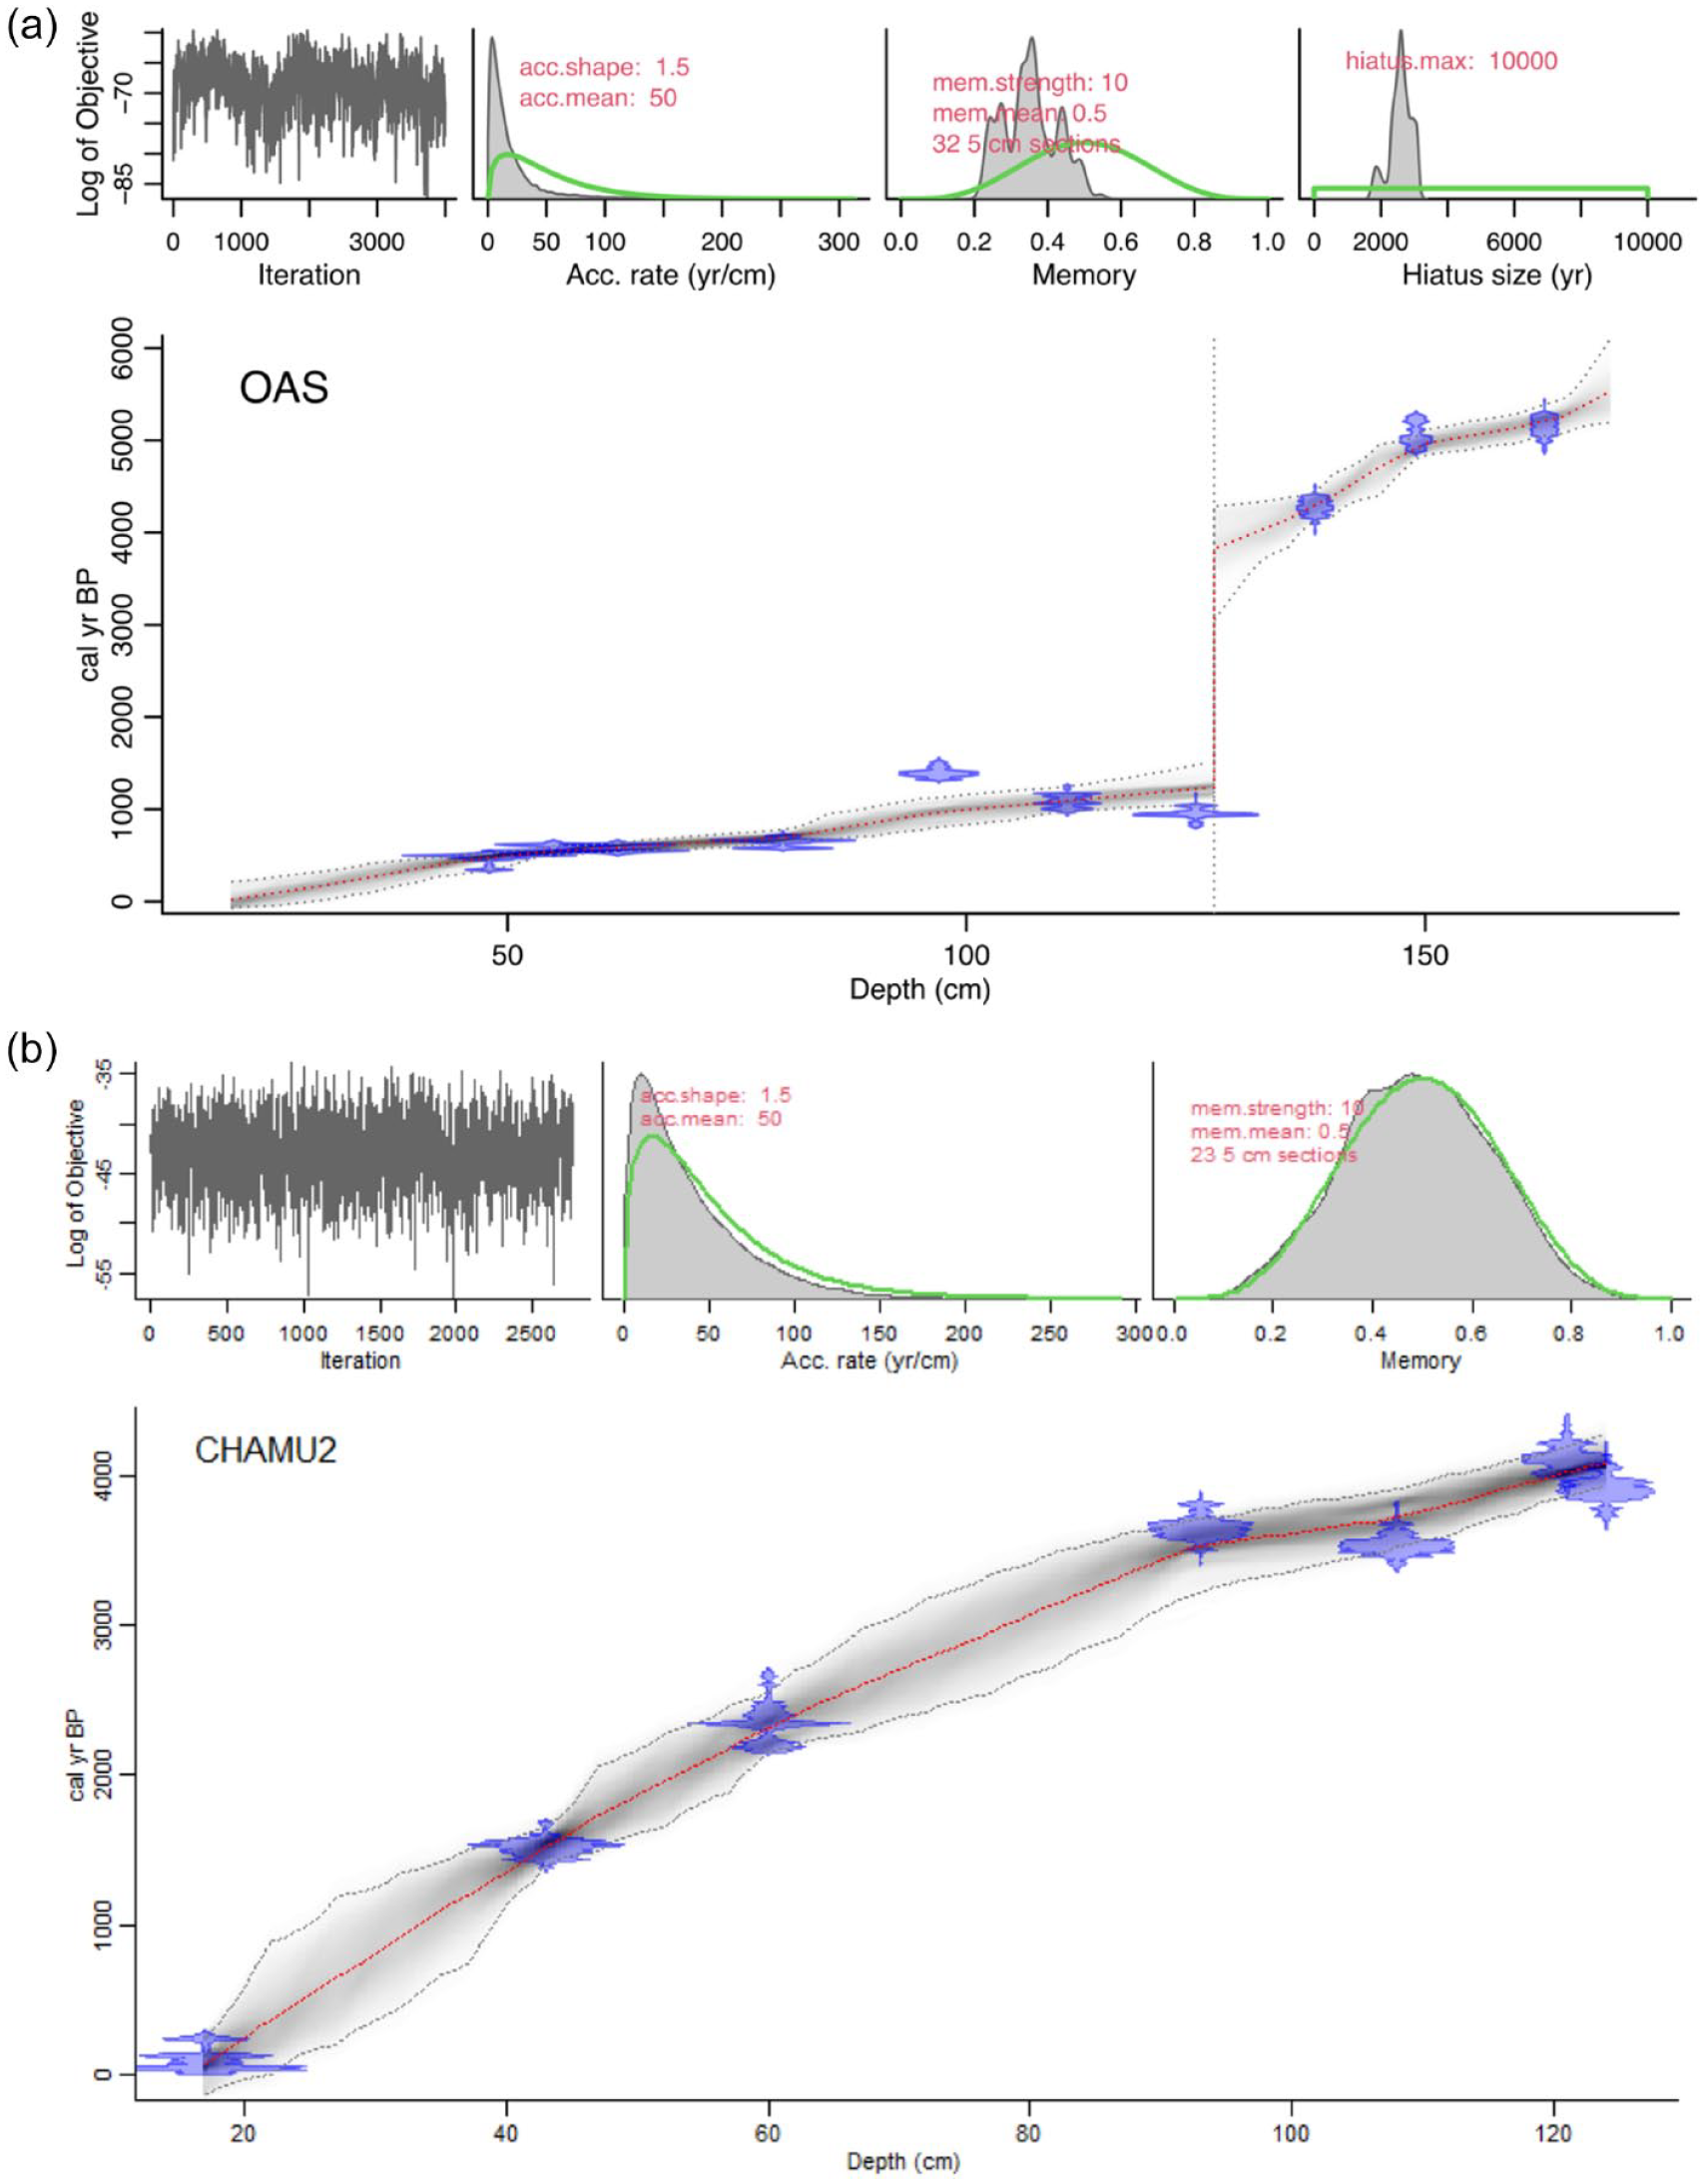
A Bacon age/depth model (red dashed line) for (a) core OAS-20 and core (b) CHA-20 overlaying the calibrated distributions of the individual radiocarbon dates (blue; see Tables 1 and 2) . Dark gray areas show the 95% confidence intervals of the models (Blaauw and Christen, 2011).
The base of core CHA-20 was dated to 4100 cal yr BP, with no observable gap in sedimentation (Table 2 and Figure 3b, Supplemental Figure 7).
Radiocarbon dates for core CHA-20, showing 14C calibrated BP ages (2σ ranges; Hogg et al., 2020).

XRF analyses
The Ti/Al ratio was used to represent the terrigenous input, which is closely related to energy transport, where high values are indicators of coarse particles deposition (Arnaud et al., 2012; Figures 4 and 5, and described within the pollen zones below). Other trace elements (Fe/Zr, K/Ti, Br/Ti, Si/Al, Ti/Ca) showed the same trends as Ti/Al and are represented in Supplemental Figures 10 and 11.
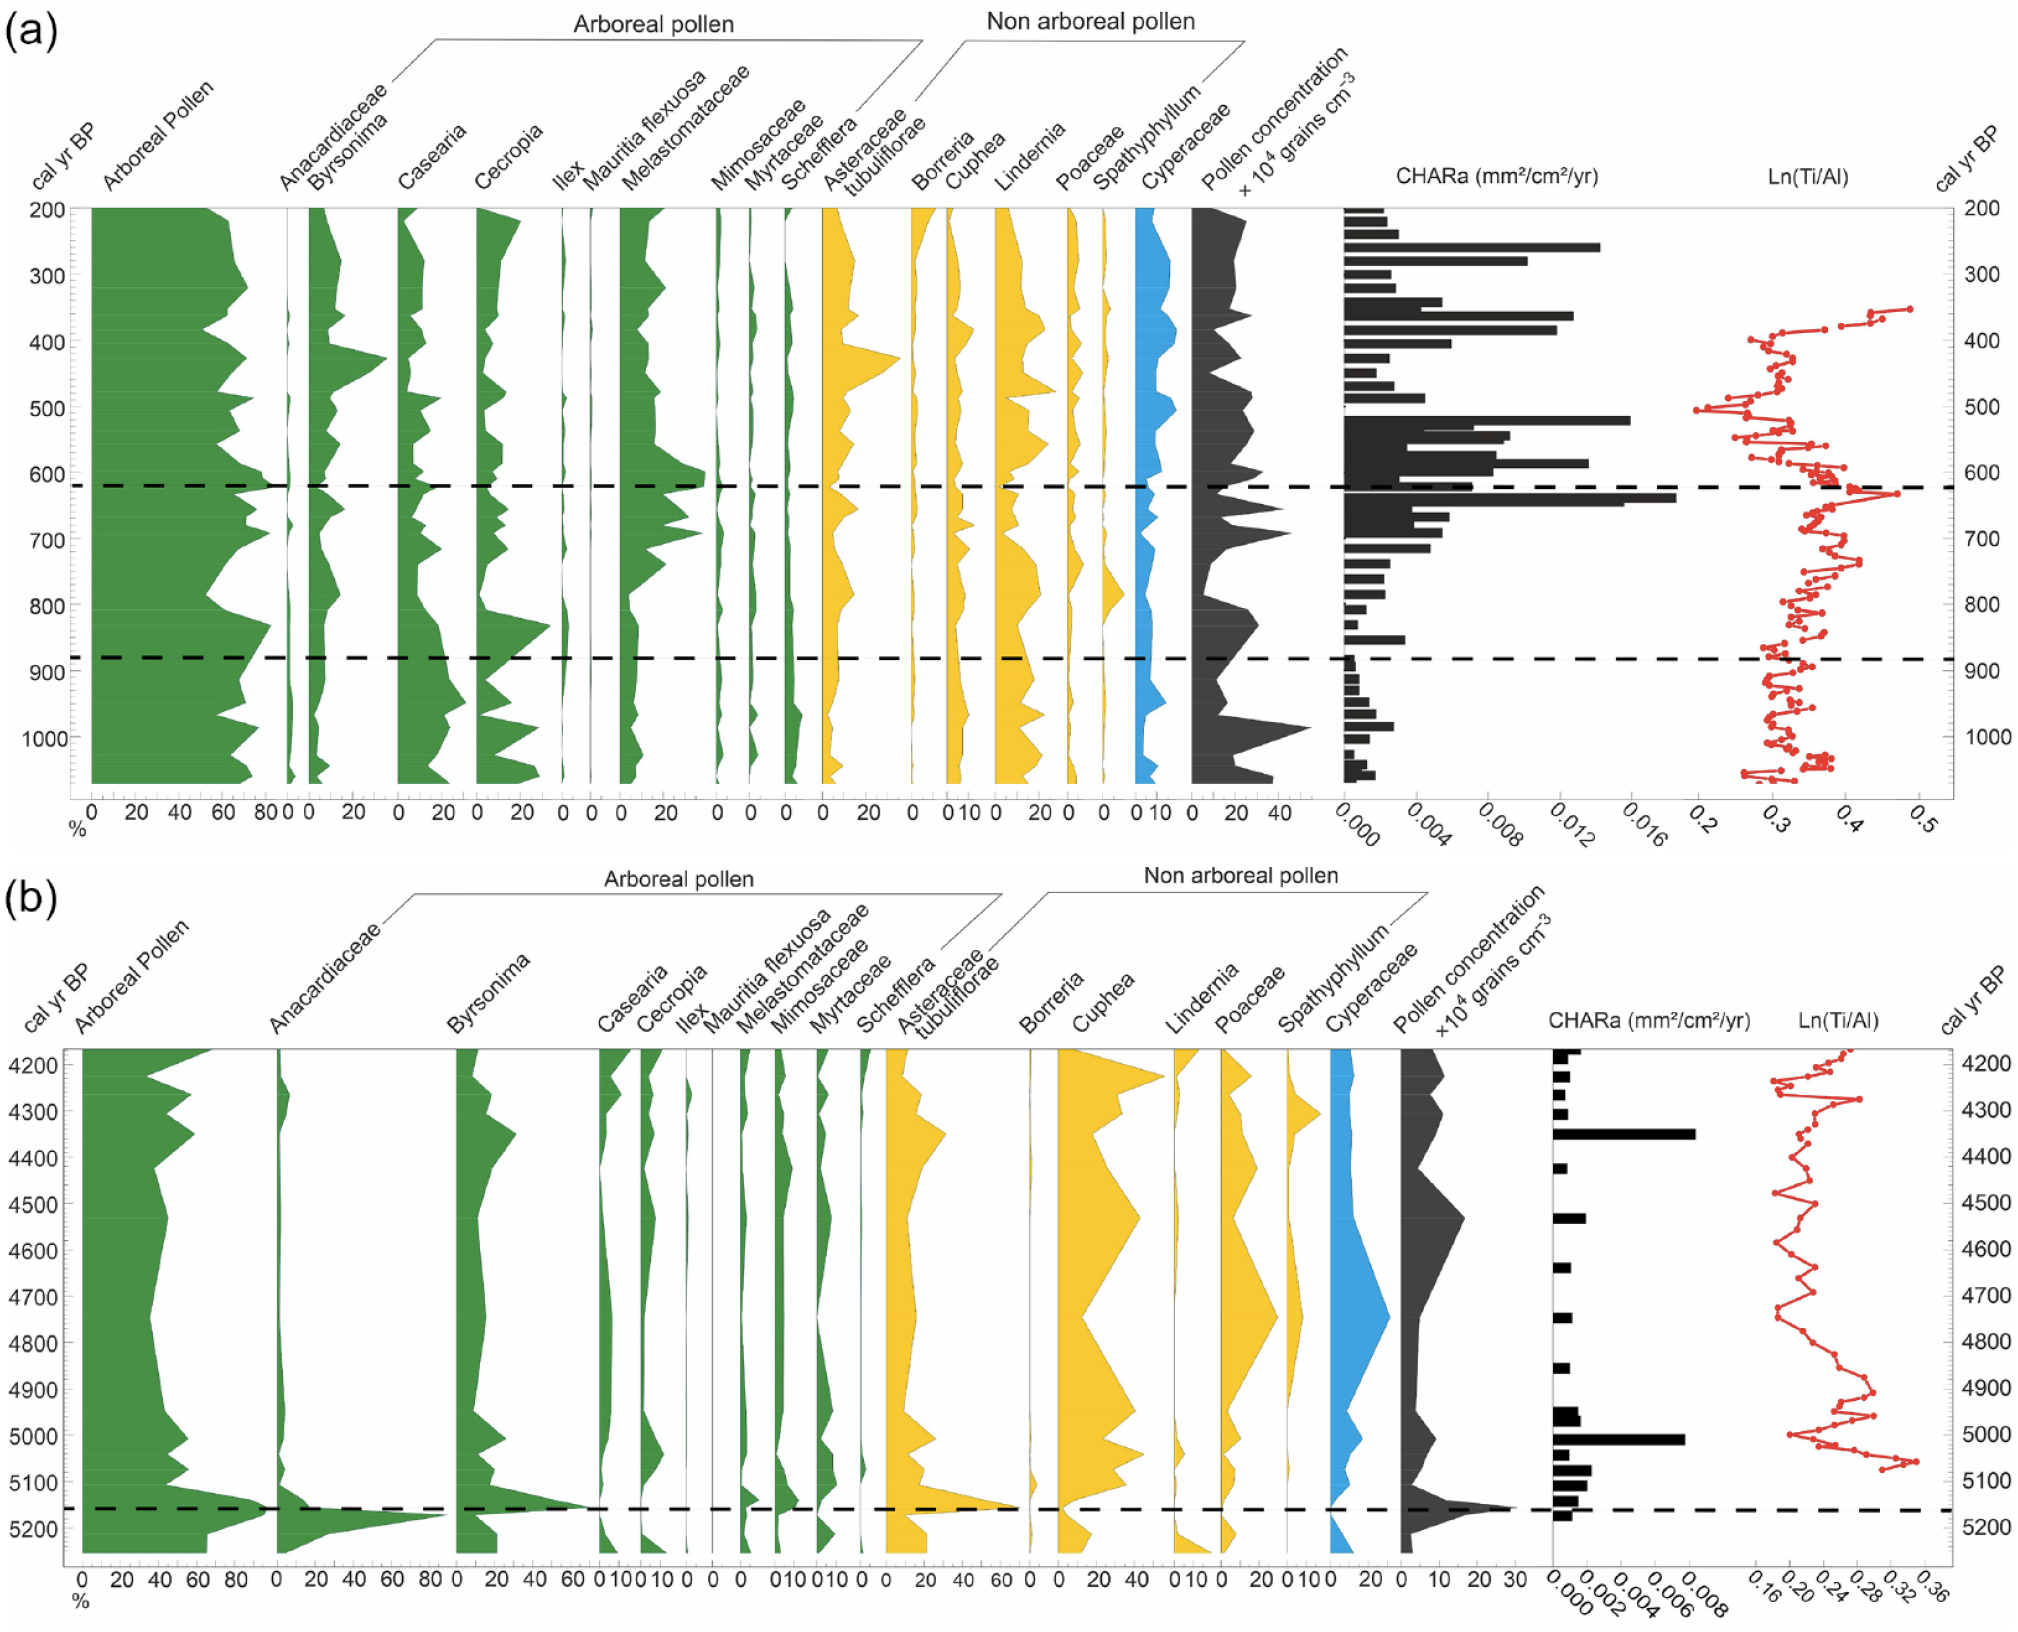
Synthetic diagrams for core OAS-20, showing arboreal pollen (AP) frequency, 17 indicator pollen taxa assigned to arboreal, non-arboreal and water level-related pollen, and geochemical trace element ratios and charcoal area influx (CHARa) represented along a time scale. (a) the time interval 1100–200 cal yr BP (b) the time interval 5300–4100 cal yr BP. Pollen zones are shown by a dashed line.

A synthetic diagram for core CHA-20, showing arboreal pollen (AP) frequency, 20 indicator pollen taxa assigned to arboreal, non-arboreal and water level-related pollen, and geochemical trace elements and charcoal area influx (CHARa) represented along a time scale. Pollen zones are shown by a dashed line.
Macrocharcoal analyses
For macrocharcoal analyses of core OAS-20, 74 samples distributed along 150 cm of the core were taken at 2 cm intervals between 20 and 170 cm. CHARa was smaller in the lower part of the core (5300–4200 cal yr BP, between 0 and 0.008 mm²/cm²/year) than in the upper part (1100–200 cal yr BP, between 0.001 and 0.016 mm²/cm²/year; Figure 4). The W/L ratio highlighted two different periods of charcoal particle presence with grass particles in the bottom section and some mixed fuel particles in the upper section (Supplemental Figure 8).
For core CHA-20, 65 samples distributed along the 130 cm were taken at 2 cm intervals. Macrocharcoal influx was low (<0.01 mm2/cm2/year) in the bottom section of the core, but was higher from 3400 cal yr BP (>0.01 mm2/cm2/year) onward (Figure 4). The W/L ratio shows a change from mixed fuel to woody particles at ~2000 cal yr BP (Supplemental Figure 9).
Pollen analyses
OAS-20 core
Fifty-five samples from 150 cm of core OAS-20 were taken at 2 cm intervals between 20 and 170 cm. The resolution of analysis represented on average 60 years per sample in the lower section, and 23 years per sample in the upper section. A total of 118 pollen and spore taxa were identified, comprising 78 arboreal pollen taxa, 28 non-arboreal pollen taxa, 2 water level-related taxa (Mauritia and Cyperaceae) from damp, moist or waterlogged soils), and 10 types of fern spore. The cluster analysis indicated five main intervals of vegetation changes (Supplemental Figure 5), based on the definition of pollen zones described below. The main results are represented along a depth scale and a time scale (Figure 4 and Supplemental Figure 6).
Pollen zone OAS-1 (167–161 cm, 5250–5140 cal yr BP, five samples)
Zone OAS-1 (Figure 4b) was characterized by a high frequency (77%) of arboreal pollen (AP), including Byrsonima (20%), Myracrodruon (15%), Mimosaceae (6%), Melastomataceae-Combretaceae (6%), Cecropia (3%), Myrtaceae (3%), and Casearia (3%). A relatively high frequency of non-arboreal pollen (NAP; 19%) included Cuphea (9%), Lindernia (5%), Poaceae (3%), and Asteraceae (2%). Soil moisture-related taxa were represented by Cyperaceae (100%). Charcoal influx was low (0.1 mm2/cm2/year).
Pollen zone OAS-2 (159–128 cm, 5110 –4170 cal yr BP, 12 samples)
Zone OAS-2 (Figure 4b) was characterized by a high frequency of NAP (49%) including Cuphea (29%), Poaceae (10%), Asteraceae (5%), Spathiphyllum (4%), and Lindernia (1%). A relatively high frequency of AP (39%) included Byrsonima (17%), Myrtaceae (5%), Cecropia (5%), Casearia (4%), Mimosaceae (3%), Melastomataceae-Combretaceae (2%), Myracrodruon (2%), and Schefflera (1%). Soil moisture-related taxa were represented by Cyperaceae (100%). Charcoal influx fluctuated between 0.8 and 0.06 mm2/cm2/year, with two peaks at 152 and 136 cm. Ti/Al levels fluctuated at the base and at the top of the zone.
Pollen zone OAS-3 (126–92 cm, 1100–830 cal yr BP, nine samples)
Zone OAS-3 (Figure 4a) was characterized by a high frequency of AP (63%) represented by Casearia (25%), Cecropia (21%), Byrsonima (7%), Melastomataceae-Combretaceae (8%), Schefflera (5%), Myrtaceae (2%), and Mimosaceae (2%). A relatively high frequency of NAP (29%) included Lindernia (18%), Cuphea (7%), Asteraceae (3%), Poaceae (2%), and Spathiphyllum (1%). Soil moisture-related taxa included Cyperaceae (99%) and, for the first time, the palm tree Mauritia (1%). Macrocharcoal influx ranged between 0.2 and 0.06 mm2/cm2/year. Ti/Al showed small fluctuations until the end of the zone.
Pollen zone OAS-4 (92–66 cm, 830–610 cal yr BP, 12 samples)
Zone OAS-4 (Figure 4a) was characterized by a high frequency of AP (65%) with Melastomataceae-Combretaceae (25%), Casearia (13%), Cecropia (11%), Byrsonima (10%), Myrtaceae (2%), Mimosaceae (2%), and Schefflera (2%). A relatively high frequency of NAP (27%) included Lindernia (12%), Cuphea (6%), Asteraceae (4%), Poaceae (3%), and Spathiphyllum (2%). Soil moisture-related taxa were represented by Cyperaceae (98%) and Mauritia (2%). Macrocharcoal influx increased progressively from 0.01 to 1.8 mm2/cm2/year then decreased at the end of the zone. Ti/Al was relatively stable throughout the zone, until a decrease at the end.
Pollen zone OAS-5 (64–20 cm, 600–200 cal yr BP, 17 samples)
Zone OAS-4 (Figure 4a) was characterized by a high frequency of AP (56%), including Melastomataceae-Combretaceae (18%), Byrsonima (14%), Casearia (10%), Cecropia (9%), Schefflera (2%), Myrtaceae (1%), and Mimosaceae (2%). NAP frequency reached 30% and included Lindernia (15%), Cuphea (5%), Asteraceae (5%), Poaceae (4%), and Spathiphyllum (1%). Soil moisture-related taxa were represented mainly by Cyperaceae (98%) and Mauritia (2%). Charcoal influx fluctuated between 0.1 and 1.5 mm2/cm2/year, with no charcoal at ~500 cal yr BP. Ti/Al decreased until the end of the zone, when the trend was inverted.
CHA-20 core
Fifty-seven samples from 118 cm of core CHA-20 were taken at 1 cm intervals between 10 and 128 cm, and were analyzed at 2 cm intervals. The resolution of analysis ranged between 57 and 15 years per sample. A total of 73 pollen taxa, two water level-related taxa (Cyperaceae, Iridaceae, and Xyris), 10 types of spore and 4 algae were identified. The cluster analysis indicated five main intervals of vegetation change (Supplemental Figure 7) based on the definition of pollen zones described below. The main results are represented along a time scale in Figure 5. One tree taxon, Astronium, was consistently well represented all along the record with frequency ranging between 2% and 10%.
Pollen zone CHA-1 (128–64 cm, 4090–2635 cal yr BP, 29 samples)
Zone CHA-1 (Figure 5) was characterized by 58% AP, with Ilex (5%) and Protium increasing at the end of the zone, Myrtaceae (1–3%) and absent between 94 and 78 cm (3600–2850 cal yr BP), and Cecropia (9%), Curatella (12%), Schefflera (7%). Among the NAP, Poaceae showed the highest frequency (14%), with Cuphea being well represented (7%) together with Asteraceae (20%) and Cyperaceae (7%). Macrocharcoal influx appeared in two stages, with a low influx of <0.01 mm2/cm2/year increasing to 0.04 mm2/cm2/year at the end of the zone. Trace elements also occurred in two stages, with low Ti/Al between 4100 and 3650 cal yr BP, and high Ti/Al between 3650 and 2635 cal yr BP. Ti/Al then abruptly decreased at the end of the zone.
Pollen zone CHA2 (62–50 cm, 2560–1870 cal yr BP, nine samples)
Zone CHA-2 (Figure 5) was characterized by high AP frequencies (66%), including Ilex (9%), Curatella (5%), Cecropia (7%), and Alchornea (2%) at the end of the zone. The NAP showed a sharp decrease in Poaceae (0%), and a decrease in Asteraceae (12%) and Cuphea (3%), compared with the previous zone, along with Cyperaceae (15%) and Spathiphyllum (6%). Macrocharcoal influx was low, ~0.004 mm2/cm2/year, at the beginning of the zone and increased up to 0.075 mm2/cm2/year at the end of the zone. After reaching a maximum at ~2400 cal yr BP, Ti/Al decreased progressively until reaching the lowest value of the record at 1890 cal yr BP, synchronous with a charcoal peak.
Pollen zone CHA3 (48–30 cm, 1780–800 cal yr BP, 10 samples)
Zone CHA-3 (Figure 5) was characterized by an increase of AP frequencies (84%) and the absence of Poaceae. Among the main tree taxa were observed Melastomataceae-Combretaceae (16%), Mauritia (2–11%), Ilex (18%), Alchornea (3%), Cecropia (12%), Shefflera (7%), and Mimosaceae (3%). NAP was represented by Asteraceae (4%) and Cyperaceae (2%). Macrocharcoal influx fluctuated between 0.05 and 0.2 mm2/cm2/year, with a peak of 3.5 mm2/cm2/year observed at 1038 cal yr BP. Ti/Al remained stable throughout the zone.
Pollen zone CHA4 (28–20 cm, 700–250 cal yr BP, five samples)
Zone CHA-4 (Figure 5) was characterized by a small decrease in AP (68%) and the absence of Poaceae. Curatella (10%), Ilex (6%), Protium (4%), and Mauritia (17%) were well represented within the AP taxa and Borreria (2%) in the NAP. Macrocharcoal influx was high, ranging between 0.01 and 0.03 mm2/cm2/year, and decreasing to 0.003 mm2/cm2/year at the end of the zone. Ti/Al levels fluctuated.
Pollen zone CHA5 (18–10 cm, 125–0 cal yr BP, five samples)
Zone CHA-5 (Figure 5) was characterized by a disappearance of Protium and a decrease in Mauritia (9%), while Cecropia (3%), Melastomataceae-Combretaceae (6%), Ilex (1%), and Astronium (3%) were well represented. NAP included Asteraceae (7%), and an increase in Spathiphyllum (15%), Poaceae (11%), Borreria (4%), Cuphea (3%), and Cyperaceae (4%). Macrocharcoal influx was low, at 0.003 mm2/cm2/year. Ti/Al increased sharply.
Interpretation and discussion
Vegetation changes in the region of Araripe
With OAS-20 representing the time intervals 5300–4100 cal yr BP and 1100 cal yr BP to present and CHA-20 the interval from 4100 to present, thus covering the hiatus of OAS-20, we reconstructed regional changes in vegetation and fire for the last 5300 years (Figure 6). Differences in the expression of the vegetation between the two cores for the last 1000 years (the only common interval between the two cores), with higher Casearia in OAS-20 and higher Curatella in CHA-20s, can probably be explained by their respective locations, with OAS collected in a more humid area (Supplemental Figure 2) and a steeper slope than CHA. For the last 1000 years, our high temporal resolution allowed to compare our changes in vegetation and fire with the climate changes observed by speleothems.
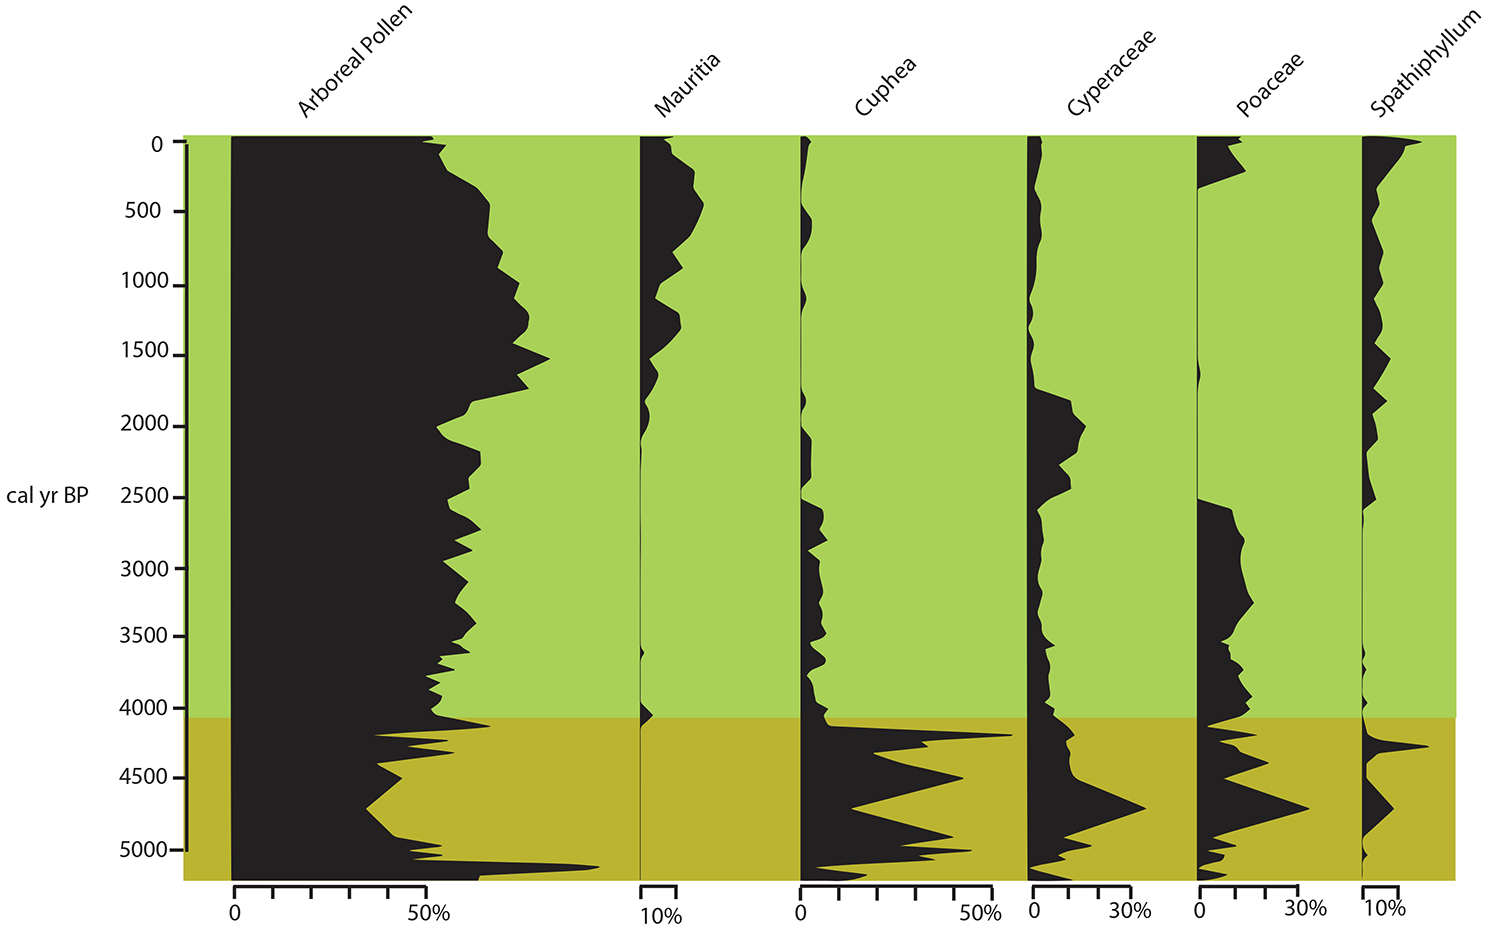
Changes in vegetation at Araripe over the last 5300 years, as reconstructed from changes in arboreal pollen and five indicator taxa from cores OAS-20 (yellow horizontal band between 5300 and 4100 cal yr BP) and CHA-20 (green horizontal band from 4100 cal yr BP to modern).
Between 5300 and 4100 cal yr BP, the landscape was open, with a dominance of Poaceae, Cuphea, and Asteraceae-Tubuliflorae. Cuphea is commonly observed today on lake margins around Caatinga or Cerrado (Ledru et al., 2020; Matias et al., 2021). The tree cover was mainly represented by Byrsonima, Myrtaceae, and Piptadenia (Mimosaceae), species commonly observed today in the Cerrado, Carrasco and Araripe Oasis reserve (Supplemental Table; Benício et al., 2023; Costa and Araújo, 2007). However, their low frequency and concentration suggest that the tree cover was probably scarce and that the area around the aquifer was likely covered by a herbaceous layer including Poaceae, Cuphea, and Cyperaceae (see Figure 2). During this interval, fire activity was low, increasing progressively until ~4300 cal yr BP. The charcoal peak at 4300 BP is synchronous with a peak in coarse deposition (Ti/Al; Figure 4b) which could be due to a single local event.
The hiatus observed in OAS-20 is dated to ~4200 cal yr BP, when a severe drought was observed from western to eastern NEB (Montade et al., 2014; Xavier et al., 2024). CHA-20 sedimentation started at 4100 cal yr BP, and the vegetation represented after the 4200 cal yr BP drought was characterized by tree taxa such as Astronium, Cecropia, Schefflera, and Curatella, and, among the herbs Asteraceae-Tubuliflorae, Cuphea, Poaceae, which suggest a more open landscape with sparse trees of a cerrado until 2700 cal yr BP. Indeed, the tree composition, the persistence of Cuphea and the absence of Spathiphyllum suggest a dry cerrado similar to the lowland cerrado observed in the region today (Calixto-Júnior et al., 2021), with lower-than-today water levels in the aquifers.
A peak in fire activity was observed between 2700 and 2600 cal yr BP, synchronous with an erosive event (Ti/Al; Figure 5). The peak could represent a single event with a sudden accumulation of sediment. The interval from 2700 to 2000 cal yr BP was characterized by a change to more humid conditions, with the dry herbaceous layer (Cuphea, Poaceae) being replaced by Cyperaceae and the expansion of Mauritia and Ilex (Figure 5). The largest peak in fire activity was observed at 2000 cal yr BP and was also synchronous with an erosive event (Ti/Al; Figure 5). This episode occurred during a gradual change in W/L from a mixed fuel particles toward the dominance of woody particles thus suggesting a sharp change in the landscape.
Between 2000 and 1500 cal yr BP there was a dominance of the moist forest with Alchornea and Ilex, two indicator taxa for Cerrado gallery forest (Escobar-Torrez et al., 2023b). While at 1500 cal yr BP the dominance of the swamp palm tree Mauritia and the herbaceous Spathiphyllum, indicates the installation of humid conditions at the coring sites. Spathiphyllum is commonly observed in gallery forest on the river banks (Matias et al., 2021), which in our study area is represented by the aquifer environment.
From 2000 to 1500 cal yr BP the expansion of the moist forest was synchronous with high fire activity, probably the result of local human settlements and activities.
From ~1000 cal yr BP until the last two centuries, Mauritia was well represented at Araripe, together with Ilex and Melastomataceae-Combretaceae in both records, and Casearia in OAS-20, suggesting more humid conditions and higher soil moisture levels. However, this humid interval was interrupted by a drier episode that started at ~900 cal yr BP, including an erosive event indicated by Ti/Al ( and Supplemental Figure 10) followed by an increase in the pioneer taxa Cecropia at ~850–800 cal yr BP, with a decrease in regional tree taxa. After 800 cal yr BP, the return of higher moisture levels and high fire activity until ~600 cal yr BP, was observed in both records (Figs 4A and 7). During the last 200 cal yr BP, a decrease in tree taxa including the palm tree Mauritia flexuosa, and the re-expansion of Poaceae and an increase in macrocharcoal particles (Figures 6 and 7), can be attributed to an increase in human activities in the Araripe Basin (see below).
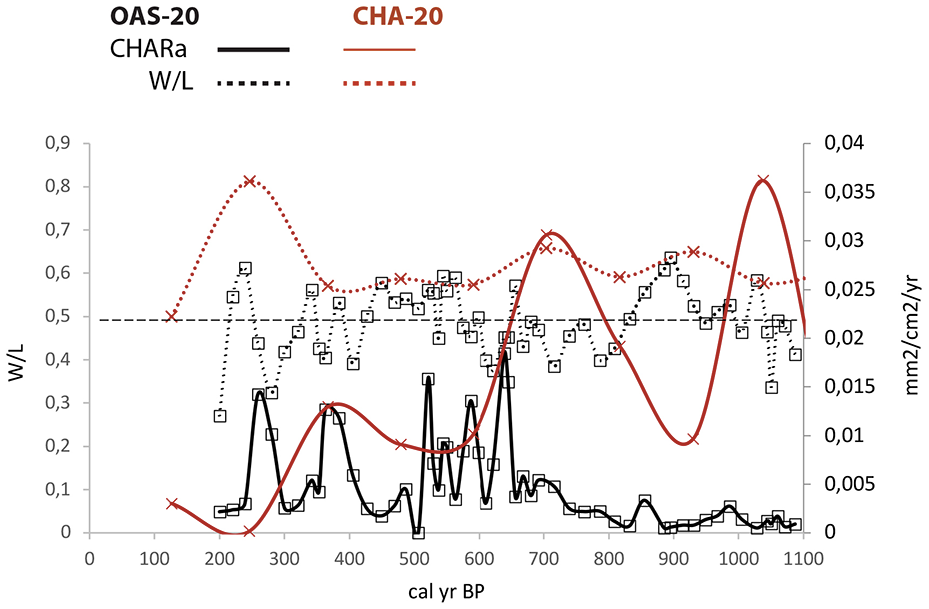
Fire activity at Araripe during the last 1100 years, from cores CHA-20 to OAS-20, based on charcoal influx (CHARa) and the width/length ratio (W/L). The dashed horizontal line shows the 0.5 division used for W/L (see Methods).
Our high temporal resolution results highlight the vulnerability of Mauritia in particular, and headwater forest taxa in general, which require permanent edaphic moisture absent during the dry episodes when aquifer water recharge was probably lower.
Climatic implications
Between 5300 and 4200 cal yr BP, the presence of a dry open vegetation at Araripe was anti-phased with the installation of more moist conditions in western NEB (Xavier et al., 2024) and in central Brazil (Escobar Torrez et al., 2023b), when monsoon activity became more intense (Novello et al., 2017). The absence of speleothem deposition at Apodi between 4000 and 3600 cal yr BP was associated with low rainfall, and a dry climate prevailed during the last 4000 years compared with the interval before 5000 years ago (Utida et al., 2019). At Araripe, between 4000 and 3000 cal yr BP, the persistence of dry climatic conditions is in agreement with the pollen record from Maranguape, a moist forest refugium ~500 km north of Araripe (Figure 1b), which showed a drier interval than today from ~5300 to 4200 cal yr BP, and the return of wetter conditions after 3500 cal yr BP (Montade et al., 2014). Thus, the persistence of dry climatic conditions at Araripe after 4000 years suggests that it is located outside the core monsoon domain that reached western NEB during the Holocene (Novello et al., 2017).
Headwater forest taxa started to expand after 3000 cal yr BP suggesting moister conditions in the aquifer than during the previous interval, as also indicated by the Ti/Al ratio (Figure 5 and Supplemental Figure 11), although still drier than during the early-mid-Holocene. At the same time, Maranguape and Apodi records (Figure 1b) showed a return of the forest and an increase in soil production (Montade et al., 2014; Utida et al., 2019). The full expansion of the palm tree Mauritia was observed after ~2000 cal yr BP suggesting that the water resource from the aquifer was reduced until at least 2700 cal yr BP. From 3000 cal yr BP onward, the NEB climate shows a dichotomy, with a change from wetter to drier conditions in eastern NEB (Utida et al., 2020), and from drier to wetter conditions in western NEB (Xavier et al., 2024). Our results show that Araripe’s climatic evolution synchronized with eastern Brazil, with a wetter pre-4200 year event (de Lima et al., 2021) and a drier climate since then, under the influence of the SASD, winter trade winds and northward cold air incursions (Wainer et al., 2021; Wainer and Venegas, 2002).
During the last 1000 years, our high temporal resolution records showed no major changes in the vegetation cover have been observed, suggesting that the aquifer was stable. However, changes in trace elements (Figures 4a and 5) suggest four main variations in the precipitation regime. The first interval, between 1100 and 1000 cal yr BP, is characterized by a high Ti/Al ratio, associated with an increase in coarse sediment and irregular rainfalls. The second interval, between 1000 and 900 cal yr BP, is characterized by a low Ti/Al ratio, associated with fine material and regular rainfall. During the third interval, between 900 and ~500 cal yr BP, the highest Ti/Al ratio in the last 1000 years was seen, with two sharp decreases at 760 cal yr BP and at 600 cal yr BP, corresponding with the dry interval seen at 700–500 cal yr BP at Lake Boqueirão (Utida et al., 2019) and Sete Cidades (Xavier et al., 2022). During this interval an increase in Curatella, a tree taxon of the dry cerrado at Araripe (Calixto-Júnior et al., 2021), was observed. Finally, in the fourth interval, between 500 and 350 cal yr BP, the Ti/Al ratio was lower than in the previous interval, in agreement with a relatively humid phase seen at Lake Boqueirão (Utida et al., 2019) and at Sete Cidades (Xavier et al., 2022). In conclusion, the high temporal resolution rainfall variability reconstructed at Araripe for the last 1000 years is in agreement with the results obtained by isotope records and showed an in-phase with the other eastern NEB paleo records.
Fire activity and human impacts
Fire activity at Araripe is similar to other NEB charcoal records deposited in sediment (de Moraes et al., 2020; Oliveira et al., 1999; Xavier et al., 2024; Figure 1b), with a low influx interrupted by abrupt peaks. The relatively weak fire activity observed in our records is probably related to low ignition (Haliuc et al., 2023). In the earliest part of the OAS-20 record the W/L values <0.5 likely characterize the limited availability of fuel in the herbaceous vegetation and the distance between the site and the source of fuel. During the last 4000 years, a dominance of mixed fuel particles is associated to different vegetation and probably some nearby human activity (Haliuc et al., 2023; Supplemental Figures 8 and 9). The frequency of natural fire regimens is directly related to climate seasonality, and the vegetation type, density and biomass available as a fuel source (Gomes et al., 2018; Pivello et al., 2021). In the Cerrado, natural burnings occur during the transition from dry to wet seasons, ignited by lightning (Ramos-Neto and Pivello, 2000). The OAS and CHA records showed no increase in CHARa during periods of increased humidity, as for example, at 2700 cal yr BP in CHA-20, where, in contrast, a strong decrease in fire activity was observed (Supplemental Figure 9); or at ~1800 cal yr BP, when a peak in charcoal was associated with erosive conditions and the forest expansion (Figures 5 and 6 and Supplemental Figure 11). Thus, charcoal peaks at Araripe are inferred to relate to human activity rather than local natural fire.
During the last 1100 years, the OAS and CHA records show an out-of-phase signal in fire activity, with a higher influx before 650 cal yr BP in CHA-20 and after 650 cal yr BP in OAS-20 (Figure 7). The last 1100 years are characterized by the presence of the evergreen forest, suggesting that moisture rates were higher than before. In humid forests, natural fires are rare because the high moisture content in the soil and vegetation prevents the biomass burning (Pivello et al., 2021). Thus, the high fire activity observed in our records during the moist phase showed two kinds of origin. First, fires that originated at a distance from our sites, as, for example, the peak observed in the CHA-20 record at 2000 cal yr BP is associated with mixed fuel particles (Figure 5 and Supplemental Figure 9). Second, fires were locally anthropogenic in character, as, for example, with the absence of a peak in OAS-20 between 500 and 400 cal yr BP associated with woody particles (Figure 7).
In NEB, the presence of humans dates back 30,000 years (Gruhn, 2020; Guidon et al., 1994), and was almost continuous until the mid-Holocene (Bueno, 2011; Herzog, 2017; Lahaye et al., 2015). In the region of Araripe, human settlements relating to Macro-Gê language family, the Kariri group, were recorded during the Late-Holocene (Gregorio de Souza et al., 2020) until ~340 cal yr BP (1610 AD; Martin, 2013). The date of 1610 AD could correspond to European arrival also linked to a sharp change in fire activity observed at both sites between 1350 and 1650 AD (650 and 450 cal yr BP on Figure 7). Although archeological information is far too scarce, we suggest that the presence of a water source in the middle of a semi-arid region would have been very attractive for human settlements (Lima-Verde, 2015). Consequently, the observed peaks in macrocharcoal probably relate to an increase in human activities during the last 1100 years at Araripe, with different occupations represented at the two sites.
After 1700 AD, European incursions were seen in the Araripe region, as stockbreeders from the east, searching for new pastures and water resources, started to trade with the native Kariri (Pompeu-Sobrinho, 1956). In the early 1900s, thanks to this exceptional permanent water resource, farmers were able to cultivate sugarcane crops intensively in the middle of the semi-arid, until a decline in the second half of the 20th century (Menezes, 2007). From the 1970s onward, the abundant and easily accessible water allowed growth of urbanization at Araripe, comprising the cities of Crato, Juazeiro do Norte and Barbalha, is notorious in the context of semi-arid socioeconomic development, popularly known as the “sertão” (Queiroz et al., 2017).
Today, in arid and semiarid areas managed aquifer recharge (MAR) is often promoted as a solution to water scarcity (Dillon et al., 2022). MAR usually consists in exploiting existing underground storage and negating evaporation losses or climatic changes (Dillon et al., 2022). Our results show that the vegetation is also affected by the changes in the groundwater recharge that strongly relates to rainfall with a percolation time of 180 years for the western region of the plateau and inversely, that this resurgence water also depends on the conservation of the vegetation cover at the plateau. Thus, we show that in a context of recurrent drought, higher temperature and higher evaporation, increasing demand for water for domestic and agricultural consumption, the time of lack of water might come soon, putting a critical threat to the current policies.
Conclusion
Our study highlights the effects of drought and human activity on the diversity and composition of forests and on the water resources of aquifers in Araripe during the last 5300 years. Late-Holocene regional changes at Araripe are in phase with eastern NEB climatic pattern with the persistence of drier-than-today climatic conditions after 4000 cal yr BP. The implications of our results are twofold: first, the regional vegetation is associated with global climate changes, for example, the tree taxon Curatella, as an indicator of dry climatic conditions, persisted after the end of the 4200 cal yr BP drought; second, local vegetation at a resurgence for example, headwater forest taxa, provides an indication of aquifer activity. The aquifers are tightly linked with the mean annual precipitation over the plateau of Araripe, and the current water abundance is a result of the moist phase that has prevailed over the last few centuries. However, with a time lag of ~180 years, along with the projected decreasing of the mean annual rainfall, the amount of water in the aquifers will decrease in the future, thus posing a threat to the water resources. Public policies put in place during the last decade need to be discussed and re-evaluated in the light of our results to ensure future water availability.
Supplemental Material
sj-docx-1-hol-10.1177_09596836241266407 – Supplemental material for Late-Holocene changes in vegetation and fire within a forest refuge in the Araripe region, northeastern Brazil
Supplemental material, sj-docx-1-hol-10.1177_09596836241266407 for Late-Holocene changes in vegetation and fire within a forest refuge in the Araripe region, northeastern Brazil by Maria Daniely Freire Guerra, Marie-Pierre Ledru, Sergio Augusto Santos Xavier, Rudney de Almeida Santos and Francisca Soares de Araújo in The Holocene
Footnotes
Acknowledgements
MDFG is grateful to the “Universidade Regional do Cariri” (URCA) for support and to the “Institut des Sciences de l’Évolution de Montpellier” (ISEM) for hosting her post-doctoral research. We thank the Reserva Particular do Patromônio Natural (RPPN) Oásis Araripe/Aquasis for permission to collect a sediment core, Jean-François Mas for his assistance during field work, Auriane Mousnier (Master 1 CEPAGE University of Montpellier) for the macrocharcoal analyses of core CHA-20, Sandrine Canal (ISEM) for the macrocharcoal analyses of core OAS-20, and Vivien Mai-Yung-Sen (EDYTEM University of Savoie) for assistance with the XRF scans of the cores.
Author contributions
Funding
The author(s) disclosed receipt of the following financial support for the research, authorship, and/or publication of this article: This research is part of the projects ANR TASAB “What can a Territory do in the face of the Global Anthropocene Crisis? Socio-environmental Dynamics in the Brazilian Semi-arid” (ANR-22-), and the project JEAI “Le Semi-Aride du Nordeste brésilien à l’Anthropocène” (SANA) at IRD and FUNCAP. It has been funded by the Brazilian National Council of Scientific and Technological Development (CNPq; grant no 465767/2014-1), the Brazilian Coordination for the Improvement of Higher Education Personnel (CAPES; grant no 23038.000776/2017-54), and the State of Bahia Research Support Foundation (FAPESB; grant no INC0006/2019), the support to the National Institute of Science and Technology in Interdisciplinary and Transdisciplinary Studies in Ecology and Evolution (INCT IN-TREE), and the Brazilian Council for Scientific and Technological Development (CNPq) for FSA.

Supplemental material
Supplemental material for this article is available online.
References
Supplementary Material
Please find the following supplemental material available below.
For Open Access articles published under a Creative Commons License, all supplemental material carries the same license as the article it is associated with.
For non-Open Access articles published, all supplemental material carries a non-exclusive license, and permission requests for re-use of supplemental material or any part of supplemental material shall be sent directly to the copyright owner as specified in the copyright notice associated with the article.
