
Abstract
The Mediterranean calcareous red alga Lithophyllum byssoides forms thick bioconstructions in the intertidal zone, developing in a very narrow vertical range (ca. 20 cm), making it an exceptionally precise indicator of past sea-level positions. This high sensitivity to even minimal sea-level fluctuations enables the detection of high-frequency, low-amplitude changes that occurred over the last 1000 years. The Late-Holocene relative sea-level curve presented here, is based on L. byssoides rims extensively encrusting the swell-exposed rocky shores of the Mesozoic limestone cliffs of northwestern Sardinia (NW Mediterranean). The rim accretion structures reveal the in situ superposition of multiple generations of L. byssoides thalli, which bind sand-sized clasts. Combined AMS radiocarbon dating identifies four main growth phases, each bounded by distinct erosional surfaces. These phases correlate with stages of relative sea-level rise and coincide with the warmest periods of the last millenium. In contrast, erosional surfaces frequently draped by a reddish muddy matrix indicate sea-level drops associated with the coldest phases of the Little Ice Age. Our findings indicate decimetric relative sea-level fluctuations on sub-centennial timescales, which significantly exceed the average magnitude of sea-level change documented over the last millenium, implying major shifts in coastal dynamics and ecosystems. These results support a strong link between sub-centennial climate variability and sea-level fluctuations and underscore the value of L. byssoides rims as high-resolution archives of past sea-level oscillations.
Keywords
Introduction
Future projections of ongoing global warming and sea-level rise forecast significant socio-economic impacts, particularly for populations living in low-lying coastal areas (e.g. Calvin et al., 2023). To better guide adaptation strategies, current trends must be placed within the context of high-resolution past variability. Reconstructing proxy-based sub-centennial sea-level fluctuations over the last millennium and into the current Industrial Era (IE) is therefore a key task for sea-level rise modeling efforts (e.g. Blanfuné et al., 2023; Mariotti et al., 2002; Onac et al., 2022; Roberts et al., 2010). The Holocene, the current interglacial (Marine Isotopic Stage 1, MIS 1), reached its climatic optimum, known as the Mid-Holocene Climatic Optimum (MHCO), around 6.8 ka, when global temperatures were similar to or slightly higher than present levels (Davis et al., 2003; Mann, 2002; Perry and Hsu, 2000). During the early Holocene, global mean sea level rose at approximately 1 cm/yr until the MHCO, after which slowed to a few millimeters per year. This reduced rate persisted until the onset of the Industrial Era (IE; post-1850 AD), when it began to accelerate again (Calvin et al., 2023; Grant et al., 2012; Lambeck, 2004; Lambeck et al., 2011; Vacchi et al., 2021). However, focusing on average rates can obscure rapid (sub-centennial) relative sea-level fluctuations linked to warm–cold and/or wet-dry climate oscillations. Over the last millennium, three main climatic periods with increasing human impacts over time have been recognized: (i) the warm Medieval Climate Anomaly (MCA; AD 900–1250); (ii) the Little Ice Age (LIA; AD 1250–1850), which encompasses four solar minima of sunspot activity—Wolf (AD 1275–1300), Spörer (AD 1460–1550), Maunder (AD 1645–1715) and Dalton (AD 1790–1830)—characterized by temperature drops of up to 1°C in the Northern Hemisphere (Perry and Hsu, 2000; Stranne et al., 2014; Wanner et al., 2022) and (iii) the current warm phase known as the Industrial Era (IE) since AD 1860. Moreover, several oceanographic model- and proxy-based global sea-level reconstructions (Church et al., 2001; Gregory et al., 2006; Jevrejeva et al., 2008; Kemp et al., 2011; Kopp et al., 2016; Rahmstorf, 2007) suggest that short-term climatic warming and cooling phases can drive the thermal expansion and contraction of seawater, thereby contributing to sea-level changes, along with a smaller contribution from the loss of glacial and ice cap mass. These processes can produce rapid (sub-centennial-scale) and low-amplitude (decimeter-scale) fluctuations in sea level. However, such low-amplitude sea-level changes are often hidden in the Holocene sedimentary record and require extremely precise sea-level markers to detect them (Vacchi et al., 2016).
Among the most sensitive and reliable sea-level indicators are intertidal bioconstructions formed by the calcareous red alga Lithophyllum byssoides (Lamarck) Foslie (Corallinales, Rhodophyta). This species forms an algal rim-shaped structure that grows within a very narrow intertidal vertical range (~20 cm above mean sea level) and is widely recognized as a very precise sea-level marker in the Mediterranean region (Adey, 1986; Faivre et al., 2013, 2019a, 2023, 2024; Laborel et al., 1987; Morhange et al., 1992; Sechi et al., 2020; Vacchi et al., 2016, 2021).
This study documents sub-centennial relative sea-level fluctuations during the last millenium, as recorded by L. byssoides rims along the rocky coasts of northwestern Sardinia. Specific questions addressed include: (i) the amplitude of eustatic changes, (ii) the definition of algal rim accumulation rates and (iii) comparison with available sea-level curves.
Geological setting and study area
Sardinia is the second-largest island in the western Mediterranean Sea, extending from 38° to 41° N and from 8° to 10° E (Figure 1(a)). The Oligocene–early Miocene eastward migration of the Apennines subduction zone induced a major rifting phase in the Corsica–Sardinia lithospheric block, which drifted eastward from the Provençal–Catalan margin of Europe to its present position in the central western Mediterranean Sea, in conjunction with the opening of the Liguro-Provençal Basin (Figure 1(a); Doglioni et al., 1998). Following this tectonic phase, Sardinia experienced widespread volcanic activity, which ceased in the late Pleistocene (~140 ka). Today, the island is considered a semi-stable continental block, characterized by low seismicity and slow regional uplift (Carmignani et al., 2016). Nevertheless, geomorphic and structural evidence indicates late Pleistocene to Holocene moderate tectonic activity, primarily linked to the reactivation of normal faults (e.g. Casini et al., 2020; Cocco et al., 2019; Sechi et al., 2020). The northwestern coast of Sardinia exposes a bedrock mainly composed of Mesozoic limestones and dolostones, locally underlain by Permo-Triassic quartz-rich sandstones and conglomerates (“red beds”) and Oligo-Miocene volcanic bodies. These lithologies form the prominent coastal cliffs of the area.

Capo Caccia study area. (a) Geomorphological map of the area of Capo Caccia, maps report the areal distribution of L. Byssoide rims along the coast, mainly encrusting sea-facing plunging cliff. The Quaternary deposits mantle the low-elevation area. N1 and O1 highlight the sampling area. Diamond symbol reports the location of the main Spanish quarries. (b) Location of Sardinia in the western Mediterranean area. (c, and d) Detail of the coast morphology for the two sampling areas (N1, O1) and bathymetric contour lines. Arrows highlight the direction of the main blowing wind, Mistral (NW) and sea swell.
Unconformably overlying them is a discontinuous Quaternary succession, ranging from shallow-marine to aeolian deposits spanning from MIS 5e (135–116 ka) to MIS 3 (57–29 ka; Andreucci et al., 2010, 2012; Pascucci et al., 2014; Sechi et al., 2020; Zucca et al., 2014). Notably, Sechi et al. (2020) documented a meter-thick Lithophyllum byssoides algal ridge bioconstruction within the Late Pleistocene marine sequence along the Northwest coast of the island. This feature, developed directly on pre-Quaternary bedrock and dated to the Last Interglacial (MIS 5e), represents the first known evidence of thick bioconstruction formation during this interval on the Sardinian coast. In addition, extensive coastal quarries carved into Pleistocene aeolianites during the Spanish colonial period (15th–17th centuries) provide further stratigraphic exposures and sea-level constraints during the last millennium (Pascucci et al., 2019; Figure 1(b)).
The Mediterranean Sea is microtidal, with an average tidal range of approximately 35 cm (Longhitano, 2011; Pascucci et al., 2019). A wave buoy located just north of Capo Caccia (ISPRA; Mareografo.it), records dominant winds from the northwest (called Mistral in Sardinia). These winds can exceed 80 km/h during storm events, generating wave heights of up to ~7 m and wave periods ranging from 2 to 13 s. The main study area, the peninsula of Capo Caccia (northwestern Sardinia, Italy), is characterized by high, steep Mesozoic limestone cliffs plunging into the sea (Figure 1(b)). These cliffs delimit small embayments and pocket beaches, which are primarily fed by bioclastic sediments derived from nearby Posidonia oceanica meadows (Andreucci et al., 2023).
Materials and methods
Sampling, structure analysis and dating
The areal distribution of Lithophyllum byssoides rims was surveyed by kayak between March and October 2023 along approximately 24 km of coastline around the Capo Caccia peninsula (Figures 1 and 2(a)). Sampling focused on two main sites, O1 and N1, which are located in areas less exposed to hydrodynamic effects caused by the interaction between wave action and cliff morphology (Figures 1(b), 2(b) and (c)). To minimize vertical uncertainty, sampling was avoided in areas near cave entrances, narrow inlets, or major rock fractures, where local hydrodynamics could affect the vertical growth of the algal rims (Figure 2(d)). Rims were sampled with a hammer and chisel during calm sea conditions. Their elevation measured using a metric rope and GPS, is expressed relative to Biological Mean Sea Level (BMSL) defined as the lowest elevation of the presence of living L. byssoides thalli at each site. The nearest Porto Torres tide-gage record, the global EGM96 geoid and the Italian national vertical datum (Genova, 1942) were used only as auxiliary references for measurement consistency checks and were not adopted as reference datums for RSL index-point calculations.

Bio-geomorphological survey. (a) Panoramic view of Liyhophyllum byssoides rim around Capo Caccia cliffs (person on kayak for scale); (b) Detail view acquired during sampling of O1 rim growing on a small wave-cut platform. Note a well-developed micro lagoon on the left. Scale bar = 10 cm; (c) Detail view acquired during sampling of N1 rim growing within a well-developed tidal notch. Scale bar = 10 cm; (d) Detail view of a Liyhophyllum byssoides rim growing around large rock fracture. Note the hydrodynamic effects on rim highlighted by the sea water cascade. (e) Panoramic view of a cliff fully exposed to major storms. Note the rim ruptures and multiple interruptions.
A total of two samples were collected (O1: 24.2 × 20.1 cm; N1: 23.8 × 16.1 cm; dimensions measured along the longest vertical and horizontal axes, respectively). The algal rim samples were longitudinally sliced following their natural growth direction, and a total of 35 standard petrographic thin sections were prepared (14 from N1; 21 from O1; Figures 3–5, SM1). Investigation of algal builders, analysis of rim inner structures and growth pattern along with identification of sediment clasts, matrix and cement compositions were carried out on petrographic thin sections using transmitted-light optical microscope and a Scanning Electron Microscope (SEM; JEOL JCM-700; Figure 3). A morphometric analysis was conducted to quantitatively measure conceptacle chamber dimensions and to qualitatively observe algal thalli cell morphology, following standard taxonomic criteria (Chamberlain, 1994; Woelkerling, 1983). The description of algal macro- and microstructures followed the taxonomy and methodology of Woelkerling et al. (1993) and Di Geronimo et al. (2002). Distinct growth phases were identified based on: (i) erosional or growth discontinuities, (ii) sandy drapes or silica-rich muddy matrix intercalations and (iii) differences in cementation degree.

Thin section. (a) General overview with growth directions arrow. (b) Bio-siliciclastic trapped sediment details. (c) Secondary electron image of L. byssoides thallus and sediment. (d) Detail of L. byssoides conceptacle. (e) Reddish fine matrix in the trapped sediment, right below the N1 erosional surface. (f) Intra-thallus cement details with L. byssoides thalli cells.

O1 site. Geometry, vertical position and internal structure of the Lithophyllum byssoides algal rim, measured relative to the local Biological Mean Sea Level (BMSL), independently defined at the site from the lower living limit of L. byssoides. The rim position at the time of sampling is shown with respect to the Highest Astronomical Tide (HAT), with the Reference Water Level (RWL) indicated as the midpoint of the biologically defined indicative range (IR = HAT to BMSL). Rim thickness, internal pattern of growth and erosional surface dividing the rim growth phases (first–fourth phase). Note erosional surfaces zooms (E1–E3), together with the position of radiocarbon-dated samples.

N1 site. Geometry, vertical position and internal structure of the Lithophyllum byssoides algal rim relative to the local Biological Mean Sea Level (BMSL). The rim position at the time of sampling is shown with respect to the Highest Astronomical Tide (HAT), with the Reference Water Level (RWL) defined as the midpoint of the biologically constrained indicative range. Note rim thickness, internal pattern of growth and erosional surface dividing the rim growth phases (third to fourth phase), including portions dominated by subtidal coralline crustose algae (CCA). Erosional surfaces zoom (E), together with the position of radiocarbon-dated samples.
Six algal thalli from each sample were selected for radiocarbon dating (14C), sampled along the growth direction (Figures 4 and 5). Dating has been performed by the Beta Analytic laboratory (Miami, USA), before the measurement, the micritic matrix and bioclastic-rich sand were removed from the chosen thalli. Radiocarbon ages were calibrated using the MARINE20 curve (Heaton et al., 2020) and corrected for the western Mediterranean marine reservoir effect (∆R = −184 ± 22; Faivre et al., 2019b). Following the conceptual approach proposed by Basso et al. (2022), vertical accumulation was quantified where continuous rim growth could be demonstrated within a single growth phase. This approach was applied only to the lower zone of N1 rim (see chapter 4.5 and Figure 5) where no evidence of erosional truncation or growth hiatuses was observed. In this case, rims accumulation rate was therefore calculated using the vertical distance between dated samples belonging to the same growth phase and progressing toward the top living surface of the bioconstruction.
Analysis of relative sea-level index points
The Relative Sea-level (RSL) was calculated for all the 14C dated thalli (12 in total) and estimated using the following equation (Shennan and Horton, 2002; subsequently modified by Vacchi et al., 2016):

where
Results
Bio-geomorphological survey
Results of the kayak survey show an almost continuous intertidal algal rim around the main promontories of the study area (Figures 1(b) and 2(a)). Prominent and well-developed bioconstructions occur along the northern and western coasts of Capo Caccia (Figure 1), where they are subject to consistent wave action due to direct exposure to the prevailing Mistral winds (NW) and associated swells. This observation aligns with previous studies, which indicate that the growth, thickness and morphology of L. byssoides rims are strongly influenced by local wave energy exposure (Faivre et al., 2013; Sechi et al., 2020). The thickest and largest rims develop at cave entrances and within large rock fractures, where non-breaking wave run-up causes an increase in water level against the cliff face (Figure 2(d)). Nevertheless, bioconstructions growing on cliffs fully exposed to severe swells tend to be thinner and show signs of breakage and discontinuity (Figure 2(e)). Rim thickness and lateral continuity increase in particular geomorphic settings, such as rocky inlets with partial protection and a deeper seabed in front. These conditions promote stable environments that favor both vertical and seaward lateral accretion of the rim structure.
Rim inner structure and builder
Thin section and SEM analyses reveal that both the O1 and N1 rims consist of several generations of anastomosing algal thalli with characteristic upward-facing, fan-shaped branches that define the predominant upward and seaward growth directions of the rim (Figure 3(a); Mannino, 2003; Woelkerling et al., 1983, 1993; dryades.units.it). These bioconstructions are formed by a continuous superposition of new thalli above the dead ones following a slow-rising sea level (keep-up like model), as generally proposed by Pérez and Picard (1964) and (Adey, 1986). Based on these structural features, the bioconstructions are classified as framestones, as the in-situ fossil Crustose Coralline Algae (CCA) thalli form a rigid framework, with bio-siliciclastic sandy sediments trapped between different algal generations (Figure 3(b)). Conceptacle chambers morphometry (typically ~100–160 µm in average width; Pezzolesi et al., 2017) led to the taxonomic identification of L. byssoides as the dominant framework builder of the studied bioconstructions (Figure 3(c) and (d)). The trapped sediment is composed of fine-grained bioclastic sand, including fragments of coralline algae, bivalves, gastropods, bryozoans, foraminifera and serpulids, along with minor quartz and feldspar grains. In some areas of the O1 and N1 inner rims, a silica-rich, reddish terrigenous muddy matrix is abundant (Figure 3(e)). Typical intertidal calcite spar cement, with inter- and intraparticle equant crystals, welds the sediment to the algal thalli, partially filling the voids and consolidating the rim framework (Figure 3(f)). The high complexity of the rim inner structure is primarily due to algal growth and infilling within cavities produced by bioeroders (e.g. Lithophaga lithophaga). The identification of conceptacle chamber orientation (Woelkerling, 1983; Chamberlain, Y.M. 1994), along with the morphometric analysis of algal thalli, has proven essential for interpreting bioconstruction with stratigraphic coherence. Site-specific inner structures reveal multiple growth phases and shifts in sediment infill and cementation, as outlined below.
Study site O1
Site O1 is located on the west coast of the Capo Caccia peninsula near Isola Piana, in a rocky embayment that is open to the west but partly sheltered from NW-incoming Mistral winds. The seafloor here reaches approximately 7 m depth (Figure 1(a) and d). It features a well-developed rim, 24 cm thick which grows on a small wave-cut platform, a few decimeters wide, forming a micro-lagoon on its upper surface near the cliff (Figures 2(b) and 4). It is attached to the vertical substrate through the land-facing side and the sea-facing side features a protuberance in its upper part. The most abundant top side coverage consisted of living individuals of Lithophyllum byssoides surrounded by few other Crustose Coralline Algae (CCA; i.e. Lithophyllum incrustans, Lithophyllum papillonis). The sea side of the rim, immediately below the lower limit of living Lithophyllum byssoides individuals (BMSL), is characterized by a typically subtidal assemblage dominated by Ceramium and Corallina elongata and exhibits particularly intense bioerosion compared to the upper surface, with cavities mostly occupied by Lithophaga lithophaga and Patella caerulea.
A general fruticulose aspect with a multi-layered structure and the branch shaped thalli has been observed from the polished rim slice (Figure 4). O1 shows three barely developed erosional surfaces, delineating four different inner zones (Figure 4). Furthermore, a millimeters-thick white crust of closely patched laminar sets of other CCA developed inside the micro lagoon on the top of the land side of the rim. The lower unconformity is highlighted by a higher degree of cementation and a diffuse silty-clay reddish matrix in the rim below the surface (Figures 3(e) and 4). In the inner zone above the latter surface, cementation is markedly lower and the reddish muddy matrix is absent. The middle and upper unconformities are dominated by rough surfaces with several cavities filled by biogenic and siliciclastic sediments (Figure 4). The inner zone between these unconformities is rich in sediments and muddy reddish matrix, whereas the outermost part shows a well-developed sediment drape lying on the upper surface.
Study site N1
Site N1, located on the north coast near Punta del Gallo, lies within a northwest-facing rocky cove that is slightly exposed to Mistral winds and characterized by a shallow seafloor, approximately 3 m deep (Figure 1(a) and (c)). It exhibits a 24 cm thick rim that stands at the base of a well-developed tidal notch (Figures 2(c) and 5). The land-facing side is attached to the vertical substrate, while the sea-facing side features an upper protuberance and a highly porous surface, with millimeter- to centimeter-sized cavities, many of which are occupied by Lithophaga lithophaga. Externally, the rim is predominantly covered by subtidal Crustose Coralline Algae (e.g. Lithophyllum incrustans, Figure 2(b)), and is generally sparsely colonized by living Lithophyllum byssoides, which occurs only with a few individuals above the top surface.
From the polished rim slice, the multi-layered structure and the branch shaped thalli give a general fruticulose aspect to the inner pattern (Figure 5). The presence of a well-developed erosional surface draped by a centimeter thick sandy accumulation, allows us to subdivide the N1 slice into two inner zones (Figure 5). Below the erosional surface, sample N1 shows well-formed cement crystals, with algal skeleton cells mostly filled, reducing the porosity, along with a higher concentration of silty-clay reddish matrix (Figure 3(e)). Above the erosional surface, there are more interspaces between the thalli, and the trapped sediments are generally less cemented with conceptacle chambers often empty. Moreover, a distinctive white crust, ranging from a few millimeters to 1 cm in thickness, has developed on the seaward side of the rim (Figure 5). This encrustation is composed of tightly packed thalli of subtidal Crustose Coralline Algae (CCA), forming a continuous and visually striking white layer. Its presence indicates a shift from intertidal to subtidal assemblages, as the crust is composed of CCA species typically found in deeper, permanently submerged environments.
Chronology of rim growth
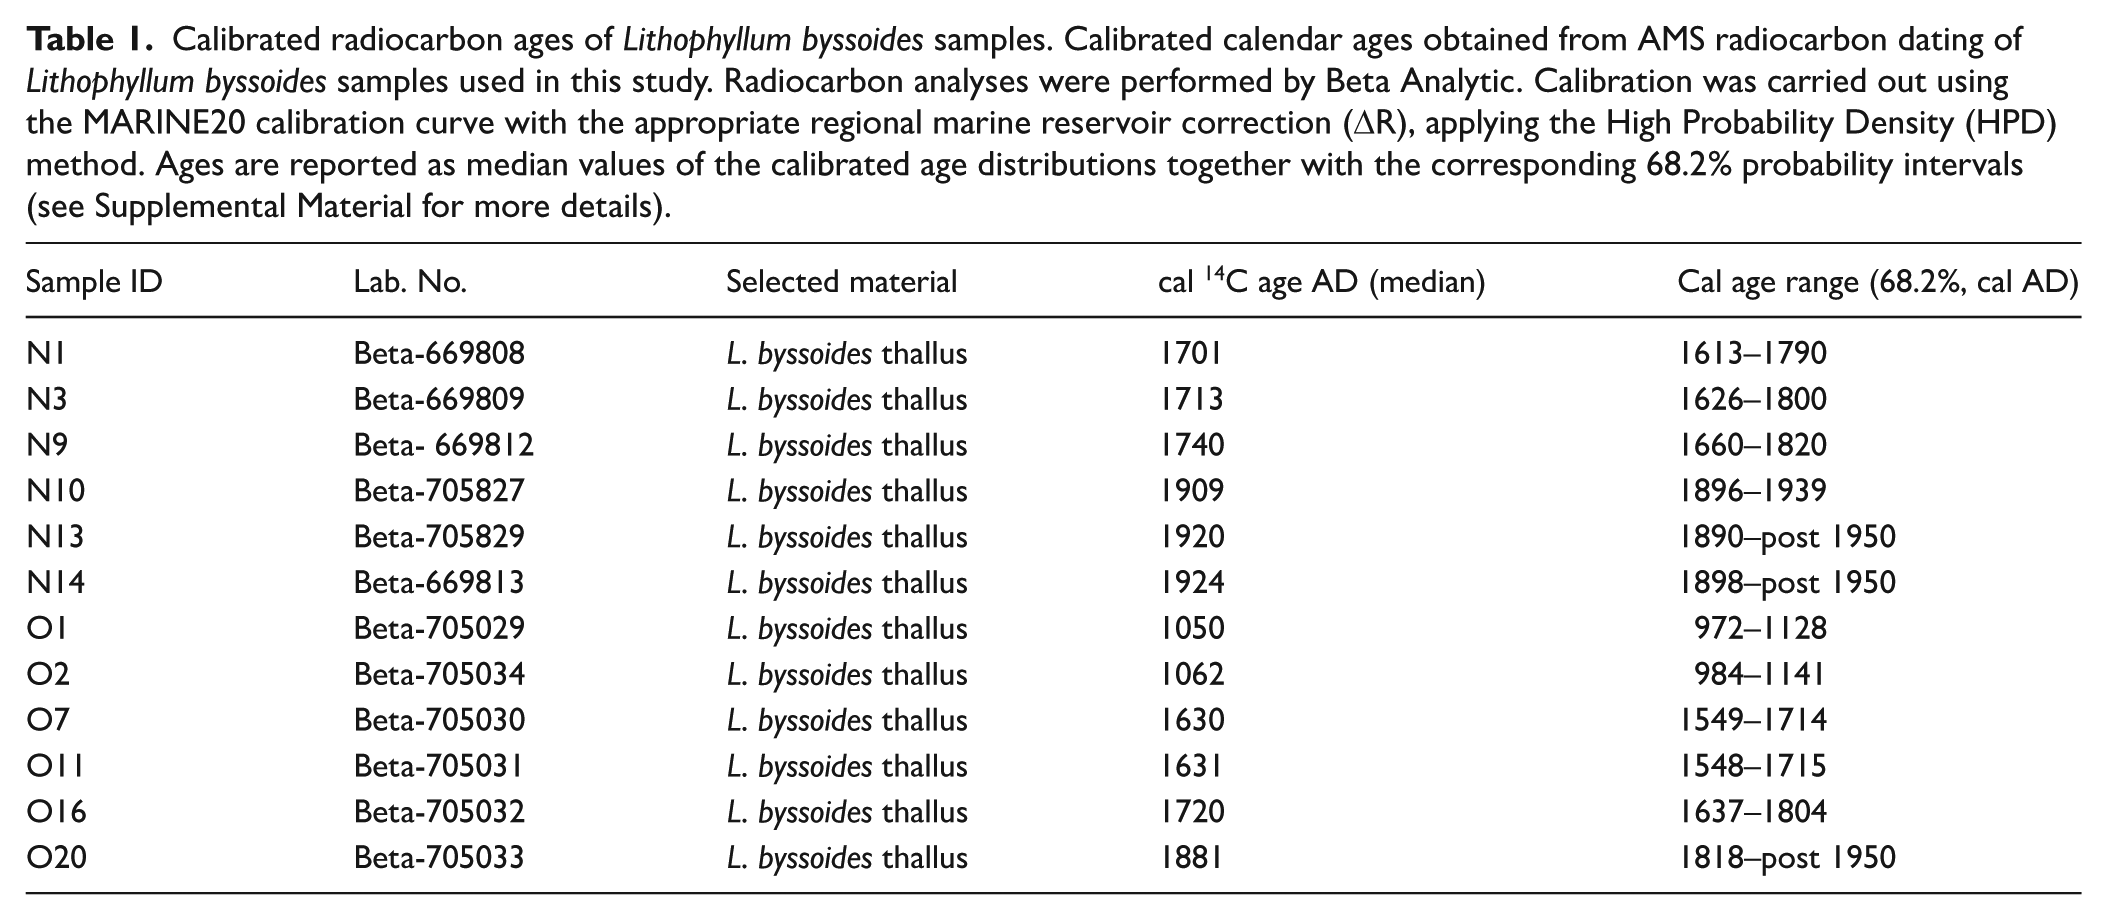
To reconstruct the chronological framework of rim accretion, a total of 12 Lithophyllum byssoides thalli fragments were collected from the O1 and N1 sites for radiocarbon dating (Figures 4 and 5 and Table 2). For O1, six samples were extracted from distinct inner zones of the rim (Figure 4). Two fragments, from the innermost land-side portion, yielding calibrated radiocarbon ages of 1050 ± 78 and 1060 ± 78 cal AD, respectively. Two additional samples, taken from the mid-zone between the lower and middle erosional surfaces, returned ages of 1630 ± 82 and 1631 ± 82 cal AD. Two thalli collected from just below and above the uppermost erosional surface were dated to 1720 ± 83 and 1881 ± 63 cal AD, respectively.
Six thalli fragments were dated to constrain the accretional history of the N1 rim (Figure 5). Three samples collected from the lower zone, beneath the erosional surface, yielded ages of 1701 ± 88, 1713 ± 87 and 1740 ± 80 cal AD. The lower zone of N1 rim segment shows continuous accretion between 1701 and 1740 AD with no evidence of erosional truncation or growth hiatuses. Over this interval, the bioconstruction records a vertical accretion of 16 cm, corresponding to an average accumulation rate of ~4 mm/yr (16 cm over ~40 years). This value represents a phase-specific bioconstruction accumulation rate, applicable only to this sample and to this time span due to the consistent succession of the dated thalli. This value is reported as an indicative mean accumulation rate, given that radiocarbon age uncertainties. In contrast, three samples retrieved from above the erosional surface yielded younger ages of 1909 ± 41, 1920 ± 30 and 1924 ± 26 cal AD.
The stratigraphic distribution shows O1 ages gathering into four coherent growth phases (Figure 4), with each age group falling within the 68.2% probability intervals and showing no overlap between age clusters (Table 1). The N1 rim also displays two distinct age clusters (Figure 5), with no overlap in their calibrated age probability distributions (68.2% probability intervals; Table 1). This chronological separation mirrors the observed sedimentological discontinuity, suggesting a pause or shift in rim growth, followed by renewed accretion in subsequent, progressively younger phases. The vertical and lateral arrangement of the dated material—from older layers at the base to younger ones toward the seaward margin—confirms a preferential accretional growth trajectory oriented seaward and upward, from the substrate toward the outer surface of the rims.
Calibrated radiocarbon ages of Lithophyllum byssoides samples. Calibrated calendar ages obtained from AMS radiocarbon dating of Lithophyllum byssoides samples used in this study. Radiocarbon analyses were performed by Beta Analytic. Calibration was carried out using the MARINE20 calibration curve with the appropriate regional marine reservoir correction (ΔR), applying the High Probability Density (HPD) method. Ages are reported as median values of the calibrated age distributions together with the corresponding 68.2% probability intervals (see Supplemental Material for more details).
Discussion
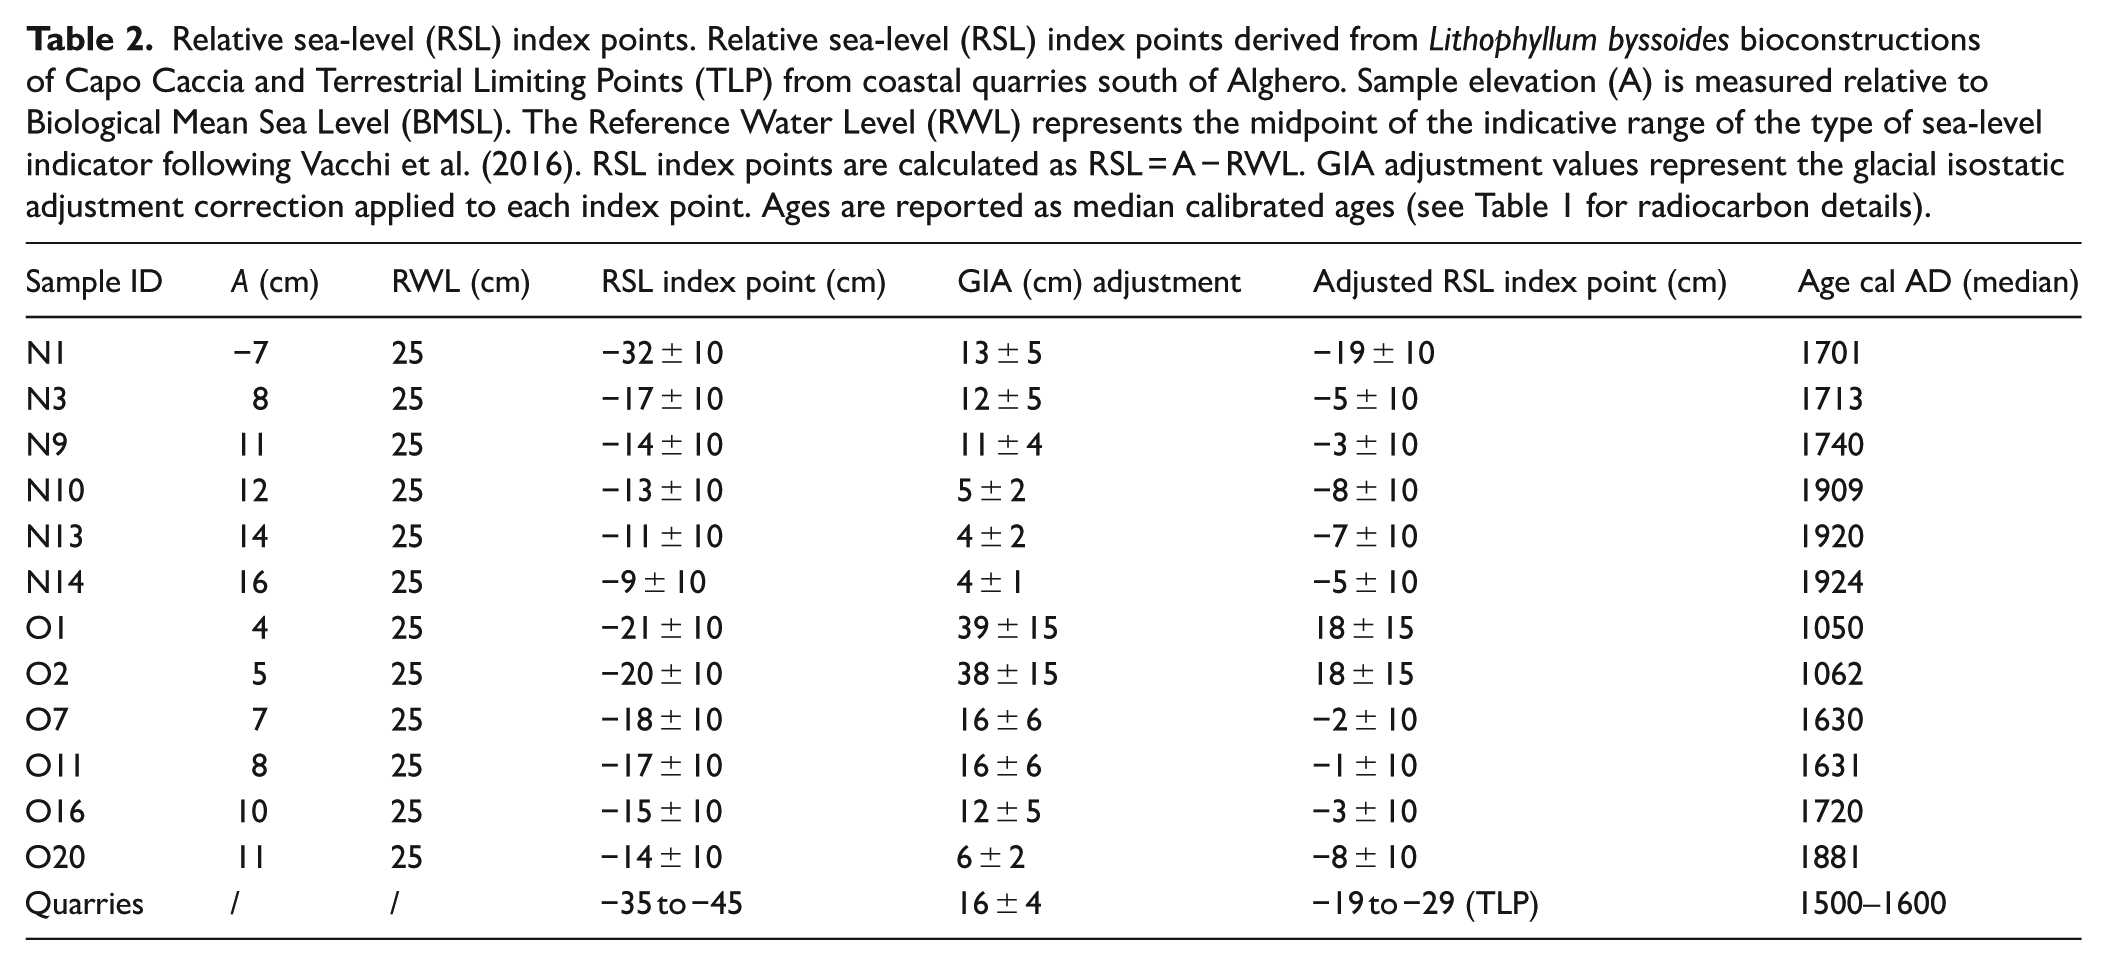
On a sub-centennial time scale, Mediterranean Sea-level response to air temperature warming and cooling is mainly driven by the rate of seawater thermal expansion (Church et al., 2001; Gregory et al., 2006; Jevrejeva et al., 2008; Kemp et al., 2011; Kopp et al., 2016; Rahmstorf, 2007). To isolate the climate-driven component of relative sea-level change, RSL index points derived from the studied Lithophyllum byssoides rims were adjusted for glacial isostatic adjustment (GIA) and evaluated in relation to the terrestrial limiting point (TLP) provided by the Alghero coastal quarries (Pascucci et al., 2019). Spada and Melini (2022) report an ongoing GIA of −0.4 ± 0.15 mm/yr (total vertical displacement), for the NW Sardinia coast. For the period considered, applying a constant GIA rate is appropriate, given the timescale of Earth’s viscoelastic response (Peltier, 1996, 2004). Applying GIA corrections shifted the amplitude of the observed fluctuations, along with the associated uncertainties, particularly affecting the oldest samples (Table 2).The distribution of the GIA-adjusted RSL index points reveals that the main phases of rim growth correspond to periods during which relative sea level was rising and coincide with the warmest stages of the last millennium (Figure 6). In contrast, the erosional surfaces observed within the rim structure point to phases of sea-level fall, which correlate well with the coldest stages of the Little Ice Age (Figures 4–6). Within this framework, it is important to consider the growth behavior of Lithophyllum byssoides as a sea-level proxy. Rim accretion preferentially occurs under slowly rising sea-level conditions (Faivre et al., 2013; Sechi et al., 2020). Excessively rapid sea-level rise inhibits vertical rim development (Faivre et al., 2013), whereas sea-level fall and the resulting permanent subaerial exposure primarily stop rim growth and intertidal cementation processes, potentially leading to breakage of the bioconstruction (erosional surfaces) and subsequently to the deposition in cavities on the erosive surface of sandy-muddy drapes. Consequently, algal rims provide an informative record of relative sea-level behavior, from which average RSL rise rates can be inferred, albeit with significant uncertainty.
Relative sea-level (RSL) index points. Relative sea-level (RSL) index points derived from Lithophyllum byssoides bioconstructions of Capo Caccia and Terrestrial Limiting Points (TLP) from coastal quarries south of Alghero. Sample elevation (A) is measured relative to Biological Mean Sea Level (BMSL). The Reference Water Level (RWL) represents the midpoint of the indicative range of the type of sea-level indicator following Vacchi et al. (2016). RSL index points are calculated as RSL = A − RWL. GIA adjustment values represent the glacial isostatic adjustment correction applied to each index point. Ages are reported as median calibrated ages (see Table 1 for radiocarbon details).

Relative sea-level (RSL) reconstruction from Capo Caccia Lithophyllum byssoides algal rims, compared with European summer temperature anomalies over the last millenium. (a) GIA adjusted RSL curve constrained by algal-rim sea-level index points from the O1 (white circles) and N1 (yellow circles) sites, and by an archeological terrestrial limiting point (TLP) derived from submerged coastal quarries (green box). The RSL curve is tracked considering rim internal structure, including erosional surfaces and the distribution of red muddy matrix, which indicate phases of growth interruption and relative sea-level lowering. Shaded vertical bands indicate major climatic phases (MCA, LIA, IE) and solar minima (Oort, Wolf, Spörer, Maunder, Dalton). (b) Reconstructions of European summer temperature anomalies relative to the 1961–1990 AD mean, illustrating sub-centennial-scale climate variability over the last 1000 years (after Luterbacher et al., 2016; Wanner et al., 2022).
This approach allows the identification of successive phases of relative sea-level rise associated with rim development. By doing so, sub-centennial-scale relative sea-level change can be distinguished, which would otherwise be obscured by a single long-term trend in the RSL index point.
Climate control on algal rim evolution over the last 1000 years
The intertidal algal rims studied at Capo Caccia (Sardinia, Mediterranean Sea) clearly display four distinct phases of Lithophyllum byssoides growth, each separated by marked erosional surfaces. These growth phases correspond to periods of relative sea-level rise, whereas the erosional surfaces—draped in bio-siliciclastic sand-sized sediments and reddish muddy matrix—point to prolonged (multi-decadal) episodes of subaerial exposure and relative sea-level fall. Together with AMS radiocarbon ages, these features indicate four sub-centennial phases of sea-level rise and three sea-level falls over the last millennium, which can be tied to European summer temperature anomaly reconstructions (Luterbacher et al., 2016; Wanner et al., 2022; Figure 6).
The first growth phase, observed in the O1 rim and dated to around 1050 AD, developed during the Medieval Climate Anomaly (900–1225 AD), a prolonged warm period preceding the cold Little Ice Age (Wanner et al., 2022). The available data are insufficient to precisely constrain the entire duration of this growth phase. Furthermore, regional to global reconstructions highlight pronounced spatial and temporal variability in global mean sea level (GMSL) and regional relative sea level during the MCA. These records indicate a relative lowstand around ~1000–1050 AD (Oort Minimum), followed by a relative sea-level rise between ~1100 and 1200 AD (e.g. Faivre et al., 2023; Kopp et al., 2016; Vacchi et al., 2021), occurring during a period when mean air temperatures were comparable to or slightly lower than present-day values (Figure 6; Wanner et al., 2022). Subsequently, a period of both arrested L. byssoides growth and partial erosion of the rim occurred, likely driven by a relative sea-level fall associated with the onset of the Little Ice Age (LIA). Notably, phases of reduced solar activity during the Common Era have been associated with global mean sea level lowering (e.g. Faivre et al., 2023; Kopp et al., 2016), providing a broader climatic context for the observed local RSL behavior. The definitive transition to the European LIA took place with the Wolf and Spörer Grand Solar Minima (GSM; periods of markedly reduced solar activity), each accompanied by clusters of volcanic eruptions (Wanner et al., 2022). The longer LIA cooling phases were typically triggered by such eruptions, which coincided with Grand Solar Minima (Bradley et al., 2016) and were further intensified by internal feedbacks involving the atmosphere, oceans and sea ice. Around 1575 AD, temperatures dropped to −2°C compared to present (Luterbacher et al., 2016), marking one of the coldest intervals of the LIA. The second growth phase took place in the first half of the 17th century during a relatively warm period (−0.3°C below present) between the Spörer and Maunder solar minima (Wanner et al., 2022). Subsequently, a relative sea-level drop frames the Maunder Minimum (air temperature −0.5°C below present), and during the first half of the 18th century, rim accretion resumed with a pronounced relative sea-level rise. This period was characterized by a positive European summer temperature anomaly, with temperatures reaching 1990s levels (Figure 6). This warming was driven by increased solar irradiance (marking the end of the Maunder Minimum) and a reduced incidence of volcanic eruptions (Perry and Hsu, 2000; Warren et al., 2022), creating favorable conditions for the algal rim development. The sampled rims also show evidence of a third severe erosion (Figures 3 and 5), linked to a relative sea-level drop driven by the last cold pulse (Dalton Minimum) of the LIA, occurring between 1800 and 1860 AD (Wanner et al., 2022). In the early 19th century, European summer temperatures fell to −3°C compared to present (Luterbacher et al., 2016; Figure 6), influenced by the Dalton GSM and at least four major volcanic eruptions between 1808 and 1835 AD. The 1815 Tambora eruption, in particular, played a decisive role in this climate cooling (Sigl et al., 2015). This cooling is also reflected in the third and most pronounced advance of the Great Aletsch and Gorner Alpine glaciers in 1860 AD (Holzhauser et al., 2005). With the onset of the Industrial Era after 1860 AD, gradual warming began, likely driven by reduced volcanic activity and increased solar irradiance (Calvin et al., 2023; Wanner et al., 2022; Figure 6). This natural warming set the stage for modern sea-level rise and triggered the fourth phase of rim accretion at Capo Caccia. In the 20th century, greenhouse gas concentrations increased exponentially, and after 1988 AD, the transition to rapid warming accelerated global sea-level rise consistently (Calvin et al., 2023; Luterbacher et al., 2016; Vacchi et al., 2021; Wanner et al., 2022). This phenomenon has led to the ongoing submergence of the N1 rim and the formation of a white crust made by other subtidal Crustose Coralline Algae, clearly visible on its seaward side (Figures 2(c) and 5). In contrast, the O1 rim appears to have maintained active vertical accretion, likely supported by site-specific exposure conditions that promote frequent water renewal within the intertidal zone (Figures 2(b) and 4). Currently, the surface of the N1 rim shows a marked reduction in Lithophyllum byssoides and a profuse presence of other CCA species, typically thriving in subtidal environments (e.g. L. incrustans). This shift in CCA assemblage is consistent with a partial drowning of the N1 rim and thus reflects a biological response to the recent acceleration in relative sea-level rise.
Relative sea-level changes and comparison with proxy-based reconstructions
Sub-centennial sea-level fluctuations during the Late-Holocene remain poorly constrained in the proxy record. To evaluate the broader significance of the four rim growth phases and associated sea-level rises and drops observed at Capo Caccia, these findings are cautiously compared with established Mediterranean and global sea-level reconstructions (Garcia-Artola et al., 2009; Gehrels et al., 2006; Goodwin and Harvey, 2008; Gregory et al., 2006; Leorri et al., 2008; Faivre et al., 2019a, 2023; Kemp et al., 2011; Kopp et al., 2016; Vacchi et al., 2021), as well as with millennial-scale climate variability and solar insolation trends (Figure 6; Luterbacher et al., 2016; Perry and Hsu, 2000; Wanner et al., 2022).
At Capo Caccia, the Medieval Climate Anomaly is recorded in the early phase of O1 rim development (ca. 1050–1060 AD). The associated relative sea level index points are positioned above present sea level and, following the Oort Minimum, likely reflect environmental conditions favorable to algal rim accretion (Figures 4 and 6). This interpretation is consistent with previously reported RSL rise rates, ranging between 0.5 and 0.7 mm/yr from algal rim records in the Adriatic Sea (Faivre et al., 2019a, 2023, 2024), as well as comparable rising rates inferred from North Atlantic salt-marsh sedimentary records between ~850 and 1250 AD (Kemp et al., 2011). A more prolonged RSL fall followed between 1200 and 1600 AD, which corresponds to the development of a well-defined lower erosional surface in the O1 rim. During the ca. 1500–1600 AD interval, terrestrial limiting points from the Alghero coastal quarries constrain the local RSL to have remained at least 35 cm below present mean sea level (Pascucci et al., 2019). After correction for glacial isostatic adjustment and considering 10 cm of uncertainty, this constraint corresponds to a terrestrial limiting elevation ranging between 19 and 29 cm, below present mean sea level (Figure 6). This terrestrial limiting point indicates that relative sea level could not have exceeded the elevation of the quarry working surfaces during their period of use (Pascucci et al., 2019). In addition, the occurrence of a reddish matrix within the studied O1 algal rim further suggests extended periods of subaerial exposure, implying that sea level may have dropped by over half a meter during the onset of the Little Ice Age as firstly assumed by Pascucci et al. (2018) working on the sedimentary sequence of Mistral beach-ridge system (W Sardinia). This lowstand aligns with near-stable or slightly negative trends recorded in various Mediterranean and global sea-level reconstructions (Faivre et al., 2019a, 2023; Kemp et al., 2011; Vacchi et al., 2021), reinforcing the climatic significance of this period. A renewed phase of relative sea-level rise is identified between ~1600 and 1630 AD. The onset of this phase is constrained by a terrestrial limiting point (TLP) from the Alghero coastal quarries, while its upper termination is defined by two RSL index points from the O1 rim. This phase records a RSL rise that occurred within a relatively warm interval between the Spörer and Maunder solar minima (Figure 6). This phase was short-lived, as growth ceased again in the latter half of the 17th century—coincident with the Maunder Minimum—when a relative sea-level drop of at least 20 ± 10 cm, producing erosion and subsequent increments of sediment accumulation, likely interrupted and slowed the O1 rim accretion (Figures 4 and 6). Growth resumed during the following warm period (ca. 1700 and 1740 AD), between the Maunder and Dalton minima, indicating a phase of sustained relative sea level rise. While these growth-related relative sea-level rises exceed the frequency and amplitude typically reported for the Late-Holocene, they may reflect brief warm oscillations that are not clearly resolved in the proxy record. In contrast, during this time interval, several studies document a lack of rim formation (Faivre et al., 2019a) or stable to slightly negative sea-level behavior (Kemp et al., 2011). Following 1740 AD, both rims display evidence of a marked depositional hiatus and erosional truncation, suggesting a relative sea-level fall of at least 20 ± 10 cm. Coastal stratigraphy from western Sardinia further supports this interpretation, with records of beach progradation linked to falling sea level and increased sediment supply (Pascucci et al., 2018). This lowstand coincides with the final cold stage of the Little Ice Age, associated with the Dalton Grand Solar Minimum (ca. 1800–1860 AD) and aligns with global reconstructions indicating a significant sea-level drop during this time (Gregory et al., 2006; Kopp et al., 2016). These parallels suggest that the sea-level trend observed at Capo Caccia likely fits within a broader regional, northern hemispheric, pattern. At Capo Caccia the algal rims record a renewed relative sea-level rise between 1881 and 1909 AD, increasing progressively by 1924 AD. These interpretations are in agreement with regional observations from the northeastern Adriatic (Faivre et al., 2019a) and with records from the North Atlantic, where rates of up to 2.1 mm/yr were documented between 1865 and 1892 (Kemp et al., 2011). A broader global acceleration in sea-level rise around 1863 AD is also supported by proxy database analyses (Walker et al., 2022). This early phase of modern sea-level rise likely reflects a combination of reduced volcanic activity and modest increases in solar irradiance following the end of the Little Ice Age. However, these natural forcings remained relatively stable or declined in the following decades, indicating that they cannot account for the pronounced acceleration observed after the mid-20th century (Calvin et al., 2023; Haigh, 2019). According to a growing number of global and relative sea-level reconstructions (Faivre et al., 2019a, 2023; Gregory et al., 2006; Kemp et al., 2011; Kopp et al., 2016; Vacchi et al., 2021), the increase in greenhouse gas concentrations during the industrial era—particularly from the second half of the 20th century—has led to a marked warming of global temperatures. This, in turn, triggered a progressive and widespread acceleration of global sea-level rise through thermal expansion of seawater and increased melting of land-based ice. In this context, Mediterranean sea-level curves show rates ranging between 1 and 3 mm/yr (Faivre et al., 2019a; Vacchi et al., 2021), which are consistent with the presence of well-developed subtidal external white crusts in the N1 rim (Figures 5 and 6). These findings confirm that the growth phases of the algal rims capture the transition from “natural” Holocene sea-level variability to modern, anthropogenically driven sub-centennial sea-level trends.
Conclusions
The intertidal red algal rims of Capo Caccia have recorded sub-centennial relative sea-level fluctuations over the last millennium. At this timescale, sea level shows great variability, with high-frequency and low-amplitude oscillations. These are controlled by the differential response of Mediterranean Sea level to cooling and warming episodes, as demonstrated by the related sea-level fluctuation recorded in the algal rims. The amplitude of the detected fluctuations is on the order of tens of centimeters, leading to important changes in coastal dynamics. Overall, rim growth phases document periods of relative sea-level rise during the warmest intervals of the last millennium, whereas erosional surfaces reflect phases of sea-level fall associated with the coldest stages of the Little Ice Age.
The first growth phase developed during the first half of the 11th century and is associated with the warm Medieval Climate Anomaly (MCA). It is followed by a period of sea level fall of at least half of a meter that persisted until 1600 AD. At Capo Caccia, relative sea level then increased during the second and third growth phases (~1600–1630 AD and ~1701–1740 AD, respectively), separated by a sea-level drop of at least 20 cm coinciding with the Maunder Minimum. The third growth phase is followed by another drop of about 10 cm, corresponding to the final cold phase of the LIA (first half of the 19th century, Dalton GSM). The subsequent modern sea-level rise (post-1860 AD) began driven by natural factors. During the second half of the 20th century, it underwent a speed-up triggered by greenhouse gas-induced global warming. This phenomenon has caused the ongoing submergence of the N1 rim and the formation of a white crust of subtidal Crustose Coralline Algae, clearly visible on its seaward side. N1 rim surface now shows a marked decline in Lithophyllum byssoides and an abundance of other CCA species (e.g. L. incrustans) typical of subtidal conditions. These features indicate a partial drowning of the rim, most likely driven by the recent acceleration in sea-level rise.
Between 1701 and 1740 AD, under favorable environmental conditions, the mean accumulation rate of the N1 rim is estimated at approximately 3–4 mm/yr (16 cm over ~40 years), acknowledging the associated chronological uncertainty. This suggests that Lithophyllum byssoides can build up and keep pace with relative sea-level rise of comparable magnitude. However, excessively rapid sea-level rise—such as the current trend—promotes the colonization of subtidal species, increasing competition and inhibiting the development of L. byssoides rims.
Over the last millennium, these findings reveal four main sub-centennial phases of relative sea-level rise that promoted rim growth, separated by three sea-level drops, resulting in prolonged subaerial exposure of the rims. Our observations confirm the close link between climate and sea-level change and highlight the value of coralligenous intertidal bioconstructions as sensitive paleoenvironmental archives, particularly useful for reconstructing sea-level dynamics during the transition from the pre-industrial to the industrial era.
Supplemental Material
sj-docx-1-hol-10.1177_09596836261440759 – Supplemental material for Relative sea-level fluctuations of the last millennium recorded by intertidal algal rims (NW Sardinia, Mediterranean Sea)
Supplemental material, sj-docx-1-hol-10.1177_09596836261440759 for Relative sea-level fluctuations of the last millennium recorded by intertidal algal rims (NW Sardinia, Mediterranean Sea) by Giovanni Fantini, Daniele Sechi, Vincenzo Pascucci and Stefano Andreucci in The Holocene
Footnotes
Acknowledgements
The authors thank Dario Fancello and the CeSAR (Centro Servizi d’Ateneo per la Ricerca) of the University of Cagliari, Italy, for the SEM analyses; Alberto Ruiu of the Marine protected area Capo Caccia, Isola Piana, Alghero, Italy; Salvatore Noli for the production of thin sections; Alessia Fronteddu and Gianluca Loi for their contributions to sample preparation within the framework of their bachelor theses in Geology. We thank the editor and the anonymous reviewers for their constructive comments and suggestions, which helped improve the manuscript.
Author contribution(s)
Funding
The authors disclosed receipt of the following financial support for the research, authorship, and/or publication of this article: We acknowledge financial support under the National Recovery and Resilience Plan (NRRP), Mission 4, Component 2, Investment 1.1, Call for tender No. 1409 published on 14.9.2022 by the Italian Ministry of University and Research (MUR), funded by the European Union – NextGenerationEU– Project Title WaCoMed – CUP P2022EPCJS- Grant Assignment Decree No. 1388 adopted on 01/09/2023 by the Italian Ministry of University and Research (MUR; Resp. prof. Andreucci Stefano).
The research was partially founded by DETECTOR- Dating rEcent climaTE Changes To fOrecast the future, Marie Skłodowska-Curie Actions (MSCA) HORIZON.1.2, Grant agreement ID:101235981 (Resp. V. Pascucci) and, The Port System Authority of the Sea of Sardinia (Italy), FSC2007/2013. Action 6.1.2.A.1., Port Hub of PortoTorres, Research agreement with the University of Sassari, Project “Poseidonia 2022” (Resp. prof. V. Pascucci).
This article was produced by GF while attending the PhD programme in Earth and Environmental Sciences and Technologies at the University of Cagliari, Cycle XXXVIII, with the support of a scholarship financed by NRRP, funded by the European Union–NextGenerationEU–Mission 4 “Education and Research,” Component 2 “From Research to Business” – Investment 1.3 “Creation of “enlarged partnerships between universities, research centres, businesses and funding of basic research projects.”
Declaration of conflicting interests
The authors declared no potential conflicts of interest with respect to the research, authorship, and/or publication of this article.
Data availability statement
The dataset includes geochronological results (radiocarbon), field data (GPS coordinates, elevations), and processed files used to generate the figures and tables of the manuscript. Data are available at Mendeley Data, V1: Fantini, Giovanni (2025), “Fantini et al., 2025,” DOI: 10.17632/8jwfmfp2cy.1.
Supplemental material
Supplemental material for this article is available online.
References
Supplementary Material
Please find the following supplemental material available below.
For Open Access articles published under a Creative Commons License, all supplemental material carries the same license as the article it is associated with.
For non-Open Access articles published, all supplemental material carries a non-exclusive license, and permission requests for re-use of supplemental material or any part of supplemental material shall be sent directly to the copyright owner as specified in the copyright notice associated with the article.