
Abstract
This study examined the influence of Korean public libraries’ service quality factors on overall user satisfaction and loyalty. The service quality factors analyzed were collections, staff, programs, facilities, online services, and accessibility. To measure the effects of these factors, 3000 users of 60 public libraries across Korea were surveyed. The results of the survey indicated that users perceived the staff and facilities factors to be of high quality, whereas the programs and online services factors were perceived as lower quality. In order of influence, collections, accessibility, and facilities factors were found to be highly influential on overall satisfaction, while the programs and online services factors had relatively low influence. Additionally, while the overall satisfaction, convenience of visit, and facilities factors had a high influence on user loyalty, the collection and program factors had relatively low influence. Based on these results, this study makes recommendations to improve library services to meet users’ needs.
Keywords
Introduction
Research aims and background
As libraries and information centers shift to more user-centered services, it is necessary to better understand customer needs. In response to this shift, the field of library and information science has seen increasing calls for improved customer satisfaction and customer-centered management. One of the most fundamental methods through which unsuccessful public libraries can survive and improve is through customer evaluation, as libraries can obtain legitimacy based on this support.
In this changing environment, it is becoming increasingly necessary to provide improved library services that meet the demands of current library users, while encouraging new users to visit libraries. Basic requirements for sustaining a continuous user base include satisfying customers with outstanding services and increasing customer loyalty by giving satisfied customers reasons to continue using the library (Oh, 2005). Recent increased interest in the implementation of customer-centered library marketing theories or techniques, service quality measurement, and service quality and customer satisfaction, has in turn focused increased attention and research on to customer-centered business strategies.
Public libraries are rapidly evolving into cultural and regional hubs that provide various services to local residents. Because of these functional changes, any public library evaluation must measure not only the library’s tangible resources but also users’ satisfaction with the services provided. In order to more accurately evaluate libraries and promote innovation, Korea’s National Library Management Evaluation developed an evaluation index for each type of library, including public libraries. Additionally, public libraries have conducted user satisfaction surveys since 2009 in order to incorporate this metric into the measurement of library service quality (Korean Ministry of Culture, Sports, and Tourism, 2009). This is because the existing library evaluation index focuses solely on input resources, management, and output, without any index relating to the ultimate goal of library services: user satisfaction. This increased attention to user satisfaction reflects changing social demands; as living standards have improved, local residents demand increased benefits from public services, and evaluate these services critically (Pyo and Cha, 2009).
Thus, this study aims to analyze the major factors that influence user satisfaction with public library services in Korea, and how service quality and user satisfaction in turn influence user loyalty. Using data from the 2012 National Library Management Evaluation, this study measures the awareness, user satisfaction, and loyalty of 3000 users of 60 public libraries nationwide and analyzes the relationships between these factors. This analysis should help create and improve strategies to ultimately maximize user satisfaction with and loyalty to various libraries and information centers, including public libraries.
Limitations of study
The limitations of this study are as follows. First, the sample size of 3000 users covers only 60 of Korea’s 759 public libraries as of 2012; thus, there are limitations in generalizing the findings of this study to all public libraries in Korea.
Second, the 60 public libraries examined in this study received excellent management ratings in the 2012 Evaluation of National Library Operations conducted by the Committee on Library and Information Policy and the Ministry of Culture, Sports and Tourism. This may lead to satisfaction and loyalty ratings in this study that may slightly exceed the national average.
Theoretical background and literature review
Concepts of user satisfaction and loyalty
Customer-centered concepts, such as customer orientation and customer satisfaction, first gained attention in the private sector, which first prioritized customer awareness of products and services as key to corporate growth. After witnessing the success of this strategy, the public sector started to assign greater importance to a user satisfaction evaluation system. User satisfaction is closely related to customer loyalty, defection rate, repurchase rate, and new customer creation; thus, it is a significant metric not only for providers of products and services but also for users who wish to evaluate the performance of such organizations (Kim, 2006).
There is a variety of scholarly views on the concepts of user satisfaction and loyalty. Oliver (1981) and Elliott (1995) generally regarded user satisfaction as the emotional response of an individual user or customer to a certain deal or service, and defined it as a comprehensive psychological state that occurs when a customer’s actual experience differs from his or her expectations. Bitner and Hubbert (1994) said that two aspects are needed to evaluate user satisfaction in library services: encounter satisfaction (satisfaction or dissatisfaction with certain services) and overall service satisfaction (satisfaction or dissatisfaction with the overall organization based on various services and experiences). Furthermore, Matthews (2004) divided customer satisfaction into two types according to time of experience: the satisfaction felt by the user at the time the service is provided, such as receiving a reference number or checkout service, and the overall satisfaction felt from the long-term results of various services. The latter is due to a comprehensive judgment on service quality and thus can be used as a measure for service quality. In contrast, Hernon and Altman (1998) and Brophy (2006) claimed that, while user satisfaction is used as a measure to evaluate library service quality, the two concepts have fundamentally separate structures. As satisfaction can be affected by external variables such as the individual user’s subjective judgment or situation, it cannot be considered equivalent to objective library service quality.
Martensen and Gronholdt (2003) argued that, to measure user loyalty, it is necessary to investigate whether users intend to access more library services, whether they think it is important to patronize the library, and whether they intend to recommend it to other users. Similarly, Oh (2005) defined user loyalty as a user thinking of him or herself as a regular user, with the intention to reuse the library and to recommend it to others.
Measurement frameworks for service quality and user satisfaction
Since the 1990s, many companies, facing increasing competition, have begun to accept the necessity of a customer satisfaction management system to measure the quality of the goods and services they produce. One such measurement framework is the Customer Satisfaction Index (CSI) (Kim, 2008).
SERVQUAL is the service quality framework most frequently used in various service quality research fields, including marketing. SERVQUAL measures universal and general aspects of service, so it can be applied to many different service fields. The SERVQUAL framework consists of five dimensions (tangibility, reliability, responsiveness, assurance, empathy) and 22 subsections, measuring service quality as well as gaps between performance and expectation. However, Cronin and Taylor (1992) criticized SERVQUAL and proposed an alternative framework, SERVPERF, which measures service quality based on the customers’ perceived service results. They pointed out that, in SERVQUAL, as customers may not have any expectations if they lack prior knowledge or experience of the service, the repeated measurement of performance and expectation for the same items is useless. SERVPERF, on the other hand, measures the same 22 items as SERVQUAL, but defines and evaluates service quality using only service perception, removing the dimension of expectation. Therefore, not only does SERVPERF contain fewer survey items than SERVQUAL, SERVPERF enables the evaluation of service quality without considering expectations, which are difficult to measure (Kim and Nam, 2007).
The European Customer Satisfaction Index (ECSI), developed in 1998 by the European Commission of Technology, focuses on customer behavior, and uses a more practical method than previous models. The ECSI defines corporate image, customer expectations, customer-recognized quality of hardware, customer-recognized quality of human factors, and customer-recognized value as potential variables influencing customer satisfaction, which itself is the variable that in turn influences customer loyalty. The ECSI represents customer satisfaction by comprehensively reflecting corporate image, the level and characteristics of facilities related to purchasing goods or services, and the attitudes and human characteristics of service providers; it also shows the influence of customer satisfaction on behaviors that demonstrate customer loyalty, such as repurchasing, reselection, or recommendation to others. The field of library science has implemented various ECSI- based evaluation models to integrate the evaluation of service quality, user satisfaction, and loyalty (Kim, 2008).
A service quality measurement tool used frequently in the field of library science is LibQual+, which was developed to reflect the unique characteristics of libraries and information centers and to improve upon the limitations of SERVQUAL. LibQual+ was developed in the US as a cooperative effort between the Association of Research Libraries (ARL) and the Texas A&M University Library Research Team from late 1999 to 2003. It was proposed as a multidimensional measurement tool to subdivide and analyze the many dimensions that form library service quality, to gather user opinions on library service quality, and to observe, understand and enforce progress. The model was developed as a web-based survey tool to help with library marketing, improve library service evaluation, and change libraries’ organizational culture (Kim, 2006). LibQual+ evaluates a library’s minimum service level, desired service level, and perceived service performance on a 9-point scale, and calculates service quality by measuring the gaps between different levels. Following multiple quantitative and qualitative studies on the strengths and limitations of SERVQUAL, LibQual+ transitioned from measuring five dimensions and 41 items to three dimensions and 22 items to better suit university libraries’ service quality evaluation needs (Hong, 2005).
Research related to library user satisfaction and loyalty
Research by Martensen and Gronholdt (2003), and Chen et al. (2004) support the need for comprehensive analysis of library service quality, customer satisfaction, and loyalty. Using the ECSI evaluation model and analysis of previous literature related to overall library quality and user satisfaction, they presented a model for evaluating users’ perceptions of, satisfaction with, and loyalty to library services. Their model used six potential variables: (1) electronic resources, (2) print publications, (3) other services, (4) facilities, (5) reading environment, and (6) staff professionalism and attitude.
Relevant studies concerning user satisfaction with public library services in Korea include Cha (2011), Kim (2006), Lee (2002), Moon and Lee (2006), Oh (2005), Pyo and Cha (2009), and Ryu (2004). Lee (2002) used marketing’s theory of service quality to measure and analyze the major library service quality factors expected by customers, and built a model to evaluate public library service quality by prioritizing improvement factors according to how they were weighted by customers. Oh (2005) empirically analyzed the relationship between factors that influence public library service quality (printed publications, Internet and electronic resources, cultural programs and services, library facilities and environment, and staff) and public library users’ overall satisfaction, the frequency of complaints, and loyalty. After analyzing prior research, Kim (2006) created a specialized customer satisfaction evaluation system for public library services, as well as a public library service classification system, that reflects public libraries’ increasingly digital focus. Pyo and Cha (2009) developed a public library user satisfaction index items based on previous studies and index development cases to correct the imbalance in the library management-focused quantitative index. After classifying libraries by management principals and size, they conducted a pretest to analyze the reliability, validity, and redundancy of the index. They designed the final index to investigate user satisfaction in the 2009 National Library Management Evaluation. Cha (2011) conducted a user satisfaction survey of public library patrons nationwide by developing an index from six factors highlighted in previous research (Pyo and Cha, 2009): (1) collections, (2) staff, (3) facilities, (4) programs, (5) online services, and (6) provided information. He then analyzed users’ level of satisfaction with Korean public library services, and discussed the influence of these factors, as well as library service quality, on user satisfaction.
Additionally, many studies have attempted to develop tools to measure service quality based on customers’ perceptions of services (Hernon and Nitecki, 2000; Lee, 1998; Oh and Kim, 2006; Oh and Noh, 2005; Paik and Lee, 2000; Shi et al., 2004). These studies aimed to uncover the major factors that affect service quality in libraries and information centers in order to increase user satisfaction.
Research methodology and framework
Details of the research
The following process was used to measure user satisfaction with and loyalty to Korea’s public libraries, and to analyze the results.
First, we reviewed relevant literature to investigate the concepts of user satisfaction with and loyalty to public libraries, and to examine the management evaluation implications of public library user satisfaction surveys. After revising and supplementing the user satisfaction survey index employed by the 2009 National Library Management Evaluation, we extracted 50 users of 60 public libraries that received on-site evaluations for the 2012 National Library Management Evaluation, and conducted phone surveys regarding user satisfaction and loyalty with a total of 3000 public library users nationwide.
Using the results of this survey, we first analyzed overall library user satisfaction, and then investigated and analyzed six factors of library service quality – collections, staff, facilities, programs, online services, and convenience of visit – for each user characteristic and library characteristic. We then conducted regression analysis and path analysis to determine the relationship between the six library service quality factors and overall user satisfaction, and the relationship between library service quality factors, overall user satisfaction, and loyalty. This study aimed to uncover the factors that influence overall user satisfaction, the factors that influence overall user loyalty, and how influential each of the factors is.
Research framework design
This study established a new research framework by revising and supplementing the user satisfaction survey indices developed in previous research. Figure 1 details the dimensions of this framework.
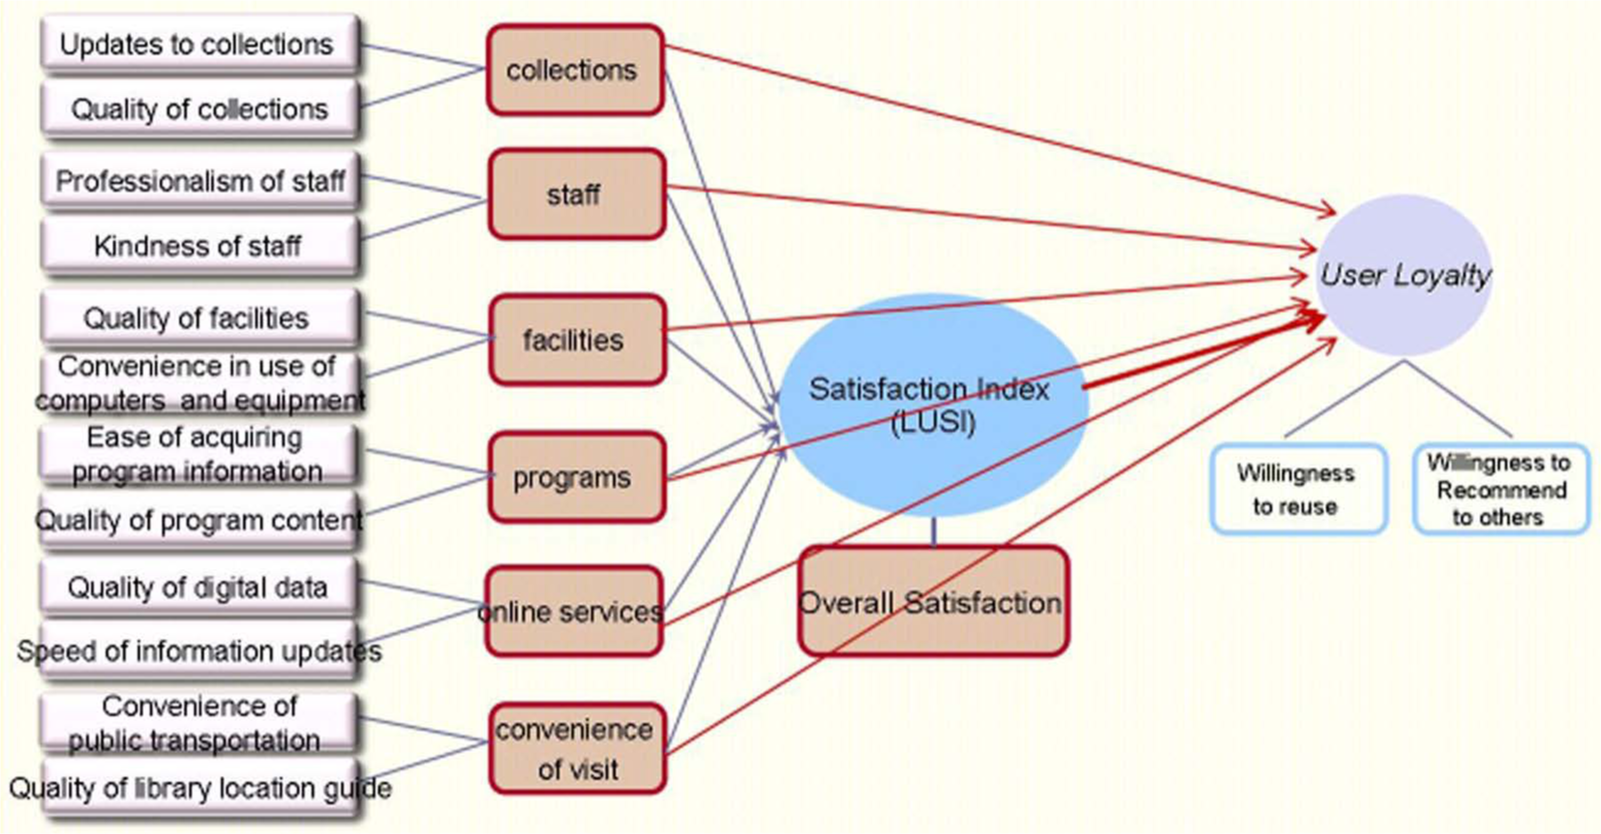
Research framework.
This study comprehensively reviewed the dimensions measured by several indices used in previous research. SERVQUAL analyzes service quality by the dimensions of tangibility, reliability, responsiveness, assurance, and empathy, while LibQual+ uses service influence, place, and information management. Martensen and Gronholdt (2003) used seven variables for analysis – print publications, electronic resources, other services, technical facilities, library environment, human element of user services, and user value – while Oh (2005) used five: printed publications, Internet and electronic resources, cultural programs and services, library facilities and environment, and staff.
Using prior research as a guide, this study divided library service quality into six representative variables: (1) library collections, (2) library staff, (3) library facilities, (4) library programs, (5) library online services, and (6) convenience. These variables encompass the basic factors of library management, such as materials, facilities/environment, and human resources, along with other variables, such as online services (one of the most important library services today), and cultural programs.
We analyzed these six service quality factors by each respondent type and library type, and conducted regression and path analyses to determine the influence of these variables on overall user satisfaction, as well as the influence of these variables and overall user satisfaction on user loyalty.
Research methodology
This study investigated user satisfaction as a means of evaluating the quality of public library services in Korea through six quality variables and the additional variable of overall satisfaction variable. It also measured the loyalty of public library users nationwide through the variables ‘willingness to return’ and ‘willingness to recommend to others’.
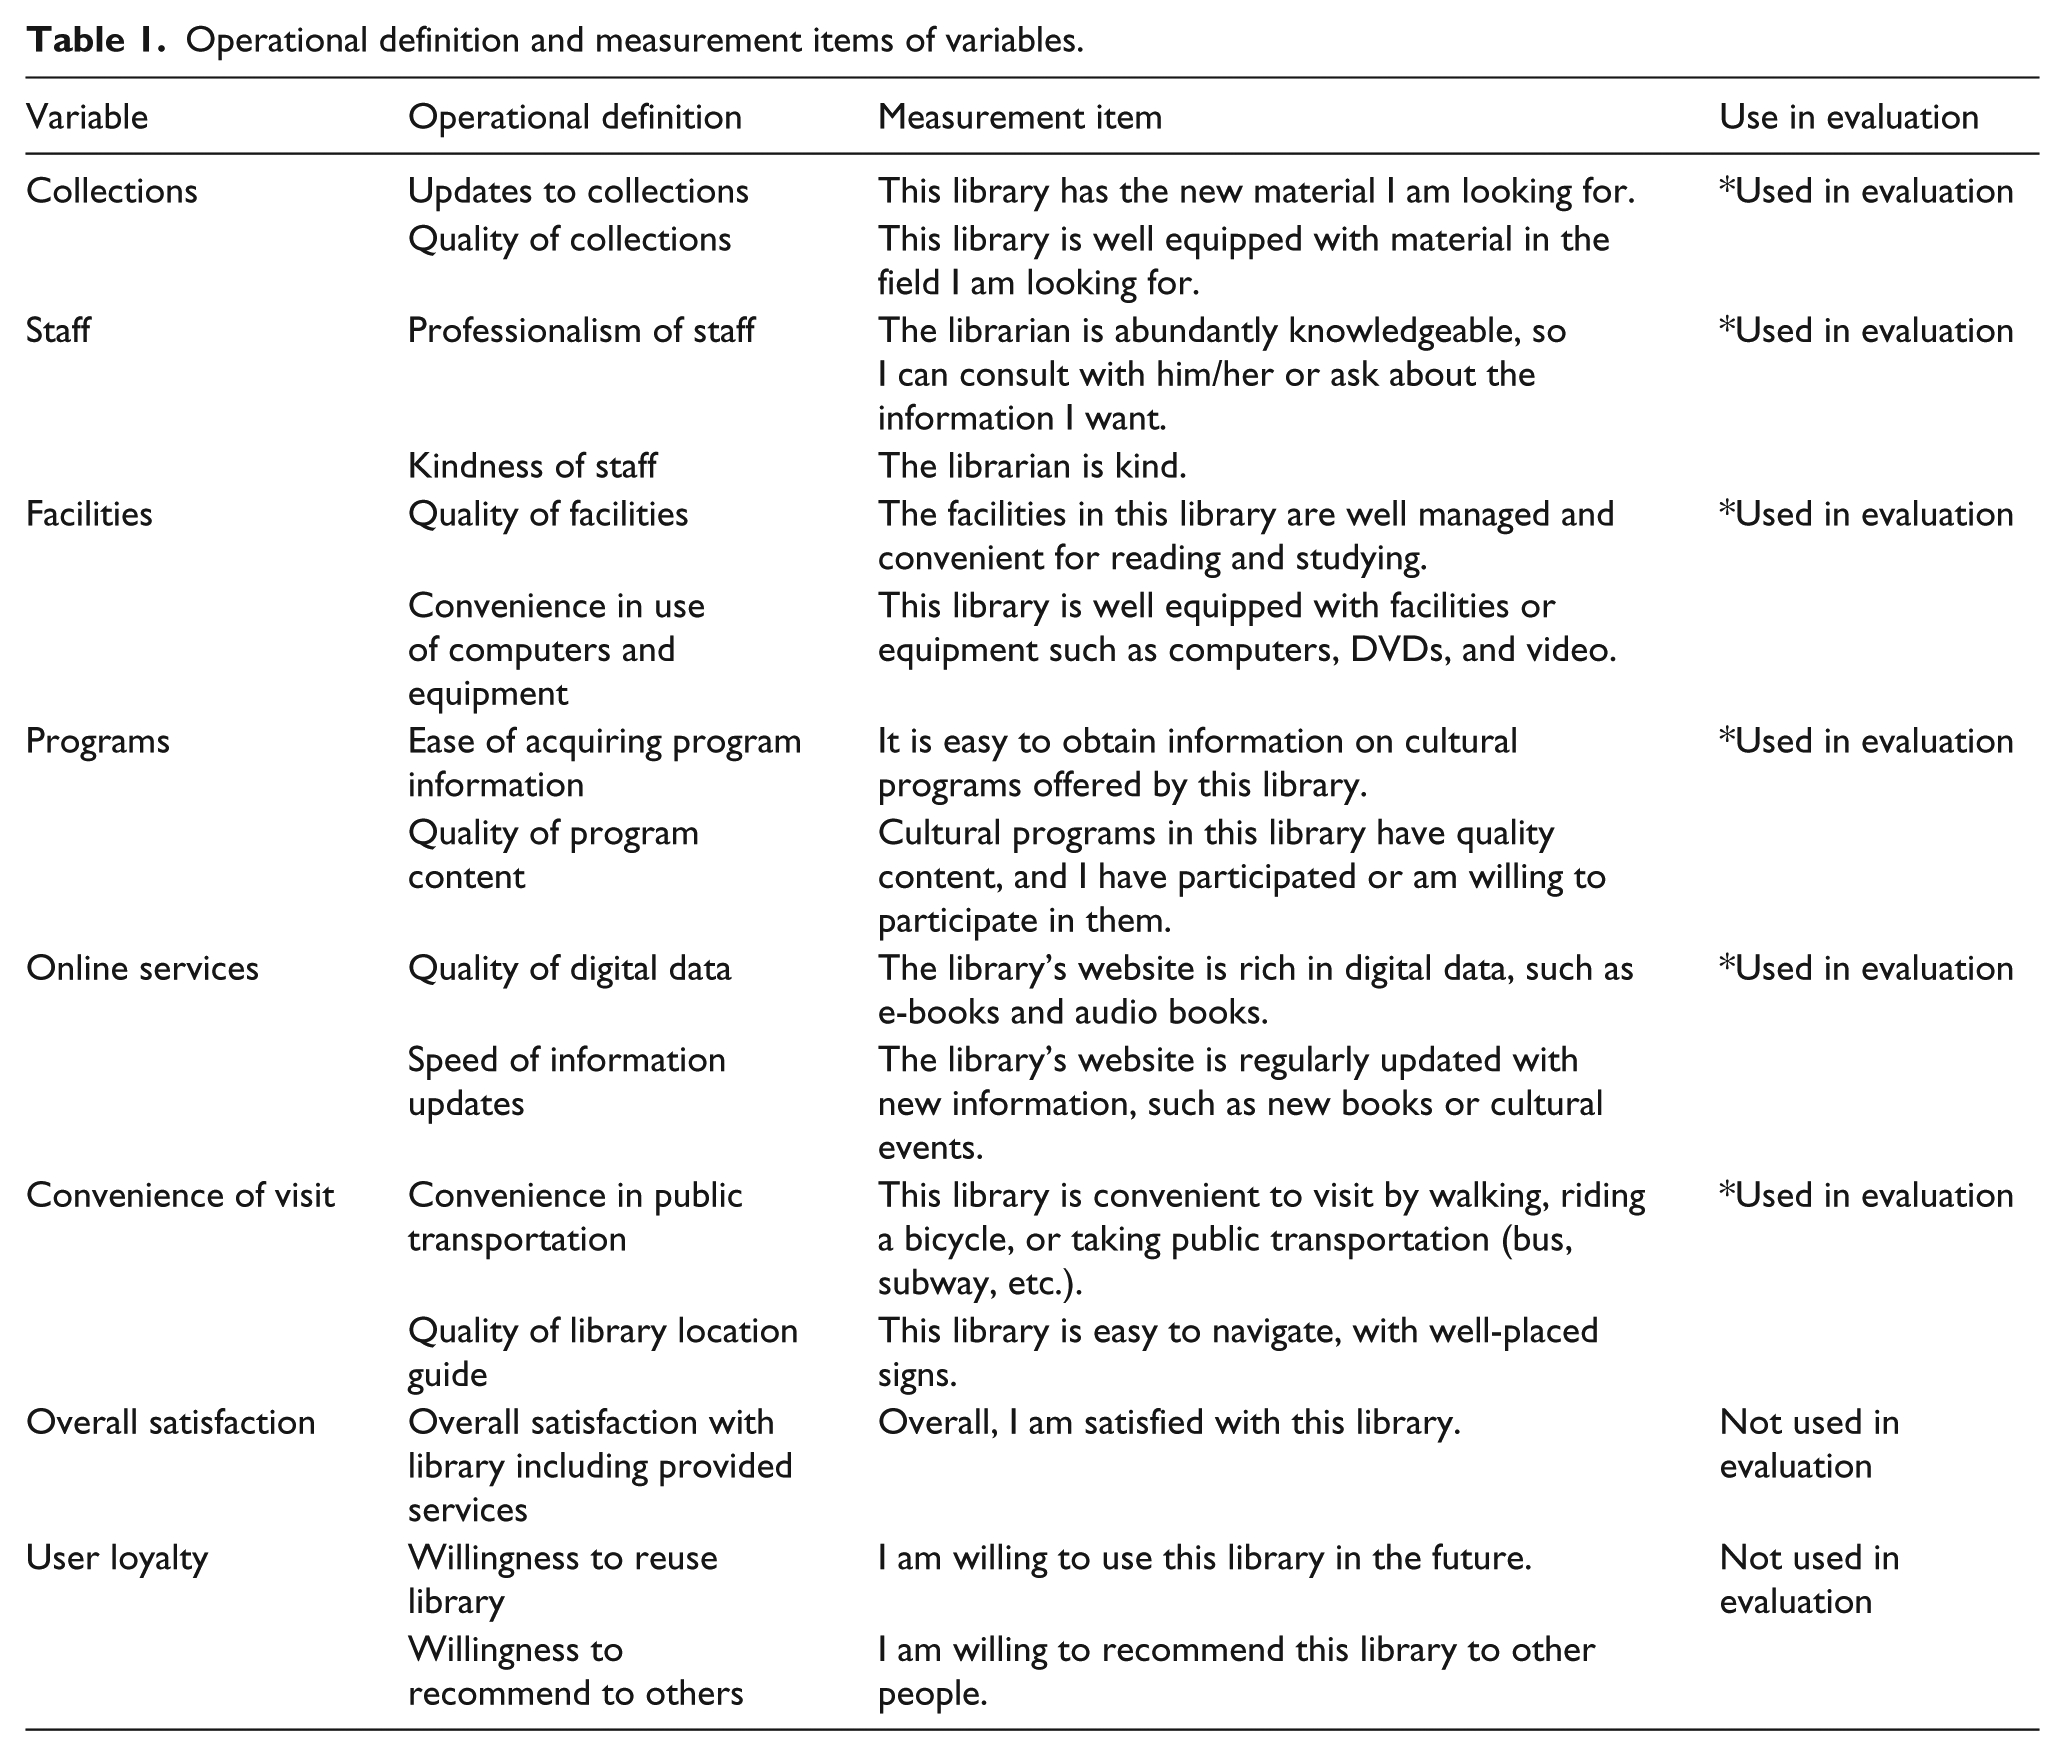
Table 1 lists the operational definitions and measurement items of the variables used in this study. All variables are measured using Likert’s 5-point scale, ranging from ‘very unsatisfactory’ or ‘not at all’ (1 point) to ‘very satisfactory’ or ‘definitely’ (5 points). Users could only select ‘not applicable’ if they lacked experience with certain services.
Operational definition and measurement items of variables.
Of the 759 public libraries that participated in the primary stage 2 of the 2012 National Library Management Evaluation, 60 were selected for a secondary evaluation. The sample was limited to these 60 libraries due to limitations in budget, time, and procedures preventing a general census of all 759 libraries nationwide.
We then compiled a list of users of each library who had checked out at least one book since 2011. From this list, we sampled 50 users from each library (3000 users total) using a method that selected participants according to gender and age. Phone surveys were conducted among this sample from 18 to 28 August 2012, using technical researchers who had received prior training from a professional investigation agency. A survey of 450 users of nine children’s libraries was also conducted in the same investigation environment, using the same methods and materials as the survey of general library users. Valid sample data collected from the 3000 users was processed using SPSSWIN 15.0.
Public library user satisfaction measurement results
Characteristics of respondents and descriptive statistics
The demographic characteristics of participants in the 2012 public library user satisfaction survey are as follows: 1501 men (50.0%), 1499 women (50.0%); 950 people below age 20 (31.7%), 517 aged 20–29 (17.2%), 505 aged 30–39 (16.8%), 524 aged 40–49 (17.5%), and 504 aged 50 and over (16.8%).
The 60 libraries in the user satisfaction survey are evenly distributed across regions, with 21 in Seoul (35%), 14 in Gyeonggi/Incheon (23%), 6 in Chungcheong/Gangwon (10%), 11 in Honam/Jeju (18%), and 8 in Yeongnam (13%). Of the libraries sampled, 36 were established by local governments (60%) and 24 by the Offices of Education (40%); 40 libraries were directly managed (67%), while 20 were in consignment (33%). As these demographics are typical of public libraries and library users throughout Korea, our sample is adequately representative.
Descriptive characteristics of measurement tools and reliability verification
This study conducted a user satisfaction survey of 3000 users of 60 public libraries nationwide using six established library service quality variables and the additional variable of overall satisfaction. All variables were measured using a 5-point Likert scale, and were coded consistently so that higher values indicated a more positive response. The variable with the lowest average satisfaction rating was online services with 3.88, while the variable with the highest satisfaction rating was staff with 4.13. Analysis of the satisfaction survey results will be described in detail later in this paper.
To verify the reliability of the scales used in this study, we applied an internal consistency reliability measurement method using Cronbach’s alpha coefficient. This method increases the homogeneity of the measurement tool and enhances reliability by finding and removing items that hinder reliability when various items are used to measure the same concept. The Cronbach’s alpha value for each variable is over 0.8, ranging from 0.883 for online services to 0.900 for convenience of visit, showing adequate consistency, both internally and across items.
Analysis of overall library user satisfaction
Overall library user satisfaction results
First, we estimated the library user satisfaction index (LUSI) of all 3000 participants. To accurately calculate a LUSI using complex causal and correlative relationships between dimensions (variables), we developed a ‘user satisfaction index model’ that employed a multi-dimensional structural equation model, 3 rather than a single-dimensional model. The user satisfaction index extracted the path coefficient of each variable from a goodness-of-fit test of the structural equation model (as shown in Figure 2) to calculate dimension importance and dimension service quality. The equation for the overall library user satisfaction index is as follows:

Yi: dimension service quality, Si: dimension importance, p: no. of dimensions
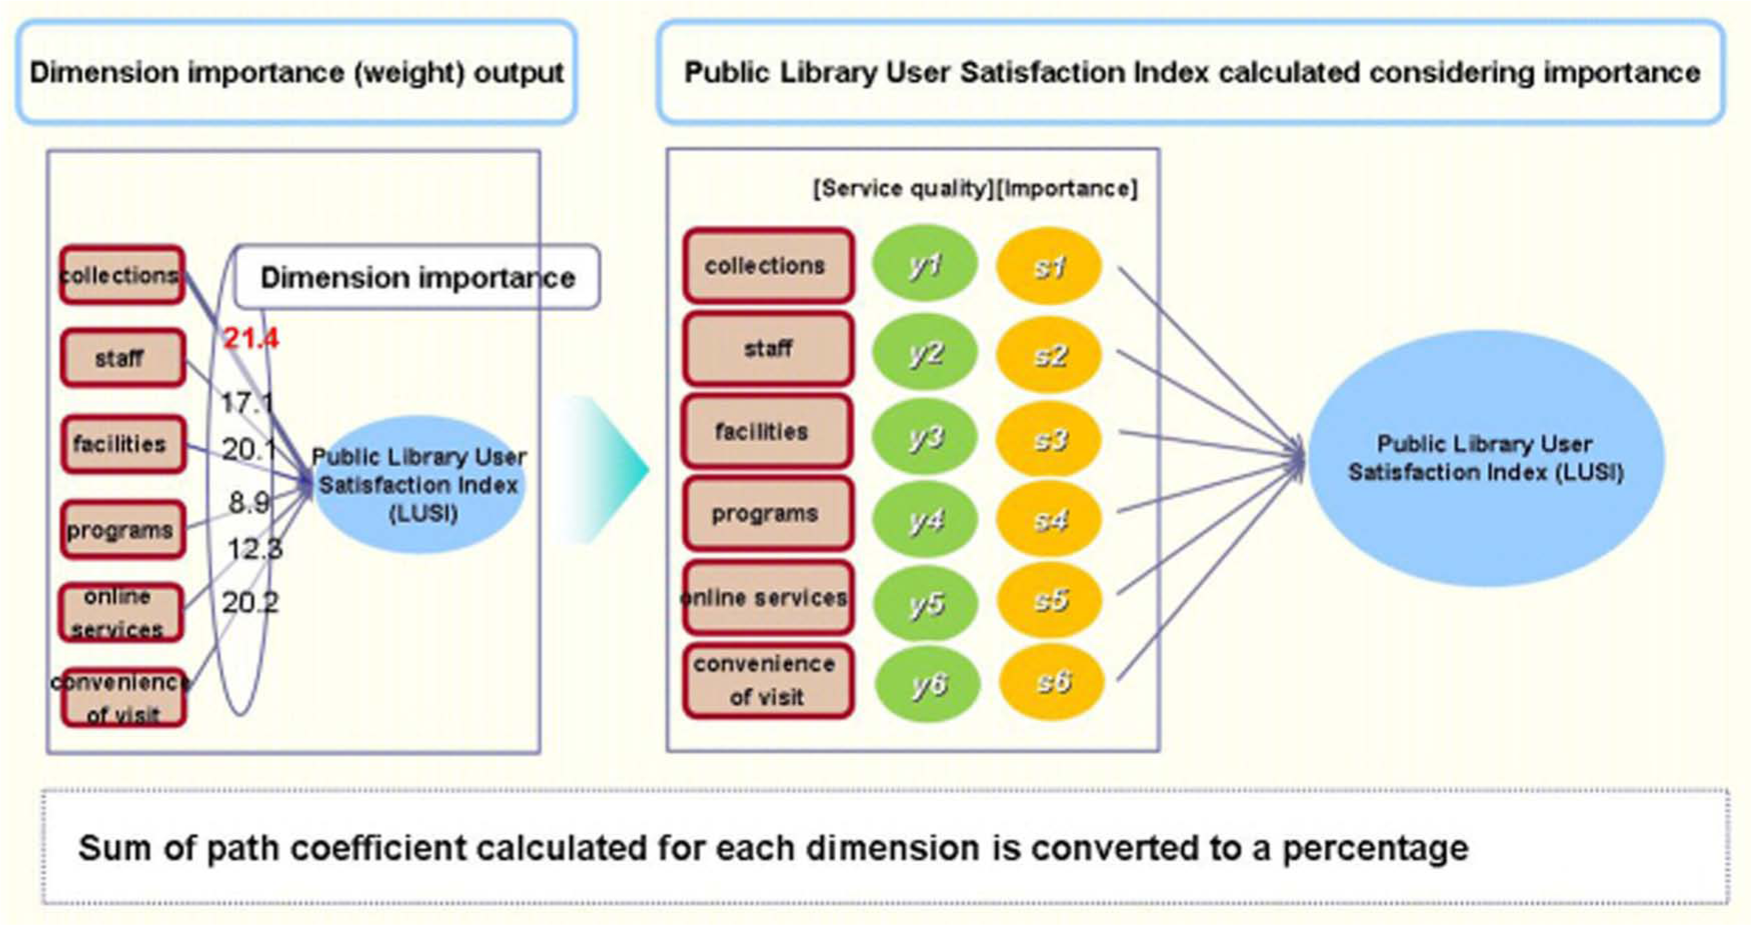
Method for determining the library user satisfaction index (LUSI).
We used a goodness-of-fit test on the structural equation model to deduct the importance of each dimension, and used this, as well as the service quality extracted for each measurement variable, to calculate overall library user satisfaction. The resulting national library user satisfaction index, when converted to a percentile value, was 80.2%. Figure 3 shows the analyzed results.
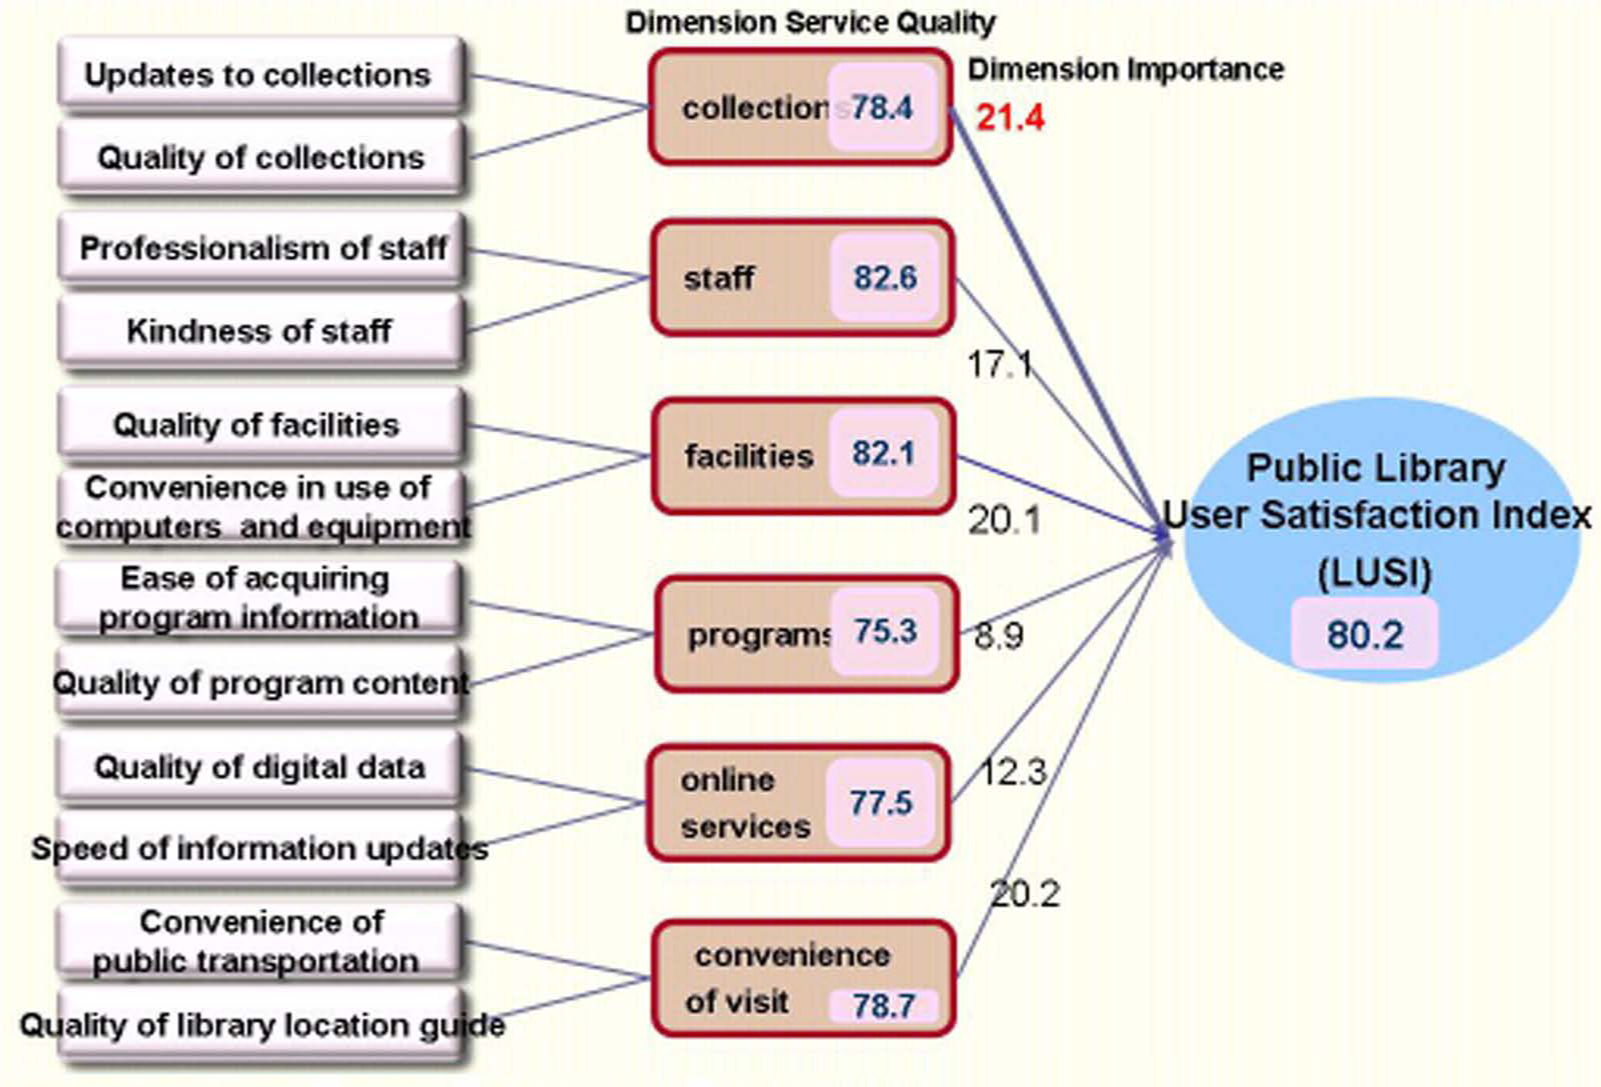
Result of public library user satisfaction index (LUSI).
Overall library user satisfaction index analysis
Quality analysis of each library service variable shows that staff (including staff professionalism and staff kindness) and facilities (including standard of facilities and convenience of the use of computers and equipment) received the highest ratings of all variables, with 82.6 and 82.1 points, respectively. In contrast, programs (including ease of acquiring program information and quality of programs) and online services (including quality of digital data and speed of information updates) received the lowest ratings, with 75.3 and 77.5 points, respectively. Moreover, the programs and online services variables were found to be of particularly low importance (8.9 and 12.3 points, respectively) when compared to other variables.
Analysis of service quality for each user characteristic
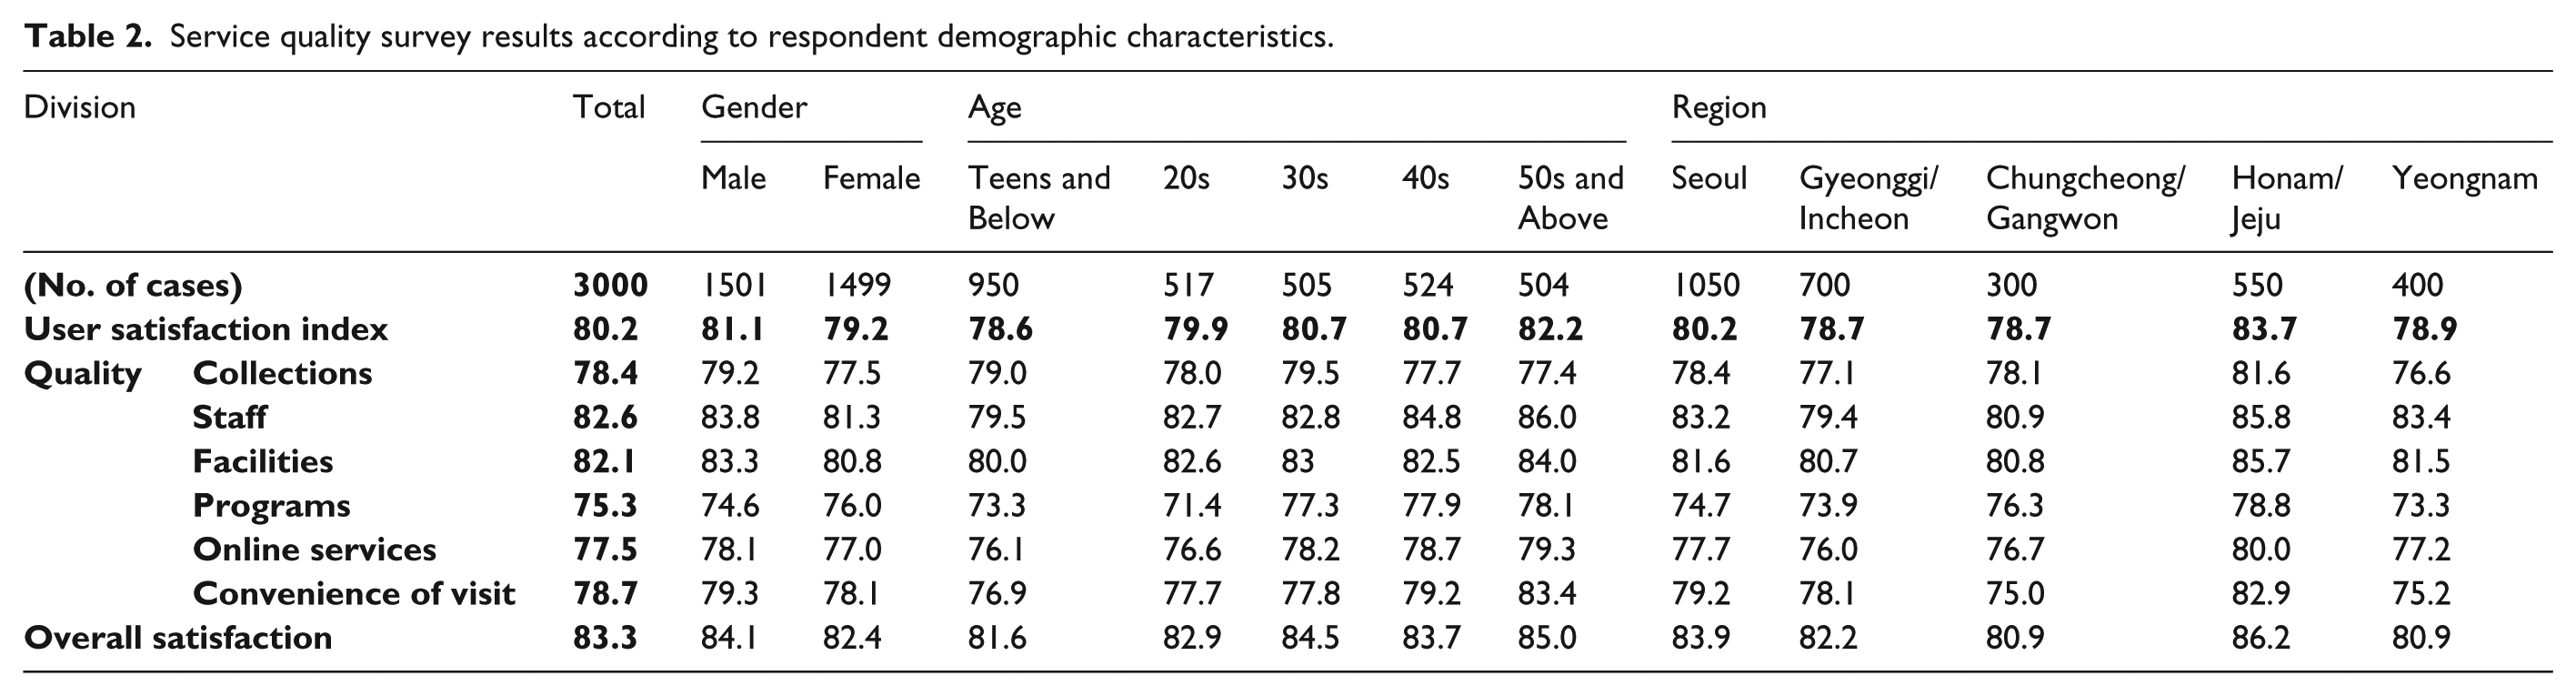
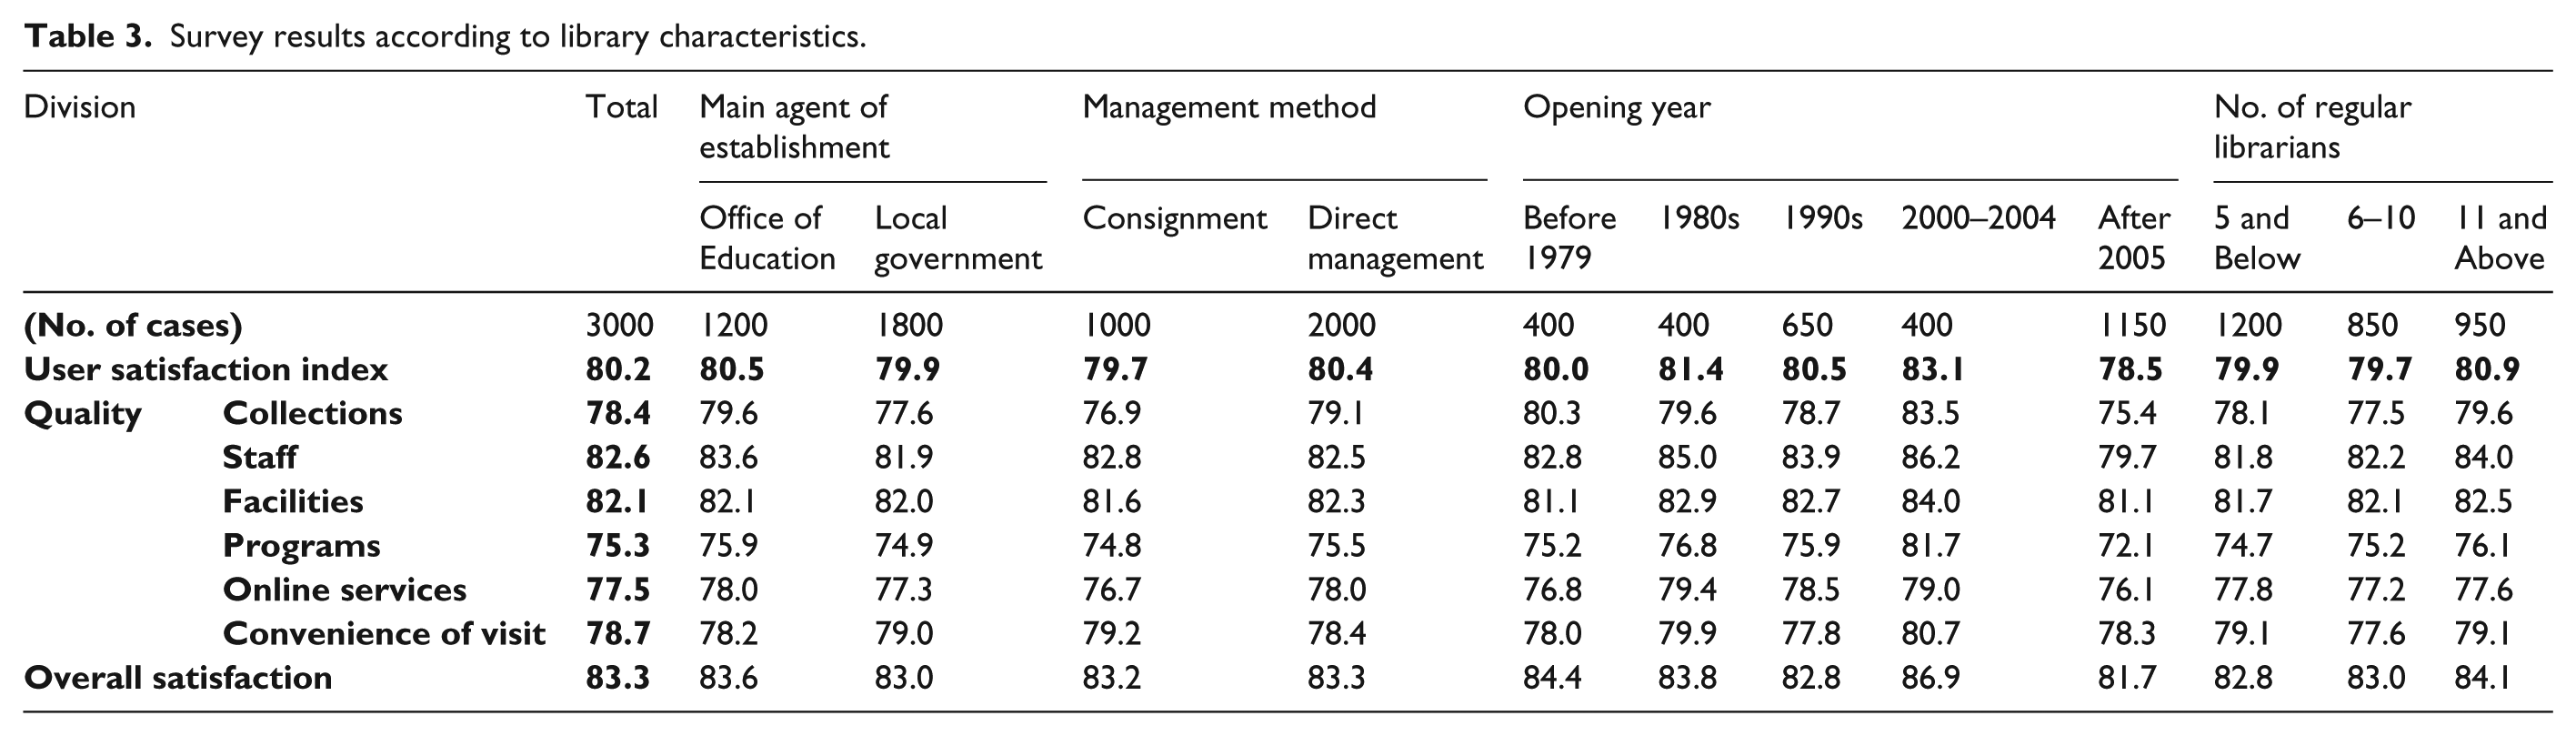
Table 2 classifies the service quality survey results for each variable, including the overall library user satisfaction index, according to respondent demographic characteristics, while Table 3 divides the survey results according to library characteristics. Based on the results of Tables 2 and 3, we will analyze the service quality of each variable and characteristic.
Service quality survey results according to respondent demographic characteristics.
Survey results according to library characteristics.
Service quality analysis of the collections variable
The service quality rating for the collections variable across all libraries is 78.4. When examining this variable against each library characteristic, the quality of collections was rated relatively highly in libraries established by the Office of Education, libraries under direct management, libraries that had opened between 2000 and 2004, and facilities containing 11 or more librarians. These survey results suggest that a library with one or more of the above characteristics is more likely to have a systematic collections policy that is established and executed by professionals, thus proportionally improving the quality of the library collections.
Service quality analysis of the staff variable
The service quality of the staff variable received an overall rating of 82.6. The ‘professionalism of staff’ item received a rating of 79.0, while the kindness of staff item was rated 86.2, indicating that staff kindness in public libraries is considerably high, whereas staff professionalism falls short of users’ expectations. Possible methods to improve this rating in the future include hiring more top-quality librarians, reinforcing job training to enhance staff professionalism, and introducing subject-specialized librarians to provide professional services.
Service quality analysis of the facilities variable
The facilities variable received a service quality rating of 82.1. Regardless of the main agent of establishment and the number of regular librarians, it was found that libraries using the direct management method, as well as those that opened between 2000 and 2004, have relatively high-quality facilities. In particular, among newly built libraries, those opened between 2000 and 2004 show the highest service quality, suggesting that libraries that have had over five years to establish themselves provide users with more convenient and comfortable facilities than those built within the last five years.
Service quality analysis of the programs variable
The service quality of the program variable is 75.3, the lowest among all six variables. Service quality was rated relatively highly by female respondents, and by respondents aged 30 and above. These results imply that women are the primary participants in library reading and cultural programs, especially housewives in their 30s with young children, who participate in major programs such as readings, book discussions, and child guided-reading programs. However, the fact that the ‘programs’ variable received the lowest rating of all six variables, indicates that, although libraries have recently increased their program offerings as they become cultural complexes, user satisfaction is still not particularly high.
Service quality analysis of the online services variable
The online services variable received an overall service quality rating of 77.5. The ‘sufficiency of digital data’ item was rated 75.7, a lower rating than the speed of information updates item at 79.4. This indicates that, while public library websites contain information on various services and offerings, such as new books and cultural programs or events, users think that public libraries provide insufficient digital content, such as e-books and original DB, and so perceive them as having relatively low online service quality overall.
Service quality analysis of the convenience of visit variable
The service quality of the convenience of visit variable was rated 78.7. This variable was rated relatively highly for libraries that were established by the local government, managed under consignment, and that opened after 2000, regardless of the number of regular librarians. These results suggest that when libraries are built by local councils, effort is made to position the library and secure a site that is convenient and accessible to local residents. The high ratio of importance (20.2) to service quality (78.7) for this variable indicates the need for careful review of these elements when planning the construction and development of future public libraries.
Analysis of the relationships between service quality variables and overall satisfaction
To examine the relationship between the six service quality variables and overall user satisfaction, we conducted a regression analysis using these variables. This analysis examines how users’ overall satisfaction influences their perceptions of the library and the quality of each its services, in turn revealing which of the six quality factors influences overall user satisfaction, and to what degree. The results of this analysis are shown in Table 4.
Influence relationship between service quality variables and overall satisfaction.
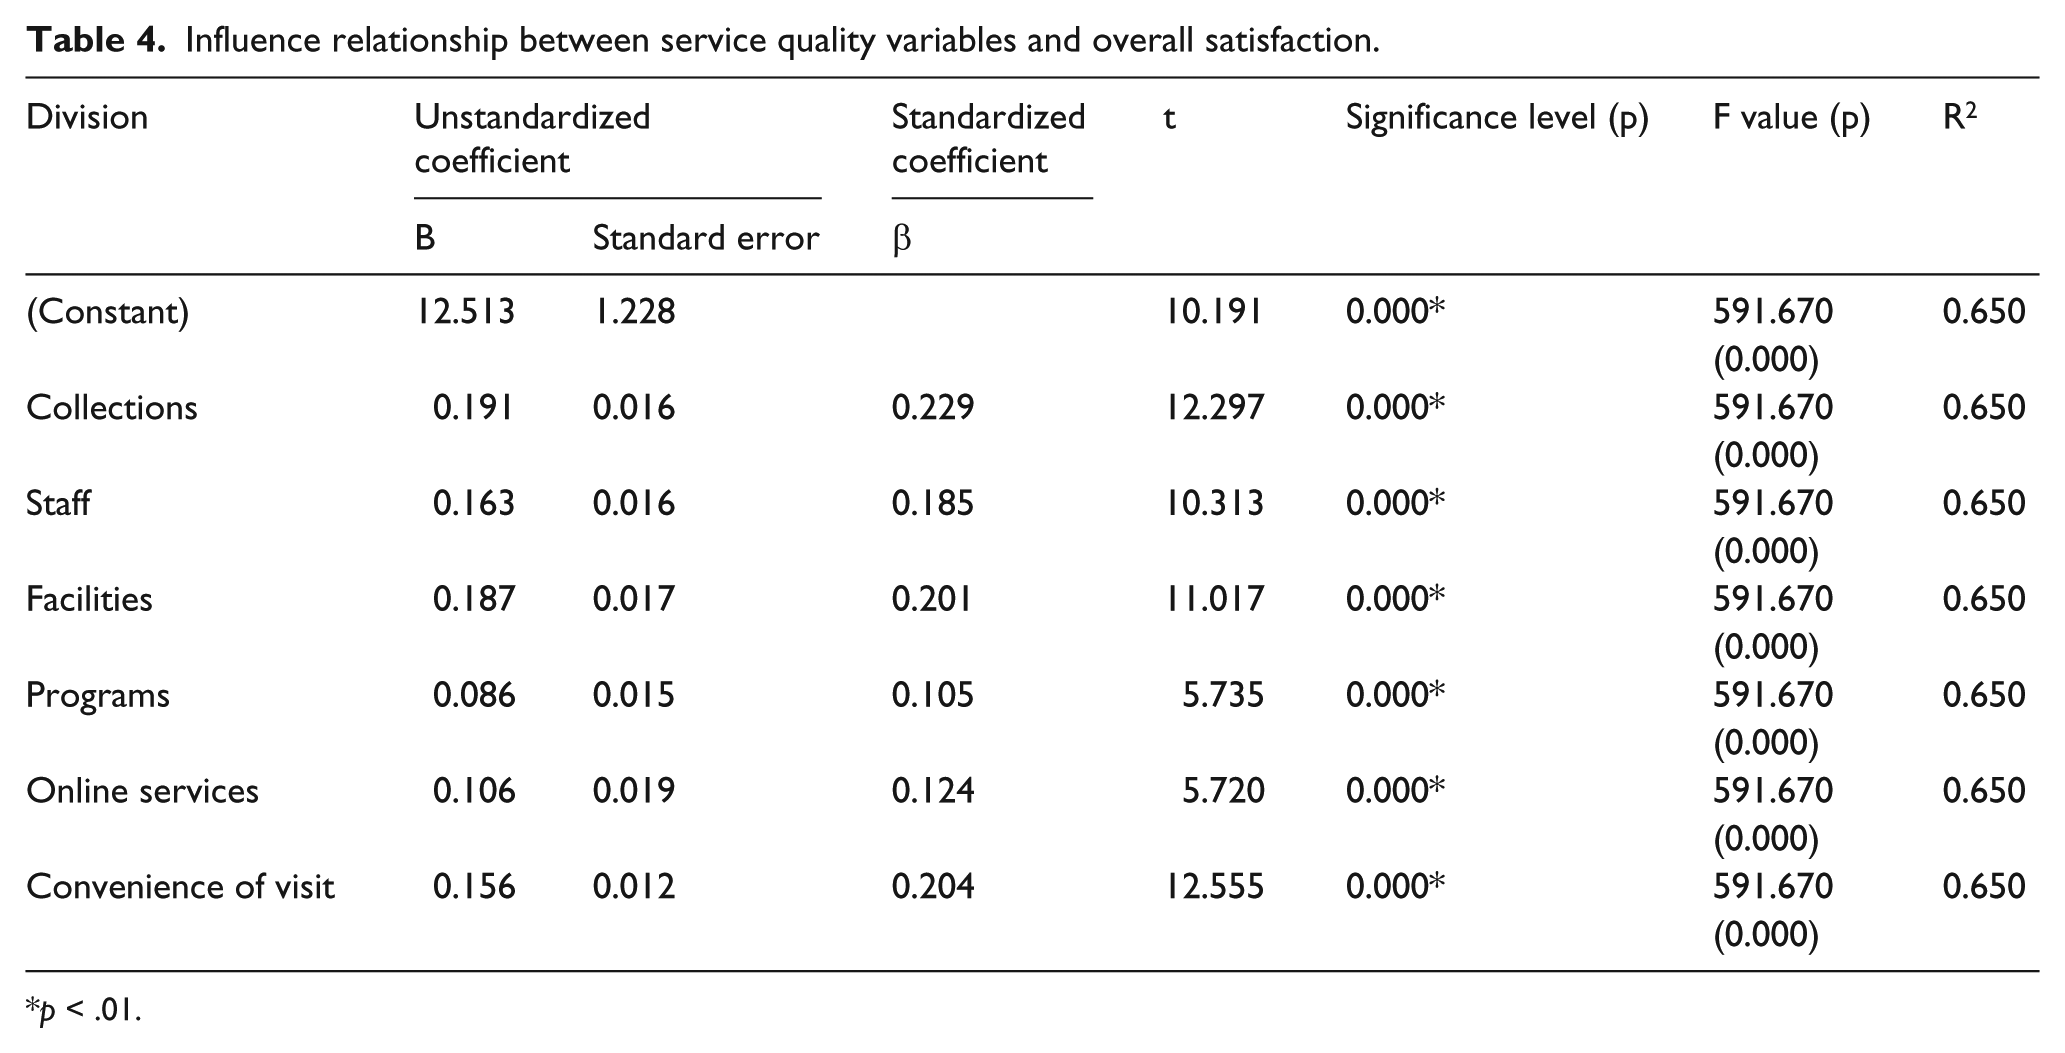
p < .01.
As can be seen in Table 4, the collections, staff, facilities, programs, online services, and convenience of visit variables all have a significance level of at least 0.01, and thus appear to significantly influence overall satisfaction. The collections factor (standardized coefficient = 0.229) has the most influence on overall satisfaction, followed by the convenience of visit factor (standardized coefficient = 0.204), and the facilities factor (standardized coefficient = 0.201). In contrast, the programs factor (standardized coefficient = 0.105) and the online services factor (standardized coefficient = 0.124) have relatively little influence. However, other than the ‘collections’ factor, the difference in influence between these factors is small.
The survey results for each variable analyzed in the previous section showed that the highest-quality variable is staff, followed by facilities, convenience of visit, and collections. However, their order of influence is inversely proportional, with collections showing the highest influence, followed by convenience of visit, facilities, and staff.
Public library user loyalty measurement results
Analysis of overall library user loyalty
Using the same 3000 participant sample size as in the user satisfaction survey, we conducted a public library user loyalty survey by investigating the variables ‘willingness to reuse’ and ‘willingness to recommend to others’, as shown in Table 1. As in the previous survey, user loyalty was measured on a 5-point Likert scale and coded consistently so that higher values indicated a more positive response. The Cronbach’s alpha value for the ‘user loyalty’ measurement variable exceeded 0.8 (0.895), validating the scale’s consistency.
Figure 4 shows the analyzed results of the user loyalty survey. When converted to a numerical percentage score, total library user loyalty was 90.0. The path coefficient calculated by structural equation model analysis from library user satisfaction to user loyalty was 0.691. The ‘willingness to reuse’ and ‘willingness to recommend to others’ variables were 91.6 and 88.4, respectively, showing that level of loyalty was slightly higher when it came to users’ willingness to revisit the library.
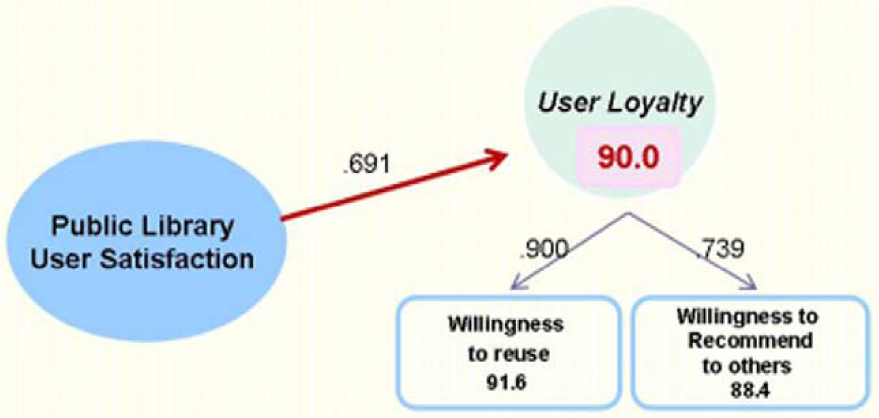
Total library user loyalty.
Analysis of influence relationship overall satisfaction and user loyalty
To identify the factors that influence user loyalty (that is, whether users frequently visit the library or recommend it to others), we conducted a regression analysis using the six library service quality variables and overall satisfaction as independent variables, and user loyalty as the dependent variable. In order to understand the whole influence relationship, including the indirect effect on user loyalty, we conducted a path analysis (hierarchical regression analysis) to determine the causal relationship between independent and dependent variables, and deducted the path coefficient using a standardized coefficient value. We then calculated the total effect of independent variables on the dependent variable by categorizing them as to whether their effect was direct or indirect. Table 5 displays the results of this analysis. The total effect of each variable (combined direct and indirect effects) is shown in Table 6.
Influence relationship between service quality variables, overall satisfaction, and user loyalty.
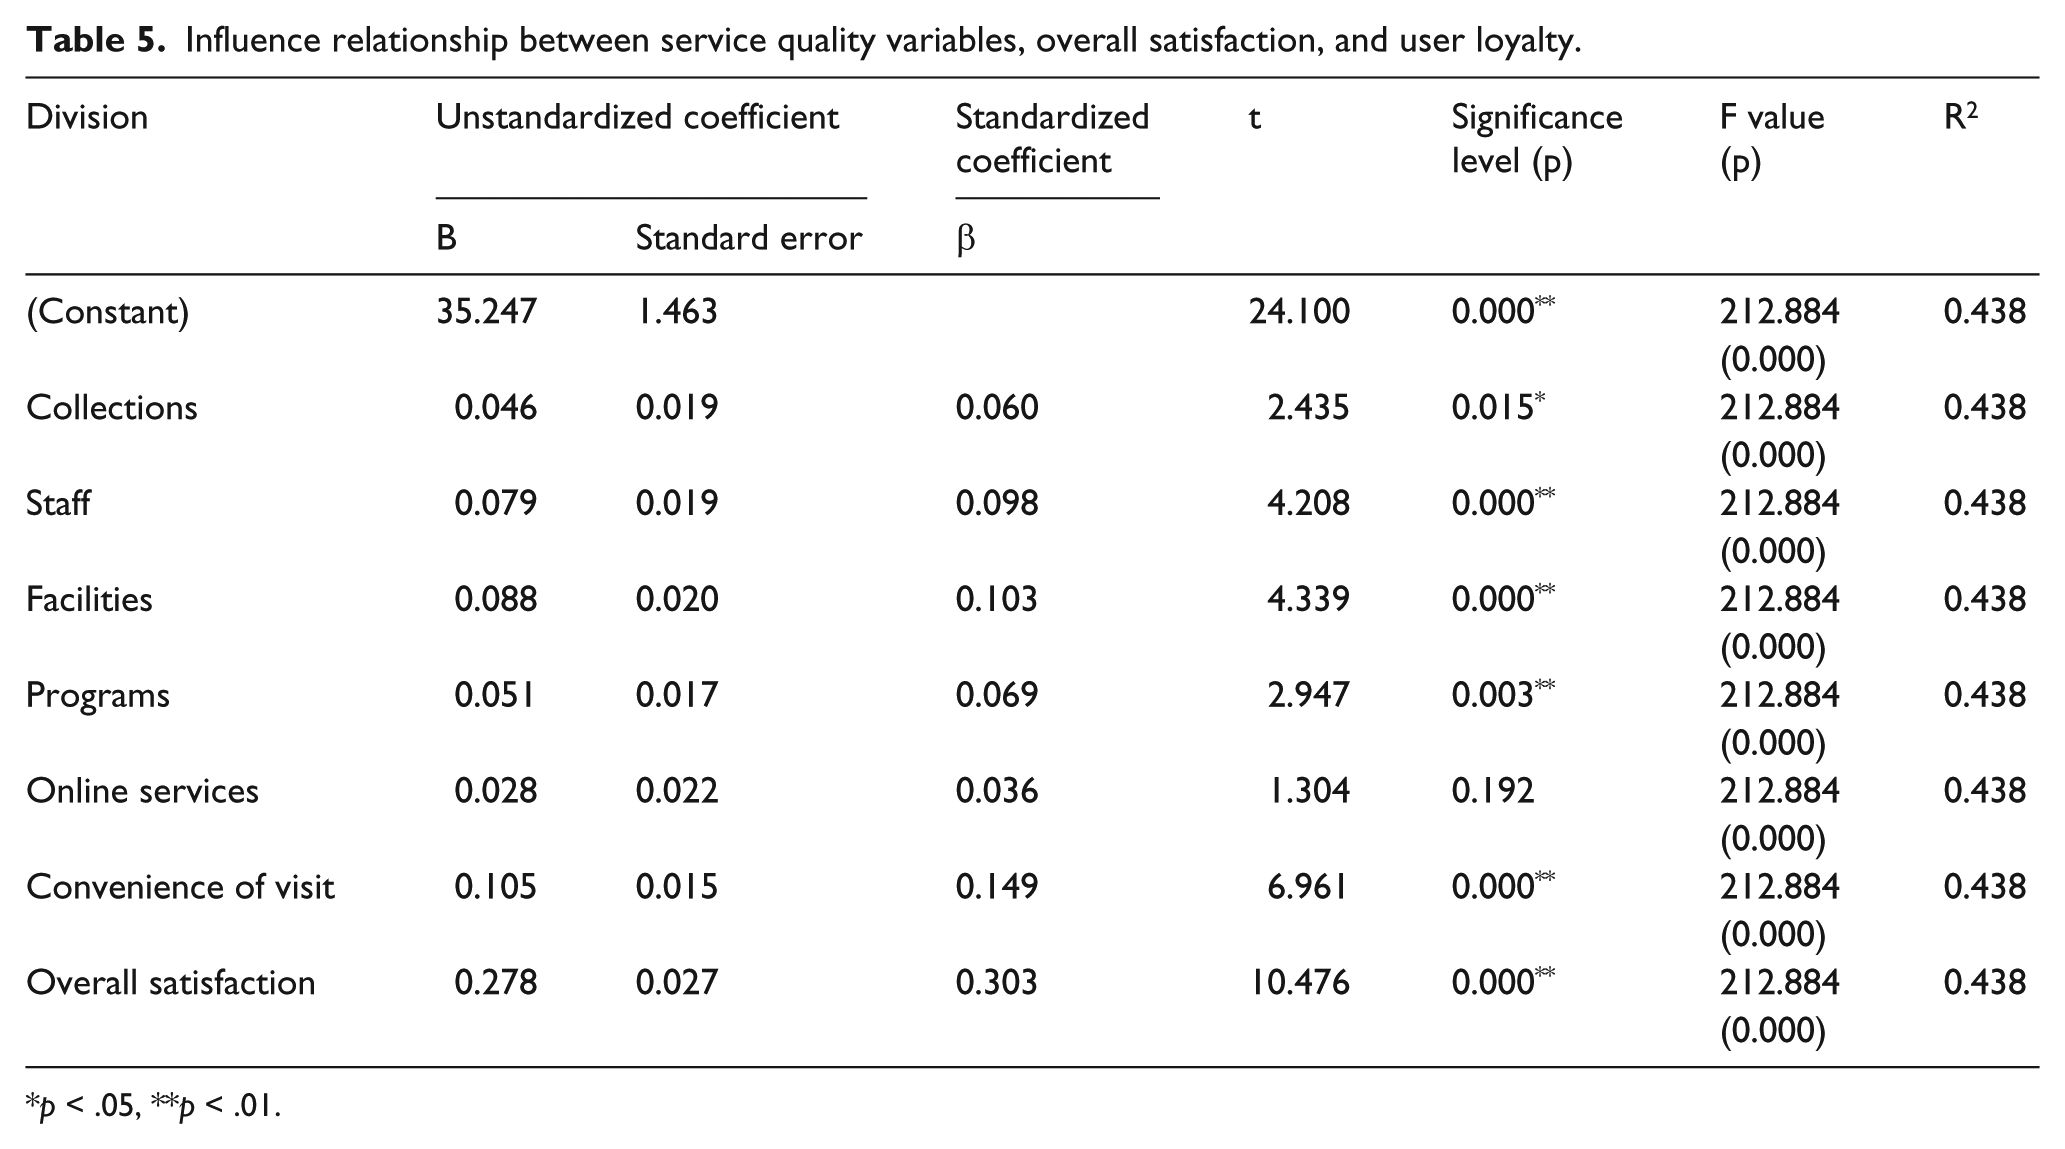
p < .05, **p < .01.
Total effect of each variable on user loyalty.
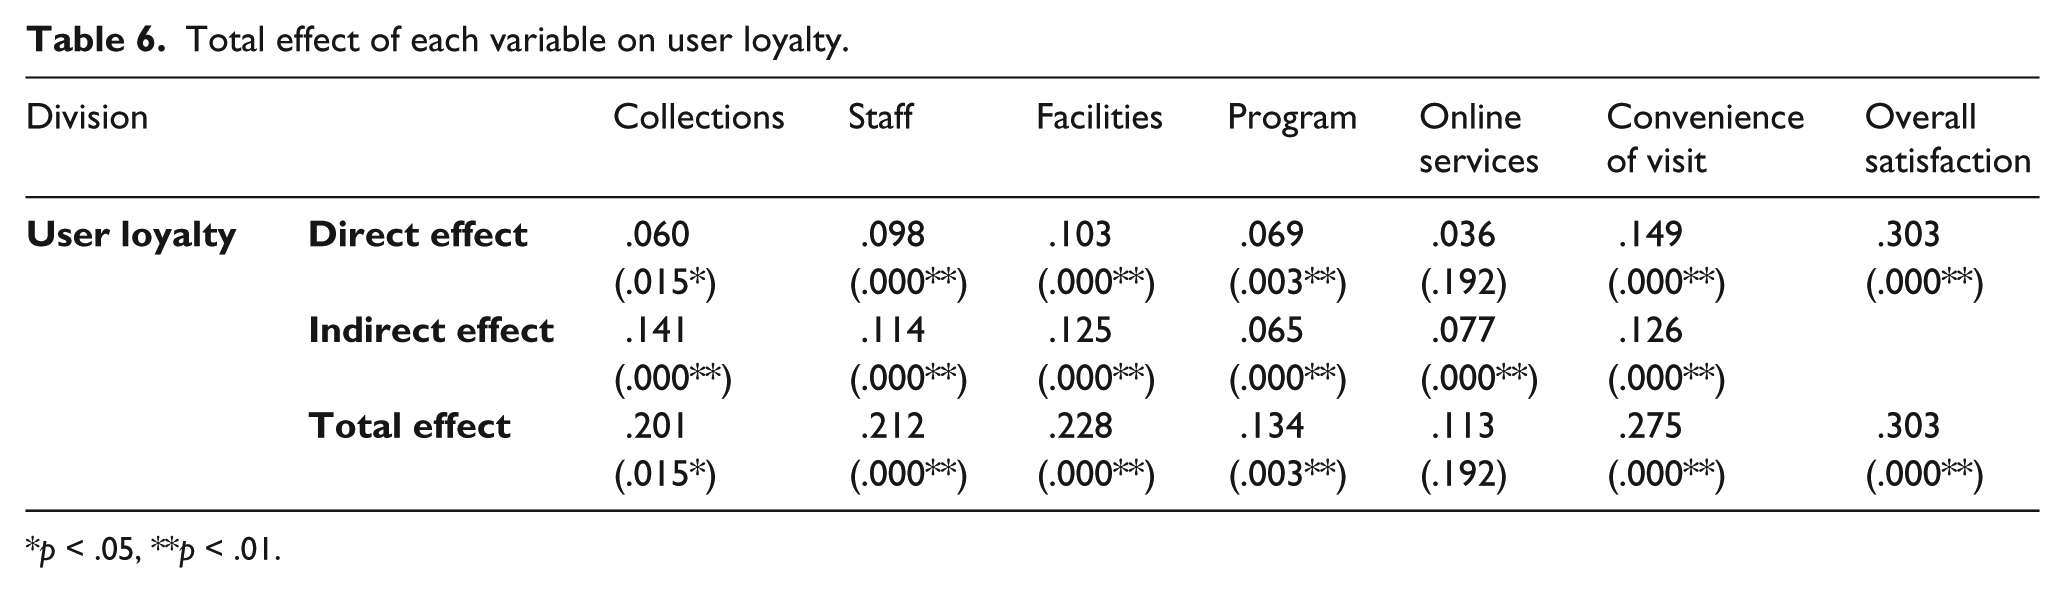
p < .05, **p < .01.
As can be seen in Table 5, collections, staff, facilities, programs, convenience of visit, and overall satisfaction are statistically significant variables that exert considerable influence on user loyalty; however, online services do not appear to have a statistically significant influence on user loyalty. Overall satisfaction (standardized coefficient = 0.303) was found to be the most influential factor on user loyalty, followed by convenience of visit (standardized coefficient = 0.149) and facilities (standardized coefficient = 0.103). In contrast, the collections (standardized coefficient = 0.060) and program variables (standardized coefficient = 0.069) have relatively little influence. However, excluding overall satisfaction, there is little variation in level of influence among the different variables.
Analyzing the effects of the six service quality variables’ direct and indirect on user loyalty shows that overall satisfaction (total effect: 0.303), convenience of visit (0.275), facilities (0.228), staff (0.212), collections (0.201), and programs (0.134) significantly influence user loyalty. As stated previously, online services were not found to have a significant influence on user loyalty; however, while the collections variable has an insignificant direct influence (0.060) on user loyalty, it has a relatively high indirect influence (0.141) on overall satisfaction compared to other factors, which shows that it has somewhat significant influence in terms of total effect.
Discussion
After surveying 3000 users of 60 public libraries in Korea, this study analyzed how satisfied Koreans are with public library services as a whole, and by each service quality factor. Moreover, this study analyzed the influence relationship between service factors and overall satisfaction, and between service factors, overall satisfaction, and user loyalty. This chapter presents a general analysis of each research finding, identifies additional points of discussion, and compares the results with the findings of previous studies.
Study of overall library user satisfaction index
Analysis of the influence of each variable of service quality on overall user satisfaction shows that users were relatively highly satisfied with staff (82.6) and facilities (82.1), whereas they had relatively low satisfaction with online services (77.5) and programs (75.3). Analysis of each variable’s importance revealed that programs (8.9) and online services (12.3) were of very low importance to users compared to collections (21.4), convenience of visit (20.2), and facilities (20.1).
This shows that, in general, the kind, professional employee service most frequently encountered in public libraries reflects high service quality. It is also apparent that local council’s gradual improvements of library facilities are positively regarded by users, as reflected in the relatively high quality rating of the facilities. However, gradually expanding reading and cultural programs, as well as libraries’ recent push to provide more online services, such as e-books and other digital content, still have a lower service quality rating than expected. Additionally, as convenience of visit was rated relatively higher than other factors in both service quality and importance, this factor should be carefully reviewed when building libraries in the future.
Study of influence relationship between service quality variables and overall satisfaction
After conducting a regression analysis to identify the influential relationship between the six quality variables and overall satisfaction, all factors were found to significantly influence overall satisfaction, with collections, convenience of visit, and facilities exerting the greatest influence. In comparison, programs and online services had relatively lower influence, although the influence difference between factors was small. The fact that collections appeared to have the biggest influence on user satisfaction supports the findings of similar previous studies.
These results show that users’ overall satisfaction with library services increases in accordance with six service quality factors: collections, staff, facilities, programs, online services, and convenience of visit. Additionally, it appears the quality of the following service factors significantly correlates to users’ overall satisfaction: collections, which ensures the library is sufficiently equipped with a variety of new materials; convenience of visit, which ensures the convenience of library visits through such methods as public transportation or library location guides; and facilities, which ensures comfortable and convenient use of library facilities and computer equipment. However, it can be interpreted that programs, such as reading and cultural programs, and online services, such as the library website and e-library services, do not have a direct and decisive influence on users’ overall satisfaction.
Study of influence relationship between service quality variables, overall satisfaction, and user loyalty
After conducting regression and path analyses to identify the service quality factors that influence user loyalty, overall satisfaction was found to be most influential, followed by convenience of visit and facilities. On the other hand, collections and programs had relatively low influence, while the influence of online services was not statistically significant. These results indicate that users are more loyal to public libraries if they have high overall satisfaction with the library, find it convenient to visit, or perceive the facilities as excellent.
Simultaneously considering the direct influence and indirect influence of service quality variables largely confirmed this result, showing that overall satisfaction (total effect: 0.303) had the most significant influence on loyalty, followed by convenience of visit, facilities, staff, collections, and programs. Thus, the overall satisfaction of library users appeared to be the most influential factor on user loyalty statistically, considering the direct influence or direct/indirect influences simultaneously. This shows that users’ overall satisfaction with libraries is directly connected to their loyalty to the library – that is, their willingness to revisit the library or to recommend it to others. In particular, the fact that overall user loyalty was rated 10 points higher than overall user satisfaction shows that highly satisfied customers are also highly loyal. Therefore, in order to maximize their user base, it is strategically important for libraries to prioritize current users’ overall satisfaction.
Comparison of findings with previous studies
This study’s findings regarding user satisfaction are extremely similar to those of Chen et al. (2004), which stated that library reading environment and print publications had the greatest influence on user satisfaction, as well as the findings of Martensen and Gronholdt (2003), which stated that print publication collections had the greatest influence on user satisfaction. However, our study slightly contradicts the research of Oh (2005), which found library staff to have the most significant influence on user satisfaction.
This study’s findings on user loyalty were also partially similar to the findings of Chen et al. (2004), which stated that reading environment and print publications have the greatest influence on user loyalty, as well as the findings of Oh (2005), which stated that the quality of library facilities and environment have the greatest influence on user loyalty. However, this conflicts with the findings of Martensen and Gronholdt (2003), which stated that staff professionalism and attitude had the most significant influence on user loyalty. That said, ultimately this study confirms the results of all three of the abovementioned studies with regard to the finding that overall user satisfaction significantly influences user loyalty.
Conclusion and suggestions
In order to analyze the factors that influence service quality in public libraries in Korea, this study objectively examined factors that influence library user satisfaction and loyalty. Based on this study’s findings, we will now provide policy suggestions to improve public library services in the future.
The fact that the programs and online services showed relatively low service quality has significant implications for improving public library services in the future. As libraries gradually become regional cultural complexes and shift focus to digital content such as e-books, it is necessary to improve the quality of the various reading and cultural programs provided for residents, as well as web-based and mobile online services. Basic infrastructure such as facilities, staff, and collections must form the foundation for proper public library management; however, this study implies that without improving content such as programs and online services, user satisfaction will not improve. To ensure simultaneously improved growth and user satisfaction, it is necessary to make more concentrated investments in these factors, such as enhancing the quality of reading and cultural programs, and expanding access to digital collections, such as e-books.
In order to improve user satisfaction with and loyalty to public libraries in Korea, it is also necessary to implement strategies to increase the number of highly loyal customers. When simultaneously considering direct and indirect influence, user loyalty is influenced most significantly by overall satisfaction, followed by convenience of visit, facilities, and staff, showing that users who perceive that visiting the library is convenient, that the library has excellent facilities, or who are highly satisfied with the library overall also tend to be highly loyal. Therefore, to increase the number of highly loyal public library customers in Korea, it is necessary to implement strategies to improve the above factors. With this in mind, we expect future studies to develop more specific implementation plans to improve public library services, and users’ satisfaction with them, in the future.
Footnotes
Funding
This research received no specific grant from any funding agency in the public, commercial, or not-for-profit sectors.