
Abstract
The present paper makes a systematic review of 131 articles on research productivity basing upon a model developed by Denyer and Tranfield. The current review paper analyzed the quantitative and qualitative dimensions of the sample literature in the field of research productivity. The quantitative analysis incorporates the chronological distribution of articles, keyword wise distribution, form wise distribution, discipline wise distribution, publisher wise distribution, data sources used in the articles, most prolific journals of the publications and qualitative dimensions studied are top-cited articles and all the metrices used in these articles. The paper is based upon literature retrieved from Scopus bibliographic database and other online databases like Emerald, Taylor & Francis, Google Scholar, JSTOR, ProQuest, and EBSCO for full-text articles. It was revealed that there is significant growth in the number of articles during the fourth decade (2011–2020) whereas the highest numbers of citations (1530) have been received during the third decade from 2001 to 2010. Journal articles appeared to be the predominant source of information. A wide range of metrices found to be used in the sample literature to analyze the research productivity namely basic metrics, metrics dealing with growth, collaboration and metrics at institute level and author level metrics. It will serve as a reference tool to the scholars and practitioners in the field who will be acquainted with the publications on research productivity as well as various metrices, laws of bibliometrics, statistical tools, used in the articles.
Keywords
Introduction
Academic institutions are characterized by three major parameters namely: research, learning, and teaching. Out of these three, research stands as a significant medium for development (Ayeni and Adetoro, 2017). The intellectual outcome of the research is published in the form of research papers namely journal articles, conference papers, short communications, survey reports, etc. The research activity of an individual or an institution is reflected through their published literature. Research productivity refers to innovative thoughts and ideas which after theoretical and applied studies, lead to the publication of articles in leading journals, patent registration, or documentation (Hedjazi and Behravan, 2011). In the last decade, there is an increasing emphasis on the research assessment of government as well as private institutes which resulted in the emergence of some ranking systems at national and international levels. At present, some of the global ranking systems like The Times Higher Education World University Ranking, QS World University Ranking, Academic Ranking of World Universities, and Shanghai Ranking are gaining popularity and at the national level, NIRF (National Institutional of Ranking Framework) by MHRD and QS India University Ranking are the leading ranking systems. In this context, research and publications are declared as one key factor for ranking by MHRD, Government of India. This parameter is described by NIRF as research and professional practice (RP) which includes the combined metric for publications (PU) and quality of publication (QP). Thus, the next big challenge is analyzing the productivity of such institutes. Eliezer Geisler stated that the measurements of science and technology can take a large variety of forms and make use of different types of metrics, each one addressing a particular facet of the system’s complexity (Geisler and Abdallah, 2000). The various metrics such as “Bibliometrics,” “Scientometrics,” “Informetrics,” “Webometrics,” “Netometrics,” “Cybermetrics” are the metrologies for measurement of scientific communications and are sometimes used interchangeably.
Problem statement
An in-depth examination of the published literature showed that numerous studies have been conducted for evaluating the research productivity of various journals, prominent persons, subject areas, departments, institutions, regions of a country, number of countries, or the world as a whole. The studies on research productivity cover diverse perspectives on research output namely some focus on research performance using various metrics, some studies aim at exploring the correlation between productivity and collaboration (He et al., 2009; Hollis, 2001), some studies analyze how various academic, demographic and psychological factors influence research productivity (Abbott and Doucouliagos, 2004; Anyaogu and Iyabo, 2014), some of the papers emphasize on the impact of academic programs like conferences and seminars on the productivity (Agboola and Oduwole, 2005). In this context, the present paper is an attempt to analyze all the literature exclusively dealing with different metrics (indicators, bibliometric laws) used for measuring research productivity by employing the methodology of systematic literature review (SLR).
Rationality of the study
Though the evaluation of research productivity is gaining importance, as a major thrust area of research and a large number of studies are carried out in this field. Still, the current paper which is a systematic literature review on research productivity is the first attempt of its kind as it has included the selected 131 articles which analyzed the research productivity of various institutes, professionals, countries, etc. using a range of metrics. In other words, this SLR is exclusively includes studies of research productivity using various metrics. Thus, the researchers were motivated for conducting such a study and to deal with both the quantitative and qualitative aspects of the published literature. Quantitative aspects cover the growth of studies on research productivity, the forms of publications, disciplines of study, leading publishers, data sources used by the researchers, and leading journals that publish papers on research productivity. As regards the qualitative aspect, the paper highlights a wide range of indicators used by the researchers, highly cited papers and their thrust areas of research.
Methodology
Review work is termed “systematic” when it is based on clearly formulated questions, identifies relevant studies, appraises their quality, and summarizes the evidence by use of explicit methodology (Lagorio et al., 2016). SLR is defined as (Webster and Watson, 2002) “a process in which the main purpose is to overcome the drawback of the traditional literature review method by reducing the bias. It ensures that the reviewed documents are toward the objectivity of the focus area and provide transparency based on retrieval criteria.” Again an SLR gives a concept-centric approach (Senivongse et al., 2017). The present paper is based on the protocol as depicted in Figure 1 for the systematic literature review which is influenced by the model designed by Denyer and Tranfield (2009).

Protocol for systematic literature review.
Framing of research questions
Based on the first step of the Denyer & Tranfield model, framing the research question is the first step toward carrying out the research in the right direction. So keeping the objectives of the research work, the following research questions have been formulated. Research questions 1–5 address the quantitative aspects of the published literature and gives insightful facts about the characteristics of the articles on research productivity and research question 6 and 7 deal with the range of indicators used in the literature.
RQ1: What is the chronological distribution and citation impact of articles on research productivity? What are the alternative keywords used by researchers and what is the form-wise distribution of publications?
RQ2: What are the disciplines of study in which works on research productivity have been carried out?
RQ 3: Who are the leading publishers in research productivity study?
RQ 4: What are the data sources that have been used by the researchers for articles on research productivity?
RQ 5: Which are the top Impact Factor (IF) journals as regards publications on research productivity?
RQ6: Which are the most cited papers and what are the thrust areas of research of those citing articles?
RQ7: What are the different metrics/bibliometric laws and statistical tools used by the researchers to assess the research productivity?
Forming of search terms and searching articles
The search terms were constructed with the help of Boolean Operator “OR” that is “Research productivity,” OR “Research output,” OR “Publication productivity” OR “Research Trends,” OR “Scholarly Research output” etc. In Scopus, under search documents, these keywords were used to search “Article title, abstract and keywords” and the published years included is all years till 2020. Apart from this, the search was made through other online databases like Emerald, Taylor & Francis, Google Scholar, JSTOR, ProQuest, and EBSCO for the full-text articles. Some articles were retrieved by tracking citations of the full-text articles downloaded from different online databases.
Data collection and evaluation of articles
By adopting the aforesaid procedure a total number of 205 articles were retrieved from various databases. After the elimination of duplicate articles, first-round screening was done taking into consideration the titles and abstract of the entire set of literature (N = 172) from which further elimination was done which were not appropriate as per the objectives of the study. In the second round of screening, only those articles were included where the study has dealt with metrics, bibliometric laws, statistical tools and highly cited papers and finally 131 articles were included for the study. Figure 2 illustrates the PRISMA (Preferred Reporting Items for Systematic Reviews and Meta-Analyses) flow diagram for the selection of articles. The final list of 131 papers covers 126 journal articles, 4 conference papers, and 1 project report. From the publication duration of the selected articles, it is observed that these cover a period of 40 years, that is, 1981–2020. The total corpus of literature covers 74 (56.49%) papers of national repute and 57 numbers (43.51%) papers of international repute.
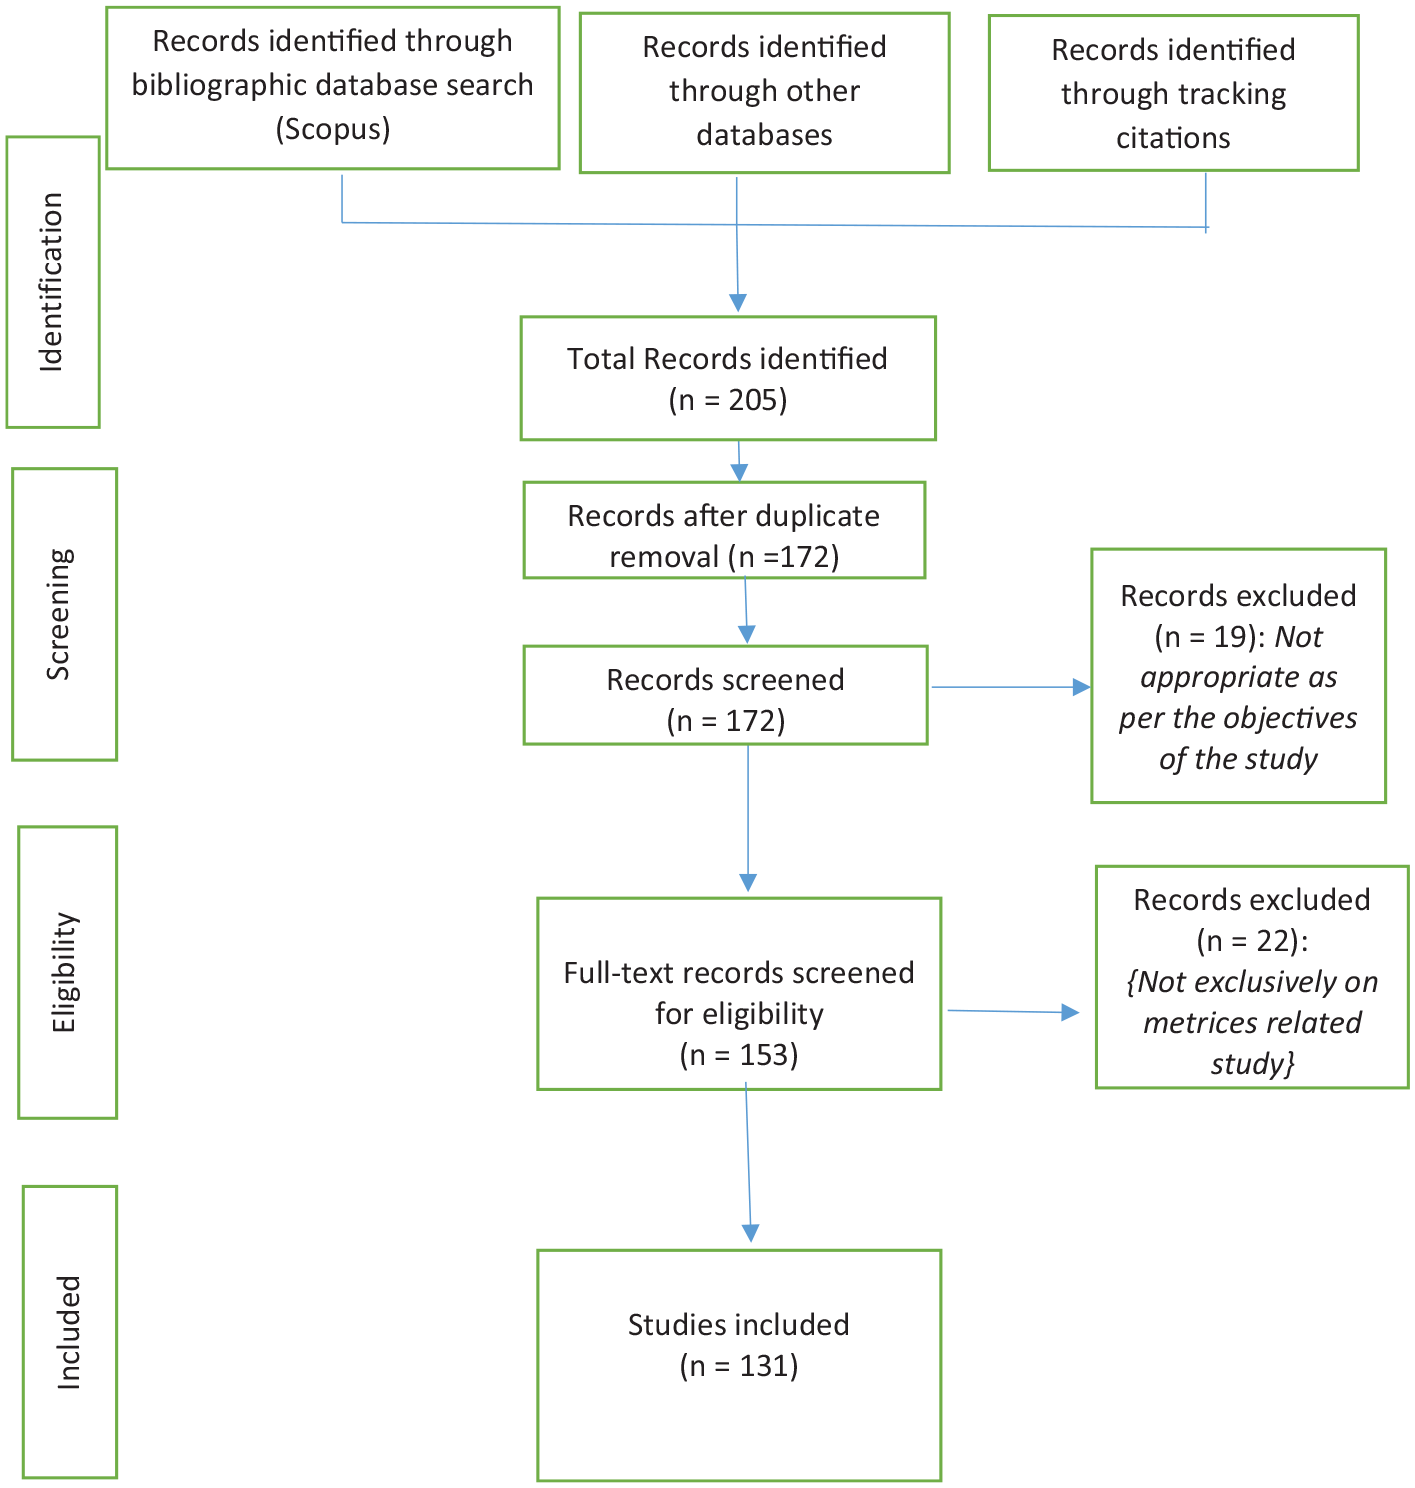
PRISMA flow diagram for selection of articles.
Analysis and synthesis
After the inclusion of the final list of articles (N = 131), all the articles were examined to gain insight into the different attributes of the studies. Once the attributes are defined, the details of all those identified articles are entered under the relevant field/attribute in an excel sheet. Based on the data collected, two types of analyses were made, that is, quantitative analysis and qualitative analysis of articles. As such the paper is structured in two parts. In Part-I, the dimensions which have been studied as components of quantitative analysis are the chronological distribution of articles, keyword-wise distribution of articles, form-wise, disciplines of the articles, publisher-wise distribution of articles, data sources used in the articles, and most prolific journals of the publications. Part-II of this paper is meant for qualitative assessment where top-cited articles with their number of citations and thrust areas of research as well as all the metrics used in the articles have been meticulously discussed.
Part-I: Quantitative analysis of articles
RQ 1: What is the chronological distribution and citation impact of articles?
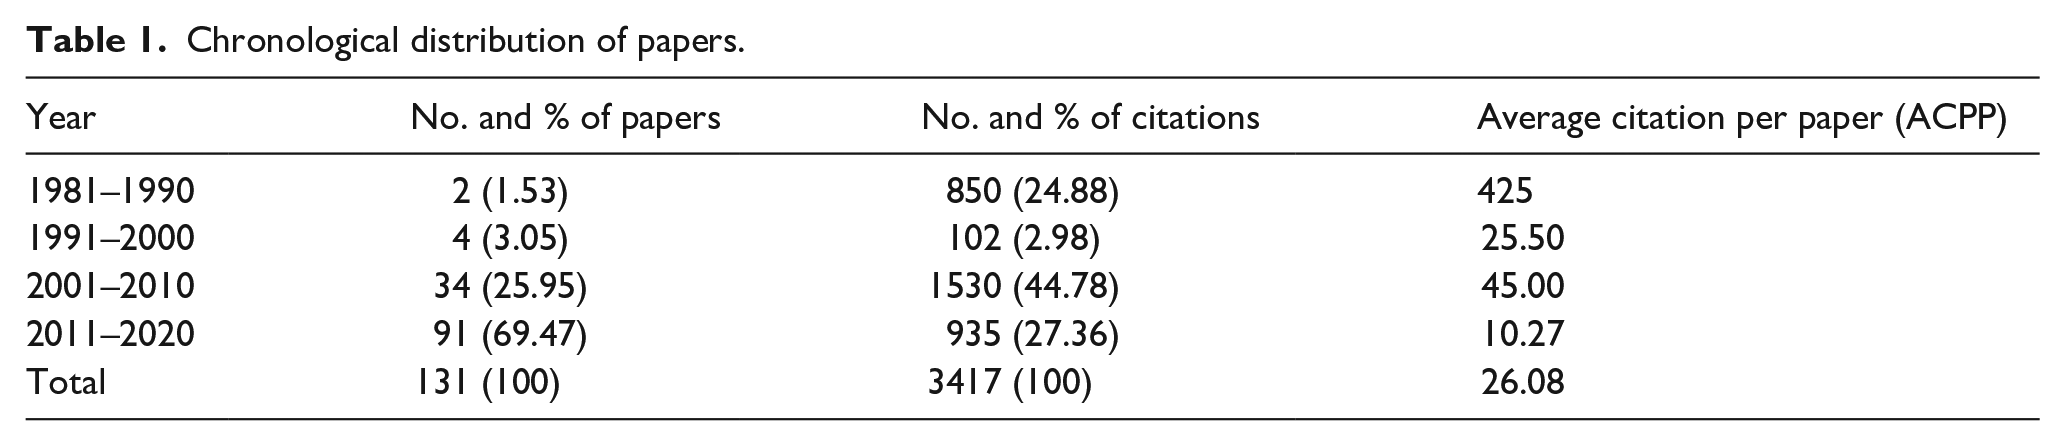
Research question one (RQ 1) is about the distribution of articles published within the four decades and their citation impact which is represented in Table 1. The total number of articles (N = 131) have been published during a period of 40 years from 1981 to 2020 which has been divided into four decades. There is significant growth in the number of articles from the first decade (two papers) to 91 papers during the fourth decade (2011–2020). As regards the number of citations, the highest number of citations (1530) have been received during the third decade. A total number of 3417 citations are received for the entire article with average citations of 26.08 per paper.
Chronological distribution of papers.
The second part of RQ 1 is about the keywords used in the titles. The total number of articles (N = 131) was examined to assess the types of keywords used in the titles and the trend is depicted in Figure 3. It was found that many near synonymous and related terms like “research output,” “research performance,” “research trend,” “research productivity,” “publication productivity,” and “publication output” have been used to assess the research performance of different institutions. Among all these terms, “research output” has the highest occurrence (36) followed by research productivity (29) and publication productivity (12). There are eight articles were found with the terms Bibliometric and Scientometric analysis and 28 articles with various keywords like research contribution and impact, author productivity, research visibility, etc.
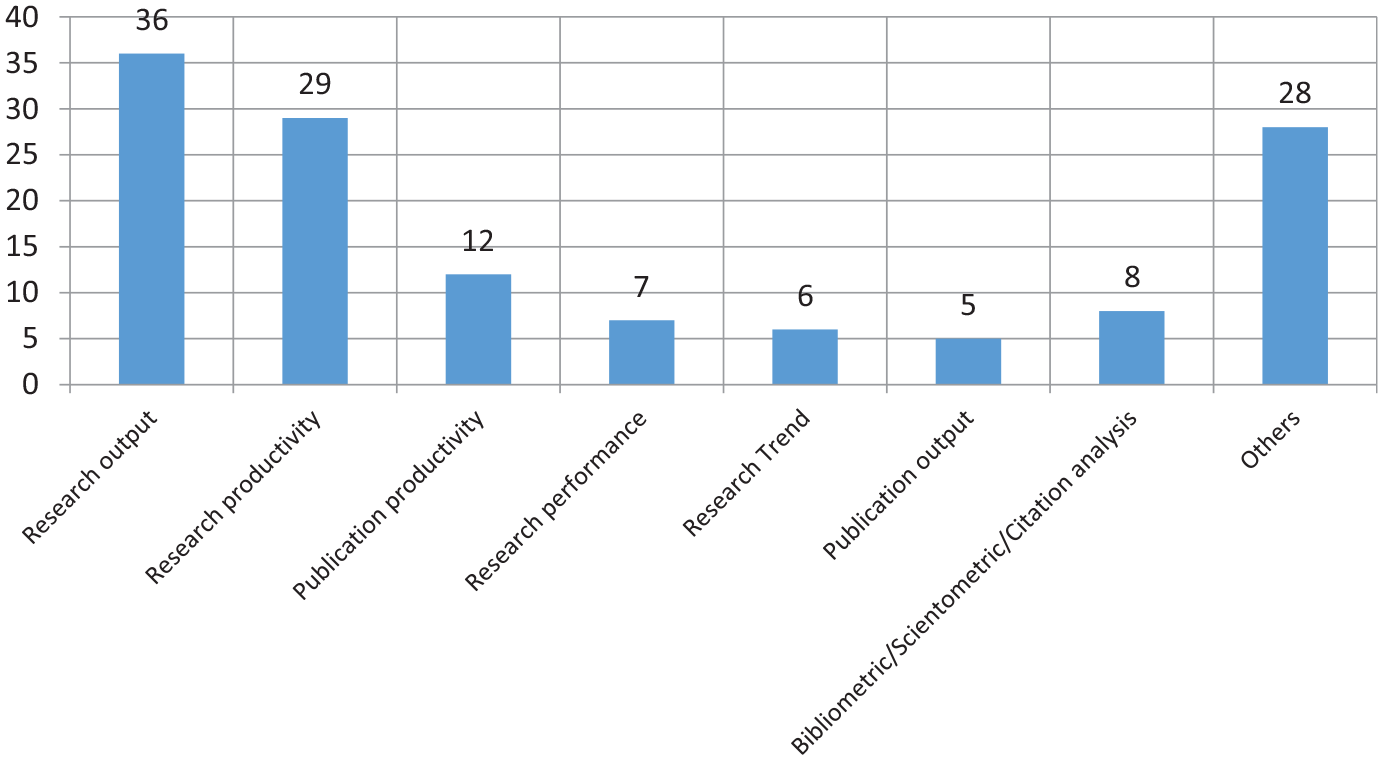
Keywords appeared in the titles.
RQ1b: What is the form-wise distribution of these papers?
Form wise distribution of articles
The third component of RQ 1 is about the form-wise distribution of these papers. The total number of publications included in the study are consisting of 126 journal articles with 3400 citations and 4 conference papers with 13 citations and 1 project report with 4 citations (Figure 4). As there are 26.08 average citations received per article, it may be interpreted that the set of publications have received a good number of citations.
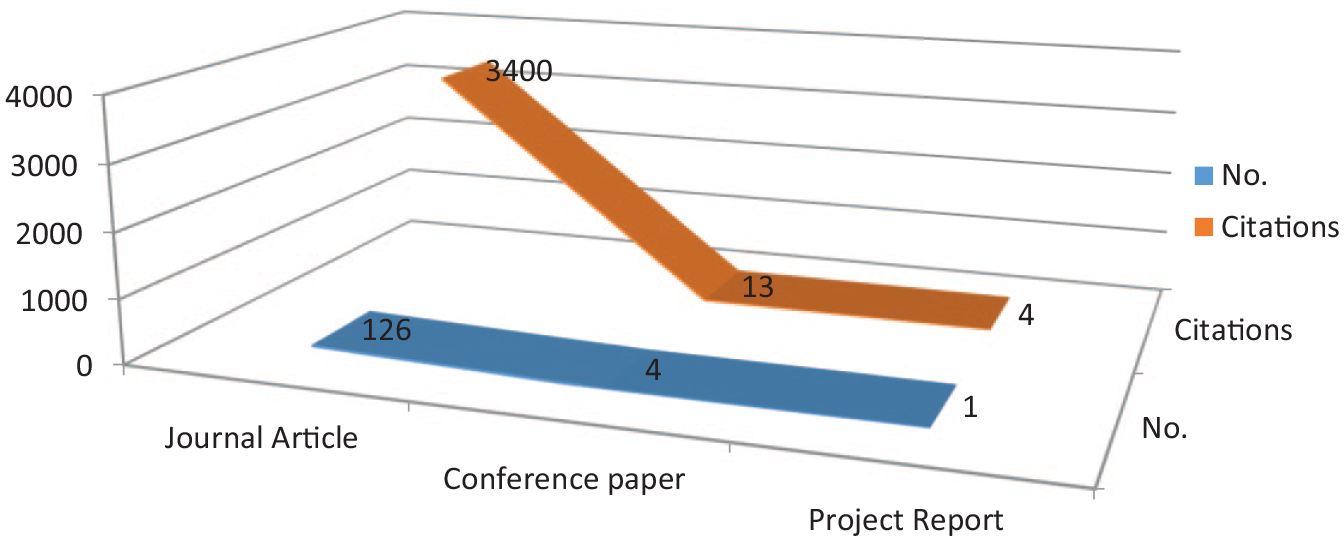
Form wise distribution of papers with citations.
RQ 2: What are the disciplines of study in which works on research productivity have been carried out?
RQ-2 is regarding the disciplines of study where works on research productivity have been carried out. After a thorough examination, it is observed that the articles can be classified into five main categories (Figure 5) as per the 10 main classes of Dewey Decimal Classification (DDC 22nd edition). The sixth category is termed “Miscellaneous” which includes 20 papers which are 15.27% of the total contribution and it has included subjects covering more than one disciplines/DDC main classes. These categories of disciplines are (i) Computer science, information & general works (DDC No. 000, 5 papers, 3.82%), (ii) Social Sciences (DDC No. 300, 33 papers, 25.19%), (iii) Languages (DDC No. 400, 2 papers, 1.53%), (iv) Science (DDC No. 500, 23 papers, 17.56%), and (v) Technology (DDC No.600, 48 papers, 36.64%). Under the first category, the subfields covered are Computer Sc., Information System, Media Studies and Library and Information Science, the subjects under Social Sciences are Economics, Law, Criminology etc. Fields like English and TEFL are categorized under Language. The discipline of science includes a range of sub-fields likely Physics, Chemistry, Biochemistry, Botany, Plant Science, Earth Science, Mathematics, Pure Sciences, Physical Sc. etc. The fifth category is Technology mainly inclusive of technology (15 papers), Medicine & health (23), Engineering (4), Agriculture (1), and Management (5 papers).
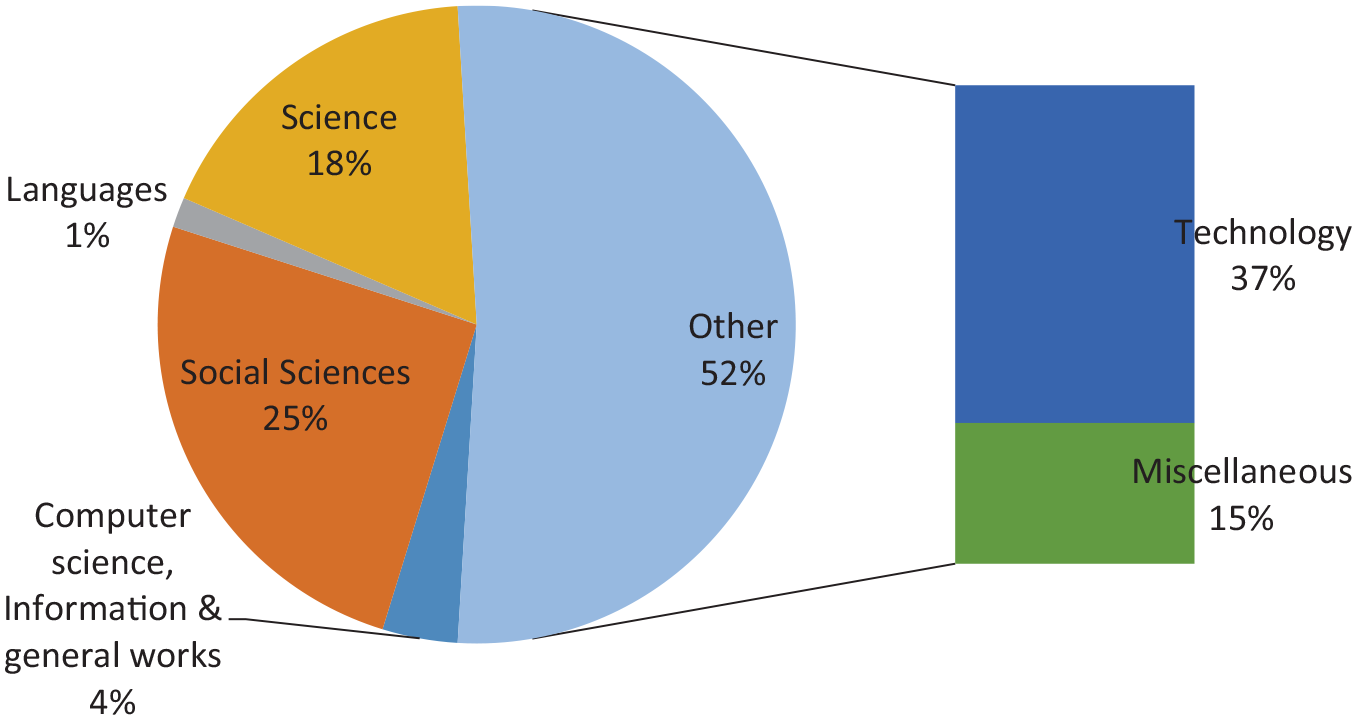
Discipline wise scattering of articles.
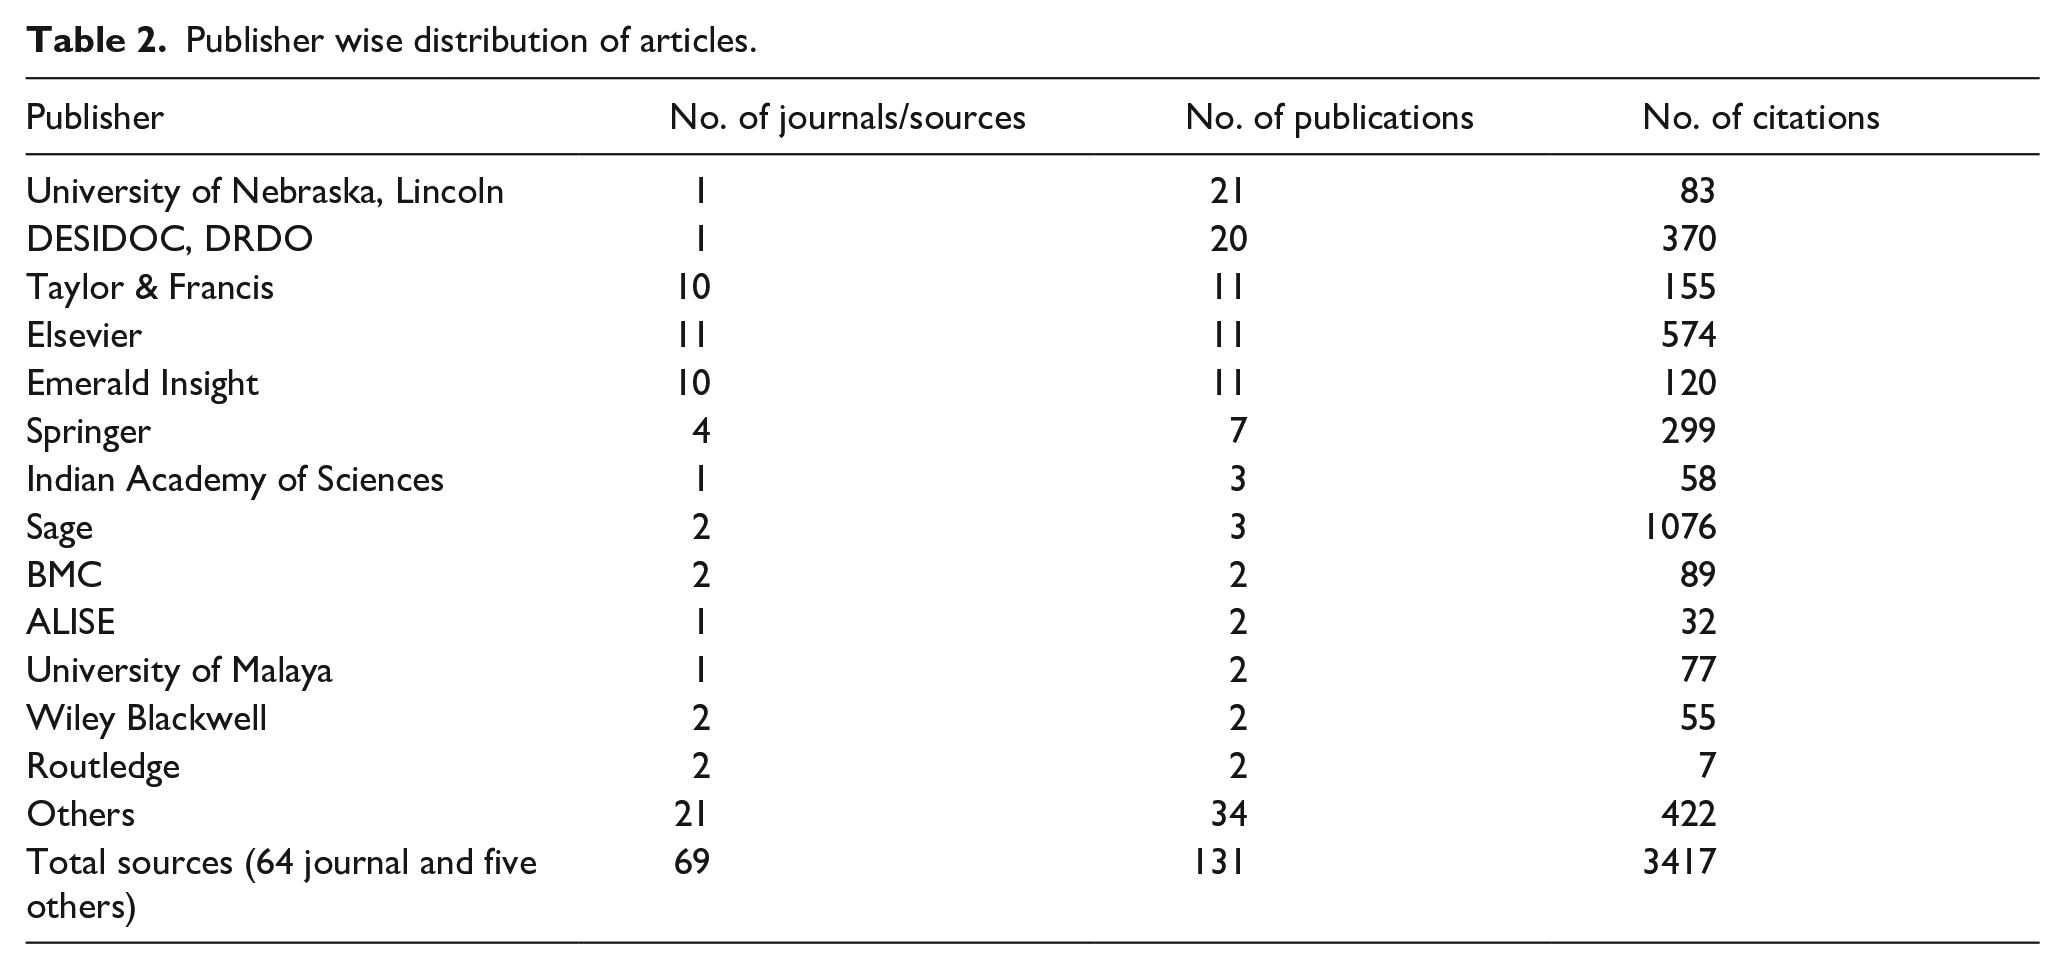
RQ 3: Which are the leading publishers in research productivity study?
Research question 3 is about the publishers of the articles included in the study. This RQ is addressed through Table 2 which portrays the publishers with their journal outlets and the number of publications. The total number of 131 articles are contributed by 34 publishers, published in 64 journal sources and five in other sources like 4 conference papers and 1 project report. Out of the publishers, it is the University of Nebraska, Lincoln (USA) has the highest number of publications (21), followed by DESIDOC (20 publications). Publishers like Taylor & Francis, Elsevier, and Emerald Insight have 10, 11, and 10 journal sources with 11 publications from each publisher. A publisher like Sage has two journals covered with three publications but a look into the numbers of citations, it is Sage that surpasses other publishers with the highest (1076) citations received for its three publications followed by Elsevier (574) and DESIDOC (370). So as regards the present set of publications, the University of Nebraska, Lincoln (USA) is the leading publisher but when citations are considered, Sage publications have a high impact.
Publisher wise distribution of articles.
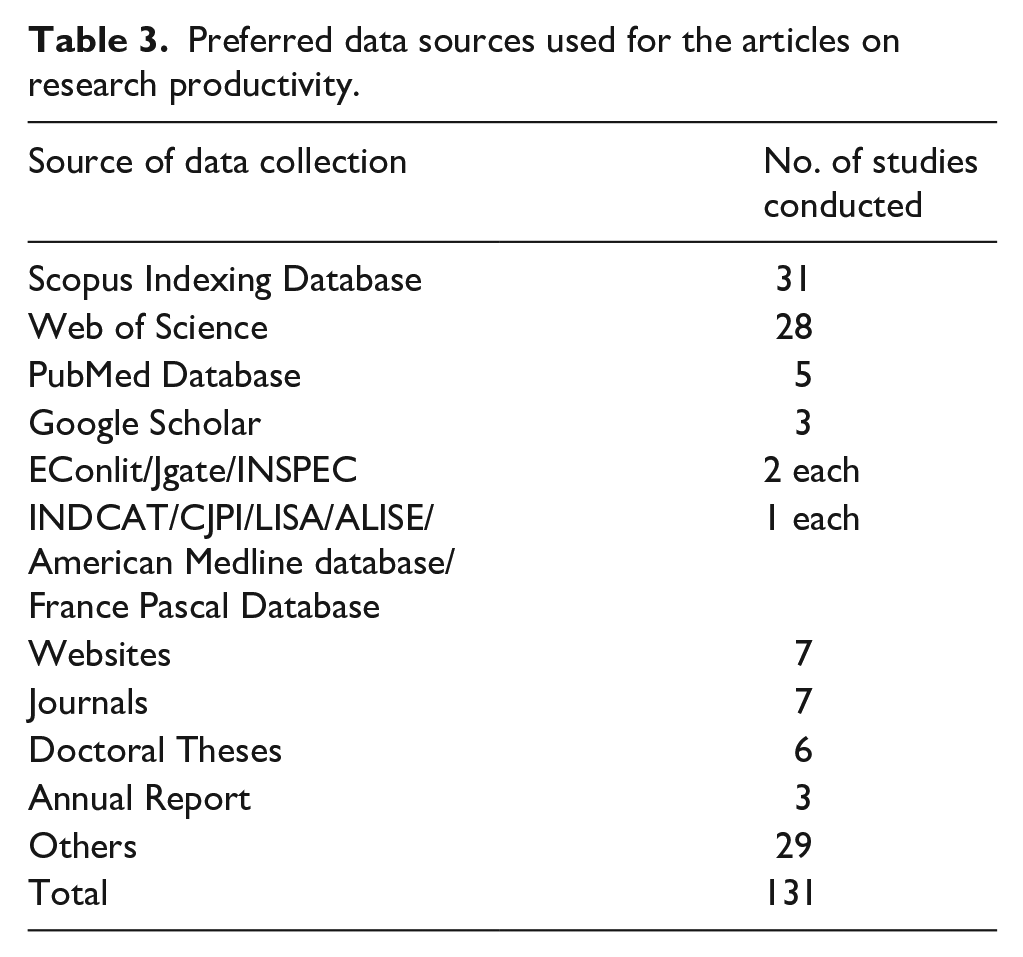
RQ 4: What are the data sources that have been used by the researchers for articles on research productivity?
To know the kinds of data sources used by the researchers for the studies on research productivity, RQ-4 was framed. For this, the methodology sections of all the articles were evaluated thoroughly and interesting results were obtained that address RQ-4. It is observed that many data sources like abstracting and indexing databases, full-text databases, websites of institutes, annual reports, discipline-specific journals, doctoral dissertations published in a particular subject and some other sources have been used. Out of all the data sources, the highest numbers of studies (79, 60%) have been conducted using data from various databases whereas only 52 articles are based on other data sources like websites, journals, annual reports, and doctoral theses (Table 3). Further out of all the databases, the highest number of studies (31) are based upon the data from the SCOPUS indexing and citation database followed by the Web of Science (28) database. The other databases used are PubMed, Google Scholar, EConlit, JGATE, INSPEC, INDCAT, etc.
Preferred data sources used for the articles on research productivity.
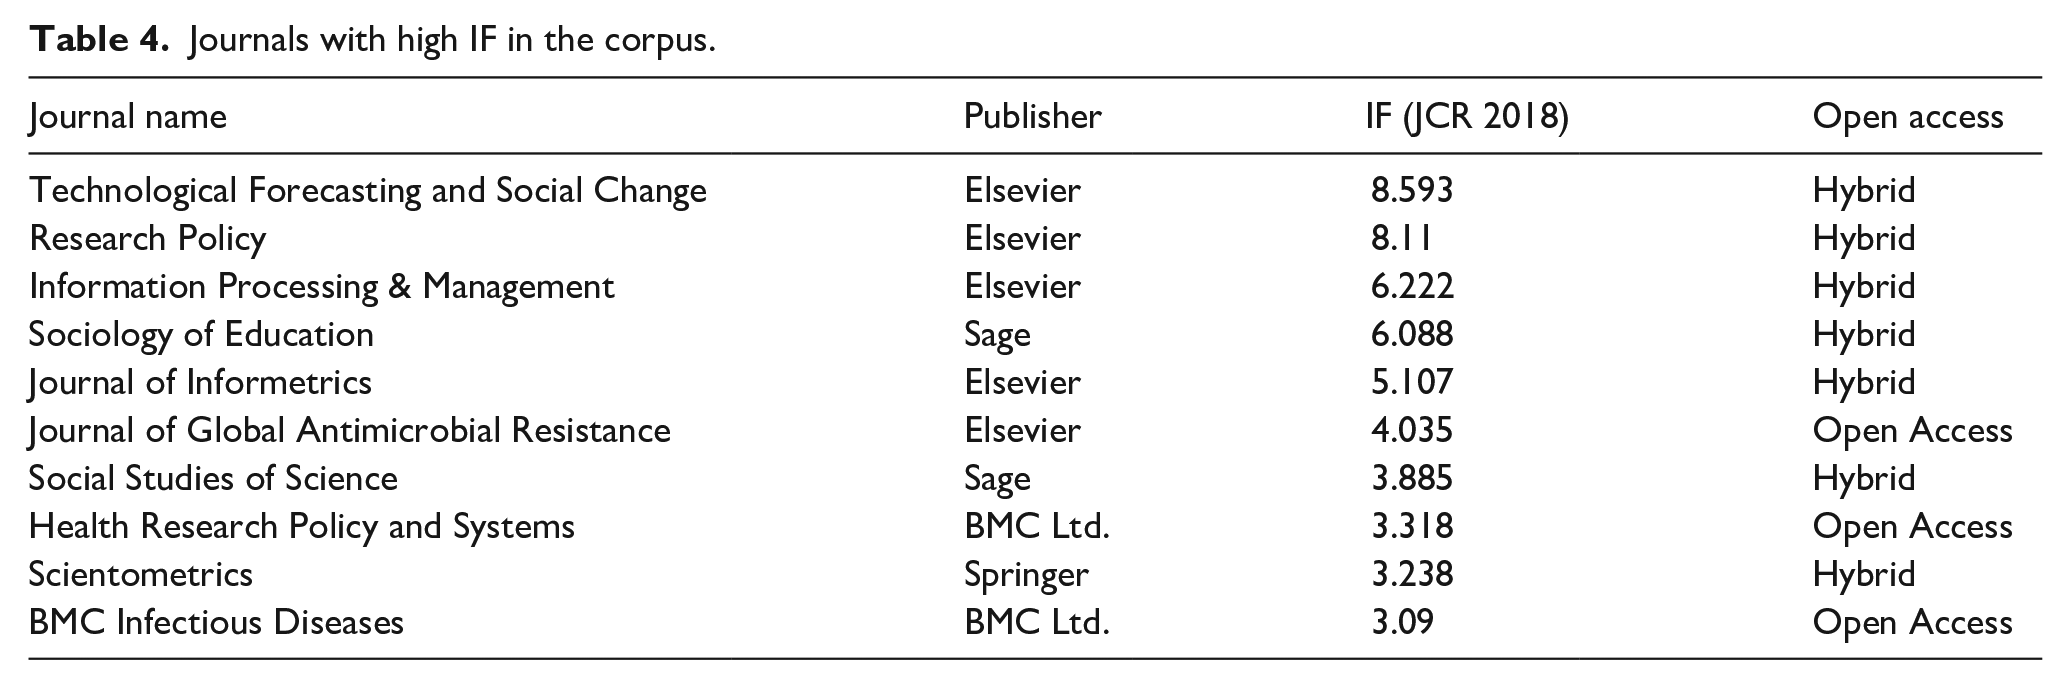
RQ 5: Which are the top Impact Factor (IF) journals as regards to publications on research productivity?
The Journal impact factor is a qualitative indicator that measures the frequency with which an average article in a journal has been cited in a particular year. It reflects the influence and standing of a particular journal in the field. To answer RQ-5 and to assess whether the articles on productivity study published in qualitative journals, the impact factor (IF) of all the journals as per JCR 2020 were derived and the top 10 sources were represented in Table 4. Of all the published journal sources, it is the journal Technological Forecasting and Social Change of Elsevier publication that has a high IF of 8.593. The IF of the other nine journals varies from 3.09 to 8.11. Out of the top 10 IF journals, only three journals namely, Journal of Global Antimicrobial Resistance, Health Research Policy and Systems, and BMC Infectious Diseases are the open access journals whereas the rest seven are hybrid journals. Most of the IF journals (5) were published by Elsevier publications, two by Sage Publication, two by BMC Ltd., and one by Springer Publication.
Journals with high IF in the corpus.
Part-II: Qualitative analysis of articles
RQ6: Which are the most cited papers and what are the thrust areas of research of those citing articles?
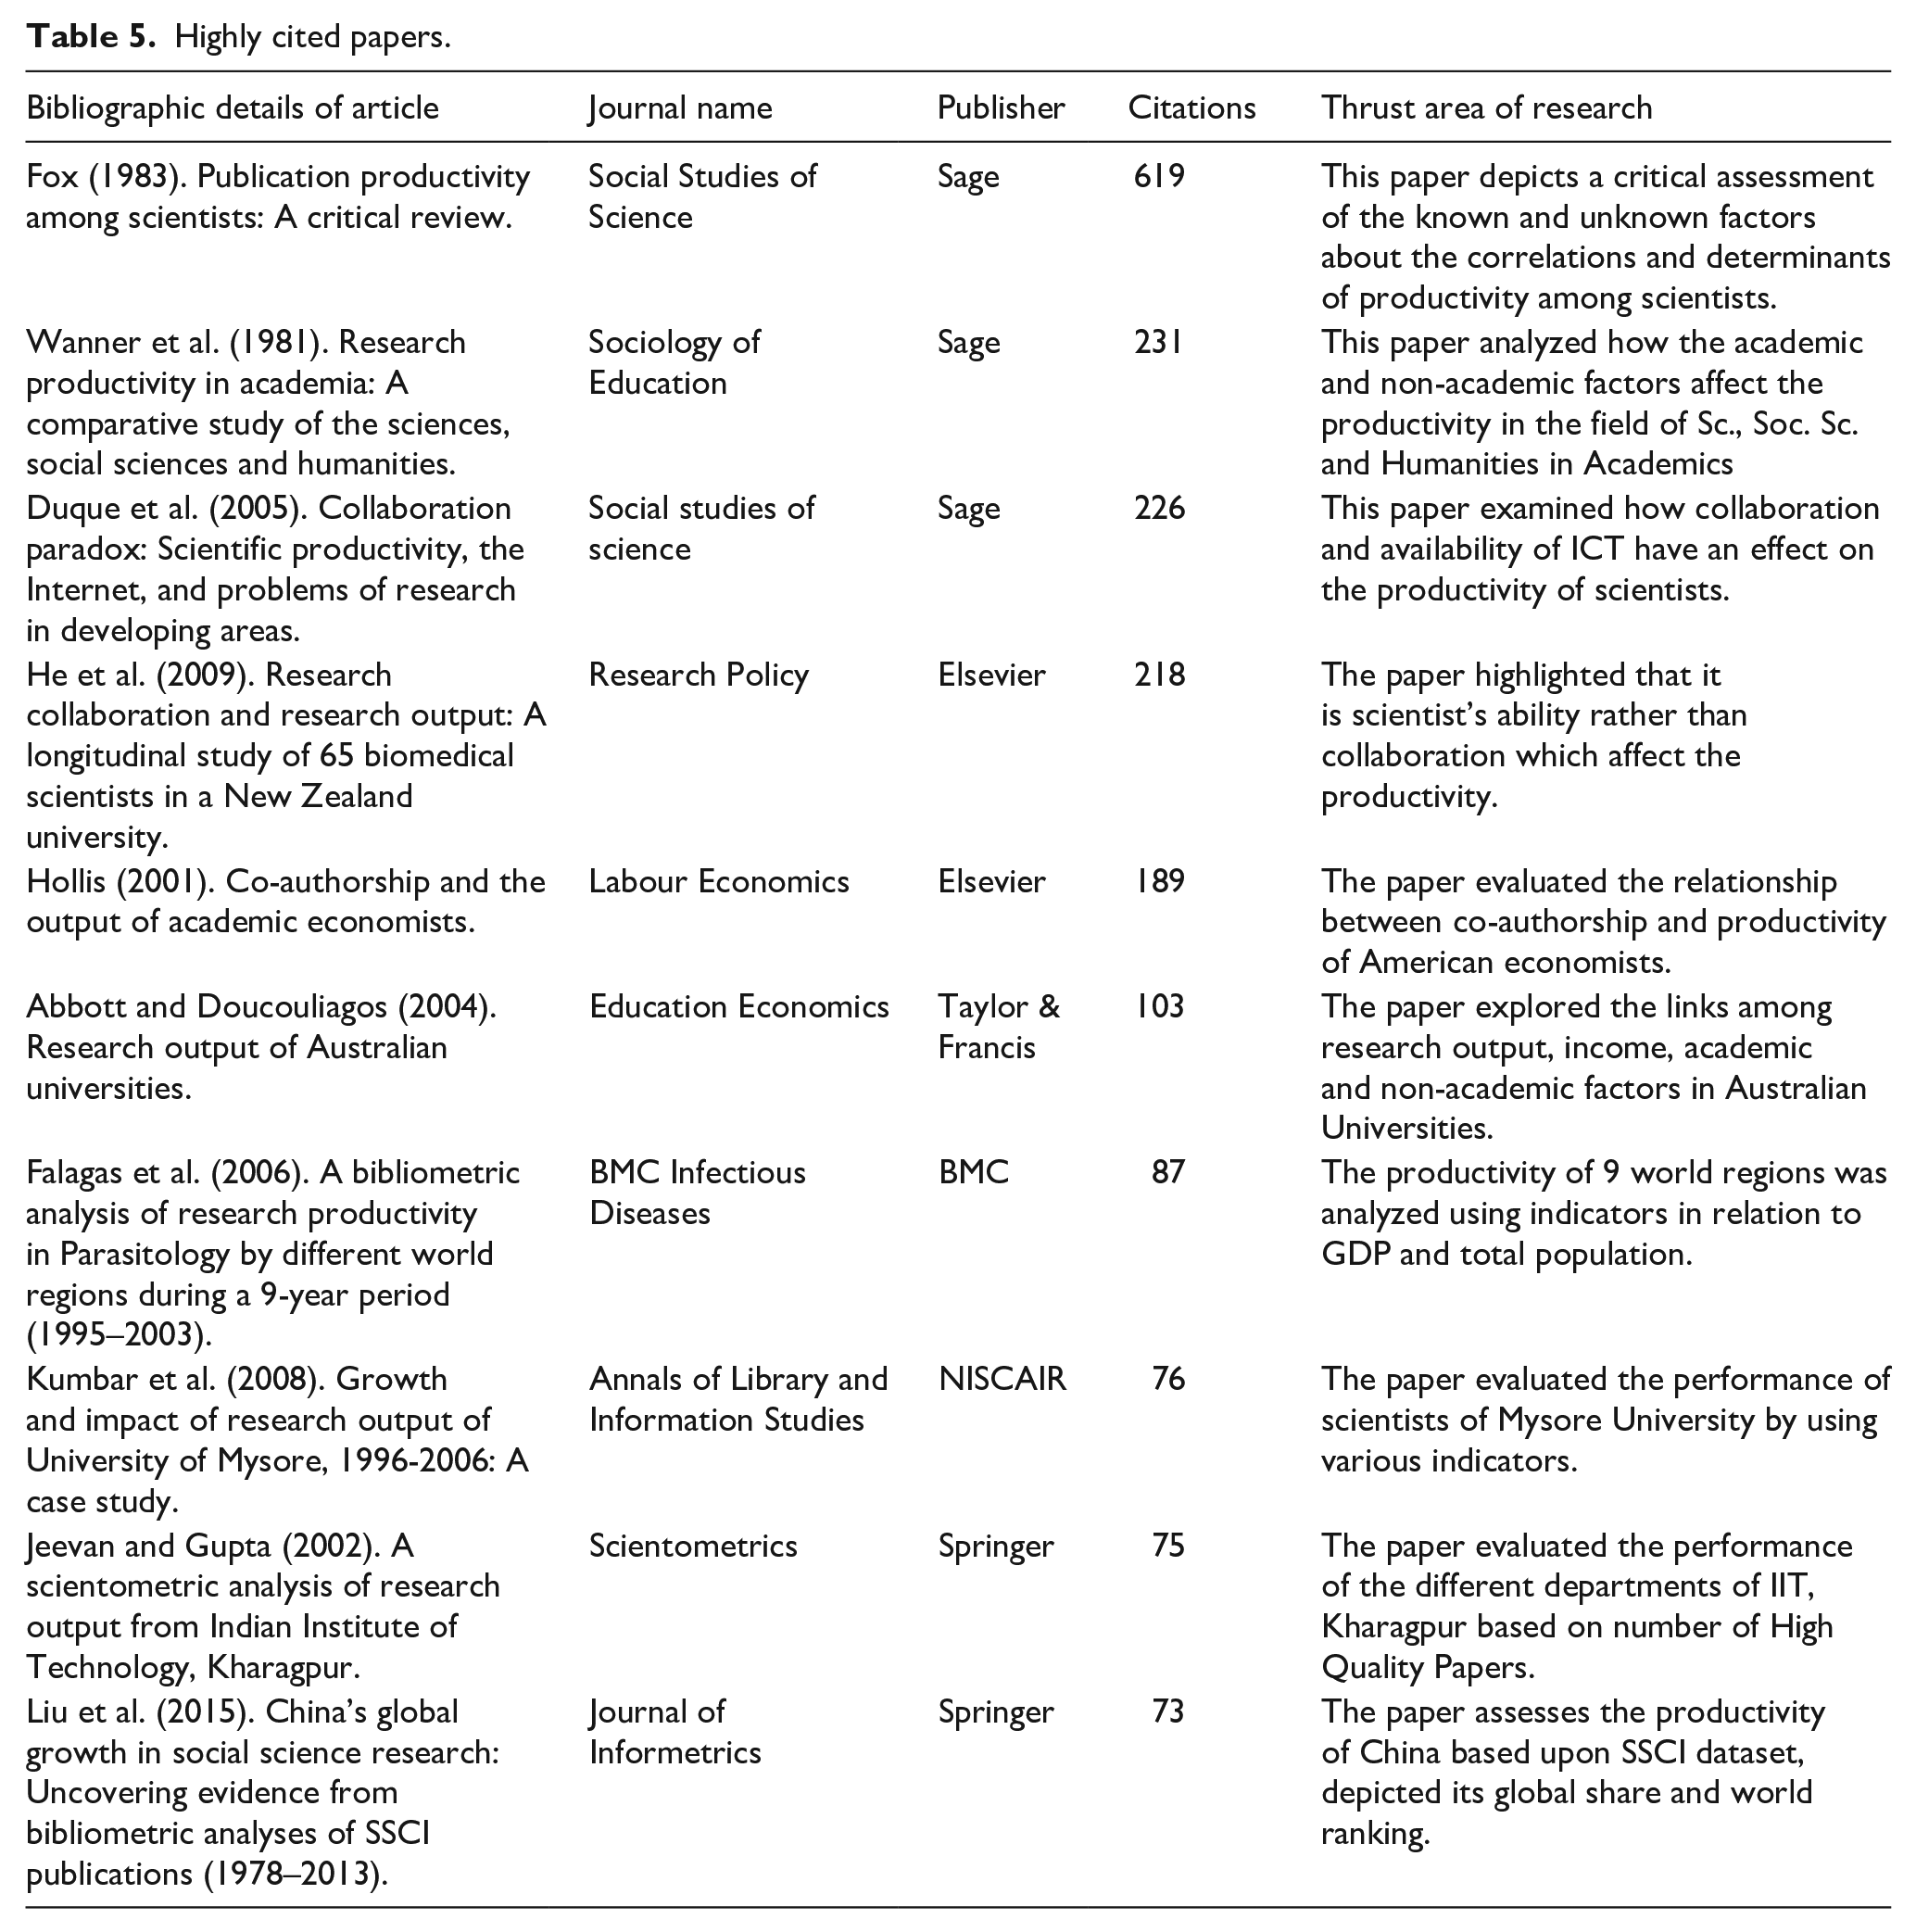
RQ-6 is addressed in Table 5 which represents 10 highly cited articles on research productivity as well as the thrust areas of research. These 10 articles received a total number of 1897 citations which is more than half (55.51%) of the total citations received for the entire set of articles. The citation range of these articles varies from a minimum of 73 to a maximum of 619. All these highly cited articles are indexed in the Scopus database out of which eight articles are of international repute and two are of national repute. The article that received the highest citation (619) was published in the journal “Social Studies of Science” authored by Mary Frank Fox in the year 1983. Regarding the thrust areas of research, these articles highlight various dimensions of research productivity like determinants of productivity, academic and non-academic factors affecting productivity, collaboration and availability of ICT on productivity, co-authorship, and productivity, evaluation of the performance of scientists associated with Universities and research institutions, etc.
Highly cited papers.
RQ7: What are the different metrics/bibliometric laws and statistical tools used by the researchers to assess the research productivity?
The focus of the present paper is to make a meticulous analysis of the various metrics employed in the articles that dealt with research productivity through the method of systematic review. It is observed that a wide range of metrics, bibliometric laws, and statistical tools have been employed in all those studies. For a systematic and scientific approach, all the attributes covered in the total literature have been categorized into three logical segments, that is, (i) Use of metrics, (ii) Application of Laws of Bibliometrics, and (iii) Application of Statistical Tools.
Use of metrics—(TP), (TC), (ACPP), (ACPY), (LCP), (DCP), (NCP), (ICP)
The indicators like Total papers (TP),Total citations (TC), Average citations per paper (ACPP), Annual citations per year (ACPY) are studied in a large number of papers by Abbott and Doucouliagos (2004), Abramo et al. (2017), Agboola and Oduwole (2005), Ahmad et al. (2018), Anderson and Tressler (2008), Anilkumar (2010, 2014), Anyaogu and Iyabo (2014), Chan et al. (2014), Cohn and Farrington (2014), Dalrymple and Varlejs (1995), Dean et al. (2011), Falagas et al. (2006), Gupta and Bala (2013), Gupta and Dhawan (2008), Gupta et al. (2010), Kaur et al. (2011), Johanson and Woods (2002), Khiste (2017), Khiste et al. (2018), Kostoff (2012), Krishnamurthy and Awari (2015), Kumar et al. (2009, 2015), Liu et al. (2015), McPherson et al. (2013), Maske Dnyaneshwar and Khiste (2018), Murugan and Ravanan (2016), Nagarkar et al. (2015), Naheem et al. (2017), Nakanjako et al. (2017), O’Brien and Cronin (2016), Ocholla et al. (2012), Peter et al. (2019), Ramos et al. (2009), Ray et al. (2016), Research Council UK (2010), Siwach and Satish Kumar (2015), Sudhier and Kumar (2010), Tsafe et al. (2016), Uma and Rao (2014), Vasishta (2011), Visakhi and Gupta (2013) and Webber (2012). The indicators that reveal the number of collaborative papers at the local, national and international levels are termed as Locally collaborated papers (LCP), Domestic collaborative papers (DCP), National collaborative papers (NCP), and International collaborative papers ICP respectively and reflected in many studies likely Dash et al. (2013), Gupta and Dhawan (2008), Dhawan et al. (2017), Gautam and Mishra (2015), Gupta (2013), Gupta et al. (2014a), Kumar and Gupta (2016), and Sevukan et al. (2007).
Gupta and Dhawan (2008) examined the Indian scientific research output and found that the NCP is higher than ICP and the collaborative research showed a faster growth rate (729.6%) than the country average (51.78%). In a study at PEC University of Technology, Vasishta (2011) studied that the share of NCP was 53.67% and ICP was 6.21% (11 papers). Out of these 11 papers, 10 are bilateral papers and 1 is a multilateral paper. USA, Iraq, and China were the most collaborative countries. The scientific research output of Odisha was studied by Dash et al. (2013) which revealed that the ICP was 12% and the overall Indian collaboration was 15%. Gautam and Mishra (2015) evaluated the productivity of BHU based on the Indian Citation Index (ICI). The 250 institutional collaborations are distributed among 67% academic institutes, 28% research institutes, and 5% scientific agencies. BHU collaborated with 18 countries out of which the USA, Japan, and the UK are the top collaborator. The total number of LCP, NCP, and ICP are 71, 227, and 52, respectively. In another study of MM University, Haryana conducted by Kumar and Gupta (2016) it was observed that the share of NCP is 39.20%, and ICP is 9.88%. The ACPP for NCP was 4.52 which is slightly higher than the university average of 3.27. The ACPP of ICP was 3.45. The major collaborative countries were the USA, South Korea, and South Arabia. The productivity of six major universities in Karnataka was studied by Gupta et al. (2014a). The findings revealed that the NCP was 56.69% with 3616 papers and ICP was 27.78% with 1635 papers. Germany, the USA, and Malaysia contributed 31.07%, 22.02%, and 13.88% ICP.
In the productivity study of the physicists of Jawaharlal Nehru University (JNU) by Singh and Kumar (2014), it was observed the ACPY for Satyabrata Pattanaik was found to be the highest at 42.40. The research performance of 16 older IITs was studied by Marisha et al. (2017) where it was found that the publication per capita (PPC) of IIT Kharagpur was 10.10 followed by IIT Madras with 9.70 and IIT Bombay with 8.30. Marisha et al. (2017) evaluated the performances of 39 Central Universities, where the PPC (publication per capita) of Delhi University, University of Hyderabad, and Tezpur University were found to be 7.36, 6.03, and 4.96, respectively. The Peak year citation per paper (PCPP) was analyzed by Wang et al. (2011) for NTU and PKU and it was 10.00 for NTU in multi-disciplinary physics whereas for PKU the PCPP was 4.7 in chemistry.
Use of metrics—(HCP)
The highly cited papers (HCP) are significant for the reputation of any individual researcher and the institution with which the researcher is associated. The papers that studied the HCP are contributed by Marisha et al. (2017), Chakravarty and Madaan (2016), Gupta (2013), Gupta et al. (2011), Kumar et al. (2015), Kumbar et al. (2008), Noruzi and Abdekhoda (2014), Satpathy and Sa (2015), Shettar and Angadi (2018), Uma and Rao (2014), and Vasishta (2011). Marisha et al. (2017) studied the productivity of 16 IITs. The first most cited paper from the IITs was contributed by IIT Kharagpur in the year 2002 which received 6500 citations, the second paper was published in 2005 by IIT Bombay and received 1495 citations, the third paper was published in 2000 by IITK in collaboration with Swiss Federal Institute of Technology that received 1376 citations. The scientific publication of Bangladesh was studied by Gupta (2013). The number of HCP was 39 scattered over 36 journals and each received 100 or more citations. Journal of Physical Chemistry and Lancet produced 5 HCP each. As studied by Kumar et al. (2015) there were three HCP papers produced by Gujarat University during the period of study from 2004 to 2013. Out of these three papers two were published in the journal Telanta (one with 133 and the other with 64 citations) and the third one in Corrosion Science with 83 citations. Kumbar et al. (2008) studied the research trend of Mysore University. The TP was 1518 and the number of HCP was 17 which received more than 30 citations each, out of these, 11 papers were international collaborative papers, 4 were contributed with national collaboration, and 2 papers were from Mysore University. Noruzi and Abdekhoda (2014) examined the scientific productivity of Iraqi-Kurdistan University. The 25 HCP received 484 citations (19.36% of TC) and Gastroenterology was the journal with the highest 103 citations. Satpathy and Sa (2015) studied the scientific productivity of six Government Universities in Odisha and reported two highly cited papers published in the journals Science (283 citations) and Tetrahedron (98 citations). Shettar and Angadi (2018) analyzed the research output of the National Institute of Technology, Suratkal (NITK, Surathkal), where the 10 HCP received citations in the range of 128–192. The paper that received 192 citations was published in Advances in Colloid and Interface Science. Vasishta (2011) analyzed the productivity of PEC University of Technology, Chandigarh. Out of 177 papers, 12 papers received 6 or more citations. These papers were published in 11 journals and one as a conference paper. In another study of performance evaluation of the University of Hyderabad by Uma and Rao (2014) the 100 HCP were found to have citations in the range of 50–757 times. The papers comprised of 86 articles, 8 review papers and 2 conference papers, and 4 short communications.
Use of metrics—(h index) (g index) (p index) (i10 index)
Other qualitative measures used for performance evaluation are the h-index, g-index, p-index, and i10 index. Several studies apply one or more of these indicators for evaluation and these papers were contributed by Cancino et al. (2017), Gupta (2010), Gupta et al. (2014b), Gupta and Mahesh (2013), Kaur et al. (2011), Kpolovie and Onoshagbegbe (2017), Gao et al. (2013), Pandita and Singh (2015), Parabhoi (2019), Prathap and Gupta (2009), Savanur and Konnur (2012), Singh and Kumar (2014), Sweileh et al. (2018), Vasishta (2011), and Wang et al. (2011). Cancino et al. (2017) studied the innovation research (IR) output of leading universities based on the Web of Science. The h index and HI7 (h index in top 7 IR journals) of the University of Pennsylvania were 96 and 13, respectively followed by Harvard University h-index of 93 and HI7 was 27 and for MIT it was 76 and 31, respectively. Gupta (2010) analyzed the productivity of 50 major Indian Universities. The h-index of the University of Hyderabad, Delhi University, and Punjab University were 49, 45, and 44 respectively. Gupta et al. (2014b) evaluated the performance of 25 Indian Universities in Social Sciences. The h index and p index of Jadavpur University were 15 and 12.10 respectively; the h index of Aligarh Muslim University, University of Calcutta, and Banaras Hindu University were 12 for each and with different p index 8.61, 7.74, and 5.77, respectively. Gupta and Mahesh (2013) analyzed the social science research of 4 South Asian countries, that is, Bangladesh, Nepal, Pakistan, and Sri Lanka from 1996 to 2011. In Social Science-general the highest h index was achieved by Bangladesh (24), followed by Pakistan (16), Sri Lanka (16), and Nepal (14). In Economics the h index of Bangladesh was highest with a value of 18, Pakistan achieved the highest h index in Decision Sciences (12) and Psychology (16).
The productivity of the Government Medical College and Hospital of Chandigarh was studied by Kaur et al. (2011). In the subject-wise analysis, Medicine, Biochemistry, and Pharmacology had h index 12, 9, and 6, respectively. In a disease-wise study, cancer papers had h index of 11 followed by tuberculosis-9 and cardiovascular-6. In the institute-wise study, PGIMER had the highest h-index 41. Harsh Mohan and Thami were found as the top authors with h index 10. Kpolovie and Onoshagbegbe (2017) evaluated the performance of Nigerian academics which revealed the mean h-index for male and female staff was 2.915 and 2.241 and the mean i10 index for them were 1.915 and 1.435 which concluded that there was no significant difference between the h index and i10 index of male and female academic staff. Gao et al. (2013) studied the productivity of six Chinese universities of traditional medicine. The h-index of Shanghai University, Beijing University, and Nanjing University were 32, 28, and 20, respectively. Pandita and Singh (2015) analyzed the global research output in LIS based on Scopus from 2004 to 2013. The countries with the highest h index were the USA (204), the UK (87), and Canada (74). In another study, Parabhoi (2019) examined the productivity of Indian academic librarians from 1989 to 2018. The top three authors ranked based on the h-index were M.G. Sreekumar (TP-25, h index-6), Angadi Mallikarjun (TP-60, h index-6), and Samir Kumar Jalal (TP-38, h index-6). Prathap and Gupta (2009) studied the research trend of 25 Indian universities. The h-index of the University of Hyderabad was 49 followed by Delhi University (DU, 45) and Panjab University (44). The p index for these universities was 37.0, 32.7, and 32.7, respectively. According to the study by Savanur and Konnur (2012), the most productive authors at Bangalore University were P.V. Kamath (h-index—21, p index—26.52), M. Jayanan (h-index—11, p index—20.38), and S.M. Mayanna (h-index—16, p index—17.91).
Use of metrics—(AGR), (CAGR), (RGR), and (DT)
To map the growth rate of publications indicators like the Annual Growth Rate (AGR), Cumulative AGR (CAGR), RGR (Relative Growth Rate), and Doubling Time (D) were applied in several studies. Those studies were carried out by Agyeman and Bilson (2015), Aswathy and Gopikuttan (2015), Baskaran (2013), Chaurasia and Chavan (2014), Elango (2019), Ghosh (2014), Gupta and Dhawan (2009), Gupta et al. (1999), Horri (2004), Jabeen et al. (2015), Jebaraj and Thirunavukkarasu (2019), Jeyshankar (2015), Jeyshankar and Vellaichamy (2015), Leeves and Poon (2015), Li et al. (2010), Majhi and Maharana (2012), Mulla and Konnur (2013), Singh (2013), and Tripathi and Kumar (2015). The RGR and DT were found to be fluctuating in many studies which showed that the growth pattern was not steady, the CAGR of Indian Lung Cancer research by Jeyshankar and Vellaichamy (2015) was found to be 16%.
Use of metrics—(DC), (CI), (CC), (MCC), and (CAI)
Other collaborative measures are Degree of Collaboration (DC), Collaborative Index (CI), Collaborative Coefficient (CC), Modified Collaborative Coefficient (MCC), and Co-authorship Index (CAI) which were used for analyzing the extent of collaboration among authors. The papers deal with these measures were studied by Aswathy and Gopikuttan (2015), Bharti and Meera (2017), Chaurasia and Chavan (2014), Das and Maharana (2016), Mini Devi and Lekshmi (2014), Gautam and Mishra (2015), Gopikuttan and Aswathy (2016), Kumar et al. (2015), Khan and Ahangar (2015), Koganuramah et al. (2002), Kumar and Dora (2012), Kumar and Naqvi (2014), Meera and Sahu (2014), Nandi and Kumar (2013), Nandi and Mondal (2017), Peter et al. (2019), Satpathy and Sa (2015), Sharma (2009), Varghese and Rajan (2009), and Vijay et al. (2019). The mean DC for the Botany Department; at the University of Burdwan is 0.70 as examined by Nandi and Kumar (2013). Meera and Sahu (2014) calculated the average DC for the University College of Medical Science (UCMS), the University of Delhi as 0.92. Kumar et al. (2015) derived the range of DC for Gujarat University between 0.89 and 1.00, Peter et al. (2019) studied the collaboration trend of health care professionals in Saudi Arabia where the average DC is as good as 0.93. The mean DC for most of the studies is found to be close to the value 1 which implies that there is an increasing trend toward multi-authored papers.
Another popular measure of author collaboration is the collaborative coefficient (CC). The value of CC is 0 when there is the dominance of single-authored papers and 1-1/j when there is the dominance of j authored papers. Gautam and Mishra (2015) found the average CC for Banarus Hindu University (BHU) was 0.52, Bharti and Meera (2017) studied the collaboration of Delhi University (DU) and JNU in the field of Arts and Humanities and the CC for these two universities were 0.20 and 0.14, respectively which implies that the trend is toward single authorship pattern. The MCC in the field of Natural Science in the case of the university, Jamia Milia Islamia was found to be varied from 0.32 to 1.00 as reported by Kumar and Naqvi (2014). Mini Devi and Lekshmi (2014) derived the MCC for Jawaharlal Nehru Tropical Botanic Garden and Research Institute (JNTBGRI), Thiruvananthapuram in the range 0.482–0.807.
The CI in the field of Natural Science for Jamia Milia Islamia over 37 years varies from 1 to 3.88 with a mean number of 2.38 authors as studied by Kumar and Naqvi (2014). Aswathy and Gopikuttan (2015) studied the productivity of teachers in the field of physics for the University of Kerala, Mahatma Gandhi University, and University of Calicut and reported that CI for these universities are 0.089, 0.177, and 0.169, respectively. The CAI for Gujarat University from 2009 to 2013 for multi-author and mega author papers are found to be 101.61 and 109.48 showing the shift from a single authorship trend to a multi-authorship pattern as examined by Kumar et al. (2015). In the same year, Jeyshankar (2015) found that the CAI for single-authored papers is lower than the CAI of multi-authored papers for Indira Gandhi Center for Atomic Research (IGCAR), Kalpakkam.
Use of metrics—(AI), (CI), (RQI), (PEI), and (PaI)
Activity Index (AI), Citability Index (CI), Relative Qualitative Index (RQI), Publication Effectiveness Index (PEI), and Participative Index (PaI) are some of the indicators that measure the level of activity in a specified time-span and geographical region and their relative impact. The papers analyzed these indicators were conducted by Gupta and Dhawan (2009), Jeevan and Gupta (2002), Mohan et al. (2010), Nagpaul (1995), Sevukan et al. (2007), Singh et al. (2005), and Tripathi and Kumar (2015). While studying Indian scientific research output, Gupta and Dhawan (2009) calculated the AI of Anna University for different time zones 1985–86 (0.33), 1993–94 (0.48), and 2001–02 (1.84). Nagpaul (1995) has used several performance indicators, that is, AI, CI, RQI, PEI to analyze the productivity of Indian Universities in the scientific literature. The AI for IIT Madras in the field of Physics is 195 and CI is 164 which revealed that IIT Madras put more than average research effort and earned more than average impact as well. In chemistry the AI and CI for Sardar Patel University (SPU), Vidyanagar were 184 and 227, respectively which depicts that the impact is higher than the effort put. The relative quality index of Hyderabad University, Bombay University, and IISc, Bangalore were 330, 168, and 156, respectively. The PEI of Hyderabad University was 1.42 and for Bombay University it was 1.35 and IISc was 1.24. The Productivity of Indian Universities in Plant sciences was studied by Sevukan et al. (2007) which revealed that the PAI for BHU was 47% followed by JNU-23.01%, and Aligarh Muslim University (AMU)—16.16%.
Application of the classical laws of bibliometrics
Several studies tested the applicability of Lotka’s Law of productivity, Bradford’s Law of journal scattering, and Zipf’s key word distribution which were studied by Bhatia (2010), Gupta and Dhawan (2008), Gupta et al. (1998), Mishra et al. (2014, 2015), Muthukrishnan and Senthilkumar (2017), Poon and Leeves (2017), Savanur and Konnur (2012), Sevukan et al. (2007), and Sevukan and Sharma (2008). Gupta et al. (1998) found that Lotka’s Law and the negative binomial distribution model were applicable and valid in the initial stage of the growth of physics literature in India from 1900 to 1950. Sevukan and Sharma (2008) analyzed the research performance of biotechnology faculties of central universities. The study revealed that Lotka’s law was valid with the values n-2.12, C-0.669, and D-0.027, and the same data was not found fit Bradford’s law of distribution as the number of journals found in the three zones were in the ratio 4:16:55 which did not comply with the formula 1: n: n2. The growth and research output of Bangalore University was studied by Savanur and Konnur (2012). The Bradford multiplier was 5.05 and the average Bradford multiplier was 4.85. The number of journals in the three zones was 21, 106, and 488. The number of journals in the third zone was 488 which was close to the expected value of 535 which means that though the value was close still the data did not strictly follow the law. Aswathy and Gopikuttan (2015) studied the research trends of three Universities in Kerala. Lotka’s inverse square law was found to be fit for the University of Calicut but did not fit to the data of the University of Kerala and Mahatma Gandhi University. Muthukrishnan and Senthilkumar (2017) analyzed the Indian research output in Oncology. This study calculated the value for D = 0.006, at 0.01 level of significance, K-S Statistics = 0.011. As D was less than the K-S Statistics, the data was found to fit Lotka’s law with the value n = 2.04.
Scope of bibliometrics laws
Lotka’s law can be applied both as inverse square law and in its generalized form to the author productivity data. The three methods used to evaluate the author productivity in a scientific field are straight counts, normal counts, and fractional counts. “Straight counts” assign all credits to the senior/first author; “Normal counts” give each author one credit; and “Fractional counts” assign a credit equal to l/n to each of the n co-authors. According to Crane (1972), the development in a research specialty passes through four stages. In stage one the initial development of research area with many transient authors, and few authors with more than short activity. Stage two is the pioneering stage, illustrating the exploding learning processes of a few pioneering contributors. Stage three symbolizes the condition, where the increasing productivity curve of the pioneers starts reducing and the activity of the followers of the pioneers starts increasing in a significant manner and new authors starts appearing. The last stage, that is, stage four, in which normally the perceived interest in the field falls sharply and consequently opportunities decline, and researchers/authors start migrating to other fields. One implication of Lotka’s law is that past publication increases the probability of further publication.
Bradford Law states that the number of group of journals to produce nearly equal numbers of articles is roughly in proportional to 1:n:n 2 . . ., where n is called the Bradford multiplier. In other words, no matter what the specialty, a relatively small core journals will amount for as much as 90% of the attempt together 100% of it will add journals to core at an exponential rate.
Application of statistical tools
A wide range of statistical tools and models have been used by researchers for some of the productivity studies. These tools included the mean, Coefficient of variance (CV), Standard Deviation (SD), Gini coefficient, diffusion model, regression model, and Kolmogorov Smirnov (K-S) statistical test. These papers were studied by Abouchedid and Abdelnour (2015), Bai and Hudson (2010), Bezzaoucha et al. (2014), Drivas et al. (2015), Duque et al. (2005), Fox (1983), Gayan and Singh (2019), Gupta et al. (1998), He et al. (2009), Hollis (2001), Hong et al. (2007), Hughes (1999), Lafuente and Berbegal-Mirabent (2019), Marisha et al. (2017), Muthukrishnan and Senthilkumar (2017), Neri and Rodgers (2006), Samadikuchaksaraei et al. (2018), Sevukan et al. (2007), Valadkhani and Ville (2009), and Wanner et al. (1981).
Samadikuchaksaraei et al. (2018) studied the research output of regenerative medicine in Iran in comparison to other world regions. He used the linear regression model (ANCOVA Model) to determine the best fit linear model to explain the general growth in different world regions. The highest growth rate was observed in East Asia, Europe, and North America. Gupta et al. (1998) studied the growth of Indian Physics and World Physics literature. The increased value g (Gini-coefficient) showed the rise in the concentration of author productivity and consequently, there was an increasing inequality between more productive and less productive authors which was reflected in the decreasing value of £. The research trends of faculties of plant sciences of Indian Central Universities were studied by Sevukan et al. (2007). The highest level of variation (CV) was found in Visva Bharati Shantiniketan (101.02) followed by Pondicherry University (91.18) and Delhi University (74.54).
Scope of statistical tools
Researchers use various statistical tools to study the correlation between two or more variables and implement several models to study the growth pattern. The most common statistical tools are standard deviation (SD) that indicates how far the average value lies from the mean, measuring the spread of values in a single dataset. Coefficient of variance (CV) is the ratio between standard deviation to the mean. These two variables reflect the variability in data distribution, whereas, another statistical tool Gini coefficient reflects the degree of inequality in a dataset. Regression analysis is used to study the influence of one or more independent values on a dependent variable. Besides the growth metrics, various growth models namely exponential, logistic and power models are used by the library scientists to evaluate the growth in a discipline. Pearson Correlation and Spearman correlation are used to study the correlation between two variables. The value ranges from −1 to +1 and 0 denotes no correlation between the variables.
Findings and conclusion
The present paper is a comprehensive analysis of the metrics used in a set of publications (N = 131) on research productivity through the method of systematic literature review. It analyzed 131 articles covering 40 years published by 34 publishers in 69 sources. In this systematic review process, several aspects related to the study of research productivity are explored. The findings of this study were derived in two ways, that is results of quantitative analysis and results of qualitative analysis. The prime objective of quantitative analysis is to show the growth pattern of publications, the leading journals, publishers where studies on research productivity are reported and the datasources used by researchers. As regards quantitative analysis, it was observed that there is significant growth in the number of articles during the fourth decade (2011–2020) in which 91 articles have been published whereas the highest number of citations (1530) have been received during the third decade from 2001 to 2010. Journal articles appeared to be the predominant source of information and as many as 36 articles were published with the keyword “research output” which is highest than other synonymous words. About the number of studies across the disciplines, it is Technology that dominates the other disciplines with the highest (48) number of publications covered in the dataset. Though the total number of (131) articles are contributed by 34 publishers it is University of Nebraska, Lincoln (USA) has the highest number of publications (21), followed by DESIDOC (20 publications) from India. In the list of top 10 IF journals,
In the second part of the study which is meant for qualitative analysis, it was observed that the 10 highly cited articles received a total number of 1897 citations which is more than half (55.51%) of the total citations received to the entire set of articles. The review article that received the highest citation (619) published in the journal “Social Studies of Science” authored by Mary Frank Fox in the year 1983 highlighted the determinants of productivity among scientists. This indicates that the review articles are also referred by the library science researchers. Further, it was observed that the share of NCP was larger than the ICP. However, the ICP had a greater growth rate in comparison to the country average. Among ICPs, the bilateral papers were more than the multilateral papers. The USA was the top player in collaborative research in almost all subject fields. The DC was close to the value one except for a counted few studies which suggested the multi-authorship pattern in practice. AGR and DT were found to be fluctuating that showing the growth trend in both upward and downward trends. The h index of Hyderabad University (49) was highest followed by DU (45) and Panjab University (44) in the study of scientific productivity whereas in social science Jadavpur University achieved the h index of 15, p index 12.10 followed by AMU (12 and 8.61) and University of Calcutta (12 and 7.74) and BHU (12 and 5.77). East Asia produced the highest research papers in physics followed by Europe and North America. It was observed that the wide range of metrics used in the sample literature to analyze the research productivity can be classified based on their usage patterns like basic metrices associated with publications and their citation impact like—TP, TC, ACPP, ACPY, PPC, PCPP, HCP; metrics that measure the growth of publications are AGR, CAGR, RGR, DT; metrices that measure collaboration among authors are LCP, NCP, ICP, DC, CI, CC, MCC, CAI; metrices that measure the productivity and impact of publications of authors and institutions are h index, g index, p index, i10 index, PEI; metrices that measure the productivity of a country or region in a specific period are AI, CI, PEI, and PaI.
Implications
The evaluation of research productivity, whether at the level of an individual researcher, research groups, universities or institutions is an important factor. The results of such studies have major consequences in terms of funding and career growth of the individual academicians. The primary driver of an evaluation process is the assessment of the quality of research output for which a number of metrics are currently being used. The present study which is a systematic literature review focused on various metrics is unique in its own right and value addition in the area of research evaluation. The study has several implications for the researchers, practitioners and policy makers. It gives an idea about the major publishers and journals in which the researchers prefer to publish their papers on research productivity. It will be helpful to other researchers to target their publication in the appropriate journal outlet. The data sources highlighted in the paper will guide the other researchers to conduct their studies by collecting data from pertinent data sources. As the study has made a comprehensive analysis of the metrics on research productivity (28 metrics) it will serve as a reference tool to the scholars and practitioners in the field who will be acquainted with the various metrices, and laws of bibliometrics, used in the articles. Previously, policy makers used publication count, citation analysis and Impact Factor (IF) to judge the quality of scholarly research. But the present study concluded that a wide range of metrics have been developed to rank the academic standing of journals, authors, educational institutions, as well as collaboration patterns of countries in a more robust way. As every research work is a unique genre of information, the present study will be helpful to provide valuable insights into various dimensions of the research metrices.
Footnotes
Declaration of conflicting interests
The author(s) declared no potential conflicts of interest with respect to the research, authorship, and/or publication of this article.
Funding
The author(s) received no financial support for the research, authorship, and/or publication of this article.