
Abstract
The study gauges the research performance of the BRICS bloc in the field of Library and Information Science (LIS) research using Performance analysis and Science mapping. The Web of Science database is used for the study and articles published between 2013 and 2022 have been selected for analysis. Data analysis and visualisation have been done using the Bibliometrix R package and VOSviewer. The findings reveal an upward trend in publications. Furthermore, China has been the most prolific nation in terms of productivity and impact. Scientometrics is the leading source in terms of publications while the International Journal of Information Management is the most cited source. With regard to author productivity, Zhang Y has the highest number of publications while Lowry PB is the most cited author. Wuhan University is the most productive organization. In terms of collaboration, the USA is the primary partner for the entire BRICS group, particularly China and collaboration among the BRICS isn’t as significant as it is with the non-BRICS countries. This study provides insightful information about recent scientific developments in the field of LIS. Additionally, by using this research as a guide, researchers from different fields will be able to analyse how the body of knowledge on a certain subject has evolved over time. This study also outlines potential research directions in this field of research.
Introduction
Research has taken on a vital role in all facets of life due to the tremendous significance that its results have for advancing civilization. As a result, there has long been a growing interest in scientific research (Budd, 2015). The assessment of research productivity is one of the analytical tools necessary for upholding high standards of research performance, and it also has a big impact on making decisions and policies (Lochan Jena et al., 2012; Moed et al., 1995). Bibliometric techniques are now widely used for analysis and to evaluate the development of various research areas (Ellegaard and Wallin, 2015). Bibliometrics is defined as ‘the application of mathematical and statistical methods to the entire scientific literature, including; books and other documents’ (Pritchard, 1969). To put it another way, it is the quantitative analysis of publication trends using statistical and mathematical computations (Thanuskodi, 2010). The number of bibliometric studies has increased due to the ease with which data could be gathered and processed due to developments in data access, collection, software analysis, techniques and technologies. Bibliometric techniques are helpful primarily in two ways: (a) they help scholars fully understand fields of study; and (b) they offer more accurate and quantitative evaluations of any subject (Zupic and Čater, 2015). Additionally, bibliometric techniques allow academics to examine a huge number of publications from various institutions, nations and disciplines (Wallin, 2005). Through databases like Web of Science (WoS) and Scopus, it is now much simpler to find studies and conduct analyses. These developments in the discipline make it easier to analyse the influence and development of scientific publications (Ellegaard and Wallin, 2015).
Bibliometric methods are becoming increasingly prevalent in examining research topics from diverse perspectives, such as collaborations, citations and more, to determine global rankings of scientific institutions (Ellegaard and Wallin, 2015; Gazni et al., 2012; Wallin, 2005). The use of bibliometrics is crucial for comprehending the strengths and limitations of a particular field (Bornmann et al., 2015; Zeinoun et al., 2020). Multiple research fields have employed bibliometric approaches such as Nanotechnology (Chauhan, 2020; Elango, 2017), Artificial Intelligence (Huang et al., 2022; Shao et al., 2022), Tourism and Hospitality (López-Bonilla and López-Bonilla, 2021; Ülker et al., 2023), Internet of Things (Erfanmanesh and Abrizah, 2018; Rejeb et al., 2020); Big Data (Amado et al., 2018; Liang and Liu, 2018), Robotics (Aghimien et al., 2020; Carter-Templeton et al., 2018 and Gastronomy (Okumus et al., 2018; Sahin, 2022). Over the years, librarianship has been regarded as a subject of professional practice and scientific research (Nolin and Åström, 2010). The development of the Library and Information Science (LIS) profession can be assessed by research in this discipline. Therefore, it is necessary to examine the research output of LIS to determine its strengths and weaknesses. Evaluation of the scientific production and impact of various subject areas, nations, authors and organizations is one of the main objectives of scientometric studies (Erfanmanesh et al., 2010). So, the current study is an attempt to gauge the LIS research output in the BRICS (Brazil, Russia, India, China and South Africa) nations. BRICS is a significant group that brings together the world’s emerging economies that constitute ‘41% of the world population, 24% of the world GDP and over 16% share in the world trade’. Over the years, the primary drivers of global economic growth have been the BRICS nations (BRICS, 2021). In 2001, Goldman Sachs coined the acronym BRIC to represent a group of the world’s largest emerging economies in the 21st century. South Africa’s inclusion in the group in 2011 gave the BRICS its final membership, which included an African nation (Brand South Africa, 2016; Brics-Brasil, 2019; O'neill, 2011). ‘The BRICS countries are thought to have the capacity to “change the world” on account of both the threats and the opportunities they represent from the economic, social and political points of view’ (Cassiolato and Lastres, 2011: 1). The BRICS nations exhibit several commonalities from a scientific and technological standpoint. On their respective continents, they are strategically positioned (in science) in a significant way. Despite regional variations in human, economic and scientific growth, these countries have invested significantly in research and development infrastructure. Additionally, they make substantial contributions to the global community of scientists and engineers, as highlighted by Cassiolato and Lastres (2011) and Kumar and Asheulova (2011). Given their success in science and technology, these nations serve as models for other emerging countries, as noted by Adams et al. (2013).
Literature review
Bibliometrics approaches are well-known for assessing the output and influence of scientific literature across practically all disciplines. They employ quantitative and statistical techniques to demonstrate the publication trends and contribution patterns within a particular field of research. The information acquired via bibliometric analysis is highly valuable and aids in researchers’ ability to compare researchers, regions, disciplines, institutions and nations (Belter, 2018; Singh and Chander, 2014). The literature review suggested that numerous bibliometric studies have been conducted globally gauging the output and influence of different subject areas, nations, journals and regions. For instance, De la Vega Hernández et al. (2023) examined the research output in the field of Artificial Intelligence (AI) using the WoS database. The findings reveal that the Northern hemisphere nations produce the bulk of the output with the USA and China being the most prolific nations. Furthermore, The USA and China collaborate more with their national counterparts while countries like Germany, France and England equally collaborate with peers from other nations. Huang et al. (2023) conducted a bibliometric analysis of articles published on AI in Colorectal Cancer (CA) using the WoS database. The findings suggested that China was the leading nation in terms of publications while the USA had received the highest citations. Mori Y and Ding K were the most prolific authors. Furthermore, the majority of the prolific institutions belonged to China. Tigre et al. (2023) assessed research productivity on ‘Digital Leadership’ (DL) using the WoS and Scopus databases. The findings revealed that the USA is the highest contributor to DL research. Furthermore, authors from the USA received the bulk of the citations. Liu et al. (2023) studied the research productivity in the field of Rural Revitalization using the WoS database. The findings revealed that the research output has increased in the last three decades. China, the USA and Canada have produced the bulk of the output. Moreover, the most frequently used author keywords were ‘migration, management and urbanization’. Bao et al. (2023) conducted a bibliometric analysis of ‘socially sustainable transport research’ using the WoS database. The results suggested that the USA, China and the UK produced the bulk of the research. ‘Multi-objective optimization and the social sustainability index for the transportation’ sector were identified as two persistent research areas by cluster analysis. Furthermore, the University of London was the most productive institution. Sheikh et al. (2023) analysed COVID-19-related research trends in the field of LIS. The findings revealed that LIS journals have published a wide spectrum of research on COVID-19. The inclination towards single-authorship patterns persisted, and the document type ‘Article’ continued to be the most popular format for communicating research among LIS researchers. Banshal et al. (2022) gauged the research productivity on ‘global digital journalism’ using the Dimensions database. The findings revealed that the developed nations had produced the majority of the output and the leading sources were ‘Digital Journalism, Journalism, Journalism Practice and Journalism Studies’. Aleixandre-Tudó et al. (2020) evaluated the global research output in nanotechnology using the WoS database. The outcomes show how institutions and nations have collaborated significantly. Compared to other disciplines, the funding for nanotechnology research was remarkable. Shen et al. (2019) conducted a bibliometric analysis of gerontology research using the WoS database. The results revealed that the papers published prior to 2007 received more citations. Keywords such as ‘Dementia, older adult and Alzheimer’s disease’ were the most commonly used author keywords. Similarly, many studies have gauged the research output of specific countries, for instance, India (Chauhan, 2020; Dayal et al., 2021; Elango et al., 2023; Kumar et al., 2023; Mohan and Kumbar, 2022; Vaishya et al., 2022), Canada (Ghiasi et al., 2021; Pietroniro et al., 2023; Ross et al., 2023; Verhoeff et al., 2023), Pakistan (Ahmad et al., 2022; Siddique et al., 2021; Wahid et al., 2022, 2023), South Africa (Mbambo et al., 2022; Noubiap et al., 2023; Olisah and Adams, 2021; Vink et al., 2022; Wani et al., 2023) and Kenya (Atieno et al., 2022; Kwanya, 2020; Ogot and Onyango, 2022). While others have focussed on the contribution of different journals such as the Journal of Religion and Health (Carey et al., 2023), the International Journal of Finance & Economics (Baker et al., 2023), the European Journal of Translational Myology (Khosravi, 2022), the Journal of Information Science (Cobo-Serrano et al., 2022), Library review (Swain et al., 2013), DESIDOC Journal of Library & Information Technology (Garg et al., 2020), the European Journal of Finance (EJF) (Burton et al., 2020), the Anales de Documentación and BiD textos universitaris en biblioteconomia i documentació (Vàzquez et al., 2019). Furthermore, some studies measured the research productivity across regions such as Asia (Barrot, 2023; Ilagan-Vega et al., 2022; Jalipa et al., 2021; Liverani et al., 2023; Ornos and Tantengco, 2023; Ray et al., 2019; Tantengco, 2021), Africa (Ali and Elbadawy, 2021; Haddison et al., 2019; Kapuka et al., 2022; Mutebi et al., 2022; Noubiap et al., 2023; Sebola, 2022; Uwizeye et al., 2020), Europe ( Begum et al., 2020; Hâncean et al., 2021; Maes et al., 2019) and North America (Chaudry et al., 2023; Julien et al., 2021; Lee et al., 2020; O’Neill et al., 2021).
With respect to the field of Library and Information Science (LIS), numerous bibliometric studies have been conducted that have focussed on specific aspects related to the LIS field which includes Library Service quality (Ashiq et al., 2022), Digital Libraries (Ahmad et al., 2018a); Continuous Professional Development (Rehman et al., 2023), Knowledge Management (Ahmad et al., 2018b), Human Resource Management (Wani and Ganaie, 2023). Similarly, other studies have presented an overall literature output in the field (Ahmad et al., 2020a; Barik and Jena, 2019; Jabeen et al., 2015; Okeji, 2019; Siddique et al., 2021; Wani et al., 2023). Moreover, some researchers have analysed the research output of specific LIS journals (Garg et al., 2020; Hussain et al., 2011; Jayaraman et al., 2012; Singh and Chander, 2014; Swain et al., 2013). With regard to BRICS, there is a plethora of bibliometric literature available. For instance, Wagner and Wong (2012) examined the ‘global BRIC National scientific publications’. Their goal was to determine whether or not these nations were underrepresented in the Science Citation Index Expanded (SCIE). The findings revealed that, shockingly, the BRIC nations’ presence in global output was on par with that of developed nations like North America and Europe. But, as the authors noted, national publications had significantly less visibility. Yang et al. (2012) and Yi et al. (2013) performed two intriguing comparative studies. Yang et al. (2012) compared BRIC countries to G-7 nations with regard to the disciplinary structure of scientific production. Compared to the G-7, the BRIC exhibit greater variability and a more distinct individual discipline structure. Also, from 1991 to 2009, the four BRIC countries (excluding Russia) changed their organizational structure to be more similar to the G-7. Apart from Brazil, the G-7 places more of an emphasis on life sciences. As opposed to this, Yi et al. (2013) compared the four BRIC nations with ‘CIVETS (Columbia, Indonesia, Vietnam, Egypt, Turkey and South Africa)’. Despite the fact that BRIC countries have had a far higher level of scientific production, there are significant commonalities between the two groups’ scientific outputs. Finardi (2015) examined the research collaboration among BRICS nations. The findings revealed that the nature of bilateral collaborations is heterogeneous. In addition, inter-BRICS collaboration trends have remained consistent throughout time. Also, there is heterogeneity among various scientific fields. Bornmann et al. (2015) looked into the growth of the BRICS nations in the field of most-cited papers (top 10% and 1% most frequently cited papers) from 1990 to 2010. The study compared the BRICS nations with the world’s top performers in order to determine the extent to which these nations have emerged as significant players at the highest level. Other than Russia, the BRICS nations have increased their output which is frequently cited at a faster rate than the nations that receive the most citations globally. Bouabid et al. (2016) examined the scientific collaboration between BRICS and G-7 nations. The results highlighted that BRICS countries’ increased scientific output is greatly aided by their international collaboration, particularly with G-7 nations. The USA continued to lead the globe in nearly all scientific domains, with China emerging as the fastest-growing nation in terms of both its scientific output and its collaboration proximity to the G-7 countries. However, the growth of scientific collaboration between BRICS nations has not been as rapid as that between BRICS and the G-7. Shashnov and Kotsemir (2018) explored the research landscape of the BRICS nations. The findings demonstrated that BRICS nations have advanced significantly in their scientific and technical growth in recent years, largely due to China’s achievements. While all of the BRICS nations have distinctive research environments, the thematic structures of fundamental research in the majority of BRICS nations have shifted towards the global scientific agenda. Moreover, all of the BRICS countries collaborate with China the most, and throughout the course of the period, its influence index has consistently increased. Elango (2019) gauged the research output of BRICS nations in Engineering research and found that China was the most productive nation. In terms of citations, Brazil had the most citations per paper. Furthermore, there was a heterogeneity with regard to publishing in sub-disciplines of Engineering. Savanur (2019) noted that BRICS nations collectively produced about 10% of all economic research conducted worldwide. China made the highest contribution followed by Russia. Misgar et al. (2020) explored the contribution of the BRICS bloc towards OA research data repositories and revealed that India had contributed the most towards the OA repositories followed by China. The majority of repositories included content about Scientific and Statistical data formats Castor et al. (2020) mapped the researched productivity on Tuberculosis (TB) in the BRICS bloc from 1993 to 2016. The results suggested that there has been a sharp rise in the number of publications coming from India since 2000. After 2006, there was a significant rise in the number of publications from China, South Africa and Brazil. Moreover, China’s pace of production grew after 2010. Among the BRICS, India and South Africa interacted more, and Chinese and Indian organizations were the most productive; however, South African organizations interacted more with nations outside the BRICS. Zia (2021) analysed the Open Access (OA) research output of BRICS nations from 2010 to 2019. The results highlighted that there has been consistent growth in productivity and China has been the most productive partner. Furthermore, the most productive institutions belonged to China. Miranda et al. (2021) explored the research on ‘Green Technology Practices’ in the BRICS bloc. The results highlighted that China and India were the leading contributors to this domain while South Africa was the least productive. Das and Verma (2021) assessed the Digital Library research output among BRICS nations and noted an upward trend in research productivity. The majority of the articles had multiple authors. China and India were the most productive nations. However, Lotka’s Law wasn’t found in line with the observed author’s productivity. Shueb and Gul (2023) assessed the funding distribution across several research fields in the BRICS bloc. The study concluded that China received the highest funding ratio while India had the lowest. Microbiology received the highest funding ratio. Additionally, among the BRICS countries, regional funding organizations are the main sponsors of research.
The BRICS countries are among the fastest-growing economies in the world and are home to some of the largest populations. As such, they have become increasingly important players in the global academic landscape. Library and Information Science (LIS) is a vital field that contributes to the development and dissemination of knowledge, particularly in the digital age where information is readily available and easily accessible. However, the review of the literature revealed that there is a dearth of literature with regard to BRICS’ contribution to the LIS domain and therefore only two related studies (to the best of the authors’ knowledge) could be identified. Despite their substantial contributions to the literature, neither of them is without limitations. Tripathi et al. (2018) used only one technique of bibliometric analysis that is, Performance analysis. Moreover, the time span of the study was limited till 2014. Similarly, Gupta and Chakravarty (2022) also left out some parameters such as keyword analysis, country collaboration, funding agencies and productive institutions. In addition, the time span for this study was limited to 2020. Therefore, the current study has made an attempt to overcome the limitations of the prior studies. By using bibliometric tools and techniques, this study aims to identify and evaluate the research output of the BRICS countries in the field of LIS. The findings of this study can have important implications for policymakers, academics and practitioners in the field of LIS. It can help identify areas where these countries are excelling and areas where they need to improve, which can inform the development of policies and strategies aimed at strengthening research and innovation in the field of LIS. Additionally, this study can serve as a valuable resource for researchers, providing insights into the most prolific authors, institutions and countries, as well as the most influential publications in the field. Moreover, this study has the potential to make a significant contribution to the field of LIS by providing a comprehensive and systematic analysis of the research output of the BRICS countries, using bibliometric tools and techniques. The objectives of the present study are:
(1) To analyse the publication trend of the LIS research output in the BRICS bloc.
(2) To determine the prolific authors, sources, countries, organizations and funding agencies.
(3) To examine the collaboration trend in the BRICS bloc.
(4) To analyse the conceptual structure with regard to trending topics and thematic evolution of LIS research in BRICS.
Methodology
The bibliometric methodology encompasses the use of quantitative methods (i.e. bibliometric analysis – for instance, citation analysis) on bibliometric data (for instance, units of citation and publication) (Broadus, 1987; Pritchard, 1969). The bibliometric analysis incorporates two key techniques, Performance analysis and Science mapping. Performance analysis examines the contributions of research constituents (e.g. authors, institutions, countries and journals) to a specific field. There are numerous performance analysis metrics available. The most common metrics are the number of publications and citations per year or per research component, where citations are indicators of impact and influence and publications serve as proxies for productivity. Other metrics, such as citations per publication and h-index, combine publications and citations to assess the effectiveness of research constituents. Although the study is descriptive, it acknowledges the significance of several research field components. (Dhonthu et al., 2021). Science mapping shows spatial relationships between various scientific actors (Gaviria-Marin et al., 2019). Science mapping includes ‘citation analysis, co-citation analysis, bibliographic coupling, co-word analysis and co-authorship analysis’. (Dhonthu et al., 2021). The modus operandi for the present study is based on bibliometric techniques presented by Dhonthu et al. (2021) and is illustrated in Figure 1.

Bibliometric techniques.
Data retrieval and analysis
The data was gathered from the Web of Science (WoS) database and the following search string was executed: WC = (Information Science & Library Science) Countries: China, Brazil, India, South Africa, Russia, Document Type: Article, Time-Span=2013-2022 (Figure 2). The search query retrieved 8426 articles which were used for the analysis. Data analysis and visualization were done through the Bibliometrix R package (Aria and Cuccurullo, 2017) and VOSviewer (van Eck and Waltman, 2010).
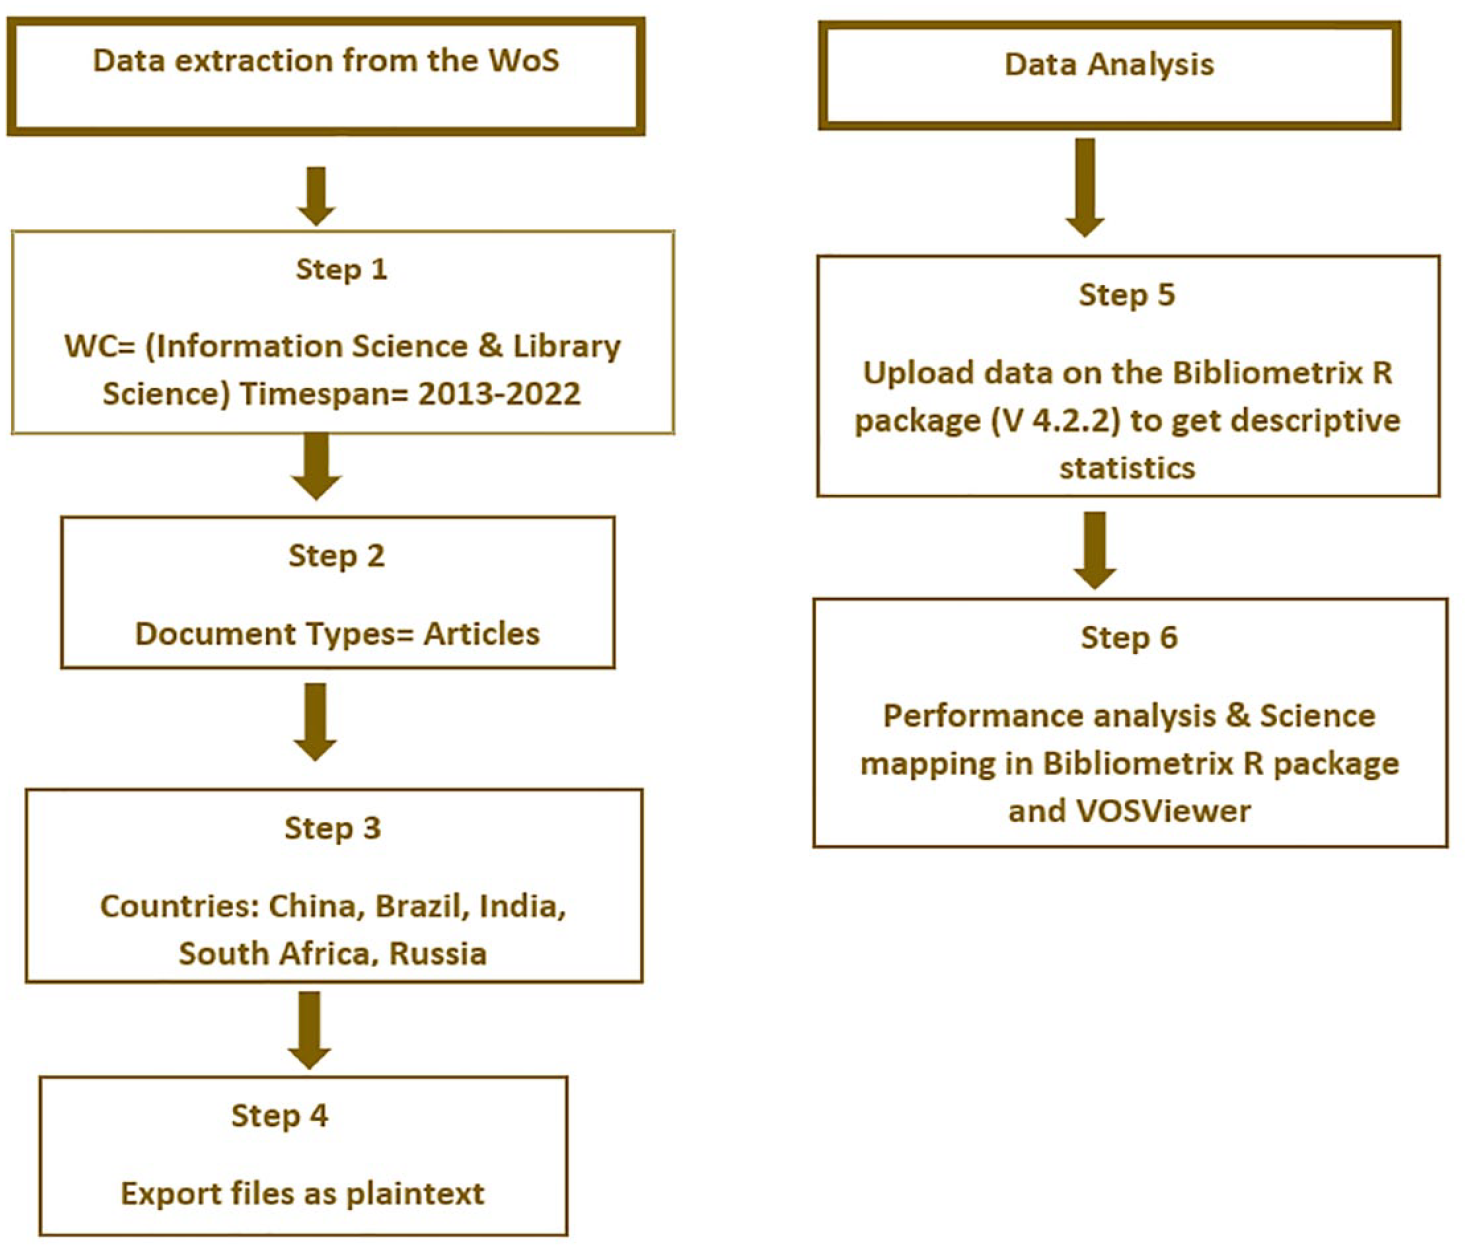
Data retrieval and analysis methods.
Performance analysis
Descriptive statistics and publication trend
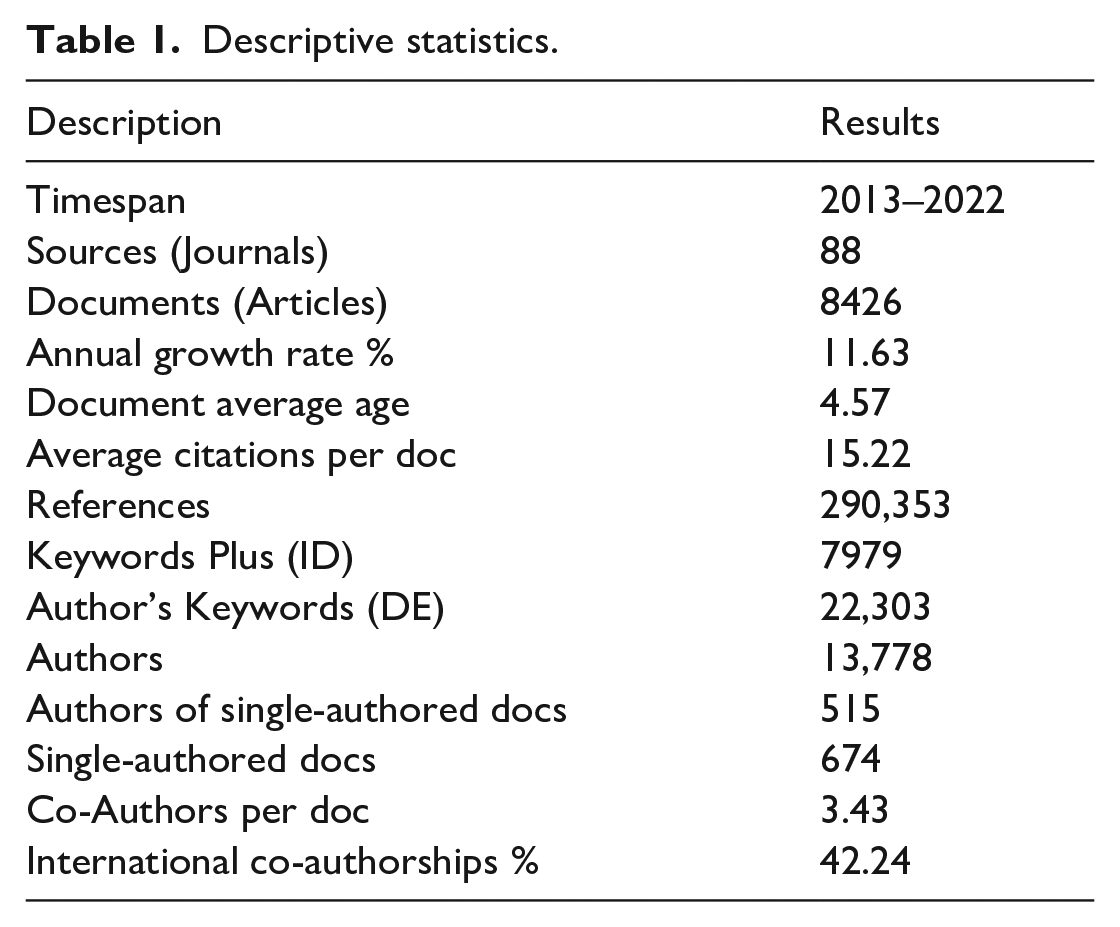
Bibliometric analysis is used to evaluate the research output of individuals, groups, institutions and countries. The trend in publications over time provides insight into the productivity and impact of researchers and their research groups. This information can assist in making decisions related to research funding, collaboration and strategic planning. Publication trends can be used to benchmark the performance of research groups or institutions against their peers (Wani et al., 2023). Therefore, Table 1 implies the descriptive statistics about the current study’s corpus. Eighty-eight sources contributed to 8426 articles since the last decade (2013–2022) at an annual growth rate of 11.63%. Publication trends can help identify the emergence of new research areas, the decline of existing research areas, and the evolution of research over time. The average citation per article was 15.22. Furthermore, a total of13,778 authors contributed to the LIS research field in the BRICS bloc. The average number of authors per paper was 3.43 and 42.24% of the papers were a result of international collaboration. In terms of publication trends, as highlighted in Figure 3, there has been growth with each passing year and 2022 contributed to the most number of publications (1316). Some of the earlier studies also found a positive trend in terms of publications related to the LIS research output (Ahmad et al., 2018a, 2018b, 2020a; Jabeen et al., 2015). Publication trends can be used as evidence of research productivity and impact on grant applications. This information can help researchers secure funding for their research projects. Moreover, 2013 received the highest average mean total citations per article (26.54) followed by 2015 (23.3) and 2016 (22.54) respectively while the highest average mean total citations per year were for the years 2020(4.54), 2019 (4.05) and 2018 (3.82). This information can help identify areas where improvements can be made to enhance the research output and impact. Publication trends can be used to evaluate the performance of individual researchers, which can be important for career advancement. Researchers can use publication trends to identify areas where they need to improve their research output and impact (Wani et al., 2023).
Descriptive statistics.

Publication trend.
Most relevant authors and impact
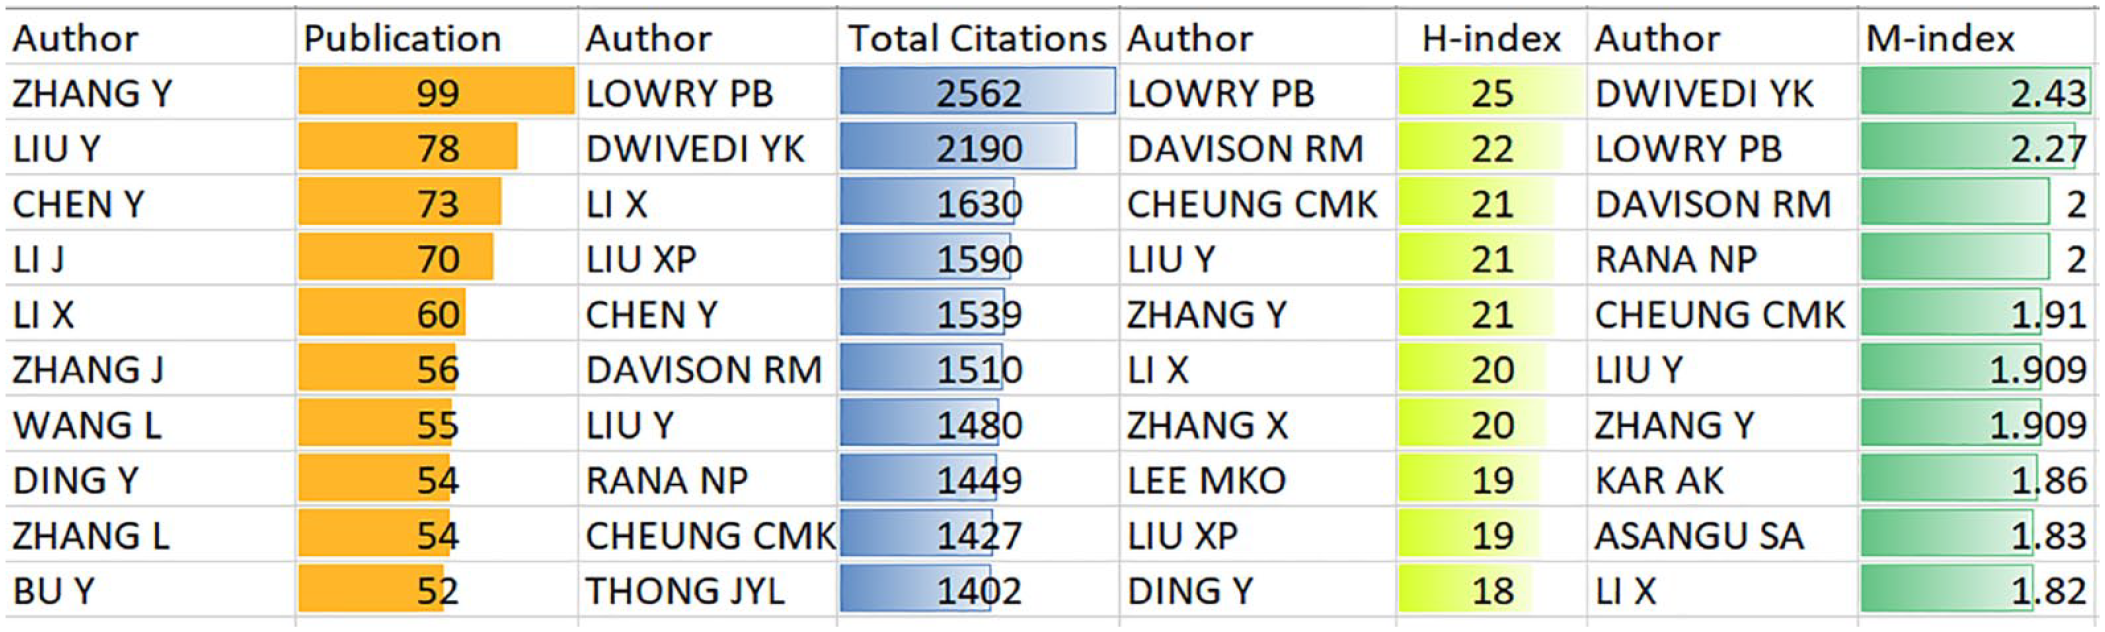
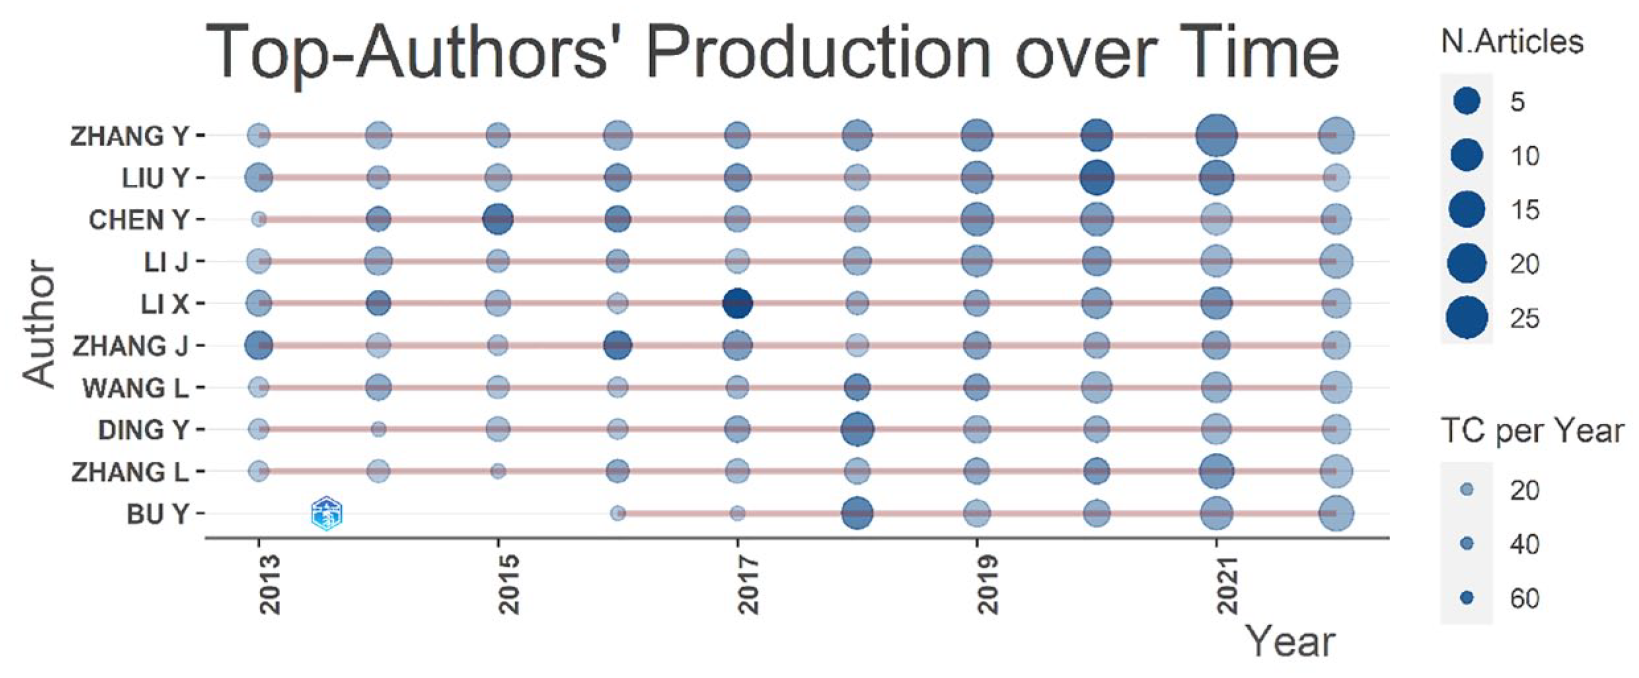
The impact of research is about how well-received by the scientific community. High citation counts indicate that a paper is well acknowledged by the research community and can increase the recognition and visibility of the authors’ work. Further, it can boost career advancements like opportunities for funding, promotion and tenure. Furthermore, the high impact can knock on the doors of collaboration opportunities (Wani and Ganaie, 2023). Therefore, the present study explored the most relevant authors in the LIS research area in the BRICS bloc. Figure 4 highlights top authors in terms of publications, citations, H-index and M-index in the LIS research across BRICS. Authors with the highest publications are. ‘ZHANG Y’ with 99 documents followed by ‘LIU Y’ and ‘CHEN Y’ with 78 and 73 documents respectively. With regard to the author’s productivity over time ‘ZHANG Y’, ‘LIU Y’ and ‘CHEN Y’ again lead the list suggesting they are the most active authors (Figure 5). It also depicts that the majority of the research has been published in the last 5 years. Furthermore, Figure 4 highlights the H-index of the authors. The h-index is a widely used metric that measures the productivity and impact of an individual researcher’s scholarly publications. It was first proposed by physicist Jorge E. Hirsch in 2005 to quantify both the productivity and impact of an individual researcher. The h-index provides a more comprehensive picture of an individual’s research impact than just the number of citations or the number of publications. It is a useful tool for comparing the productivity and impact of researchers working in the same field or subfield (Abafe et al., 2022). As evident from Figure 4, ‘LOWRY PB’ tops the list with an H-index of 25 followed by ‘DAVISON RM’ and ‘CHEUNG CMK’ with an H-index of 22 and 21 respectively. In terms of Total Citations (TC)”, ‘LOWRY PB’ is the most prolific author (2562 TC), followed by ‘DWIVEDI YK’ (2190 TC) and ‘LI X’ (1630 TC). With regard to the M-index, ‘DWIVEDI YK’ tops the list having an m-index of 2.43 which suggests that he could be regarded as the most promising researcher followed by ‘LOWRY PB’ (2.27) and ‘DAVISON RM’ (2). The m-index is a version of the h-index that indicates the h-index each year since the first publication. The h-index generally increases with career duration, therefore the m-index can be employed where this is a limitation, such as when comparing researchers in the same field but with very diverse career durations. The m-index presupposes continuous research activity since the first publication (Belter, 2018; Novak et al., 2011).
Top authors.
Authors’ productivity over time.
Most relevant sources and impact
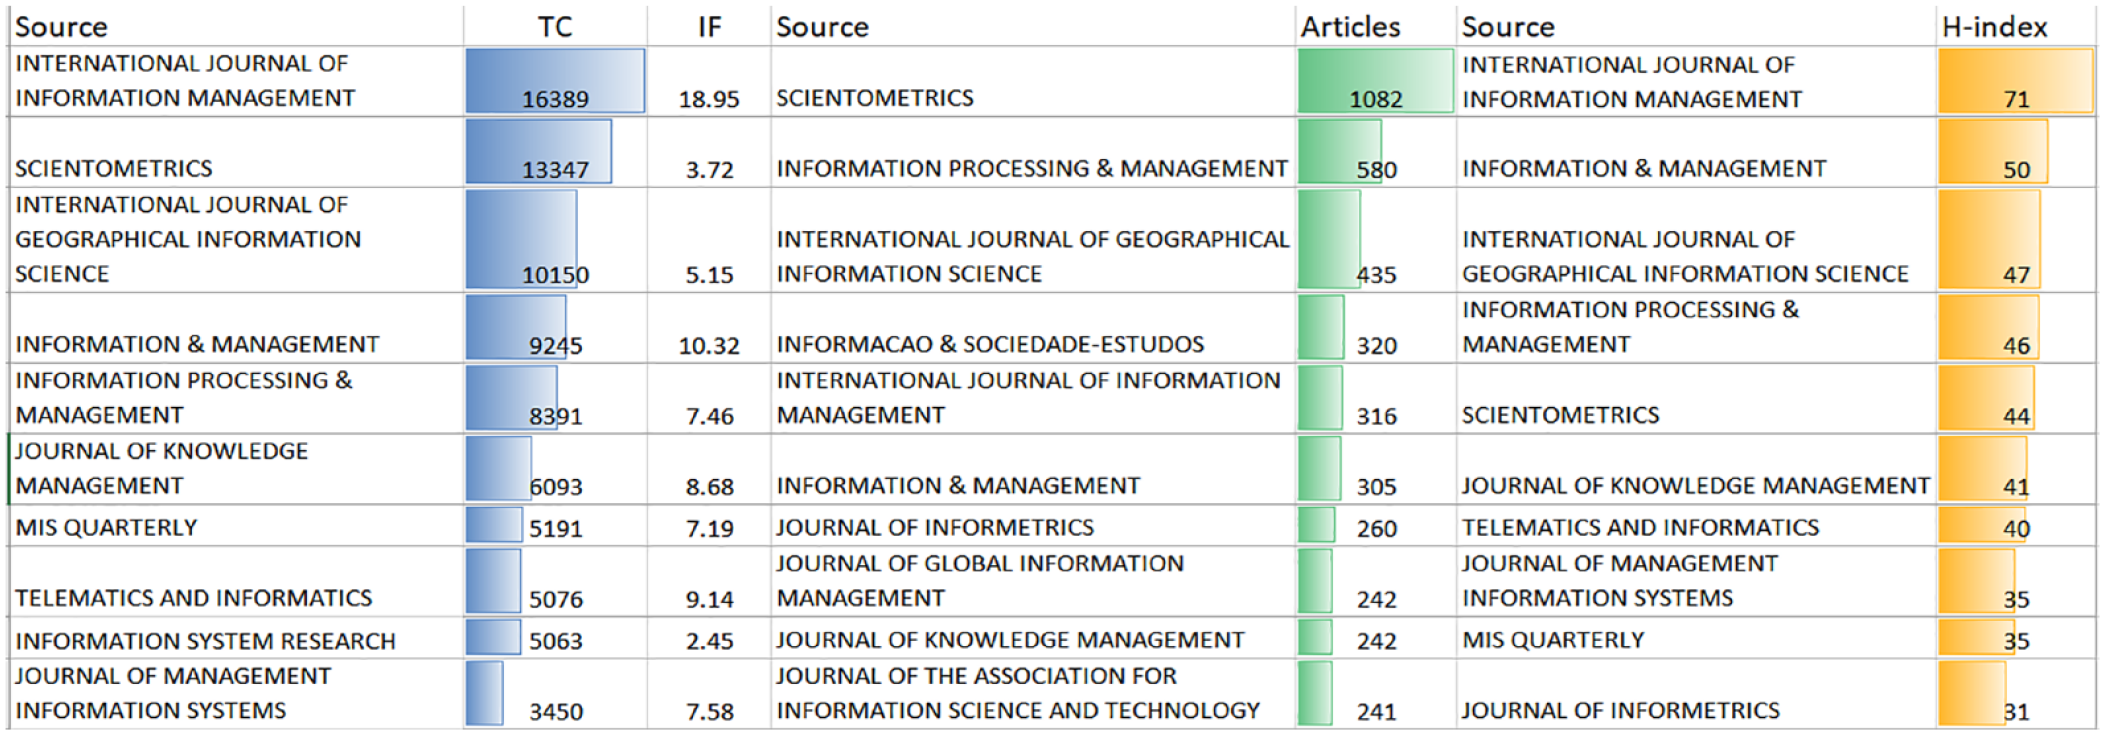
The most relevant sources of publication in bibliometrics can vary depending on the research field, but in general, they refer to journals or conferences that publish articles or papers that are most influential or have the highest impact on a specific research area. These sources are often considered prestigious and highly competitive, and researchers strive to publish their work in them to increase their visibility and reputation in the academic community (Wani and Ganaie, 2022). Figure 6 highlights the contribution and impact of the top 10 contributing sources. In terms of publications, Scientometrics contributed to the most number of articles followed by Information Processing and Management and the International Journal of Geographic Information Science with 1082, 580 and 435 publications respectively. This is followed by Informacao & Sociedade-Estudos (320), International Journal of Information Management (316), Information and Management (316), Journal of Informetrics (260), Journal of Knowledge Management (242), Journal of Global Information Management (242), Journal of Knowledge Management (242) and Journal of the Association for Information Science and Technology (241). Furthermore, the top 10 sources that received the highest number of citations are The International Journal of Information Management received the highest number of citations (16,389) followed by Scientometrics (13,347) and the International Journal of Geographic Information Science (10,150). High citation counts can increase the prestige and reputation of the venue, which can lead to increased submissions and better-quality papers. High citation counts can attract sponsorship for the venue and its associated events, leading to increased revenue. High citation counts can lead to a higher impact factor for the venue, which can increase the visibility and reputation of the venue. It is also worth mentioning that some of the sources with higher Impact Factors (IF) such as the Journal of Knowledge Management (IF = 8.68), Telematics and Informatics (IF = 9.14) and Journal of Management Information System (IF = 7.58) have comparatively lower citations due to fewer publications and which suggests that the higher the IF the harder it is to publish (Huang et al., 2021). Moreover, Figure 6 presents the top 10 sources ranked by Source local impact by H-index. The h-index is typically used as a measure to forecast future research (Huang et al., 2021). Our findings highlight that the International Journal of Information Management, Scientometrics, International Journal of Geographic Information Science and Information Processing and Management were the most active journals with high citations and publications. and will maintain the current trends in the future.
Top sources.
Country and Institutions – leading contributors to BRICS LIS research
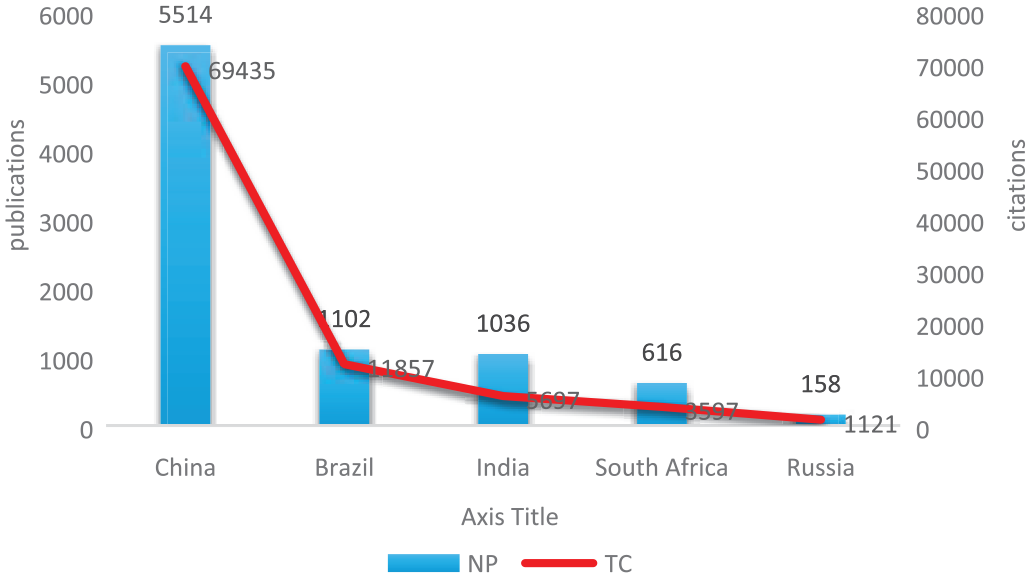
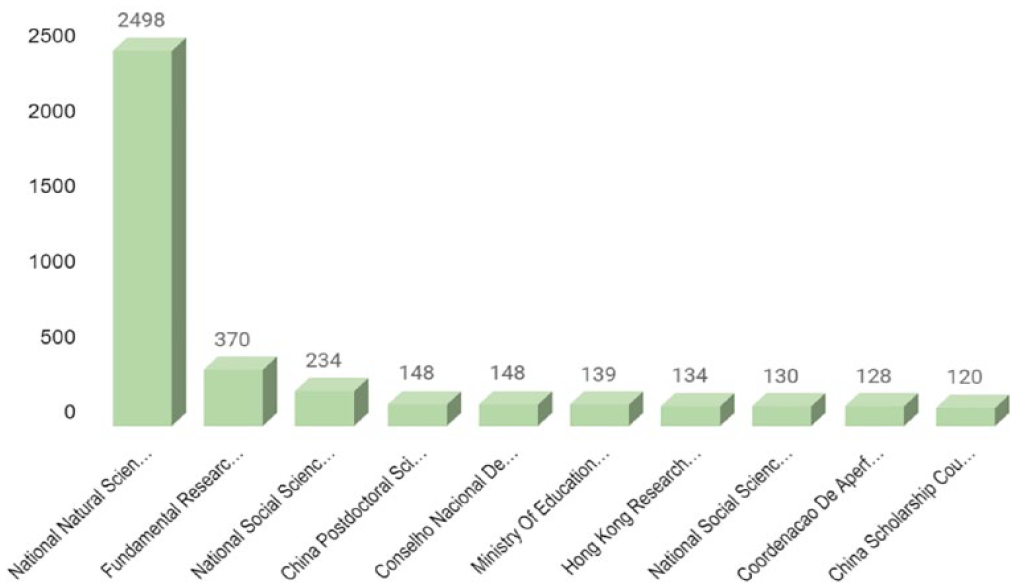
The research contributions of nations and institutions have the potential to improve our world in countless ways, from advancing our knowledge to improving our health, economy and social and cultural development. The research contributes to the expansion of knowledge in various fields, which leads to discoveries, theories and innovations. These advancements have the potential to significantly improve our lives and solve global challenges (Wani et al., 2023). Figure 7 highlights the top contributing nations in terms of publications and citations. China has earned the top spot with 5514 articles that have received 69,435 citations. Brazil has taken the second spot with 1102 publications that have been cited 11,857 times while India is in third place with 1036 publications and 5697 citations. South Africa and Russia have taken the fourth and fifth spots respectively. As evident from the results, China is way ahead of other BRICS nations both in publications as well as citations. Shashnov and Kotsemir (2018) also conclude that among BRICS nations China dominates many of the subject areas in Scopus while other BRICS dominate only a few areas. Similarly, Bornmann et al. (2015) argue that China has a remarkable rise in the number of papers that are often cited. These extraordinarily high growth rates are unmatched by any other nation, BRICS or otherwise. Based on all records from literature databases, similar findings have been reported elsewhere (for instance, Adams et al., 2013; Kumar and Asheulova, 2011). Bornmann et al. (2015) also conclude Russia is the least successful BRICS nation with only a minor growth, which again corroborates with the present study’s findings. Besides being a prolific contributor, China has excelled in research funding too as 8 out of the top 10 funding agencies belonged to China (Figure 8). Huang and Huang (2018) concluded that China’s funded article ratio was the highest among Group of Nine (G9) nations and also found the National Natural Science Foundation of China (NSFC) to be the leading agency for funding articles. China’s high funded paper ratio may be explained by the country’s increased R&D expenditure over the last 10 years in keeping with the government’s desire to establish itself as an ‘innovation country’ (Gu et al., 2016).
Productive countries.
Prolific funding agencies.
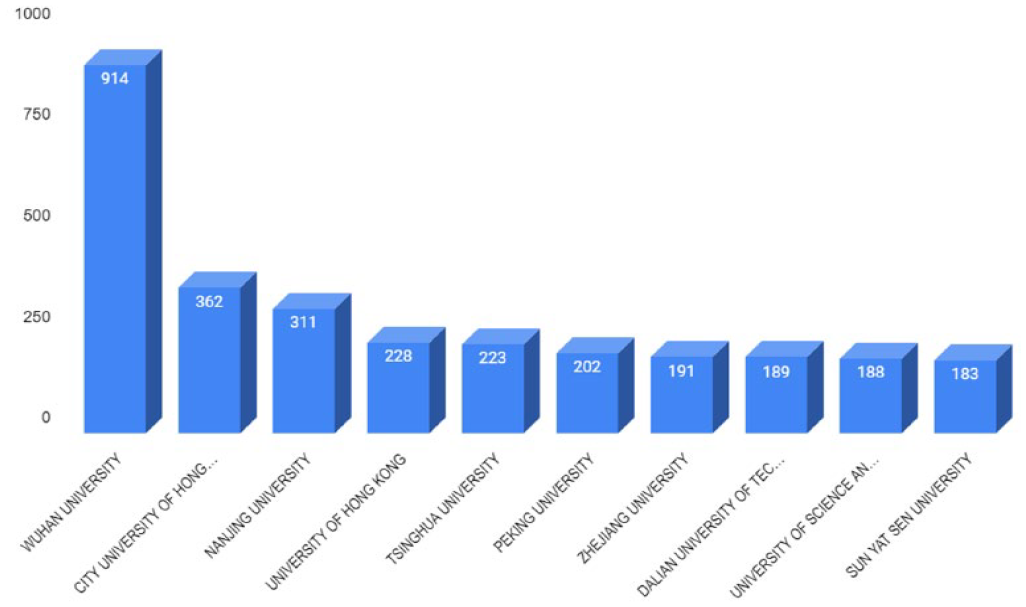
In terms of institutional contribution, it isn’t surprising to see the top 10 productive institutions belonging to China (Figure 9) since 65% of the research in the BRICS bloc has emerged from this country. A similar trend was highlighted by Huang et al. (2023). This again displays China’s sheer dominance in the research sector, especially in the BRICS bloc. ‘Wuhan University’ was associated with 914 articles and was clearly way ahead of others in this group as illustrated in the ‘affiliations’ production over time graph’ (Figure 10). Other important universities include the ‘City University of Hong Kong (362), Nanjing University (311), University of Hong Kong (228), Tsinghua University (223), Peking University (202), Zhejiang University (191), Dalian University of Technology (189), University of Science and Technology of China (188) and Sun Yat-sen University (183)’. Research productivity is important for institutions for several reasons. Institutions with a high level of research productivity are often seen as more prestigious and credible than those with lower levels of productivity (Ganaie and Wani, 2021). Further, highly productive institutions often attract top researchers and talented students, as they provide a conducive environment for research and offer opportunities for collaboration and knowledge exchange (Wani and Ganaie, 2023).
Productive institutions.
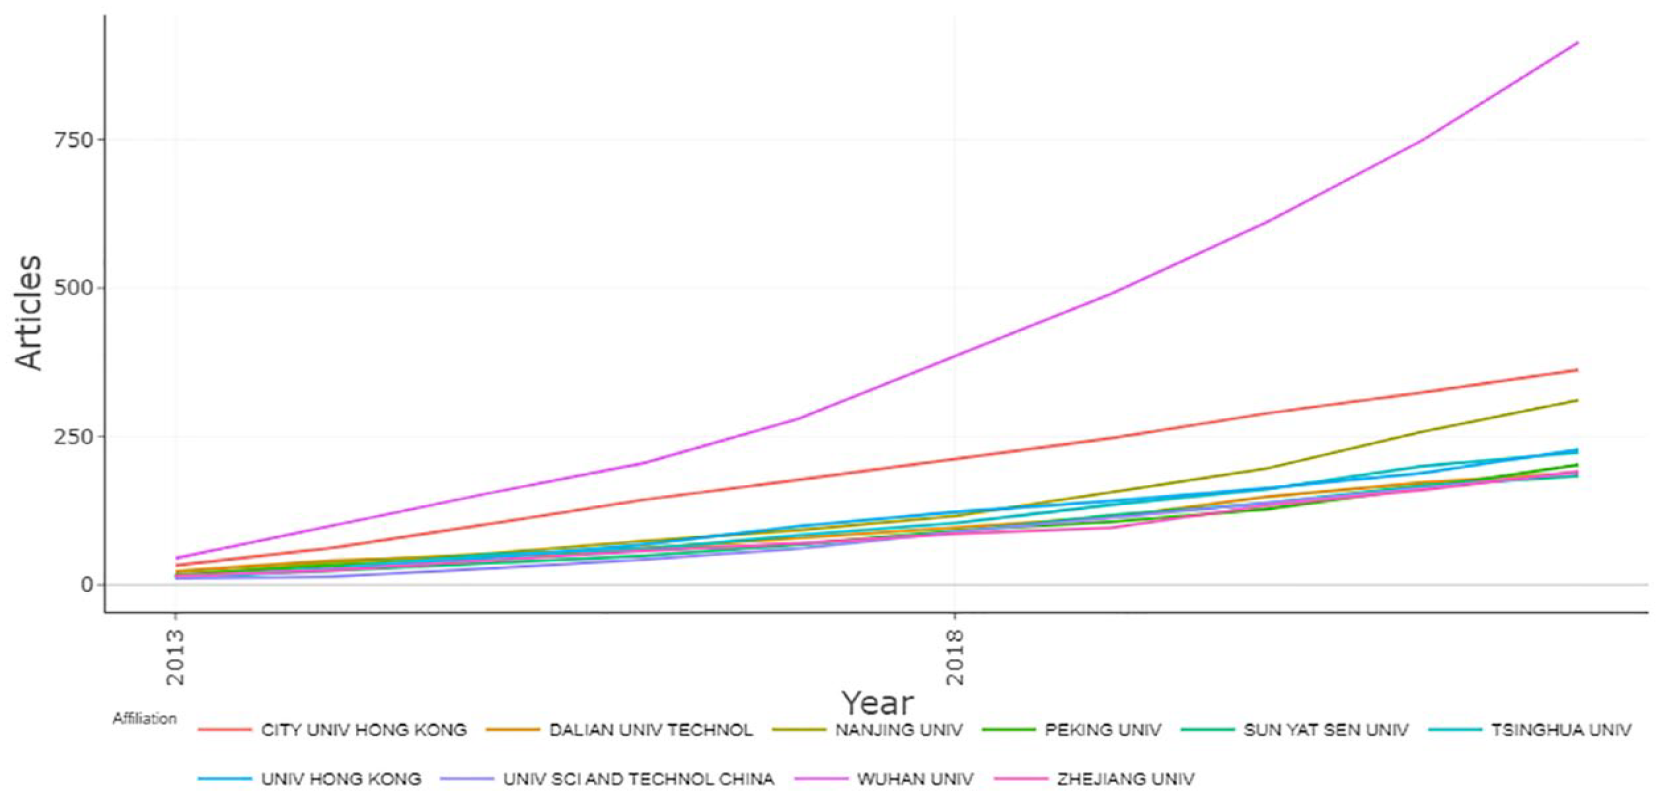
Institutional production over time.
Science mapping
Conceptual structure: Author keywords trending topics and thematic evolution
In bibliometric studies, conceptual structure refers to the relationships and patterns among the concepts and ideas present in a collection of academic literature. It involves identifying and analysing the conceptual framework that underlies the research within a particular field (Barik and Jena, 2019). By examining the conceptual structure of a field, researchers can identify the most important and frequently occurring concepts within it. This can help scholars to better understand the fundamental ideas and theories that underlie the research in a given discipline (Xie et al., 2020). For measuring the conceptual structure of any research field, keyword co-occurrence has been the widely preferred approach by researchers (Ganaie and Wani, 2021). ‘Author keywords’ and ‘keywords plus’ are frequently taken into account as a unit of analysis in bibliometric research. In terms of the depiction of the article’s content, Keywords Plus is comparatively less thorough (Zhang et al., 2016). As a result, ‘author keywords’ was chosen as the unit of investigation for a more thorough overview (Figure 11). The most frequent keywords used are ‘China’ (300 times), ‘Bibliometrics’ (188 times), ‘Knowledge Management’ (154), ‘Citation analysis’ (113) and ‘Scientometrics’ (113). The possible reasons for the highest co-occurrence of the keyword ‘China’ could be the regional studies based on China. Moreover, the rest of the keywords constitute important areas of the LIS domain and thus received more attention from the researchers. Furthermore, analysis of trending topics reveals that the hot topics in the last 5 years have been ‘Covid-19 pandemic, Academic libraries, Altmetrics, Sentiment analysis, Text mining and Machine learning’ (Figure 12). The frequencies of terms are represented by the node size. The time point of the keyword identifies the year in which the term first occurred (Zhang et al., 2022). The Thematic Evolution analysis (Figure 13) reveals that the main themes for researchers from 2013 to 2019 have been ‘Bibliometrics, China, Information Science and Knowledge Management’. However, after 2019 new themes such as ‘Covid-19, artificial intelligence, deep learning and social media’ emerged. Since COVID-19 became the focus of attention for many researchers, scientists and health professionals worldwide in 2020, its popularity is evident here as well. Moreover, the emergence of themes such as ‘artificial intelligence’ and ‘deep learning’ suggests advancement in the field of LIS. This can inform the development of future research agendas and help to ensure that research efforts are focused on areas of greatest need (Wani and Ganaie, 2023).
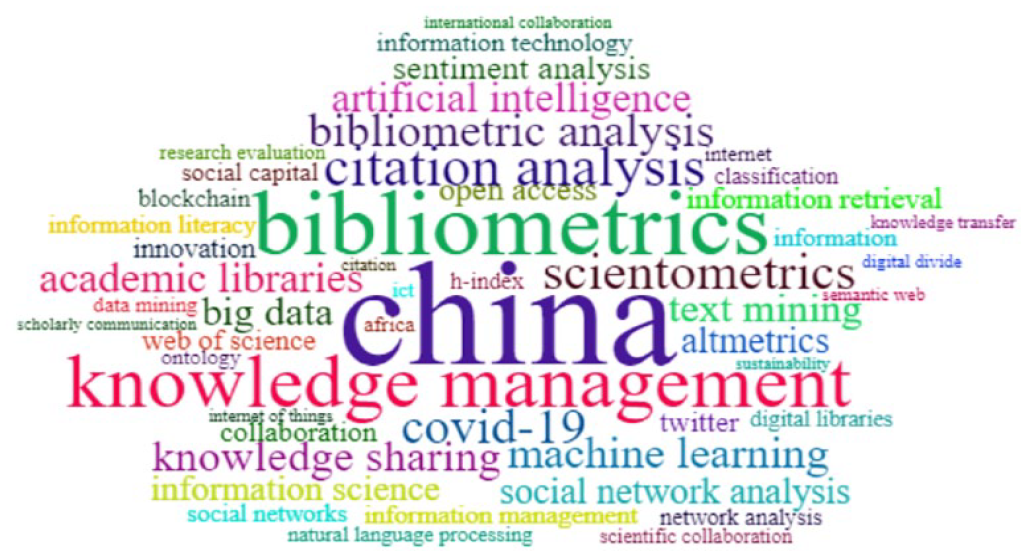
Frequently used author keywords.

Trending topics.
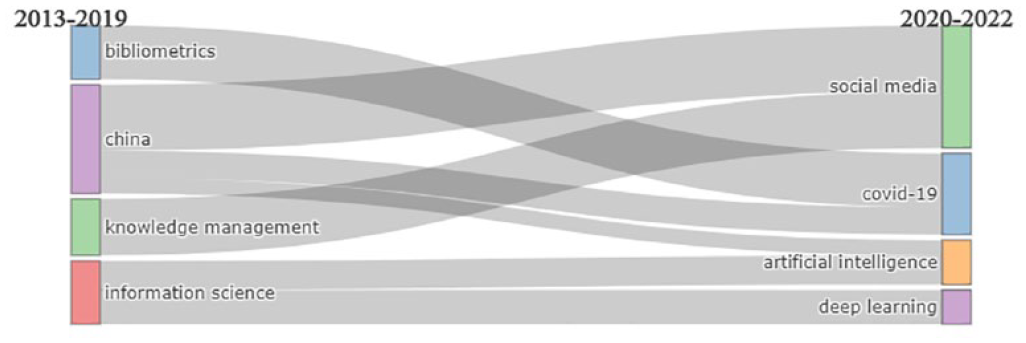
Thematic evolution.
Three-field plot
Three-field plots are commonly used in bibliometric studies to visualize the intellectual structure of a research field. It is a vital phenomenon to understand the relationships among different actors of bibliometrics to comprehend the intellectual structure of a particular research problem. So we performed a ‘Three-Field Plot analysis’ (Figure 14) with the help of a Sankey diagram. It is a sort of flow diagram in which the width of the arrows is ‘proportional to the flow rate’ (Yihua et al., 2023). So, the relationship between authors, countries, sources and institutions was analysed in three Sankey diagrams: (a) ‘Countries, sources and institutions’ (b) ‘Institutions, sources and authors’ (c) Countries, institutions and authors”. The ‘number of items’ for each parameter was set to 5 only so as to overcome the graphical limitation. The first relationship(a) suggests that the most preferred publishing source was ‘scientometrics’ by Chinese authors affiliated with ‘Wuhan University’, ‘Nanjing University’ and ‘Tsinghua University’. Further, it is pertinent to mention that the researchers from Brazil have published only in the national source (Informação & Sociedade: Estudos). Similarly, the second and the third relationship (b&c respectively) highlight that the most persuasive researchers from ‘Wuhan University’, ‘Nanjing University’, ‘Tsinghua university’, ‘University of Hong Kong’ and ‘City University Hong Kong’ preferred top-tier venues (scientometrics, International Journal of Geographical Information, Information processing and Management and International Journal of Information Management) for publishing the scientific results. Zhang Y, Li X and Liu Y have been prolific authors. Furthermore, there is a strong collaboration between the USA and the prolific institutions from China.

Three-Field Plot.
Collaboration trend-authors, institutions and countries
Research collaboration has become increasingly important in current times, and it will likely remain a key facet of scientific research. Collaborating with others can help researchers to tackle complex research questions, share resources and achieve greater scientific progress (Racherla and Hu, 2010; Wani and Ganaie, 2022). The current study explored the ‘author, institutional and country’ collaboration patterns in LIS research in BRICS. Collaboration is vital in any research, it would help researchers to share knowledge, expertise and resources to achieve a common research goal (Fatt et al., 2010). The author collaboration network will help to locate authors who have contributed significantly to developing LIS research in BRICS nations. Identifying prominent authors in the network who are well-connected, famous and well-positioned is a critical component of co-author network analysis (Fatt et al., 2010; Racherla and Hu, 2010; Ye et al., 2013). The minimum number of documents of an author was set to 10; thus, 189 authors met the threshold for analysis. The network map was divided into 18 clusters, 420 links and a Total Link Strength (TLS) of 1659. The edges show co-authorship relationships between authors, whereas the nodes indicate authors. It is important to note that the link width and node size are proportional to the strength of the collaborations and the number of publications the author has, respectively. As seen in Figure 15, the author’s network of collaboration displays a pattern of cooperation that is both, partially concentrated and widely dispersed (Zhang et al., 2022). Authors who have strong collaboration and frequently work together are often referred to as ‘co-authors’ or ‘collaborators’. Their collaborations can be identified by the presence of multiple co-authored publications and by the strength and frequency of their connections within a co-authorship network. Therefore, based on the author’s collaboration network some of the key actors in LIS research in BRICS countries were identified as a result of their meticulous teamwork. These include ‘Ding, Ying; Lowry Paul Benjamin; Rousseau, Ronald; Bu, Yi; Liu, Xiaoping; Chen Yong and Zhang, Yi’. Similarly, Figure 16 implies institutional collaboration. To ensure a robust analysis, each organization included in the study was required to have at least five documents. As a result, a total of 659 organizations met this threshold, resulting in a large network consisting of 18 distinct clusters, 5884 links and a TLS of 10,570. Notably, the largest and most densely connected cluster within the network, depicted in yellow, consisted of 101 organizations. However, the majority of the active organizations belong to China such as ‘Wuhan University, City University of Hong Kong, University of Hong Kong and Peking University’. In a similar vein, the country’s collaboration network (Figure 17) was also explored. It is an important aspect of scientific research, as it allows researchers to work together to solve complex problems that require diverse skills and expertise (Ye et al., 2013). Collaborating across borders also helps to promote diversity and cultural exchange, which can lead to new insights and perspectives (Fatt et al., 2010). To establish the collaboration network, a particular criterion was employed that required a minimum of three documents per country. As a result, 78 countries met this threshold and were included in the analysis. The results suggest a strong collaboration between China, the USA, South Africa, Singapore Brazil and India. Moreover, China holds the leading position in collaboration and the number of documents as illustrated by its node size and link width with other countries, particularly the USA and Singapore. These findings are consistent with Zhang et al. (2022).

Authors’ collaboration network.

Institutional collaboration network.
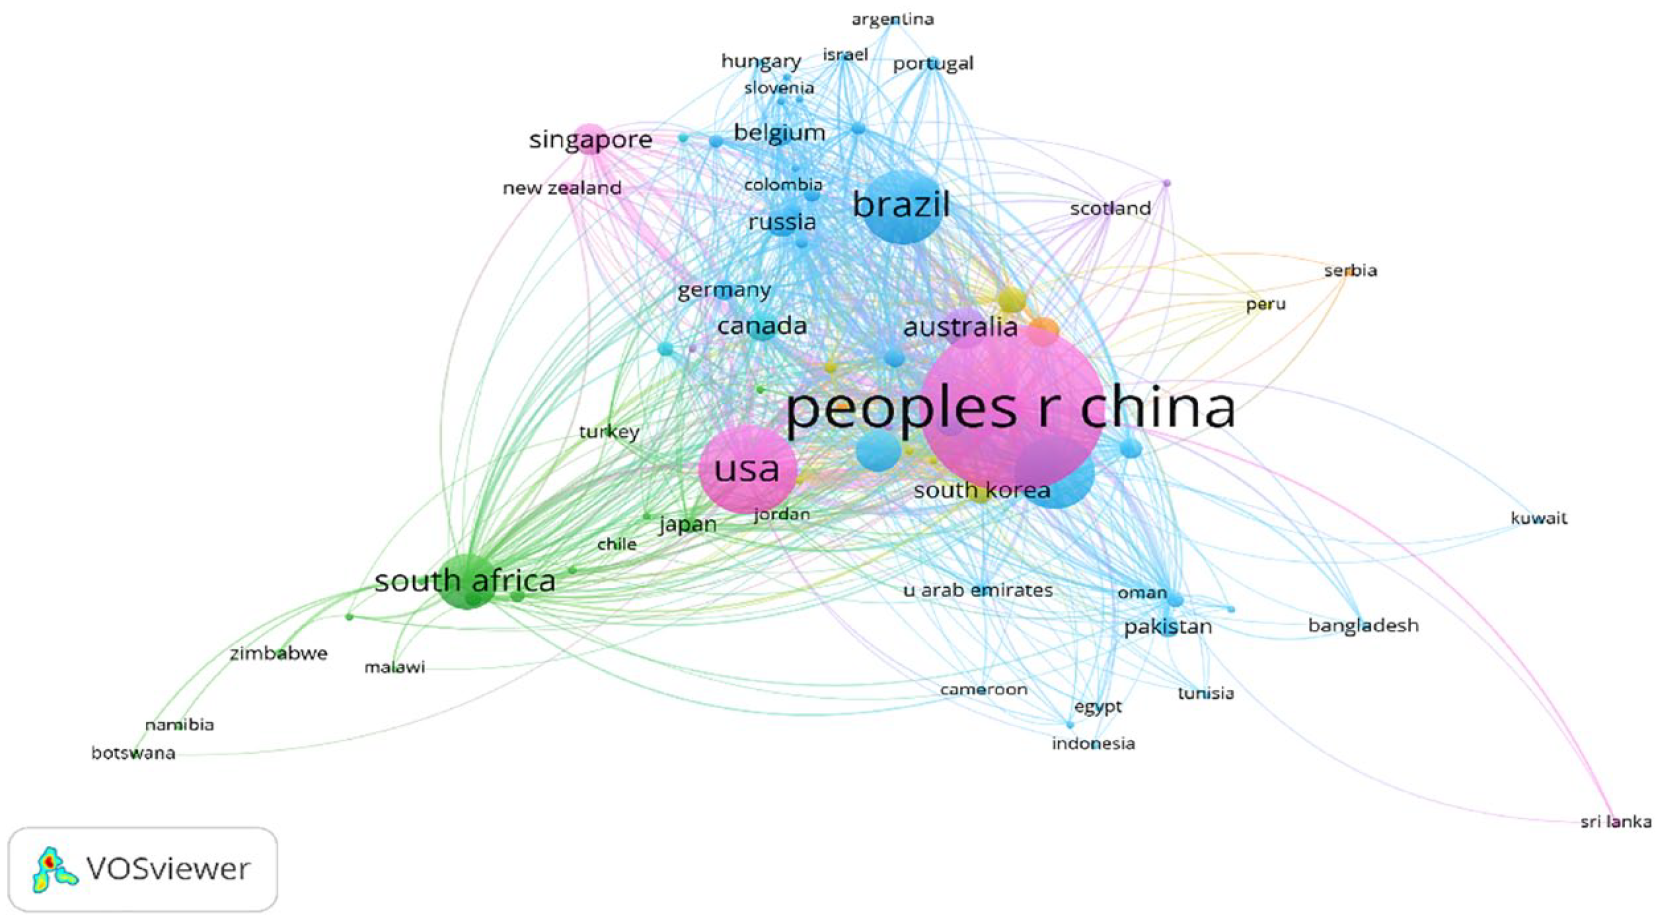
Country collaboration network.
Discussion
Bibliometrics methods have been regularly employed to accentuate the developments and trends in different fields of research. The study discusses many bibliometric facets of LIS research from the BRICS region using the WoS database. Norris and Oppenheim (2007) and Singh et al. (2021) both claim WoS as a credible and thorough source that transcends other scientific citation and indexing databases. The results of the present study have offered insights into ‘author and sources productivity, country and institutional performance, funding agencies, collaboration pattern, thematic analysis and other related sub-domains of performance measurements and the science mapping’ related to LIS research in BRICS nations. According to Wuchty et al. (2007), partnerships can be found in many spheres of economic and social life, including politics, business, the arts and science. Additionally, they are now widely used in academic and industry research. ‘They come in various forms of collaboration’ (Laband and Tollison, 2000), such as collaborative research initiatives, scholarly discussions and publications. In recent years, particularly in the latter half of the 20th century, they have significantly increased across all domains of published research (Glänzel and Schubert, 2004; Lemarchand, 2012; Wuchty et al., 2007). This trend is present throughout most academic fields such as ‘management and organizational studies’ (Acedo et al., 2006), and ‘finance’ ( Chung et al., 2009) and ‘accounting’ ( Fleischman and Schuele, 2009). The present study also observed the same trend as the majority of the articles (94% approx.) have been co-authored (Table 1). There are certain benefits associated with co-authorship such as an increase in citations, wider acceptance from journals and increased productivity (Bidault and Hildebrand, 2014; Chung et al., 2009; Fischbach et al., 2011; Hollis, 2001; Wuchty et al., 2007). On the contrary, some researchers have highlighted the drawbacks of co-authorship, for instance, Hudson (1996) cites a number of downsides, such as the reduction of quality caused by co-authors’ negotiated compromises that result in smaller ‘imagination leaps’, the expense of coordination as well as the social cost of having two researchers working on a ‘single scientific contribution’. A further social consequence is a potential for ‘free-riding behaviour’ (Kwok, 2005). Ductor et al. (2014) identifies a cost he terms ‘congestion externality’ that is related to the time wasted coordinating the diaries of many authors. With regard to publication, an upward trend was noticed. The results corroborate with the findings of previous studies that also witnessed growth in LIS research (Ahmad et al., 2018a, 2018b, 2020a; Jabeen et al., 2015; Olmeda-Gómez and de Moya-Anegón, 2016; Siddique et al., 2021, 2023; Usman and Ewulum, 2019; Wolfram, 2012). Furthermore, Shashnov and Kotsemir (2018), Bouabid et al. (2016), Finardi (2015) and Castor et al. (2020) also reported a growth in publications in BRICS nations. On contrary, Rehman et al. (2023), Garg and Sharma (2017) and Gunasekara (2008) reported an erratic growth in LIS research. In terms of citations over time, citations have declined particularly in the last 5 years. A similar trend was noticed by Ahmad et al. (2020b, 2020c) and Siddique et al. (2023). One of the reasons for the decline in citations in recent years may be the time interval since publication (Siddique et al., 2023). In the years to come, citations to recently published works would probably increase.
With regard to author productivity, all the top authors were affiliated with institutes in China and in terms of impact (TC) as well, eight out of the top 10 authors belonged to China. According to Jufang and Huiyun (2011), in China, a university’s or an institution’s academic level is primarily determined by the quantity of Science Citation Index (SCI), Engineering Index (EI) and Index to Scientific & Technical Proceedings (ISTP) papers it publishes as well as the number of research grants it has received, for instance from the ‘National Natural Science Foundation of China, and the National High Technology Research and Development Program of China’. To encourage personnel to publish more SCI, EI and ISTP articles, several universities and institutes offer financial incentives. The theory is straightforward and purely economic in nature. Paying people to publish in reputable journals encourages them to do so which in turn will enhance the prestige of an institution. Similarly, Li (2016), states for many Chinese colleges to award PhD degrees in science, English-language research papers must be published in journals that are included in the SCI. The study further found that these articles were published across 88 quality sources with good IF and Scientometrics was the most preferred source while the International Journal of Information Management was the most cited source. According to McKercher (2012), top-tier journals produce a disproportionately higher share of citations per manuscript published. Stringer et al. (2008, p. 308) claim that ‘people tend to look to top journals first as a source of information when doing research because these journals are rated highly. But, these journals are rated highly because of the quality of work they produce’. However, McKercher (2015) points out that academics are under pressure to publish in journals with ‘Social Science Citation Index (SSCI)’ ranking or some equivalent rank. With the idea that publishing in these journals signifies quality publications, ‘promotion, tenure and contract renewal’ are becoming more and more dependent on the capacity to demonstrate ‘quality’. In terms of the country-wise output from the BRICS bloc, China produced the bulk of the research followed by Brazil, India, South Africa and Russia. Moreover, China also topped the list with respect to citation counts. Previous literature also concluded China to be prolific in terms of research as well as impact (TC) (Bornmann et al., 2015; Castor et al., 2020; Finardi, 2015; Gupta and Chakravarty, 2022; Shashnov and Kotsemir, 2018; Tripathi et al., 2018; Zia, 2021). Similarly, all the top prolific institutes belonged to China (Figure 9). There could be multiple reasons for their brilliant performance in the research sector, for instance, Shashnov and Kotsemir (2018, p. 1125) reveal that based on the ‘volume of R&D expenditures and the number of FTE (full-time equivalent) researchers in BRICS countries shows that China is the second largest scientific superpower after the US. China is also one of the greatest “investors in R&D” in the world by the absolute level of Gross Expenditure on Research and Development (GERD) (408.8 bln USD in 2015) comparable with the total for EU-28 (386.5 bln USD) and closing the gap with the US (502.9 bln USD)’. China has the most researchers in the world, ‘with 1.619 million FTE in 2015’. China is catching up to the EU-28 total of ‘1.84 million FTE researchers’. China’s relative level of R&D investment (GERD as % of GDP) is greater than the average for the world (1.69%) and the total of the EU-28 (1.96%) and is further catching up with the total of the Organization for Economic Co-operation and Development (OECD) nations (2.38%). In terms of R&D investment, both in ‘absolute terms and relative terms’, other BRICS nations significantly trail behind China. Besides, funding also has a positive impact on research productivity and the results provided in Figure 8 depict that the majority of the funding agencies belong to China. The National Natural Science Foundation of China (NSFC) has been the most prolific funding agency and a similar finding was highlighted by Huang and Huang (2018). According to Jameel and Ahmad (2020), research funding has a positive and considerable effect on research output. In the same light, Rezek et al. (2011), and Pagel and Hudetz (2011), found that National Institute of Health (NIH)-funded faculty members had higher h-indices than those without NIH funding. Although Russia is one of the leading industrialist nations, its impact was the lowest and a similar trend was noticed in prior studies as well (Bornmann et al., 2015; Castor et al., 2020; Ezziane, 2014; Gupta and Chakravarty, 2022). This could be because the WoS Core Collection does not index the majority of scientific papers from Russia (Golbeck, 2013); Russian scientists continue to publish mostly in journals published in their native language, which aren’t frequently included in Scopus and WoS indexes (Alimova and Brumshteyn, 2020); the ‘share of papers from Russia indexed in Scopus is higher than it is in WoS’ (Moed et al., 2018: 1170).
The co-occurrence of the keywords (Figure 11) was also studied as they provide information to researchers about research trends (Yang et al., 2013) and it reflected the dominance of keywords such as China, Bibliometrics, Knowledge Management, Citation analysis and scientometrics. Analysis of trending topics revealed that the hot topics in the last 5 years have been ‘Covid-19 pandemic, Academic libraries, Altmetrics, Sentiment analysis, Text mining and Machine learning’ (Figure 12). The thematic evolution (Figure 13) and Three-Field Plot (Figure 14) were also analysed through Sankey diagrams. The main advantage of Sankey diagrams is their capacity to visually represent complex, multivariate processes in a clear, understandable manner. The thematic evolution analysis suggested that LIS researchers have shifted their focus to new areas such as ‘artificial intelligence’ and ‘deep learning’. Similarly, the Three-Field Plot analysis informed that China and Brazil have been the most prolific nations from the BRICS bloc. Wuhan University and Nanjing University from China are the most common affiliations. The majority of the papers have been published in Scientometrics, the International Journal of Geographical Information Science and Information Processing and Management. Moreover, the USA has been a dominant partner to Chinese institutions. Furthermore, co-authorship networks were analysed to understand the collaboration pattern. ‘Co-authorship networks, citations, co-citations, author co-citations bibliographic coupling and co-word networks analysis are the major indicators of scientific productivity and knowledge production that relate one entity with another – the idea which gives birth to our concept of “networks”’ (Kumar, 2015, p. 57). Although there is some disagreement as to what really qualifies as research collaboration (Katz and Martin, 1997), looking at co-authorships of research articles is one of the most verifiable ways to do so (Glanzel and Schubert, 2004). It should go without saying that co-authors cannot collaborate on a manuscript unless they are reasonably familiar with one another. Co-authorship networks have been found to be perhaps the only accurate ‘representation of human acquaintance patterns for which’ a large amount of data is available, allowing for a more exact definition of connectedness (Newman, 2001). The biggest type of social network that is publicly accessible is a co-authorship network. Additionally, these networks are also devoid of subjectivity, a major flaw in questionnaire-based network studies, as they are based on bibliographic data (Newman, 2004). Co-authorship analysis ‘can shed light on clustered research among scholars from a particular region’ (Dhonthu et al., 2021: 290) and these revelations can be utilized to support and inspire new research among researchers from underrepresented places. The analysis also makes it possible to map collaborations over time, allowing researchers to examine the trajectory of intellectual development in relation to collaboration networks and providing aspiring researchers with important details they can use to get in touch with and collaborate with established and popular researchers in their field. The proximity of the nodes (Chinese researchers) and their links’ width suggested a strong association between them (Figure 15). The institutional collaboration network highlighted the dominance of Chinese institutions, particularly Wuhan University and the City University of Hongkong (Figure 16). Similarly, the co-authorship network of countries (Figure 17) revealed that China had dominated collaboration within the BRICS as well as outside because of its versatile approach to S&T development. Researchers have opined that collaboration enhances the impact and visibility of research (Abramo and D’Angelo, 2015; Aldieri et al., 2018; Puuska et al., 2014; Rehman et al., 2022). As China has been at the forefront of research collaboration the positive results are reflected in their citation numbers (Figure 7). Moreover, the USA was the main partner for all the BRICS bloc, mainly China and collaboration between the BRICS wasn’t as strong as it was with non-BRICS nations. These findings are consistent with Shashnov and Kotsemir (2018) and Bouabid et al. (2016). According to Finardi (2015), distance and spatial location may play a significant influence in forging collaborations. The fact that BRICS nations are spread over four separate continents may have an impact on the level of collaboration. Although the author further stated that geographical distance should be considered as the only factor for determining the collaboration between countries. The determinants of scientific collaboration, coauthorship and related phenomena have also been studied in previous works. Zitt et al. (2000: 642) stated that Collaboration trends cannot be assigned to a single factor, “but rather to a complex mixture combining cultural, linguistic, economic and geographical determinants." Ganzi et al. (2012: 333) stated ‘that language, culture and politics’ can have an impact on how people collaborate.Similarly, Schubert and Glänzel (2006, p. 426) noted that ‘geopolitical location, cultural relations and language are determining factors in shaping preferences’. As far as the present study is concerned the strongest collaboration within the BRICS bloc could be seen between China-Russia, India-South Africa and India-China respectively. Given that both China and Russia have shared a socialist state structure for a number of years, the strength of their relationship is more readily understood. Finardi (2015: 1164) noted that India and South Africa ‘belong to Commonwealth and were part of the British Empire. Moreover – sole countries in the group – share English as one of the official languages’. This could also be a factor in their strong collaboration. The fact that China-Russia or India-South Africa are geographically distantly located than India-China or Russia-India and still have a stronger collaboration once again affirms that geographical location isn’t the sole determinant of collaboration. In fact, Wagner (2005) couldn’t point out the sole determinant for research collaboration.
Conclusion
Examining national research performance trends is a crucial way to gauge how quickly science has advanced over a specific period of time. Data acquired from such analyses are highly beneficial for determining the degree and trend of development, and can then be used as indicators and proof for better-developing plan design and programme via a variety of investment strategies (Ding et al., 2013). Studies that compare the output and performance of different countries should be conducted periodically since they are useful for comparing the output and performance of higher education (Hazelkorn, 2013). The current study used the WoS database to gauge the LIS research output in BRICS nations which are emerging economies that are increasingly becoming significant players in the global economy. These countries have a unique perspective on LIS research due to their cultural, political and economic contexts. Thus, the study of LIS research output in these countries provides valuable insights into the development of LIS research in emerging economies. The study employed two techniques of bibliometrics: Performance analysis and Science mapping. The findings reveal the dominance of China in the BRICS bloc. This has to do with the significant increase in China’s R&D investment in the last 10 years and the government’s strategy to develop into an ‘innovative nation’. Overall, China has made tremendous progress over the last decade with respect to ‘investments in knowledge resources, improvements in competitiveness’ and strongly cementing itself as a ‘middle-income country’ (Gu et al., 2016). Thus, it is imperative for other members of the BRICS bloc to take a leaf out of China’s S&T policy if they want to compete with the leaders in scientific production.
Limitations and future research
There are two limitations to this study. First, the findings of this study are based on the data retrieved from a single database. Secondly, the document type was restricted to articles only. Future research should explore different databases such as Scopus or compare multiple databases to find out how BRICS are represented across databases. It would be also interesting to compare the LIS research output of the BRICS bloc with G8 nations.
Footnotes
Declaration of conflicting interests
The author(s) declared no potential conflicts of interest with respect to the research, authorship, and/or publication of this article.
Funding
The author(s) received no financial support for the research, authorship, and/or publication of this article.