



Abstract
The objective of this study was to explore the trends in the publication and production of open access (OA) and non-OA journals and articles over the last decade. Non-OA journals include subscription and hybrid journals, the articles of which cannot be freely accessed by researchers. To conduct this study, we used SCImago Journal Rank (SJR) data from 2011 to 2021. In analyzing the SJR data, we categorized publishers by the number of journals and articles published. The results showed the following: (a) although the number of OA journals has increased rapidly between 2011 and 2021, their share of total publications is still significantly lower than that of non-OA journals; (b) between 2011 and 2021, the number of publishers of non-OA journals had decreased slightly, while the number of OA journal publishers has increased rapidly; (c) publishers of all sizes increased the production of OA journal articles between 2011 and 2021, but the share of top publishers increased the most; and (d) MDPI, as a born-OA publisher, has become a global leader in OA journal article publishing in recent years.
Introduction
The open access (OA) movement has disrupted the publishing industry in the last two decades (Joseph, 2013; Piwowar et al., 2018; Schimmer, 2017). Publishers of all sizes have considered OA as a new business model to adapt to the changing publishing environment (Gadd et al., 2018). There are several OA publishing models, including gold OA, green OA, hybrid OA, diamond OA, and platinum OA. Gold OA requires authors to pay article processing charges (APCs) for immediate public access to their work. In green OA, authors self-archive their articles in an open repository, usually the pre-print or post-print version of the article, and some journals impose an embargo period for self-archiving the final version (Gadd and Troll Covey, 2019). Hybrid OA is a subscription-based journal where authors or their funders can pay to make their article available in open access, while the rest of the content remains reserved for subscribers. Diamond and platinum OA are newer models that provide immediate free access to publications without requiring APCs (Foxall and Nailor, 2016).
However, despite the growing popularity of OA publishing models, there has been much debate about whether publishers should adopt them (Zhang et al., 2022). One issue that has been raised is the practice of “double dipping” by publishers, where they are paid twice for the same content, once through subscription fees paid by universities or research organizations and again through author or funder payments for open access publication (Mittermaier, 2015). It has been argued that the publishing industry is moving toward an APC-based model (Siler and Frenken, 2020; Silver, 2018; Zhang et al., 2022). The rise of megajournals is the central phenomenon that emerged with the rise of the OA publishing model. Björk (2018) noted that some large OA publishers publish thousands of OA journal articles per year on the Internet without adhering to a fixed publication schedule, where peer review is based solely on scientific trustworthiness. However, Brainard (2019) argued that citations to and from top-tier journals have declined and that the future of megajournals as a major publication platform is uncertain. Kim and Park (2021) reported that among the subscription journals, 77.4% had shifted to become hybrid journals, but only 5.2% of their articles were OA. Their study suggested that the hybrid journals were at the very early stage of OA publishing. Björk and Korkeamäki (2020) pointed out that approximately 18.4% of Scopus-indexed journals in 2018 were OA journals and that OA has yet to become the mainstream business model for scholarly journal publishing.
Numerous studies have quantified the trends of OA journal and OA article production in the last decade. Piwowar et al. (2018) found that 27.9% of digital object identifier (DOI)–assigned journal articles are OA on the basis of their Crossref-DOI sample. Morrison (2017) estimated that Elsevier offered 511 OA journals. Several studies have shown that the number of OA journals has increased significantly in recent years (Björk, 2018; Momeni et al., 2021; Poltronieri et al., 2016). The International Association of Scientific, Technical, and Medical Publishers estimates that about one-third of all research articles are OA, and some countries such as the United Kingdom are on track to publish 90% of their research as OA within a year (STM, 2021). Momeni et al. (2021) showed that converting to an OA journal publishing model could lead to a decline in the number of published articles.
Despite all these studies on OA publication trends, there is still lack of data on the changes that have emerged in OA publishing in recent years, particularly when stratified by publisher size. Additionally, although numerous studies have examined evolving trends in OA journal production and publishing, detailed investigation of the prevalence of OA journals and articles has not been conducted. Earlier studies examined the degree to which the leading global publishers (e.g. Elsevier, MDPI, BioMed Central, PLOS, Springer, and Wiley) published journals indexed in major databases such as Web of Science and Scopus (Kim and Park, 2021; Morrison, 2017). These global commercial publishers dominate the academic publishing industry (Hagner, 2018; Kim, 2022), yet it has not been clarified to what extent their production of OA, as opposed to non-OA journals and journal articles, has changed over time. It is useful to examine the production of OA journals by publishers in light of the rapid changes in the publishing industry and scholarly communication, as these can have an enormous impact on various stakeholders (e.g. researchers, publishers, institutions, authors, etc.).
Hence, the objective of this study is to explore the trends in the publication and production of OA and non-OA journals and articles over the last decade (2011–2021). In particular, this study investigated the recent developments in OA publishing while examining the relationship between publisher size and the prevalence of OA as opposed to non-OA journal article production in order to understand the changing landscape of scholarly journal publishing. We used bibliometric information on Scopus-indexed journals, as they play a crucial role in disseminating scholarly knowledge in various disciplines and are published by a large number of publishers around the world. In this study, OA articles refer only to articles published in OA journals. Contrarily, non-OA articles refer to articles published in non-OA journals, which would include subscription and hybrid journals.
Methods
For this study, we used journal data from the SCImago Journal Rank (SJR) from 2011 to 2021. SJR-indexed journals are also Scopus-indexed. SJR provides information about journals, such as the number of articles published (referred to as documents). We also used Scopus’s journal index information since it contains the names of the parent publishers. It was necessary to normalize publisher names in order to reduce variation. The OA status of an SJR-indexed journal was determined by the Directory of Open Access Journals (DOAJ) and the Directory of Open Access Scholarly Resources (ROAD) (Steiginga and Evans, 2015). We regarded journals publishing both OA and non-OA articles as hybrid journals (Laakso and Björk, 2016) and did not classify them as OA, which constitutes a limitation related to using SJR data to analyze publication trends in producing journals and journal articles.
Furthermore, our analysis of SJR data categorized publishers on the basis of the number of journals and journal articles published. Bailey (2007) categorized OA publishers as born-OA, conventional, and non-traditional. Because of the lack of information regarding publisher types in the current bibliographic databases, we only used size as a differentiating factor between the publishers. In this study, we refer to journal documents provided in the SJR as journal articles. We processed and analyzed the downloaded data using Unix-based scripting languages such as sed and awk, and the R language.
Results
The growth of journals and articles
The number of both non-OA and OA journals included in the SJR has steadily increased (Figure 1). The number of non-OA journals indexed in SJR has increased by 2.1% (18,293–18,679) from 2011 to 2021. As for OA journals, this number increased by 45.9% (4143–7657) in the same period. Thus, the number of OA journals has grown faster (slope = 334) than that of non-OA journals (slope = 43.5). Furthermore, the number of articles published in OA journals has grown faster (slope = 63,533) than that of articles published in non-OA journals (slope = 46,455). In the left side of Figure 1 the R2 value for the linear regression line of non-OA journals is low (0.1176), mainly due to the steep decline in the number of non-OA journals indexed in Scopus in 2020 and 2021. If not for this decline, the R2 value would have been higher, indicating a more consistent growth pattern. The average number of non-OA journals is stable between 18,000 and 19,000 journals, indicating that the number of SJR-indexed non-OA journals has not changed much in these years. However, the number of non-OA journals has declined more severely in the years 2020 and 2021. The number of OA journals per year in 2020 declined to a lesser extent. Although the number of OA journals has increased rapidly between 2011 and 2021, their share of total publications is still much smaller than that of non-OA journals, from 4.5 times in 2011 to 2.4 times in 2021. Although the number of SJR journals decreased in 2020, the number of articles increased from 2019 to 2021 for both non-OA and OA journals.
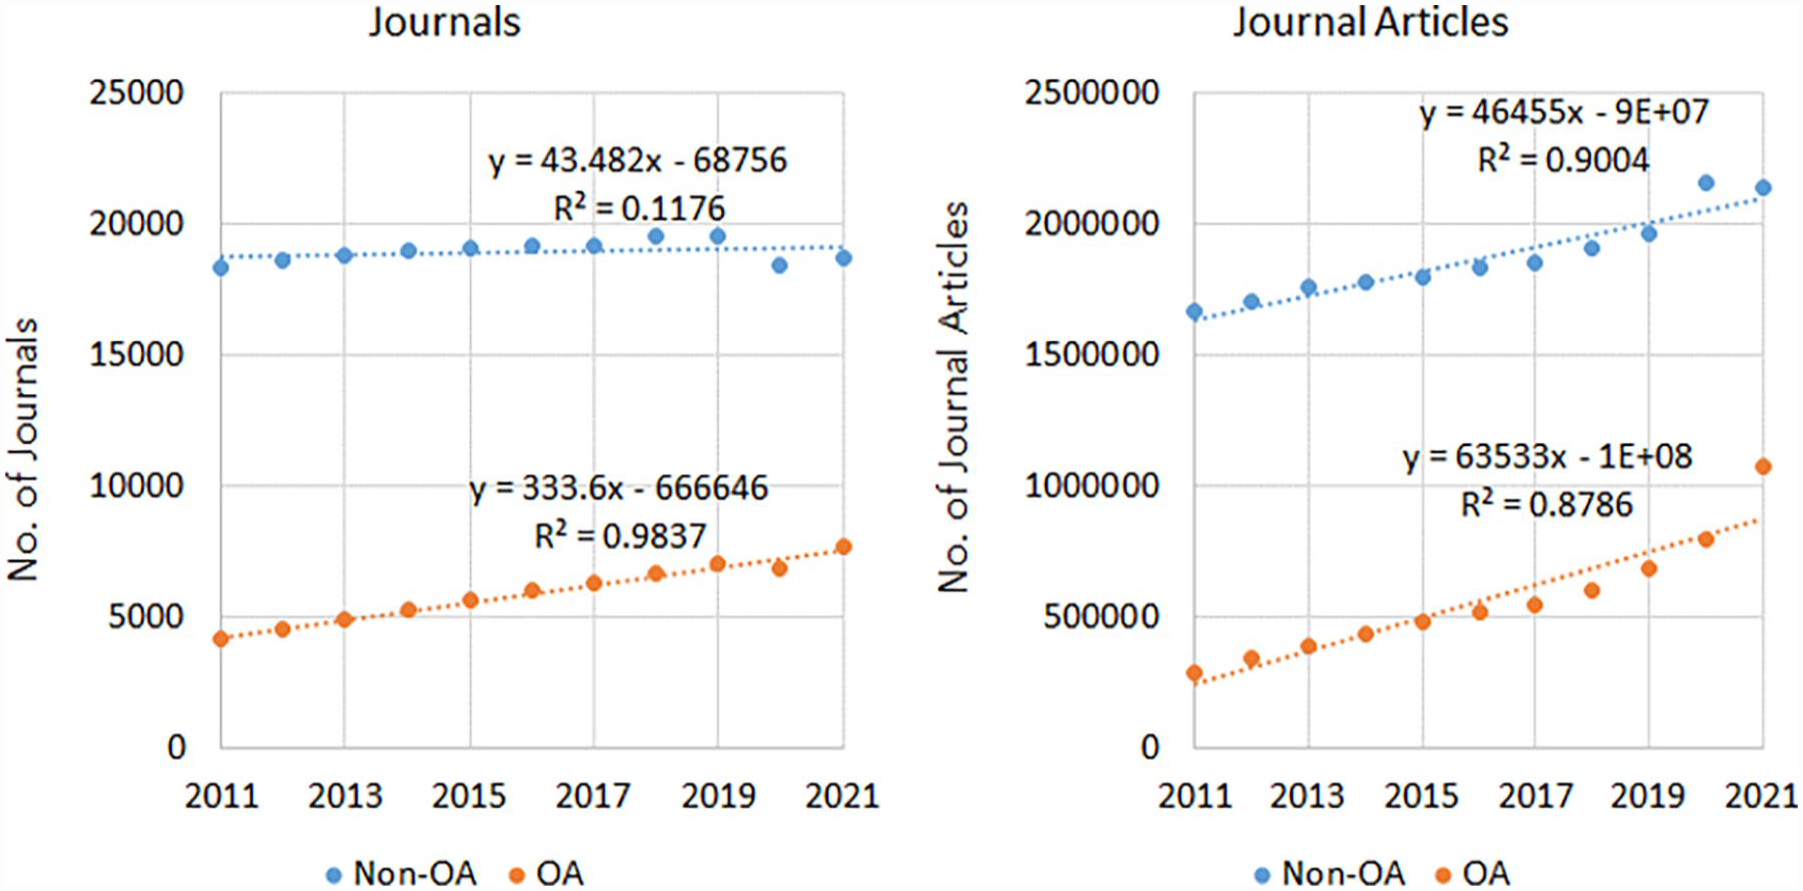
The growth of journals and journal articles.
Shares in OA and non-OA journal production by size of publisher
Figure 2 shows the yearly trends of the number of publishers involved in the production of SJR-indexed journals. This figure shows that the total number of non-OA journal publishers declined from 2011 (4443 publishers) to 2021 (4237 publishers), while the number of OA journal publishers increased from 2011 (2066 publishers) to 2021 (3437 publishers). To analyze publishing trends, we categorized publishers by the number of SJR-indexed journals they published: (a) 1 journal, (b) 2–9 journals, (c) 10–99 journals, and (d) 100+ journals.
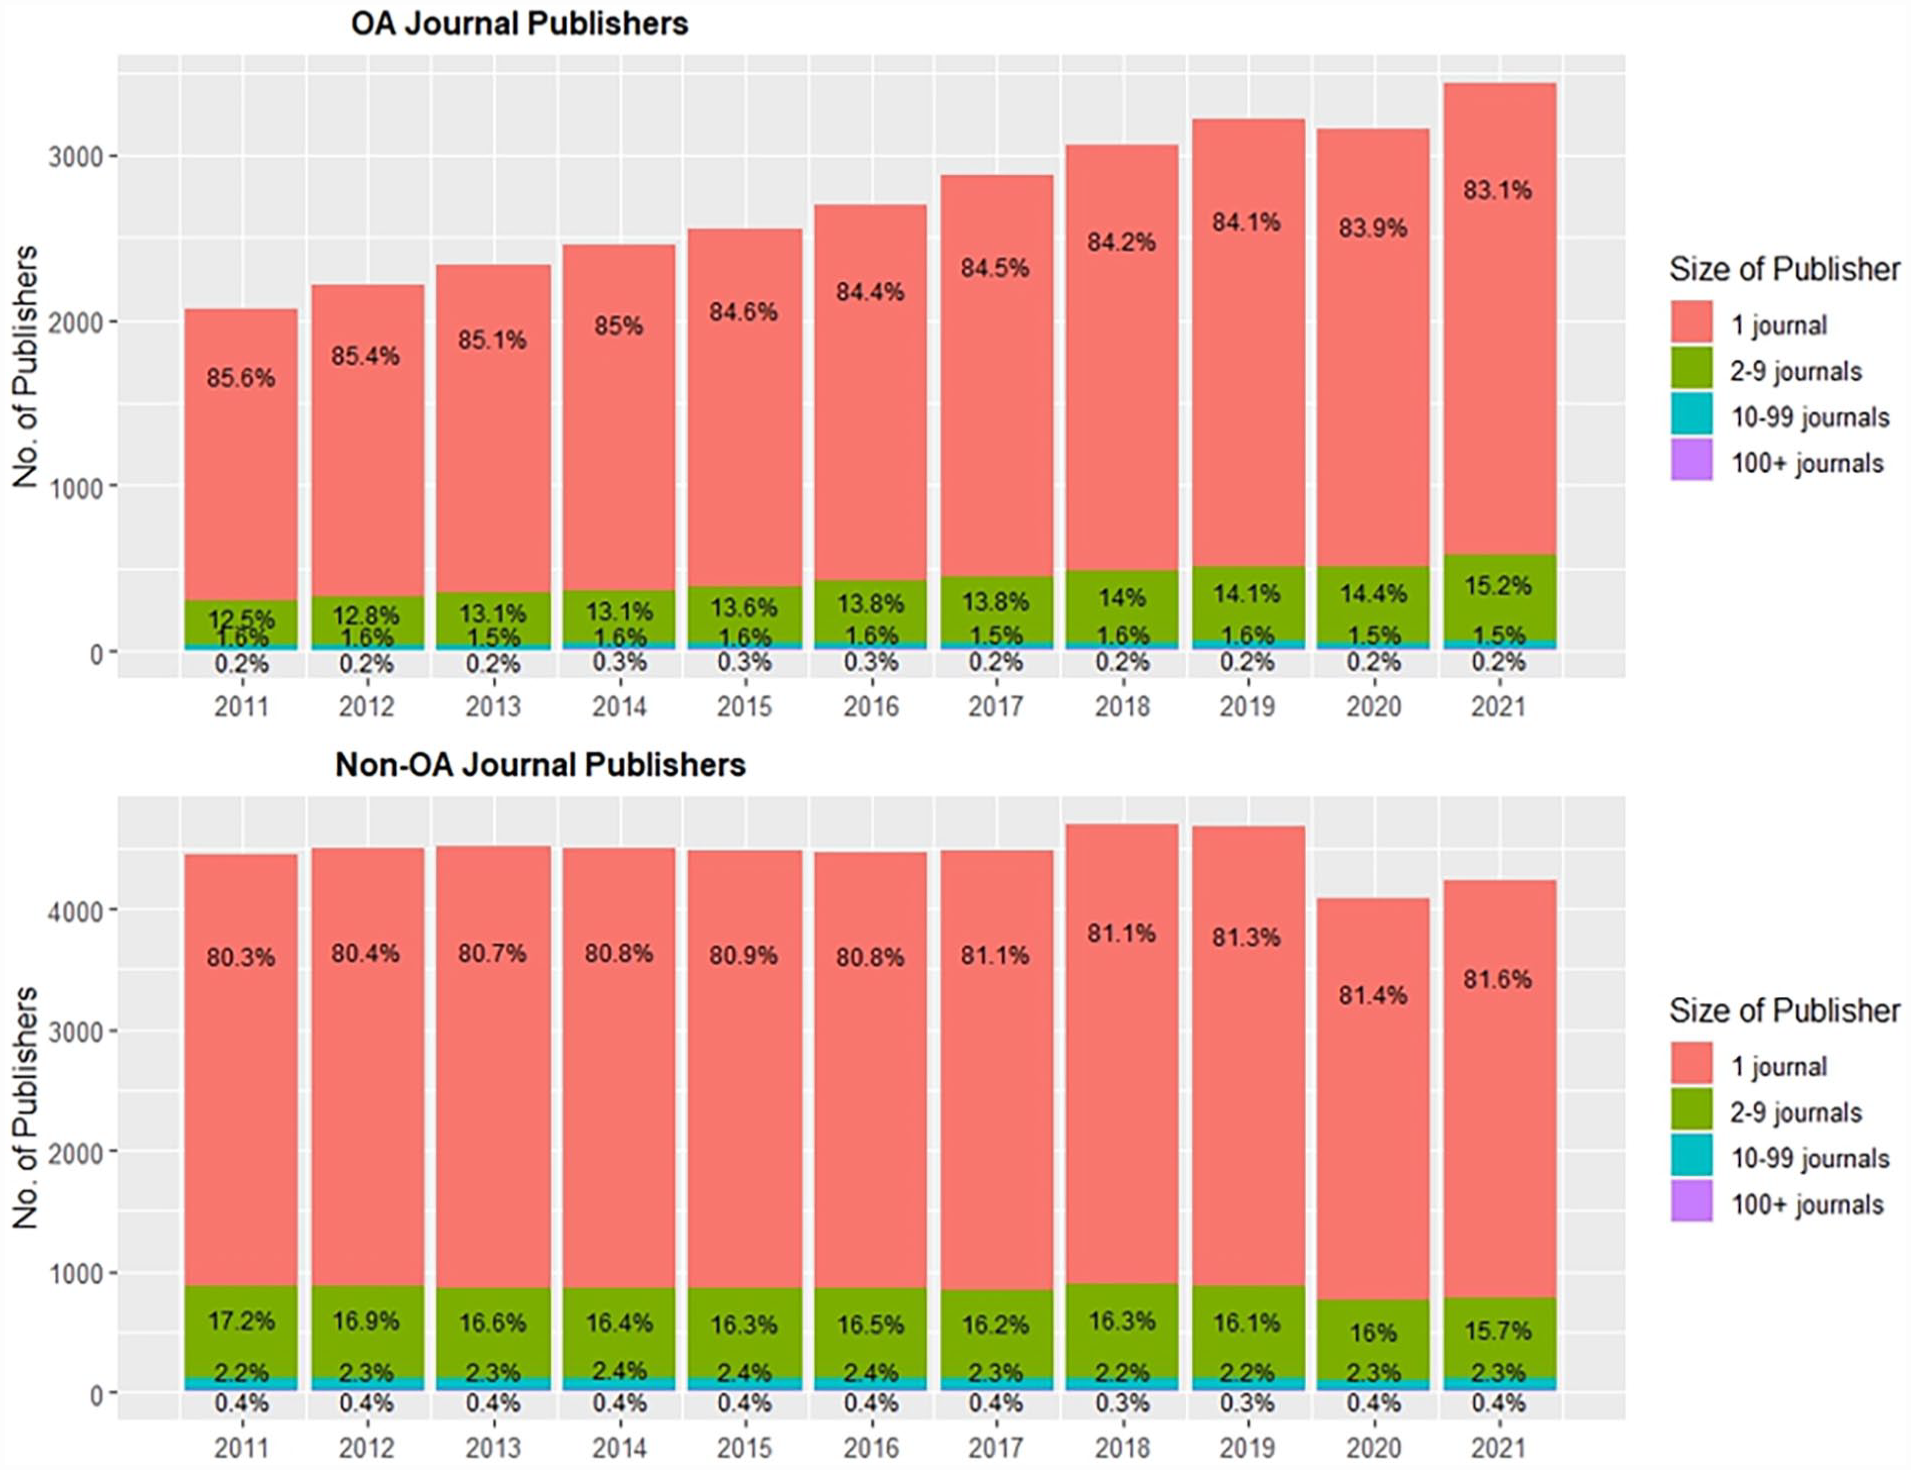
Yearly trends of publishers involved in journal production.
Journals published by non-OA and OA publishers showed opposite trends. The single-journal publishers appear to be dominant in both OA and non-OA formats, with approximately similar shares: between 85.6% (2011) and 83.1% (2021) for OA, and 80.3% (2011) and 81.6% (2021) for non-OA. For the 2–9 journals category, marginal and insignificant differences were observed, with shares ranging between 12.5% (2011) and 15.2% (2021) for OA and 17.2% (2011) and 15.7% (2021) for non-OA journals. The percentage shares in OA and non-OA journal production of publishers with 100+ journals have remained steady. In 2021, 0.4% of non-OA journals and 0.2% of OA journals were published by publishers with 100+ journals. Overall, approximately 97% of publishers publish fewer than 10 SJR-indexed journals. For both OA and non-OA journals, the data show that more than 80% of publishers publish only one SJR-indexed journal. Less than 0.5% of publishers publish more than 100 journals. Figure 2 indicates a marginal decrease of 4.6% in the number of publishers of non-OA journals between 2011 and 2021, as opposed to a dramatic increase of 66.4% of OA journal publishers.
Figure 3 shows yearly trends in OA and non-OA journal and journal article production. Hybrid publishers are included in the non-OA category in the figure. Similar to Figure 2, we categorized publishers’ journal and journal article production by size. Hereinafter, we refer to publishers that publish one journal or 1–999 journal articles as “small publishers” and publishers that publish 100+ journals as “top publishers.” Since 2011, the production of both OA and non-OA journal articles has increased substantially. However, this production varied considerably between these two types of articles and also by publisher size.
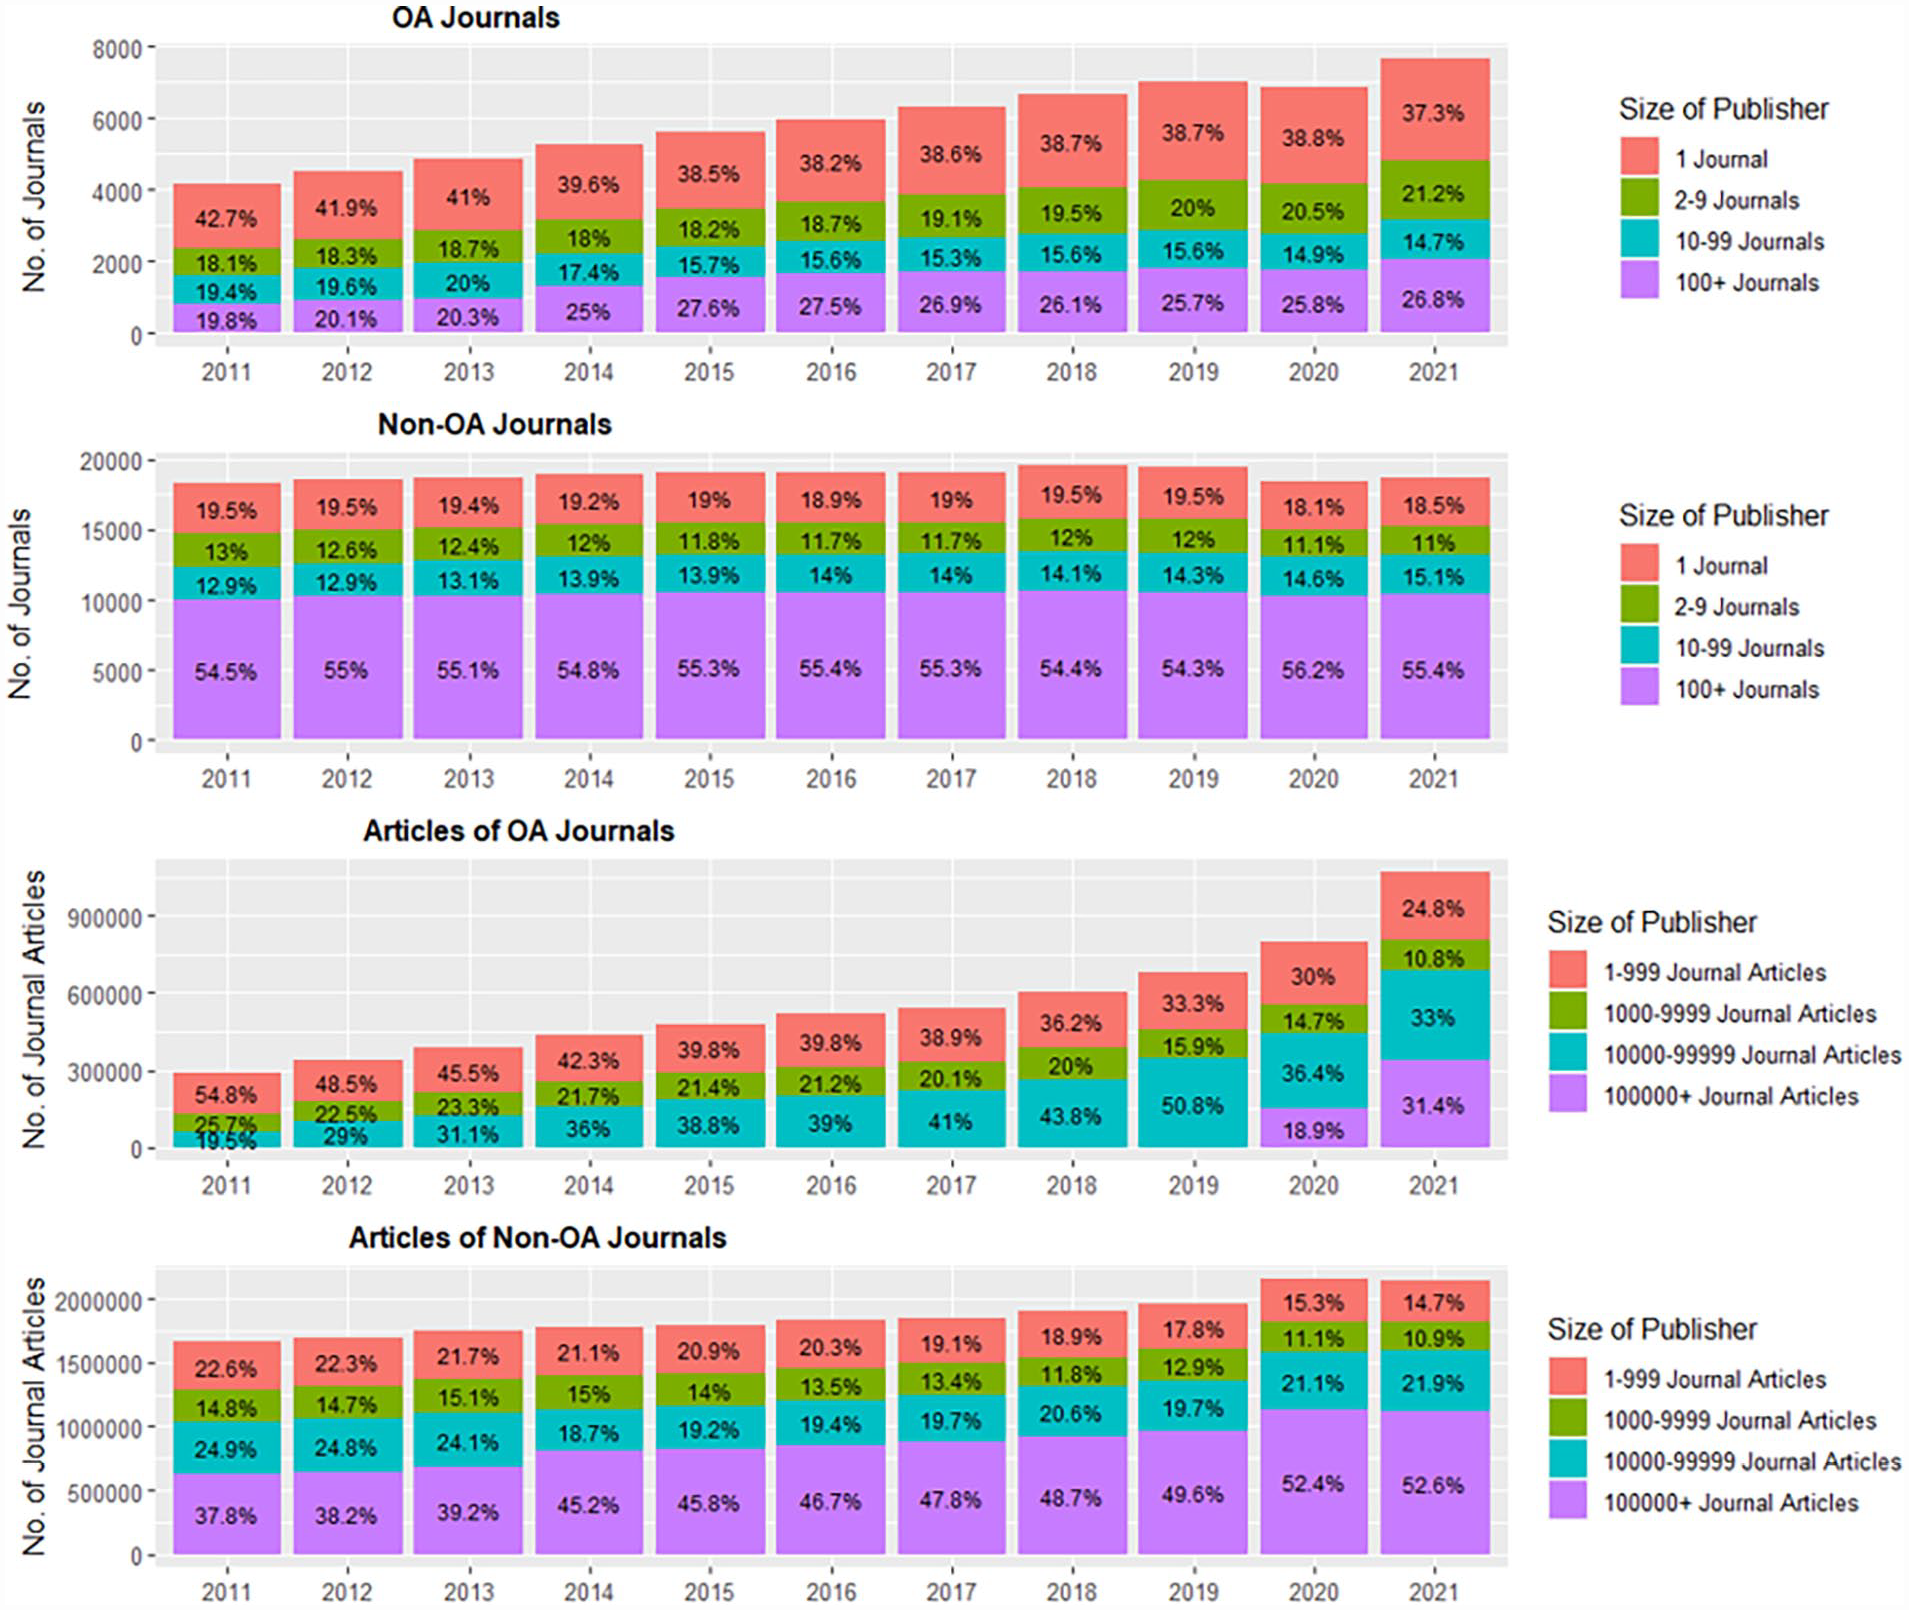
Yearly trends of publication production by publisher size.
Non-OA journal production of publishers that publish more than 100 journals increased slightly from 2011 (54.5%) to 2021 (55.4%). However, their OA journal production increased considerably from 2011 (19.8%) to 2021 (26.8%). In the same period, the percentage of publications by publishers who published only one non-OA journal decreased from 19.5% to 18.5%. In the case of OA journals, the publication shares of these types of publishers decreased from 42.7% to 37.3% during the same period. Publishers that publish more than 100,000 articles have been producing OA journal articles only since 2020. Nevertheless, in 2021, publishers of this size published 31.4% of all OA journal articles. In terms of percentage share, while there has been a decline in the production of OA journal articles across all categories of publishers, the decline has been particularly pronounced for small publishers producing 1–999 journal articles.
Median yearly production of top publishers
Figure 4 displays the top publishers’ yearly production of OA and non-OA journals and published journal articles. Since 2011, the top publishers have produced a relatively low number of non-OA journals. Among these publishers, OA journal production has been inconsistent. Some publishers have not been able to significantly increase the number of OA journals over the years. Springer Nature and Elsevier have rapidly increased their numbers of OA journals, while Taylor & Francis, Hindawi, and MDPI have stagnated.
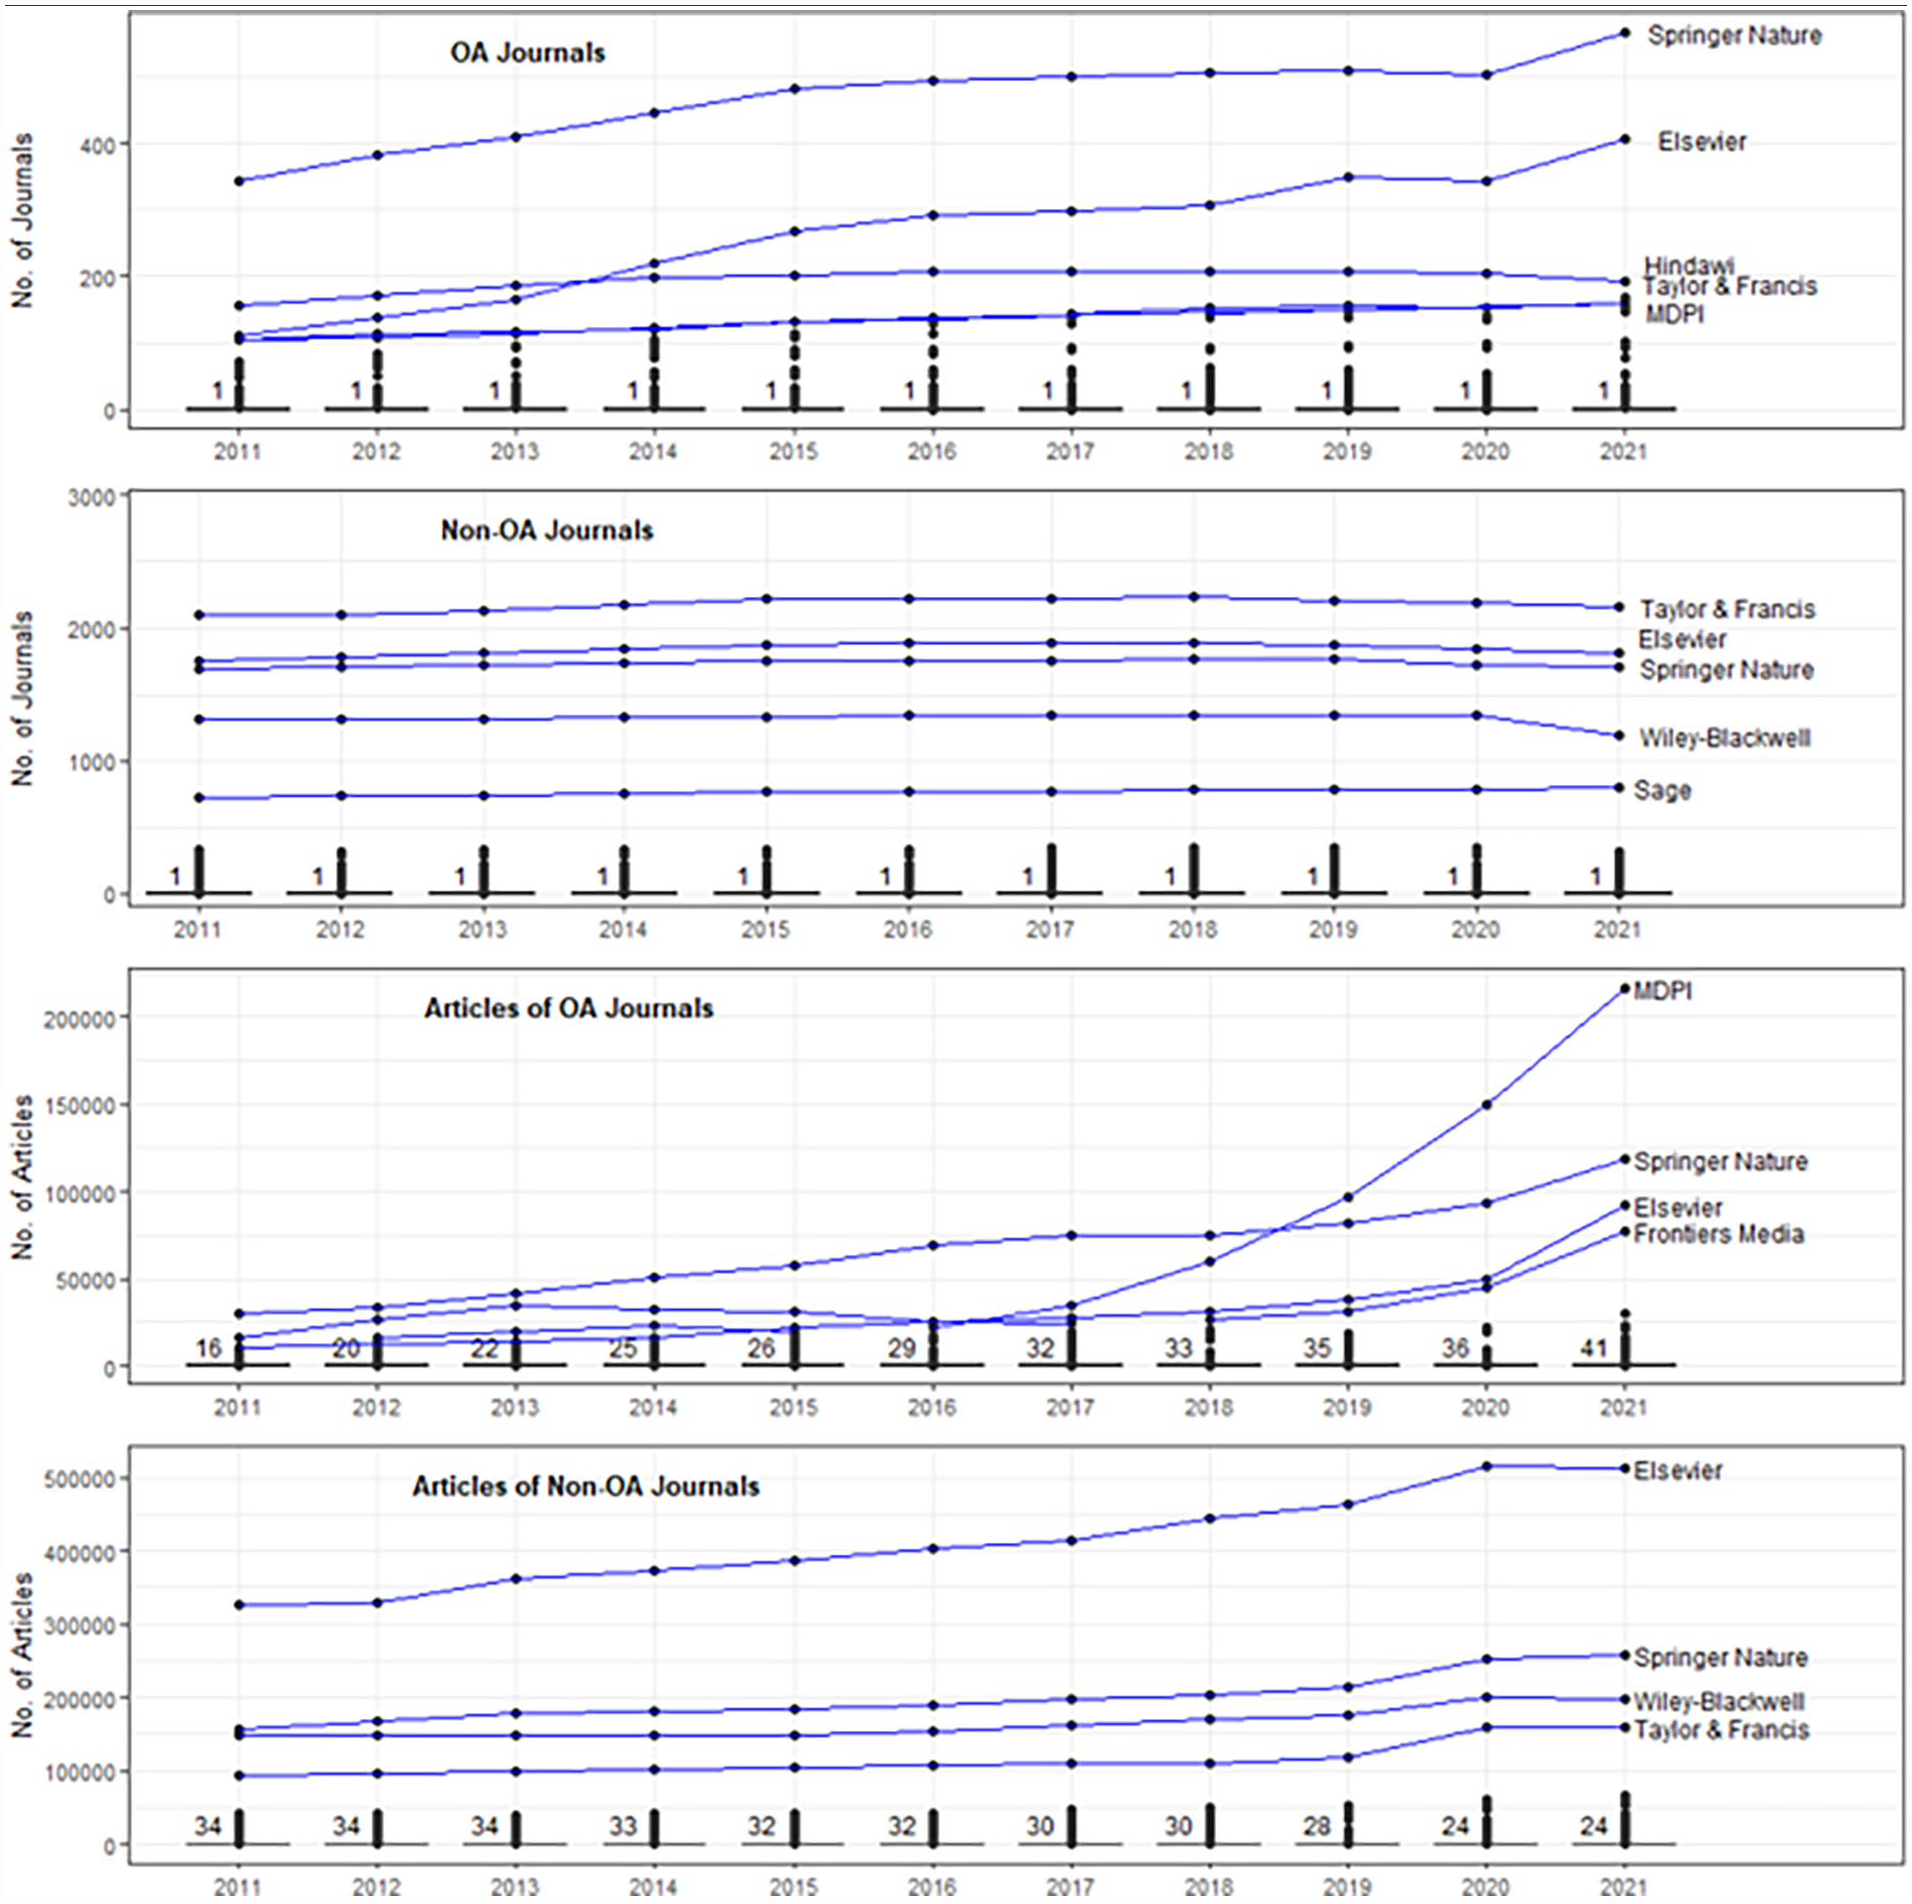
Publishers’ yearly production of OA and non-OA journals and journal articles.
The overall number of OA and non-OA journal articles produced by the top publishers has increased since 2011, with Elsevier having had a particularly steady increase in its journal article production over the years. The non-OA journal article production of the other top publishers—Springer Nature, Wiley-Blackwell, and Taylor & Francis—has increased sharply since 2019. OA journal article production at MDPI has increased significantly since 2017. We also observed a contrasting pattern between the production of OA and non-OA journals and that of OA and non-OA journal articles. Between 2011 and 2021, the median number of published non-OA articles decreased from 34 to 24 per publisher, while the median number of OA articles increased from 16 to 41 per publisher. Thus, regardless of the size of the publishers, the median number of articles published in OA journals has increased substantially over the years compared with articles published in non-OA journals.
Changes in top publishers’ publication production
Figure 5 shows the numbers of non-OA and OA journals and articles published in 2011 and 2021. The two periods are clearly different. A concentration of publishers can be seen in the lower left corner of the sub-figure showing the number of non-OA journals in 2011. In 2021, this concentration became more dispersed. Between 2011 and 2021, the ratio of non-OA to OA journals also differed greatly among top publishers. In 2021, publishers such as Elsevier significantly increased OA journal production relative to 2011. Top publishers published significantly more articles in OA journals in 2021 than in 2011. In 2021, MDPI published the most OA articles.
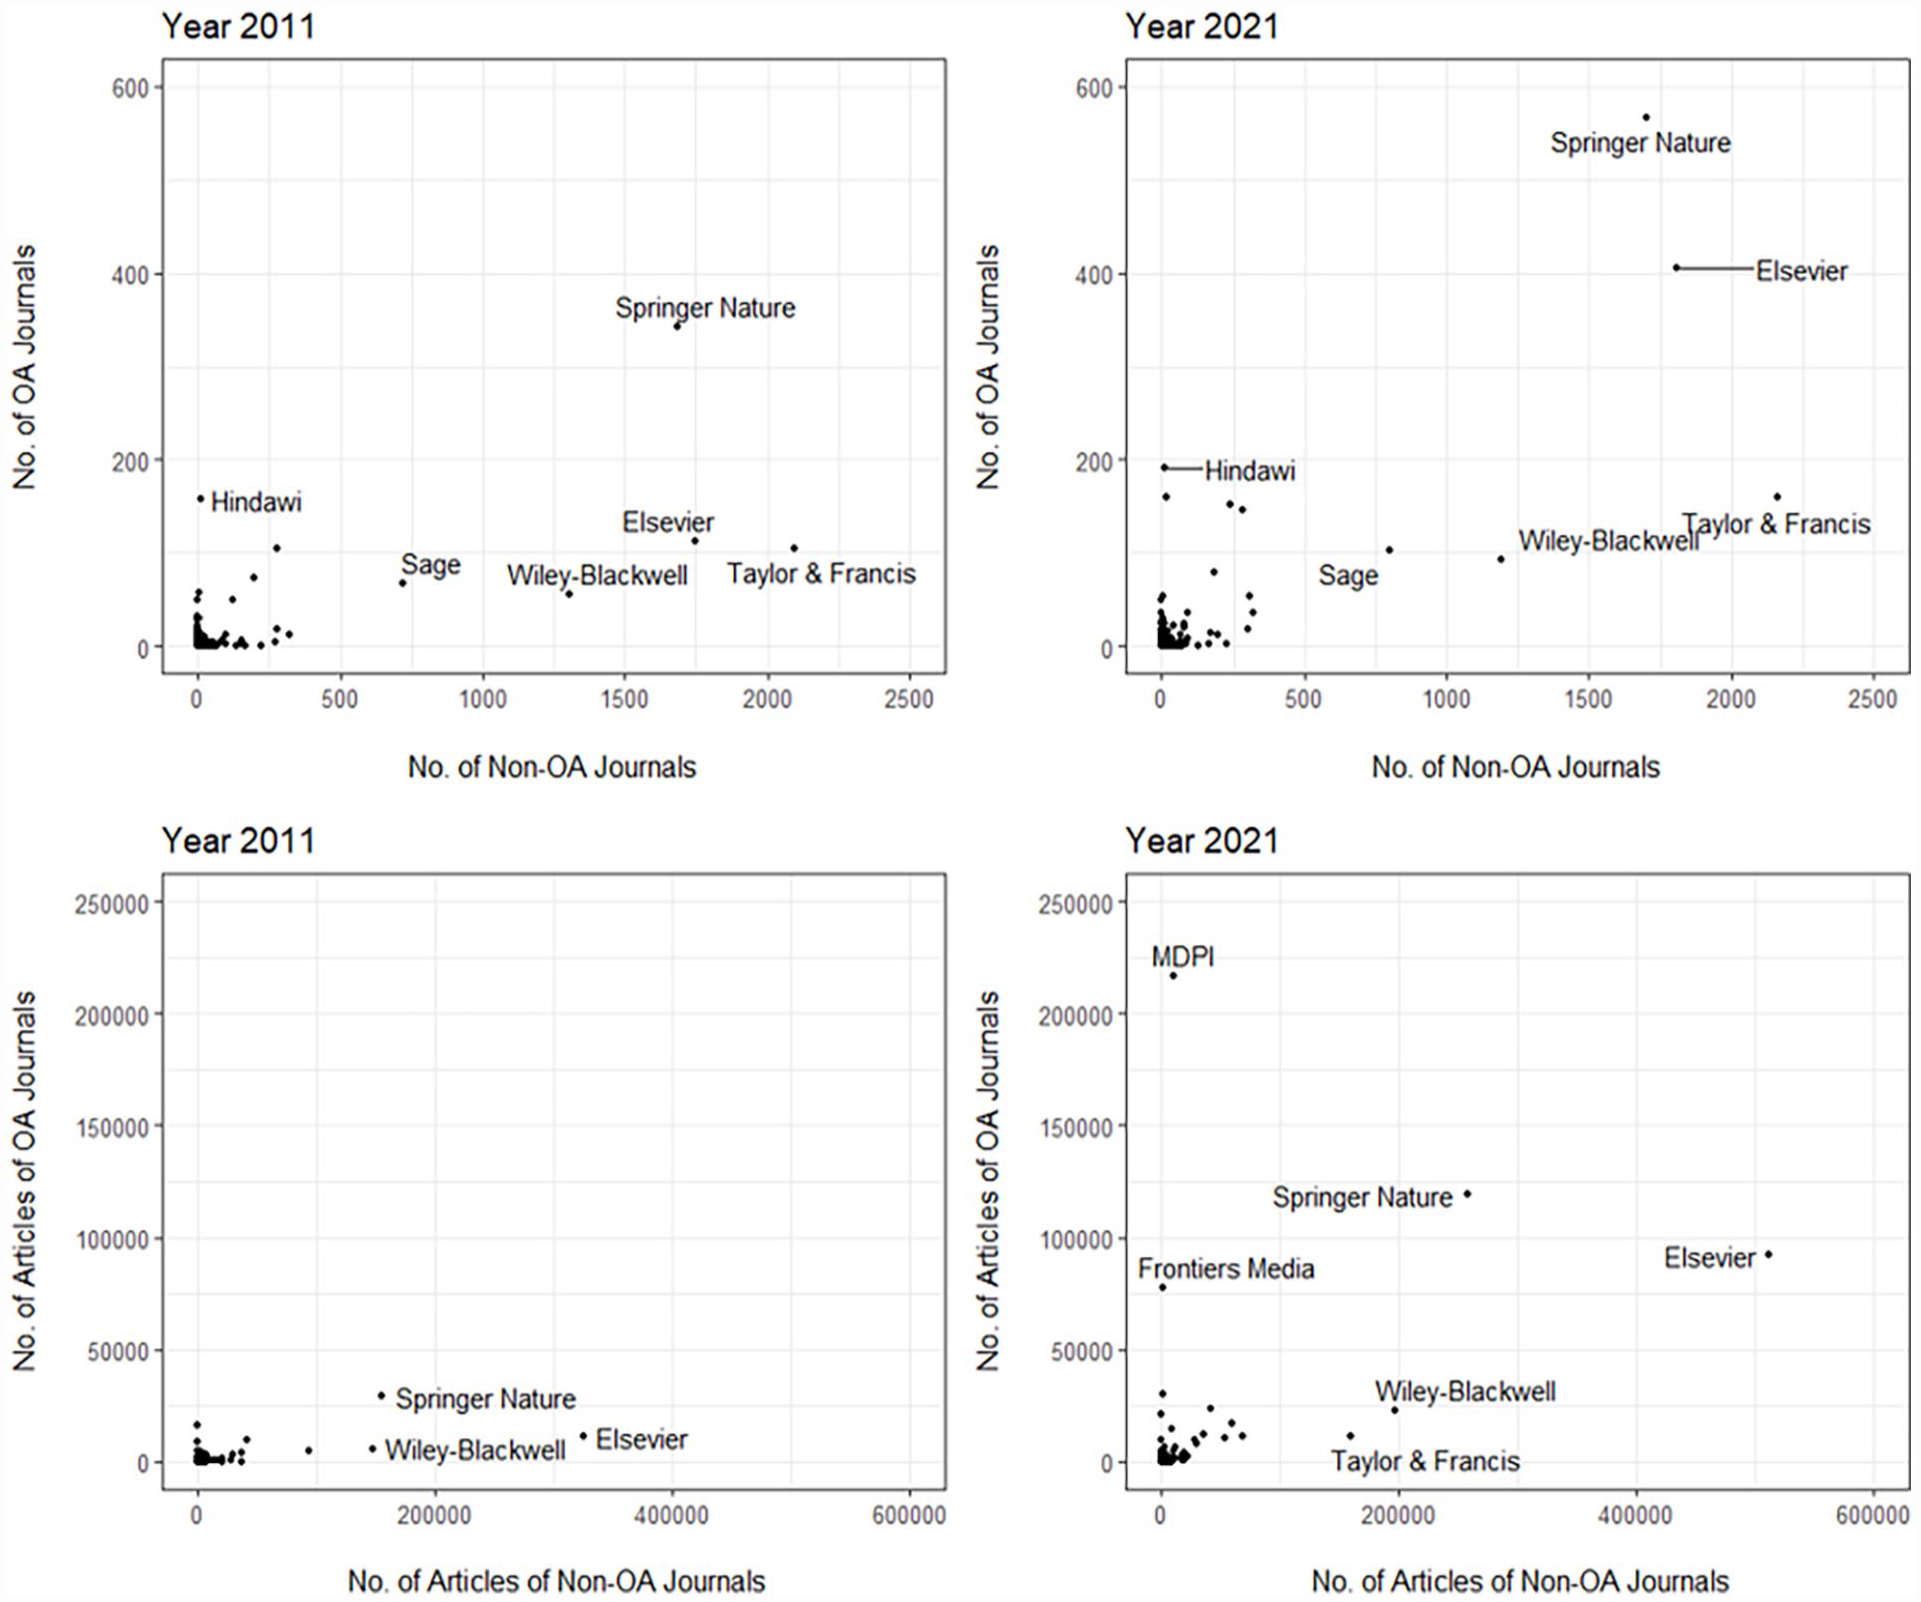
Top publishers’ publication production in years 2011 and 2021.
Top OA and non-OA journals
Table 1 presents the top 10 OA and non-OA journals with the highest numbers of articles published in 2021. As previously reported, OA journals had a significantly higher number of journal articles than the top non-OA journals. Among the publishers whose journals published articles in the top 10, three were non-profit organizations: the American Physical Society, PLOS, and IEEE. When considering the aggregate number of journal articles, these publishers published fewer journal articles than the top commercial publishers. The top OA journals listed were mostly mega journals, and MDPI published 7 of the 10 most prolific OA journals. Furthermore, SJR assigns scores to rank its indexed journals (González-Pereira et al., 2010) and divides them into four quartiles (Q1, Q2, Q3, and Q4). As shown in this table, except for two Q2 journals, all journals are in Q1. It should also be noted that all the publishers of these journals are based in wealthy Western countries.
Top 10 OA and non-OA journals with highest numbers of journal articles in 2021.
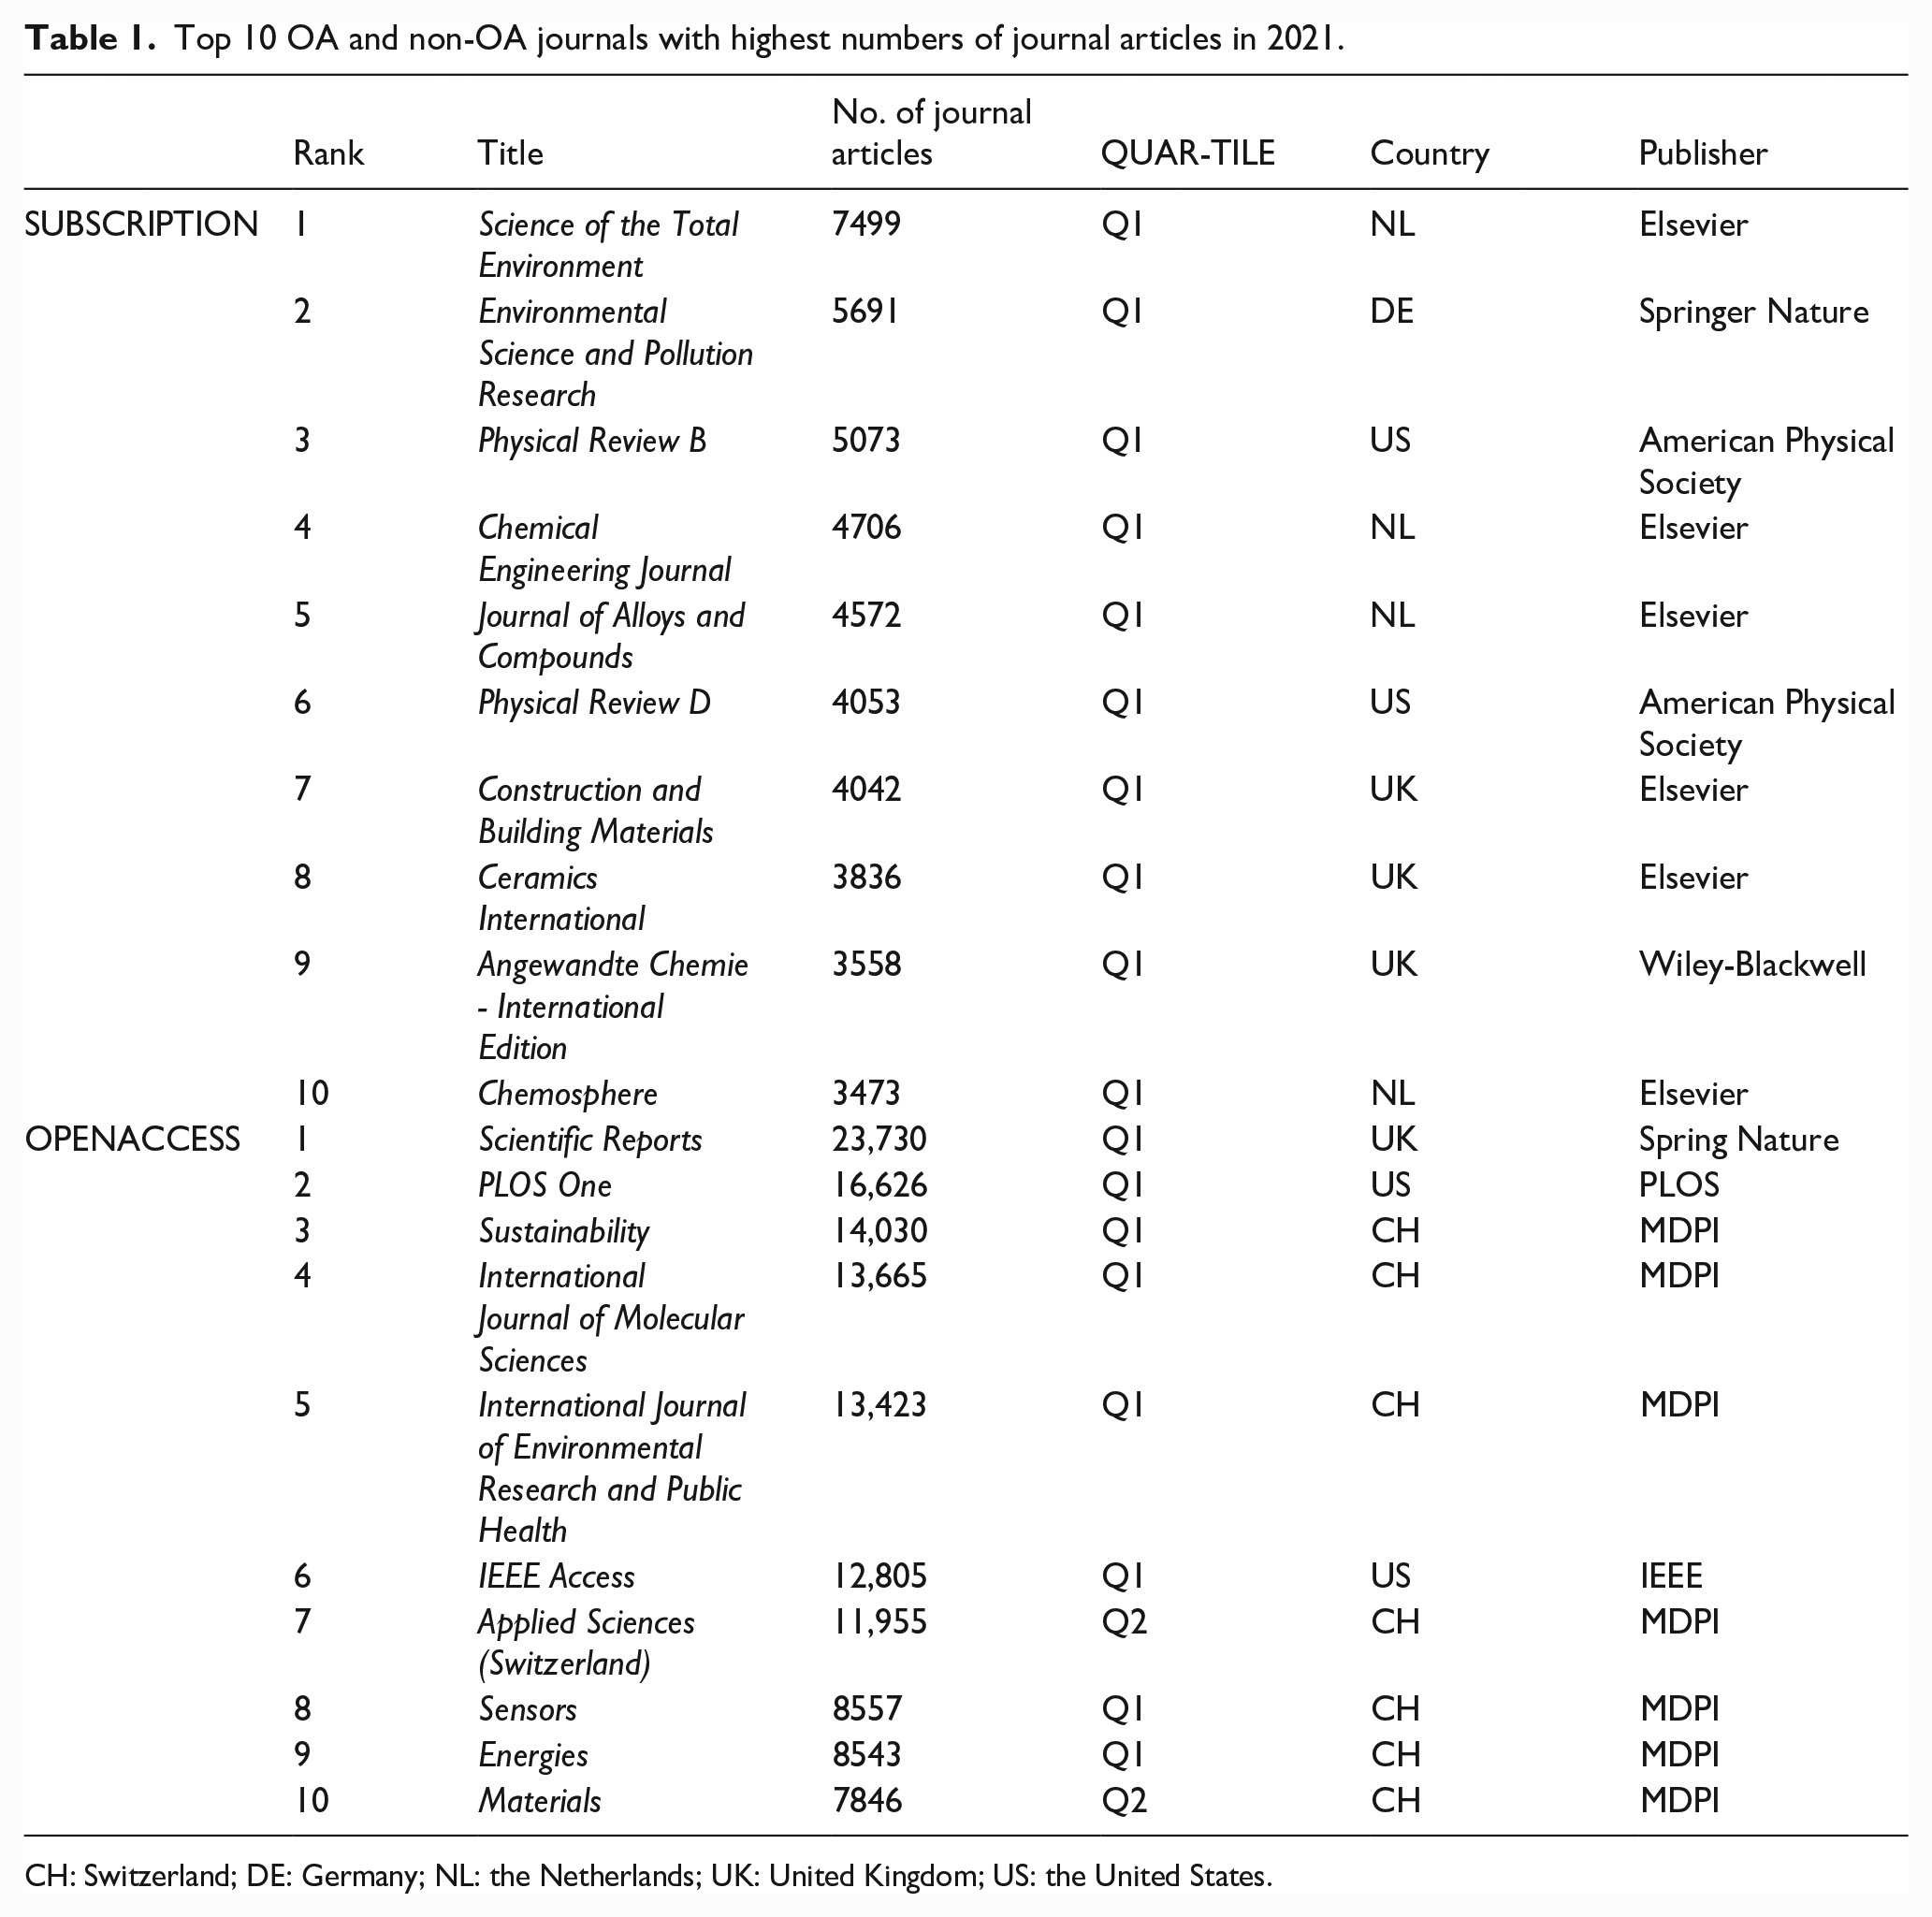
CH: Switzerland; DE: Germany; NL: the Netherlands; UK: United Kingdom; US: the United States.
Discussion and conclusion
The publishing industry has undergone significant changes over the past decade, and this study aims to examine trends in journal production. Because of the OA movement, publishers have been forced to change their non-OA publishing model. As publishers have moved toward publishing OA journals, the number of OA publications has increased over time. Journal publishing trends show that publishers have adopted divergent strategies in recent years. Some notable findings from the study include: (a) Although the number of OA journals has increased rapidly between 2011 and 2021, their share of total publications is still much lower than that of non-OA journals; (b) Between 2011 and 2021, the number of publishers of non-OA journals decreased slightly, as opposed to a rapid increase in the number of OA journal publishers; (c) Publishers of all sizes increased the production of OA journal articles between 2011 and 2021, but the share of top publishers increased the most; and (d) MDPI, as a born-OA publisher, has become a global leader in publishing OA journal articles in the last few years.
The rapid increase in the number of OA journals between 2011 and 2021 has not translated to a proportionate increase in their share of total publications. This suggests that adoption of OA publishing still faces barriers, and non-OA publishers remain dominant. The study suggests that most top publishers have adapted successfully to the new publishing environment, with many traditional publishers offering both OA and non-OA journals as a result of the OA movement. Meanwhile, the gap between the largest and smallest publishers in terms of the number of journals and articles published has widened, with approximately 97% of publishers producing fewer than 10 SJR-indexed journals in 2021. The smallest publishers’ publication shares also indicate a decrease in their journal and article production compared to the top publishers, which could lead to a decline in the number of OA journals published by the smallest publishers in the future. The study suggests that multiple factors may contribute to this trend, including globalization, commercialization, and technology. Furthermore, the industry consolidation of major commercial publishers has increased their production of OA journals and articles, as described by Posada and Chen (2018).
It should be noted that major commercial companies seem to have positioned themselves as reputable, diverse, and high-quality publishers in the world of predatory publishers (Gasparyan et al., 2017; Kurt, 2018; Shen and Björk, 2015; Xia et al., 2015). Thus, trust in commercial publishing companies (Lau and Lee, 1999) may be a factor influencing author submissions. Increasingly, author manuscript submissions resemble platform selection as authors are under pressure to produce more research. Authors can receive a variety of journal publishing services from top commercial companies, including editing services (Taylor & Francis, 2022). As global commercial publishers manage a large number of journals, authors can use one standard format (e.g. editorial management, reference styles, etc.). Cascading peer reviews are also used by some publishers, in which rejected articles (and their reviews) are transferred from one journal to another. In a competitive environment, publishers that offer rapid publication become winners. According to MDPI, manuscripts e published within 5–7 weeks of submission if no major revisions are needed (MDPI, n.d.a).
It is especially interesting to observe that some megajournal publishers such as MDPI have been able to rapidly increase their journal article production without publishing a large number of journals. MDPI is a relatively new OA publisher established in 1996 that differs from traditional publishers in terms of its publishing models (MDPI, n.d.b). In light of MDPI’s rise as a global OA publisher, the number of articles published should be included in assessments of the publisher’s output. It has been argued that megajournals may have lost momentum as publishing models have matured (Brainard, 2019). However, the growth of MDPI and Frontiers Media shows otherwise, as they have not yet reached their peak in journal article publishing. The journal publishing industry will likely continue to undergo changes in the near future. According to Zhang et al. (2022), major publishers have been considering launching their own megajournals in order to publish large numbers of research papers per month. Although the total number of articles is an important metric for measuring publisher performance, asset risks differ significantly between traditional and megajournal publishers. Publishers of megajournals are not equally regarded as publishers of traditional non-OA journals by peers in their scientific field. Publishers of megajournals generally publish less prestigious journals than those published by traditional publishers, although their acceptance rate has declined in recent years (Björk, 2021).
While this study provides valuable insights into the trends in OA and non-OA journal publication and production over the last decade, we acknowledge that there are several limitations that must be considered. First, there are various categories of journal publishers that were not considered in this study. In particular, no distinction was made between OA journals that were born-OA and OA journals that had been converted from subscription journals, or between exclusive electronic publishers and mixed publishers that publish journals in both formats. Second, we acknowledge that hybrid publishers that publish OA articles were categorized as non-OA in this study since collecting article publication information for all hybrid publishers from Scopus was not practical. Thus, many OA articles were encompassed in our non-OA category. Third, we did not seek to fully explain the underlying reasons for the steep decline in the number of non-OA journals indexed in Scopus in 2020 and 2021. The decline in these years could be due to the impact of the COVID-19 pandemic and the removal of predatory journals, as well as the possibility of Scopus raising its indexing standard. According to Scopus, it has curated and re-evaluated the database to ensure that only journals with high-quality content are actively indexed and those which do not adhere to ethical publication standards are excluded (Holland et al., 2021). Lastly, this study examined publishers that published Scopus-indexed journals. There are many new small publishers, particularly those from developing countries. These publications were not considered in this study.
The limitations of this study underscore the complexity of the publishing landscape, underscoring the need for further research. Thus future studies should aim to incorporate additional categories of journal publishers and account for the impact of the COVID-19 pandemic, indexing practices, and other potential factors that may have contributed to the observed trends. Investing in such efforts will not only help us better understand the evolving publishing landscape but also help to shape policies and practices that promote global access to scholarly knowledge production.
Footnotes
Declaration of conflicting interests
The author(s) declared no potential conflicts of interest with respect to the research, authorship, and/or publication of this article.
Funding
The author(s) received no financial support for the research, authorship, and/or publication of this article.
