
Abstract
In recent decades, time-use diaries have emerged as useful tools for recording information on the amount of time that people devote to various activities. Debate remains, however, about whether there are significant differences between the results given by diaries and the results given by questionnaires regarding the share of unpaid labour in the household, in particular the differences between men and women. This paper is a contribution to that debate and widens the focus to consider another type of survey that contains questions that do not call for the measurement of time devoted to housework and caregiving, but rather explore people’s perceptions of the percentage of total housework that they perform.
Keywords
Introduction
In recent decades, time-use diaries have emerged as useful tools for the collection of information on the amount of time that people devote to various activities. 1 At the same time, general surveys on the population’s living conditions and habits have increasingly included questions on the use of time. Whether or not the results for the share of unpaid labour in the household differ depending on the instrument used to record the data – time-use diaries or questionnaires – is a matter of debate. 2 If the two methods for gathering data give similar results, then the implementation of the time-use diary, which has a much higher cost than a questionnaire, becomes unnecessary.
Without doubt, the reference article in this debate is by Marini and Shelton (1993). Marini and Shelton analyse the tools for collecting information on housework and caregiving, shed light on the problems of each tool and reach the conclusion that reliable methods and measures to capture this kind of work need to undergo constant development. Subsequent studies differ in a variety of aspects and do not arrive at conclusive results. At first, the debate tended to focus more sharply on ideological matters related to the gender bias apparent in the responses, since social pressure felt by respondents leads them to steer their responses in one direction or another. Later, the debate turned its attention to more technical reasons related to the type of methodological tool in use. The aim of this paper is to contribute to the debate about the differences in results between different methodologies widening the discussion to include the results achieved from a question type that now appears in various kinds of surveys, e.g. demographic surveys and surveys on living conditions or health. The new question type does not ask for measurements of time devoted to housework and caregiving. Rather, it explores people’s perceptions of the percentage of total required household labour performed by them. The fact that the question looks at perceptions and not measured time may offer additional information that could be helpful in the debate on what tools to use.
This study focuses on Catalonia 3 and it is based on three surveys: the Time-Use Survey 2002–2003 (TUS, INE 2004), the Sociodemographic Survey of Catalonia 2007 (SSC, IDESCAT 2008) and the National Health Survey of Spain 2006 (NHSS, INE 2007). However, the study takes an in-depth look only at the first two of these three surveys. All three surveys offer a different type of information and their characteristics are described in ‘Characteristics of surveys and analysed data’ section of this paper.
First, however, the next section sets out theoretical reflections related to the form of the questions and the type of responses elicited. The second section also notes the results of the main studies conducted in the last two decades. Then, after a description of the three surveys used in this paper, the fourth section sets out the results obtained, beginning with a descriptive analysis and moving onto a multivariate analysis, which provides information on the different ways of asking questions about time. The last section sets out our conclusions.
Background
To date, the debate has essentially focused on the disparity in the results for housework and caregiving collected from activities diaries and from questionnaires. Most authors hold the opinion that the diary, which is costlier and more complex to implement (Bonke, 2005; Kitterød and Lyngstad, 2005), is a more appropriate tool than the questionnaire for gathering this type of information (Juster et al., 2003; Marini and Shelton, 1993), although the differences may not be significant (Baxter and Bittman, 1995; Marini and Shelton, 1993; Niemi, 1993). A recent study (Schulz and Grunow, 2012) goes further in its conclusions, proposing that if comparisons between diaries and questionnaires are done according to specific tasks and not in aggregate terms, then the results obtained from the two tools may be consistent. Hence, the objective of many studies on the subject is to assess the differences between the two data-gathering tools; if it turns out that the differences are not significant, the questionnaire could be used instead, because of its lower cost.
Arguments spelling out the advantages and disadvantages of each methodology are diverse; some are more methodological in nature, and others more applied. However, they do not typically consider more theoretical reflections on how the questions are posed or the type of information elicited. To bridge this gap, the current section proceeds below to examine theoretical reflections on these two issues.
The theoretical background
The central problem common to the diary and the questionnaire, which is not usually noted, is that both tools gather what may be called “clock time”, time measured in hours and minutes. This way of measuring time, which was adopted by the economy during the period of industrialisation to measure wage labour, overlooks the fact that both the clock and the timetable are human conventions, and that time is far more than a simple schedule (Torns, 2001, 2004). With the quantitative measurement of time, we lose notions more closely tied to life’s rhythms, moments, stages and experiences. Our interest in this study lies particularly in the loss of hard-to-quantify subjective dimensions of the time needed for life, such as the time devoted to caregiving, affection, support, household management and administration, relationships and leisure. All these qualitative dimensions of time are hidden by quantitative measures (Adam, 1999, 2004).
The conceptual problems posed by ‘time’ give rise in the applied area to the methodological limitations of diaries and questionnaires as data-gathering tools. These limitations appear basically in relation to many of the activities seen as direct caregiving and not in relation to activities traditionally considered housework, such as cleaning, ironing and sewing, which are more easily marketable and measurable by clock time. This may explain why most of the studies (Kan and Pudney, 2008; Kitterød and Lyngstad, 2005; Schulz and Grunow, 2012) that discuss the measurement tools focus their analysis exclusively on housework and explicitly exclude activities related to caregiving.
The more noted limitations concern the problems of measuring time for tasks performed simultaneously and the difficulty of capturing the time devoted to household management and organisation, emotional support and situations of ‘looking after’ somebody else. These limitations may be even more severe in an activities diary than in a questionnaire, because the questionnaire elicits overall responses that can include perceptions on the energy, fatigue and overlap represented by the work and such perceptions go beyond directly measured time.
However, in spite of these limitations, the diary offers other advantages that make it a more appropriate tool than the questionnaire. Most authors hold that the diary offers information that is more reliable and more complete, and can be analysed far more flexibly than the questionnaire (Bonke, 2005; Marini and Shelton, 1993; Niemi, 1993; Press and Townsley, 1998). As a result, the challenge remains to try to reduce the diary’s limitations. Some of these limitations could be countered, for example, by combining the diary with questions that capture more subjective aspects. In a number of countries, the diary has an additional column that asks whether the respondent was looking after other individuals during the realisation of the activity. The additional column enables easier capture of passive caregiving activities.
The second theoretical reflection that is commonly left unconsidered concerns surveys that ask not about time but about the proportion of work performed by the respondent with respect to the total labour done in the household. This is called ‘perceived time’. 4 Perceived time has advantages over clock time with respect to aspects that are more subjective, but it also has serious limitations to do with the objectivity of measured time.
By definition, perceived time is a subjective measure. As such, it is affected by ideological factors that participate in the social construction of a structure of time determined and conditioned by social and/or demographic variables. Individuals internalise social norms and generally treat these norms as fixed.
In the field that interests us, two aspects emerge as fundamental. The first and certainly the most crucial is the subjectivity of individuals. Time spent on housework and caregiving responds to fixed social roles and a traditional sexist ideology that allocates work by gender. These factors remain present in practice and in the collective symbolic (Greenstein, 1996a, 1996b; Gupta 2007; Katz, 1997; Press and Townsley, 1998). In this respect, men tend to perceive that they do more work than they really do; they overestimate their contribution, because they do not consider themselves socially responsible for the work. Naturally, the situation of women is the opposite. Perceiving themselves as responsible for managing the household in all of its dimensions, they tend to perceive the work as shared when their male partners contribute in some way.
The second aspect, which is related to the first, concerns the perception of time devoted to providing care and attention to other individuals, a perception affected by the wages earned by each member of the couple (Agarwal, 1997; Dema, 2006, 2009; Pahl, 1983, 1989, 2000). In the traditional family, the prevailing view once held that the division of work responded to a certain equality: husbands were in charge of contributing monetary resources to the household, while wives performed housework and caregiving. As larger and larger numbers of women joined the workforce, the idea persisted (at least in the symbolic of men) that the contribution of each member of a couple to the household is partly monetary and partly housework and caregiving. As women generally have lower wages, they should, in principle, assume a larger share of the unpaid work (Brines, 1994). Hence the perception held by men that they do more than their corresponding share of the housework.
The ‘doing gender’ theory takes account of the two aspects noted above. This theory maintains that people’s behaviour is a function of the expectations of others and, therefore, they act in accordance with established social norms (Brines, 1994; Gupta, 1999; South and Spitze, 1994; West and Zimmerman, 1987). Individuals with wages that do not correspond to their gender (i.e. women earning unusually high wages or men earning unusually low wages) may compensate by exaggerating and/or perceiving their contribution to housework and caregiving according to their gender role (Bittman et al., 2003; Greenstein, 2000; Gupta, 2006).
All of the aspects noted above should be taken into consideration when analysing the results of applied research.
Applied studies
In the last 20 years, studies analysing the diary and the questionnaire as methodological tools for gathering information on housework and caregiving have, in general, examined very specific aspects and identified the possibility of improvement in some of these aspects in order to enhance the data-collection techniques.
Most of the authors point first to the problem posed by the lack of surveys with both a questionnaire and a diary, which would make comparison possible across the same sample. This problem would appear to be relatively easy to solve. Time-use diaries normally accompany a questionnaire on the respondent’s household, employment and social situation. Additional questions could be incorporated to ask how much time the respondent devotes to housework and caregiving. In any event, the studies are inconclusive about whether the differences encountered between the data from questionnaires and diaries are really the result of problems caused by the use of distinct surveys.
One of the reasons claimed to justify the differences in results between questionnaires and diaries is the lack of precision in the definitions given to housework and caregiving or, simply, the fact that authors use different definitions. While the diaries clearly specify activities, questionnaire responses can be influenced by respondents’ conceptions of the tasks included in household labour, from which they generally exclude activities such as caregiving and gardening (Baxter and Bittman, 1995; Kitterød and Lyngstad, 2005; Lee and Waite, 2005; Robinson, 1999).
Authors also mention problems with memory that can affect questionnaire responses, an aspect that has a greater effect on individuals with more inconsistent patterns of involvement (Marini and Shelton, 1993). Problems arising from the simultaneity of activities have also been posed to explain the differences in results between diaries and questionnaires. In contrast to a diary, an individual responding to a questionnaire may consider the total of activities performed and include all the activities performed simultaneously (Juster and Stafford, 1991; Marini and Shelton, 1993), and this situation would affect a larger proportion of women than men, because women show greater simultaneity in the performance of household labour (Lee and Waite, 2005).
Looking at the characteristics of the results, most of the studies find that the amounts of time devoted to household labour obtained by questionnaires are greater than the respective amounts of time obtained by diaries, especially the amounts of time spent on more frequent activities (Baxter and Bittman, 1995; Bianchi et al., 2000; Juster et al., 2003; Kan and Pudney, 2008; Lee and Waite, 2005; Marini and Shelton, 1993, Niemi, 1993; Press and Townsley, 1998; Robinson, 1985). This may be due to a questionnaire’s possible inclusion of leisure activities (having coffee, reading newspapers, etc.) that are done during housework (Rydenstam, 2001). In addition, individuals who do greater amounts of work tend to overestimate their contribution, while individuals who do less work underestimate their contribution (Bonke, 2005).
Differences by gender also appear. Some authors argue that differences in the results obtained from questionnaires and diaries are greater in women than in men (Baxter and Bittman, 1995; Marini and Shelton, 1993; Niemi, 1993; Robinson, 1985), while other studies qualify these results (Bonke, 2005; Kan, 2008). Drawing on other authors, Kitterød and Lyngstad (2005) raise two possible explanations for these differences. On the one hand, women continue to do a greater proportion of household labour, leading to their over-estimation of their share of the work (Marini and Shelton, 1993). On the other hand, it is contended that women offer more realistic data because they do more household labour than men and therefore have more information about it. Press and Townsley (1998) discuss these approaches and argue that if the above reasons are correct, then differences exist between women themselves: women who say they do a greater amount of housework and caregiving should present smaller differences in the results compared to their male partners, but the results offered by the studies do not show this.
Results have also been analysed not only in overall terms, but also by groups according to social and demographic variables. Most authors conclude that the patterns of variation among the subgroups are relatively small and that questionnaire information provides an ordinal ranking that is useful for a multivariate analysis of the participation of men and women in household labour and their lifestyles in relation to their use of time (Baxter and Bittman, 1995; Marini and Shelton, 1993; Robinson, 1985).
Interesting results that are not always in agreement emerge when each member of a couple is asked about the time spent on household labour by themselves and by their spouse. Some authors conclude that individuals tend to over-estimate more their own time than the time spent by their partners and this tendency is greater in the case of men (Marini and Shelton, 1993). By contrast, other authors pose the qualification that women over-estimate their own time, but estimate the time spent by their partners with greater precision. Some authors find that men over-estimate both amounts of time, their own and their partner’s (Lee and Waite, 2005), while others find that men and women always attribute more work time to their partner than to themselves. However, differences by gender do appear: men’s over-estimations of their partner’s work tend to be greater than those made by women (Bonke, 2005). Bonke points to the importance of an aspect of that we have called perceived time, noting that some questionnaires pose questions about the share of work and not measured time. As a result, the results give an account less of real behaviour than of social norms.
Press and Townsley (1998) point to another type of reason underlying the differences in results for housework and caregiving obtained from questionnaires and diaries. They propose that these differences cannot be explained only by problems of memory, definitions of household labour or simultaneities, but also by the fact that the process of responding to a questionnaire is profoundly biased by questions of gender tied to social norms. 5 Men and women tend to reproduce their roles in their responses. In other words, their responses are a function of their gender roles. Other variables also affect their responses, such as their educational level, their age and the level of their own income (Kan, 2008; Kitterød and Lyngstad, 2005; Schulz and Grunow, 2012).
These approaches tie into the ‘doing gender’ theory mentioned early. According to this theory, individuals who break the social norm of the labour market, such as women who earn more than their partners, tend to compensate for their identity issues by adopting more traditional patterns in housework and caregiving (Bittman et al., 2003; Brines, 1994; Greenstein, 2000).
The wide spectrum of results obtained by different authors provides ample justification for pursuing further studies in this area and contributing new information to deepen the ongoing debate.
Characteristics of surveys and analysed data
The Time-Use Survey (TUS) 2002–2003, the National Health Survey of Spain (NHSS) 2006 and the Sociodemographic Survey of Catalonia (SSC) 2007 have very different aims. The first survey collects information on the time devoted to paid and unpaid work in order to develop policies focused on the family and gender equality; contribute to Spain’s national accounts through the preparation of satellite accounts; and analyse time devoted to leisure, transport and so forth in order to devise policies in other areas. The second survey has the general aim of providing information on the health of the population needed to plan and assess measures in the healthcare area. The third survey sets out to obtain information on the chief demographic variables and deepen our understanding of the causes and consequences of any significant demographic shifts occurring in Catalonia.
The type of information collected by a survey is directly related to its aims. The information and the method for gathering it (the type of questions) differ sharply in the three surveys, and the greatest difference occurs between the TUS and the other two. For the TUS, the time spent by individuals on different activities and particularly on different kinds of work in the household is a central aim. By contrast, neither the NHSS nor the SSC is a work survey or a time-use survey. As a result, their questions on housework and the care of minors, the elderly or individuals with health problems do not constitute their main focus. Rather, one of the surveys is designed to supplement information on roles in the family structure and caregiving to individuals who cannot take care of themselves because of age or health, and the other is devised to give additional information on the possible effects of housework and caregiving on the health of individuals. All authors, therefore, take the TUS as their frame of reference in comparative studies.
The Time-Use Survey 2002/2003 follows the EU standard established by Eurostat. The TUS in Spain involved the uniform distribution of fieldwork for one year (September 2002–October 2003), ensuring that all days (work days and holidays) were represented. The sample included approximately 24,000 households. The survey consisted of a household questionnaire, an individual questionnaire and a completed diary of activities required of everyone in the household who was 10 years of age or older, and a weekly work schedule for everyone in the household with employment. The diary collected activities in 10-min blocks and distinguished between primary and secondary activities.
The National Health Survey 2006 is the most recent survey of its kind conducted in Spain. The fieldwork was distributed uniformly across an entire year (June 2006–June 2007). The sample included 29,478 individuals who were 16 years of age or older and 9,122 children from 0 to 15 years of age. In the case of the children, interviews were given to their mother, father or legal guardian. Interviewees were asked separately about four types of unpaid household activities: tasks traditionally considered housework; care of the elderly or the ill, care of individuals with disabilities and care of children. In each case, the respondent was asked who the person is who primarily takes care of the tasks. Specifically, in the case of housework, the question was: “In your home, who is primarily in charge of household tasks like washing up, cooking, ironing, etc.?” The respondent could choose from a selection of 10 responses. However, only in the case of the first three responses (respondent only, respondent and partner and respondent and a third person) did a follow-up question ask for time spent on Monday through Friday (on average) and on Saturday and Sunday. In this case, the response elicited average weekly time, but only for individuals who said they performed a significant portion of the housework.
The Sociodemographic Survey 2007 was conducted for Catalonia in November 2007 and it remains the only survey of its kind conducted in Catalonia to date. The sample was approximately 27,200 individuals in 10,520 households. Respondents were asked separately about three types of unpaid household activities: tasks traditionally considered housework, care of the elderly or the ill and care of children. The three questions were analogous and the one specifically referring to housework was: “Normally, to what extent do you participate in the unpaid work in your household?” There were four possible responses: (a) I do all or nearly all of it; (b) I do a significant portion of it, shared with at least one other person in the household; (c) I do a small part; and (d) I normally do none. In this case, the question does not ask for measured time. Therefore, the information obtained is the subjective perception of the respondent on the division of unpaid work in the household. The form of the question does not permit aggregations.
The three surveys, which are part of the official statistics of Catalonia, relate to different years, but they are comparable by population-sample, territory and time frame.
Results
Our analysis focuses on Catalonia because no survey with the characteristics of the SSC is available for Spain, making it impossible to draw comparisons with the data from the other two surveys. In common with the studies noted in the second section, consideration will only be given to traditional housework and not to caregiving activities. 6 Lastly, because we are interested in any differences of response between men and women in order to determine whether gender bias exists, the analysis is carried out on individuals who live with partners, are 25–59 years old and have children in the household.
The data analysis consists of two parts. The first part is a comparative descriptive analysis of the survey data, while the second part is a contribution to the methodological debate, offering a multiple regression analysis to estimate an explanatory model of the division of housework between women and men, comparing their responses from diaries and perceptions.
Descriptive analysis: Perceived time and conditioned subjectivity
Who is in charge of the household labour? (%) (NHSS and SSC).

Note: Principal male (pm); principal female (pf).
Source: Author’s calculations based on information from the National Health Survey 2006 and the Sociodemographic Survey of Catalonia 2007.
All in all, it indeed appears that the perceptions of women and men are conditioned and partly determined by ideological factors that attribute the responsibility for housework to women. This social assignment of roles, which is adopted by both sexes, leads to inflated male perceptions of their contribution to unpaid work. This is in line with the findings of a number of authors (Greenstein, 1996a, 1996b; Gupta, 2007; Katz, 1997; Marini and Shelton, 1993; Press and Townsley, 1998), and it concurs with aspects of the ‘doing gender’ theory.
Next, our analysis compares the results from the TUS and the SSC. Given the similarity between the NHSS and the SSC, the comparison focuses only on the SSC, because it already provides information not only on what each individual says about their own work, but also on the work done by their partner. First, the comparison requires transforming the diary’s hours and minutes into a qualitative variable. The procedure involves calculating the distribution ratio of total household labour (captured in the TUS) based on the sum-total of time spent by the principal people in the household. The ratio of the time spent by one of the principal people to the total time spent by both principal people gives the distribution ratio of housework. From this piece of data, we establish the following equivalence: individuals who perform between 75% and 100% of the total work are viewed as doing all of the work; individuals doing between 40% and 75% are viewed as sharing in the work; individuals doing between 10% and 40% are viewed as doing a small part; and individuals doing less than 10% are viewed as doing no work. While the criterion for establishing this equivalence is arbitrary, it does appear to be sensible. Naturally, it remains open to discussion, but this is what we have used in the analysis.
Who is in charge of the household labour? (%) (TUS and SSC).
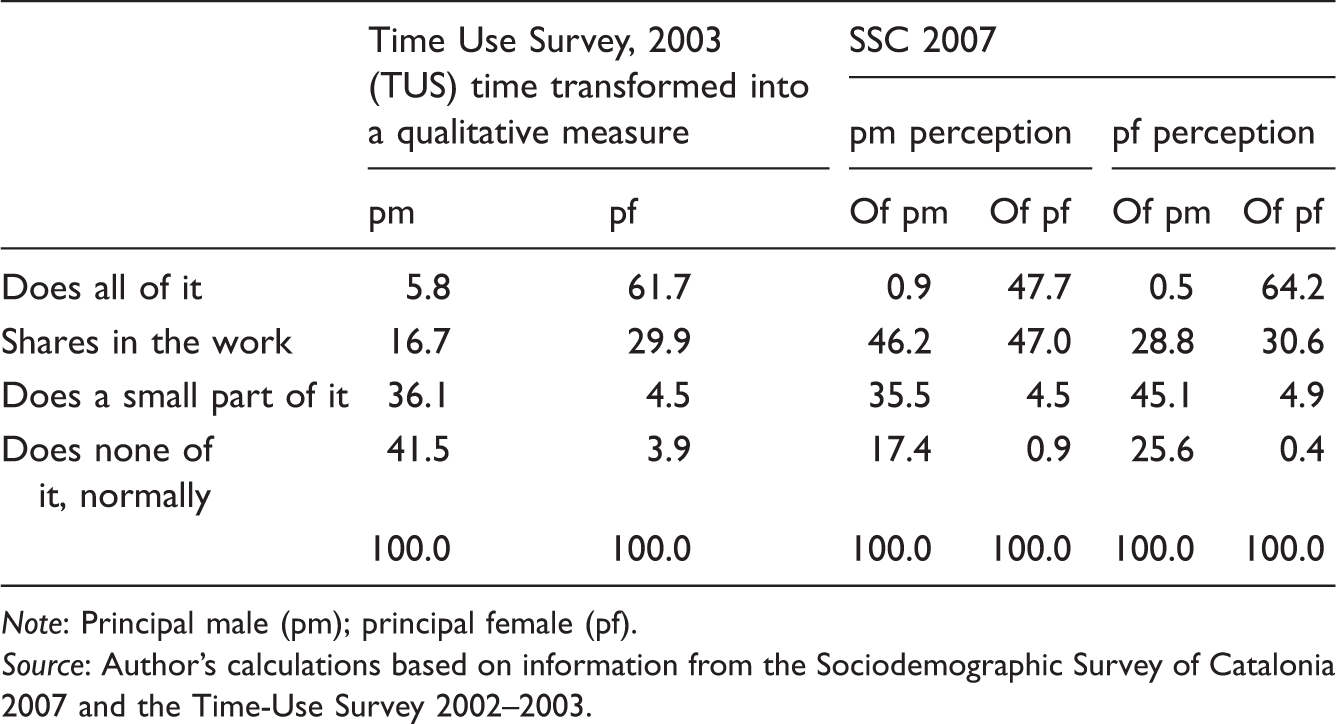
Note: Principal male (pm); principal female (pf).
Source: Author’s calculations based on information from the Sociodemographic Survey of Catalonia 2007 and the Time-Use Survey 2002–2003.
The results highlight a fact that tends to confirm earlier remarks. For principal females, the figures obtained from transforming the TUS measurements of time spent on housework show a strong similarity with the perceptions held by principal females of their work in the SSC. By contrast, for principal males, the differences are stark, particularly in the second category, where their perception of sharing the work reaches 46.2% according to the SSC and only 16.7% according to the TUS. This result confirms men’s overestimation of their work in relation to the work done by women.
However, the perception held by women of their own work in the SSC, which is very similar to the information from the TUS, must be viewed with caution. The fact that the two assessments match each other may suggest that they reflect reality. However, it is also possible that women’s work is underestimated in both cases as a result of the effect on their perceptions of assumptions that housework is a woman’s responsibility; and also because, as noted in the first section, the assessments concern aspects that are hard to measure with clock time and this factor particularly affects women.
Lastly, it is interesting to explore the corroborative information provided by the SSC, namely the respondents’ perceptions of their partner’s participation in housework and its comparison with their own participation. The portion of principal males who perceive that they share in the work is 46.2%, while only 28.8% of principal females perceive that their partners share in the work. As a result, principal males overestimate their participation by 18% points with respect to what principal females perceive. For their part, principal females perceive that most principal males fall into the two lowest categories and not in the second category, sharing in the work, where the principal males actually perceive themselves to be. These results concur with the findings of Marini and Shelton (1993), but not with other authors who offer different response options, as noted in the second section. 9
Multivariate analysis
After discussing the descriptive results, we move to a multiple regression analysis in order to estimate an explanatory model of the division of housework between two members of a couple, based on diary data. The results of the regression model enable predictions to be made of the time spent on housework that would be obtained from interrogating the data from a diary (operationalised as a distribution ratio of the time data from the TUS), and the results will be compared with the results of a survey that poses the question on perception. By comparing results actually observed by means of the question on perception and results estimated from the diary (as if it had asked for the information), we can compare the explanatory effects and dimensions of the model’s variables.
Data and measures
Description of the sample.

Source: Author’s calculations from Spanish Time Use Survey (TUS, INE 2004). Sample: couples with children, age 25–59.
Results
Ordinary least square regressions of distribution ratio of time spent on housework (stepwise method).

Notes: ***p value < 0.01.
Source: Author’s calculations from Spanish Time Use Survey (TUS, INE 2004). Sample: couples with children, age 25–59.
The percentage of variability explained (adjusted R-squared) is 54.2%. No detailed discussion is offered because the results of the regression model concur with the results from other studies (Carrasco and Domínguez, 2011; Kan, 2008; Schulz and Grunow, 2012) and because the aim is to apply the estimated model predicting the distribution of housework between the principal individuals in the household.
The next step in the construction of a measure to report the gap between the two ways of measuring time spent on housework is to apply to OLS model using diary data (TUS) to the responses obtained from the Sociodemographic Survey (SSC). This makes it possible to estimate the distribution of housework between the two principal individuals in the household in the SSC as if they had completed a diary of activities. To do this, we multiply the coefficients estimated with the TUS model for the values of the variables belonging to each of the responses in the SSC. Equation (1) shows the operation algebraically (with the coefficients shown in Table 4).
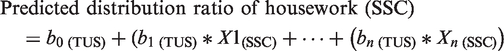
Using the results in Table 4, the function is expressed as follows:
Predicted distribution ratio of housework (SSC) = (.313 + female* (.486) + employed * (−.100) + socio-professional level high * (−.089) + minors in household 11–18 years old * (.023) + paid domestic services yes * (.017) + 30–34 years old * (.063) + 35–39 years old * (.064) + 40–49 years old * (.058) + 50–59 years old * (.051) + socio-professional level medium high * (−.044) + 3 or more children * (−.026) + 2 children * (−.013) + socio-professional level medium low* (−.025) + socio-professional level medium * (−.027) + minors under 3 years old * (.016) + secondary educational level * (.011) + university educational level * (.012) + unemployed * (−.017) + minors 3–10 years old * (.004)).
Lastly, the variable for the distribution ratio of housework estimated in the SSC is transformed into a qualitative variable following the previously explained intervals in order to compare both variables (the estimated variable using TUS data and the real variable from the SSC).
Share of unpaid household labour according to the estimate SSC model.
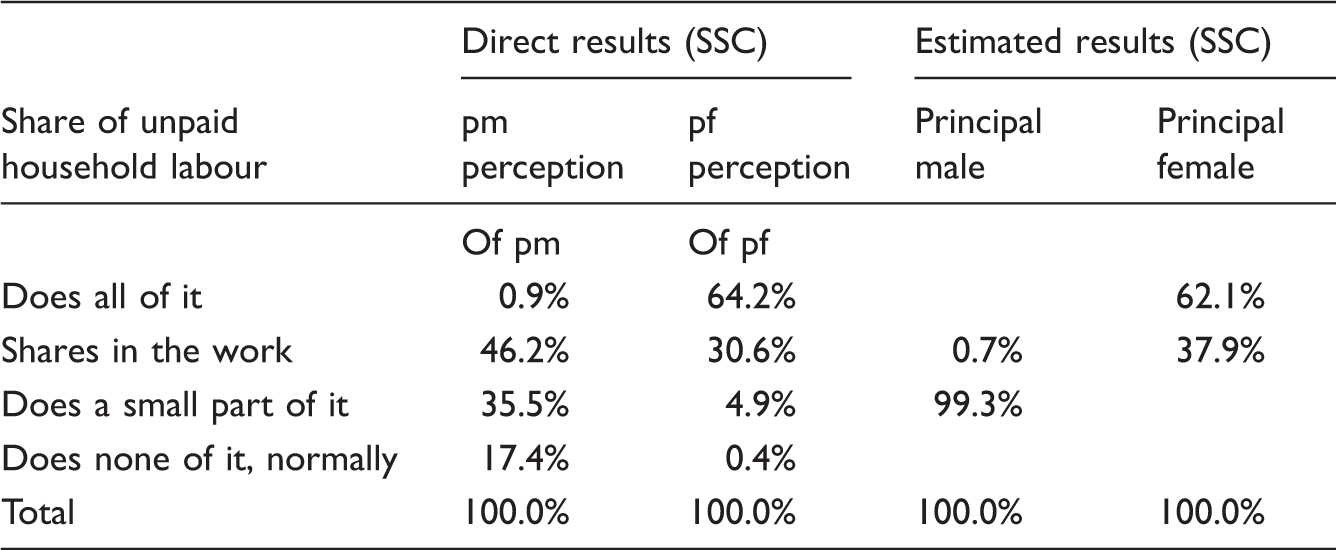
The data show that for women the direct results and the estimated results are very similar, demonstrating that the model estimates the data with high reliability based on the variables linked to life cycle. Nonetheless, principal females show a tendency to undervalue themselves: 5% of women who respond that they do a small part of the housework when asked about their perceptions become part of the category ‘does a significant part’ (shares in the work) if the data are estimated using the time-use diary. By contrast, for the men, the proposed model demonstrates less explanatory ability and a lower estimation of the results: there is a considerable (almost complete) transfer from ‘shares in the work’ in the direct data to ‘does a small part of it’ in the estimated data. The category of sharing includes doing between 40% and 60% of the housework. Because doing housework does not form part of men’s role, they may possibly perceive that doing 30%, for example, amounts to a significant part, i.e. that they are sharing in the work. Second, the category of not normally participating does not mean doing nothing, but rather it is possible that they spend some time (even if not regularly so). The hypothesis that provides the largest error in the estimation of the men’s data and the greatest gap between perceptions and diary data arises in that the variables present in the model, the most objective variables tied to life cycle, are not as significant in the behaviour of the men. None of the available questions permit approximation of the social norms and values affecting gender relations (Carrasco et al., 2005; Greenstein, 1996a, 1996b), which are fundamental to understanding and explaining the behaviour of men with respect to doing housework.
Conclusions
In the analysis performed, the activities diary remained the best methodological tool for measuring time spent on housework. As a result, it is important and urgent to correct its limitations.
With respect to the results, the descriptive analysis and the model concur in finding that the responses of women are more analogous across the various surveys, while the responses of men change according to whether the survey asks for perceptions or measured time. Men tend to perceive that a significant portion of the housework is shared and women perceive that they do most of the housework alone. The corroborative responses confirm the same tendency. This leads us to conclude that roles established by gender and social pressure concerning ‘what should be’ definitely have a strong influence on responses, particularly men’s responses. We know that peoples’ perceptions are influenced by what society considered ‘normal behaviour’. So that is why the perceptions of women and men are conditioned and partly determined by ideological factors that attribute the responsibility for housework to women. Indeed work strategies of men and women are deeply gendered and embedded in traditional gender role patterns. This social assignment of roles, which is adopted by both sexes, leads to inflated male perceptions of their contribution to unpaid work.
Lastly, it is important that this type of analysis should continue; as Marini and Shelton (1993) say reliable methods and measures to capture this kind of work need to undergo constant development. The results indicate the importance of conduct surveys with both a questionnaire and a diary, which would make comparison possible across the same sample. And these surveys must be conducted taking in account perceptions and not only measured time so they might offer additional information that could be helpful in the debate on what tools to use. For this, questionnaire must include questions on responsibilities, organization and tensions in work time as well as on a number of more qualitative aspects of caregiving activities, the reasons given by women and men for performing them, their experience and skill at these tasks, the difficulties in combining and reconciling household activity with paid work and the desires or preferences of women and men in relation to work and their use of time. We have proposed an alternative methodology involving a periodic survey that replaces labour force surveys and collects information on overall activity and its distinct components: paid work, housework, study and volunteer work (Carrasco et al., 2005). Finally we want to insist in the importance that this kind of surveys include direct caregiving activities, because they are among the household activities that require the greatest dedication of time and create the most serious difficulties in organising time, resulting in significant effects on the welfare of individuals, particularly the welfare of women, who continue to do the lion’s share of this work.
Footnotes
Declaration of Conflicting Interests
The author(s) declared no potential conflicts of interest with respect to the research, authorship, and/or publication of this article.
Funding
The author(s) received no financial support for the research, authorship, and/or publication of this article.