
Abstract
Hybrid type 2 studies are gaining popularity for their ability to assess both implementation and health outcomes as co-primary endpoints. Often conducted as cluster-randomized trials (CRTs), five design methods can validly power these studies: p-value adjustment methods, combined outcomes approach, single weighted 1-DF test, disjunctive 2-DF test, and conjunctive test. We compared these methods theoretically and numerically. Theoretical comparisons of power equations allowed us to identify when one method had more or less power than another globally. We showed that p-value adjustment methods are always less powerful than both the combined outcomes approach and the single 1-DF test, and identified conditions where the disjunctive 2-DF test is less powerful than the single 1-DF test. To further investigate when power advantages shift, we conducted a large-scale numerical study using our novel crt2power R package, which calculates power or sample size for CRTs with two continuous co-primary endpoints using these methods. Across 45,000 input scenarios, we found specific patterns: when treatment effects are unequal, the disjunctive 2-DF test tends to be most powerful; when treatment effects are equal, the single 1-DF test tends to dominate. Together, these comparisons offer practical guidance for powering hybrid type 2 studies.
Keywords
Introduction
Cluster-randomized trials (CRTs) are studies in which the unit of randomization is a cluster rather than an individual. Clusters can be villages, towns, hospitals, wards of a hospital, and so on. CRTs can offer logistical and administrative convenience, reduce treatment group contamination, and are advantageous when the intervention in question is best administered at a cluster level. 1 In implementation science, our fundamental research goal is to understand how best to deliver an intervention effectively; in these endeavors, CRTs are often utilized. This is because many implementation outcomes are often measured and assessed at the cluster level. Effectiveness-implementation hybrid designs offer simultaneous assessment of a health (or effectiveness) outcome and an implementation outcome. On one end of the spectrum, hybrid type 1 studies consider the health outcome as the primary outcome, while the implementation outcome is the secondary outcome. Hybrid type 3 studies consider the implementation outcome as the primary outcome, and the health outcome as the secondary outcome. The focus of this article is the hybrid type 2 study, which considers both outcomes as co-primary outcomes. 2
Hybrid type 2 studies are very advantageous because they allow for simultaneous analysis of both an effectiveness outcome and an implementation outcome in one study. With this added efficiency are various statistical complications. The first is the issue of multiple testing, where one must control the overall type I error rate. The management of this rate will have important implications on the overall study design parameters that result from the power calculations. There is also the complication of clustering—this introduces various correlations that come from the hierarchical structure of the data. In a recent study by Owen et al., five study design methods (specifically for sample size and power calculation) that can be applied to hybrid type 2 studies were identified through a literature review. 3 These methods were used on data motivated by a real-world hybrid study in order to showcase how the calculations for these methods could be conducted and how the considerations differ. However, to date, no formal analytic or simulation-based comparisons were made across the five methods in the context of hybrid type 2 designs. To fill in this gap, we aim to thoroughly examine the performance of these methods via theoretical comparisons and a numerical evaluation, where different scenarios have different assumptions and input parameters.
In order to conduct the numerical evaluation, and to make these methods more widely available for practice with hybrid type 2 designs, we also created an R package called
In this article, we begin by introducing notation for CRTs and hybrid type 2 studies, as well as describing the study design methods that are examined in the numerical evaluation and introduced in Owen et al. 3 in Section 2. Then, a thorough description of the software package and ShinyApp are provided along with usage examples in Section 3. Next, a theoretical comparison of the power equations is provided in Section 4. Lastly, a numerical evaluation comparing the performance of these methods is conducted in Section 5.
Methods
Notation
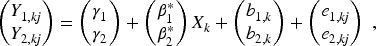
We begin by introducing notation for CRTs in a hybrid type 2 setting. In this setting, we have two continuous primary outcomes, denoted as
When using the p-value adjustment methods, which we will discuss in the next section, the power, cluster size, and number of clusters are calculated separately for each outcome. Thus, we have
Throughout the manuscript, we consider four key correlation coefficients. These are the endpoint specific intraclass correlation coefficients (ICCs) for
Description of required input parameters.
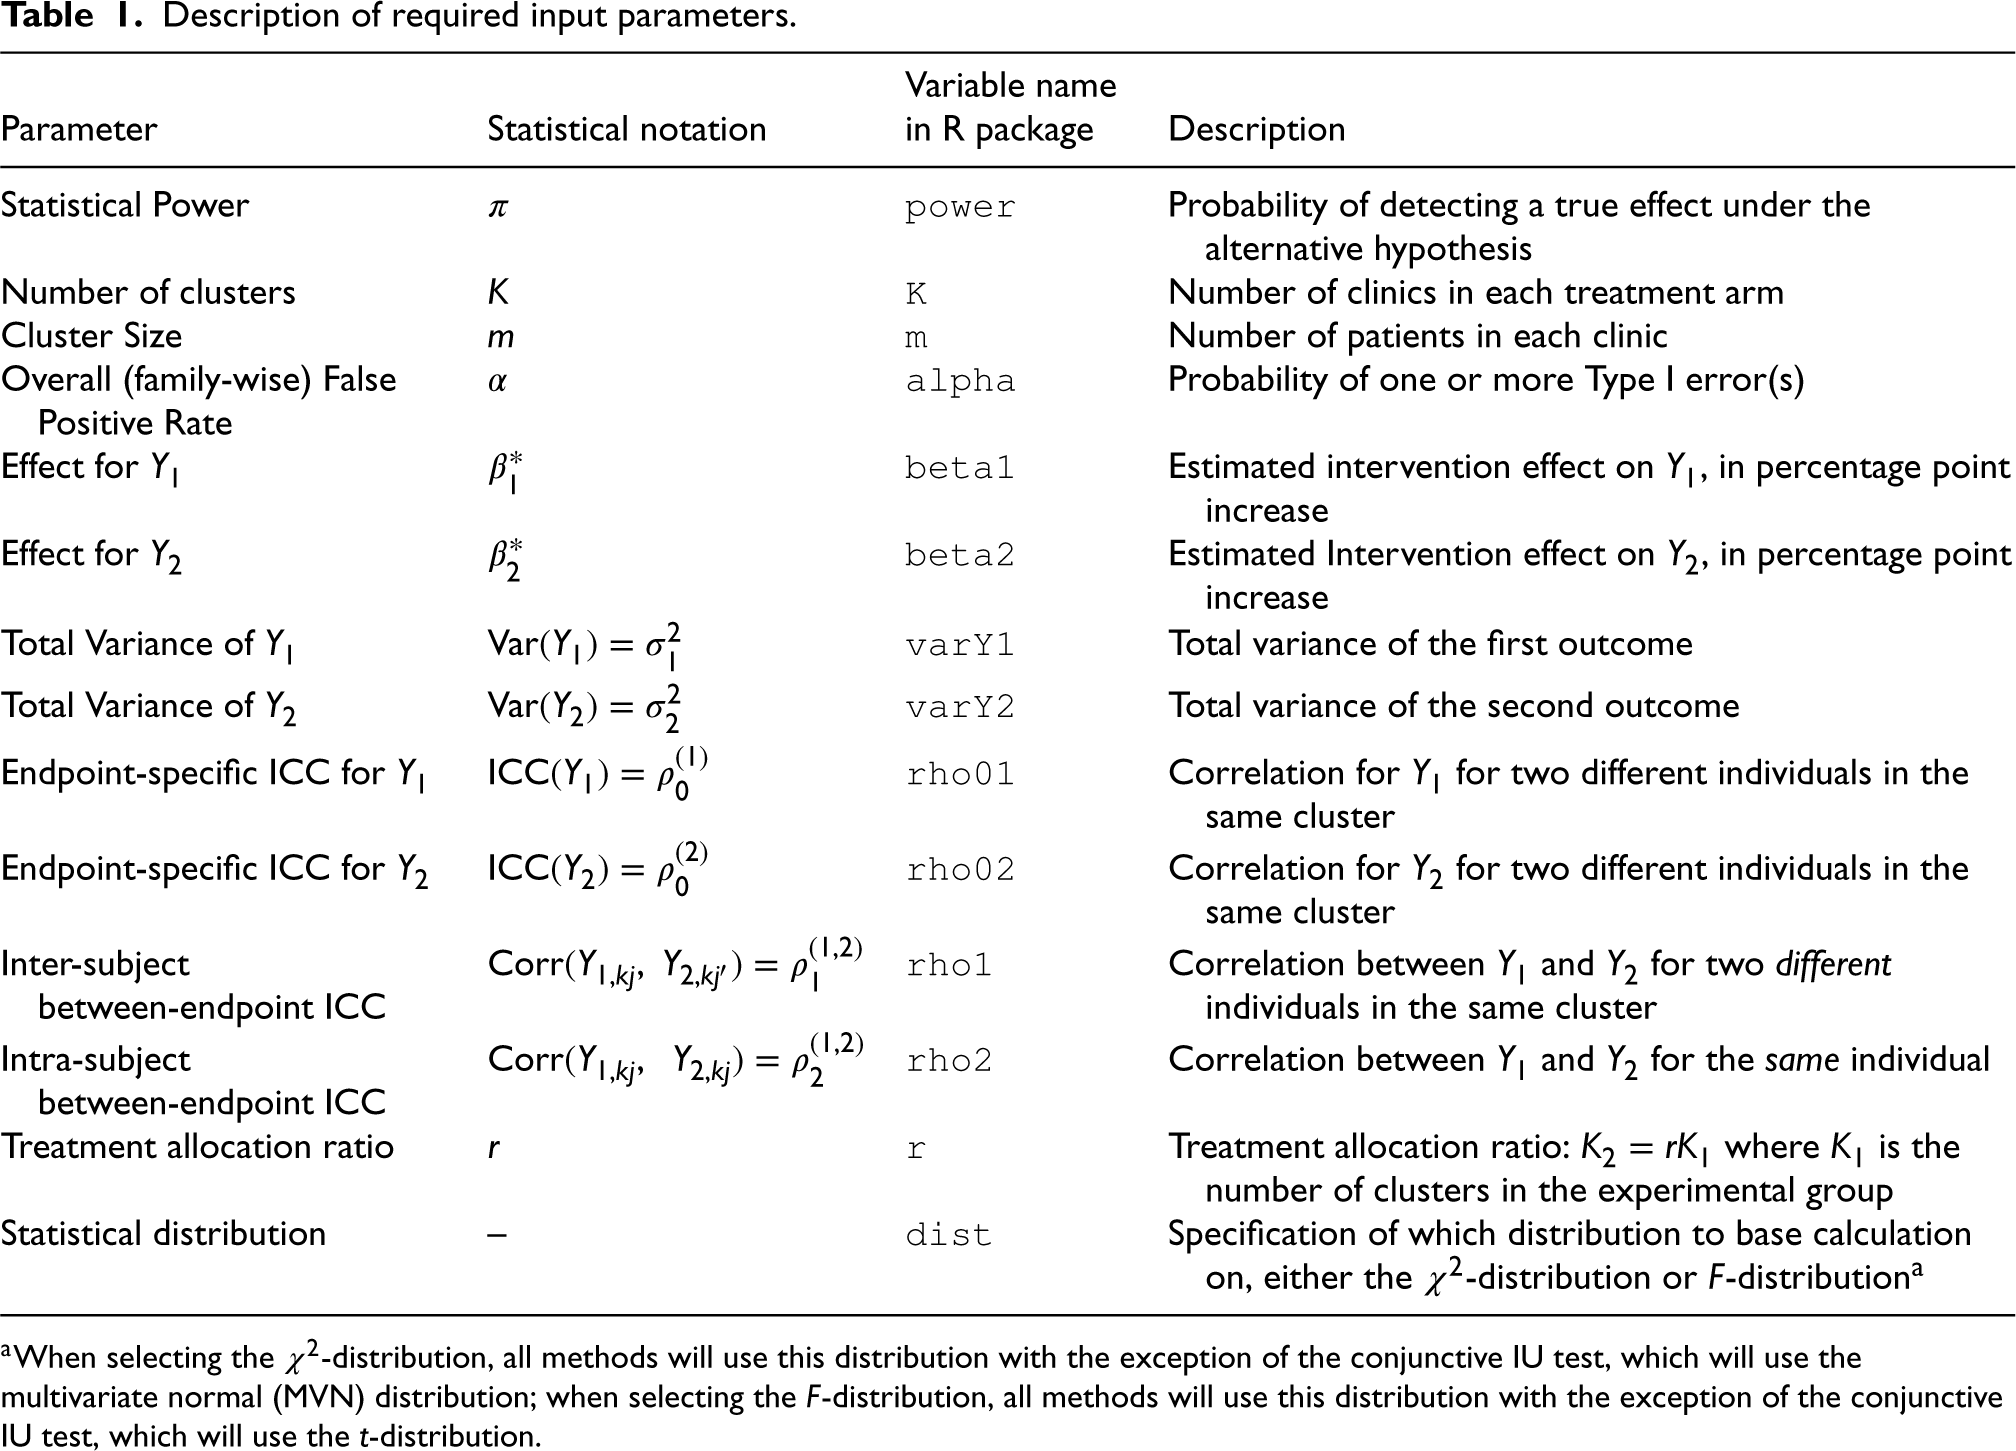
Description of required input parameters.
When selecting the χ2-distribution, all methods will use this distribution with the exception of the conjunctive IU test, which will use the multivariate normal (MVN) distribution; when selecting the F-distribution, all methods will use this distribution with the exception of the conjunctive IU test, which will use the t-distribution.
The non-centrality parameter used for power calculations is 
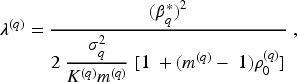
Here, we briefly describe the study design methods that are available in the
Summary of study design formulas for hybrid type 2 CRTs.
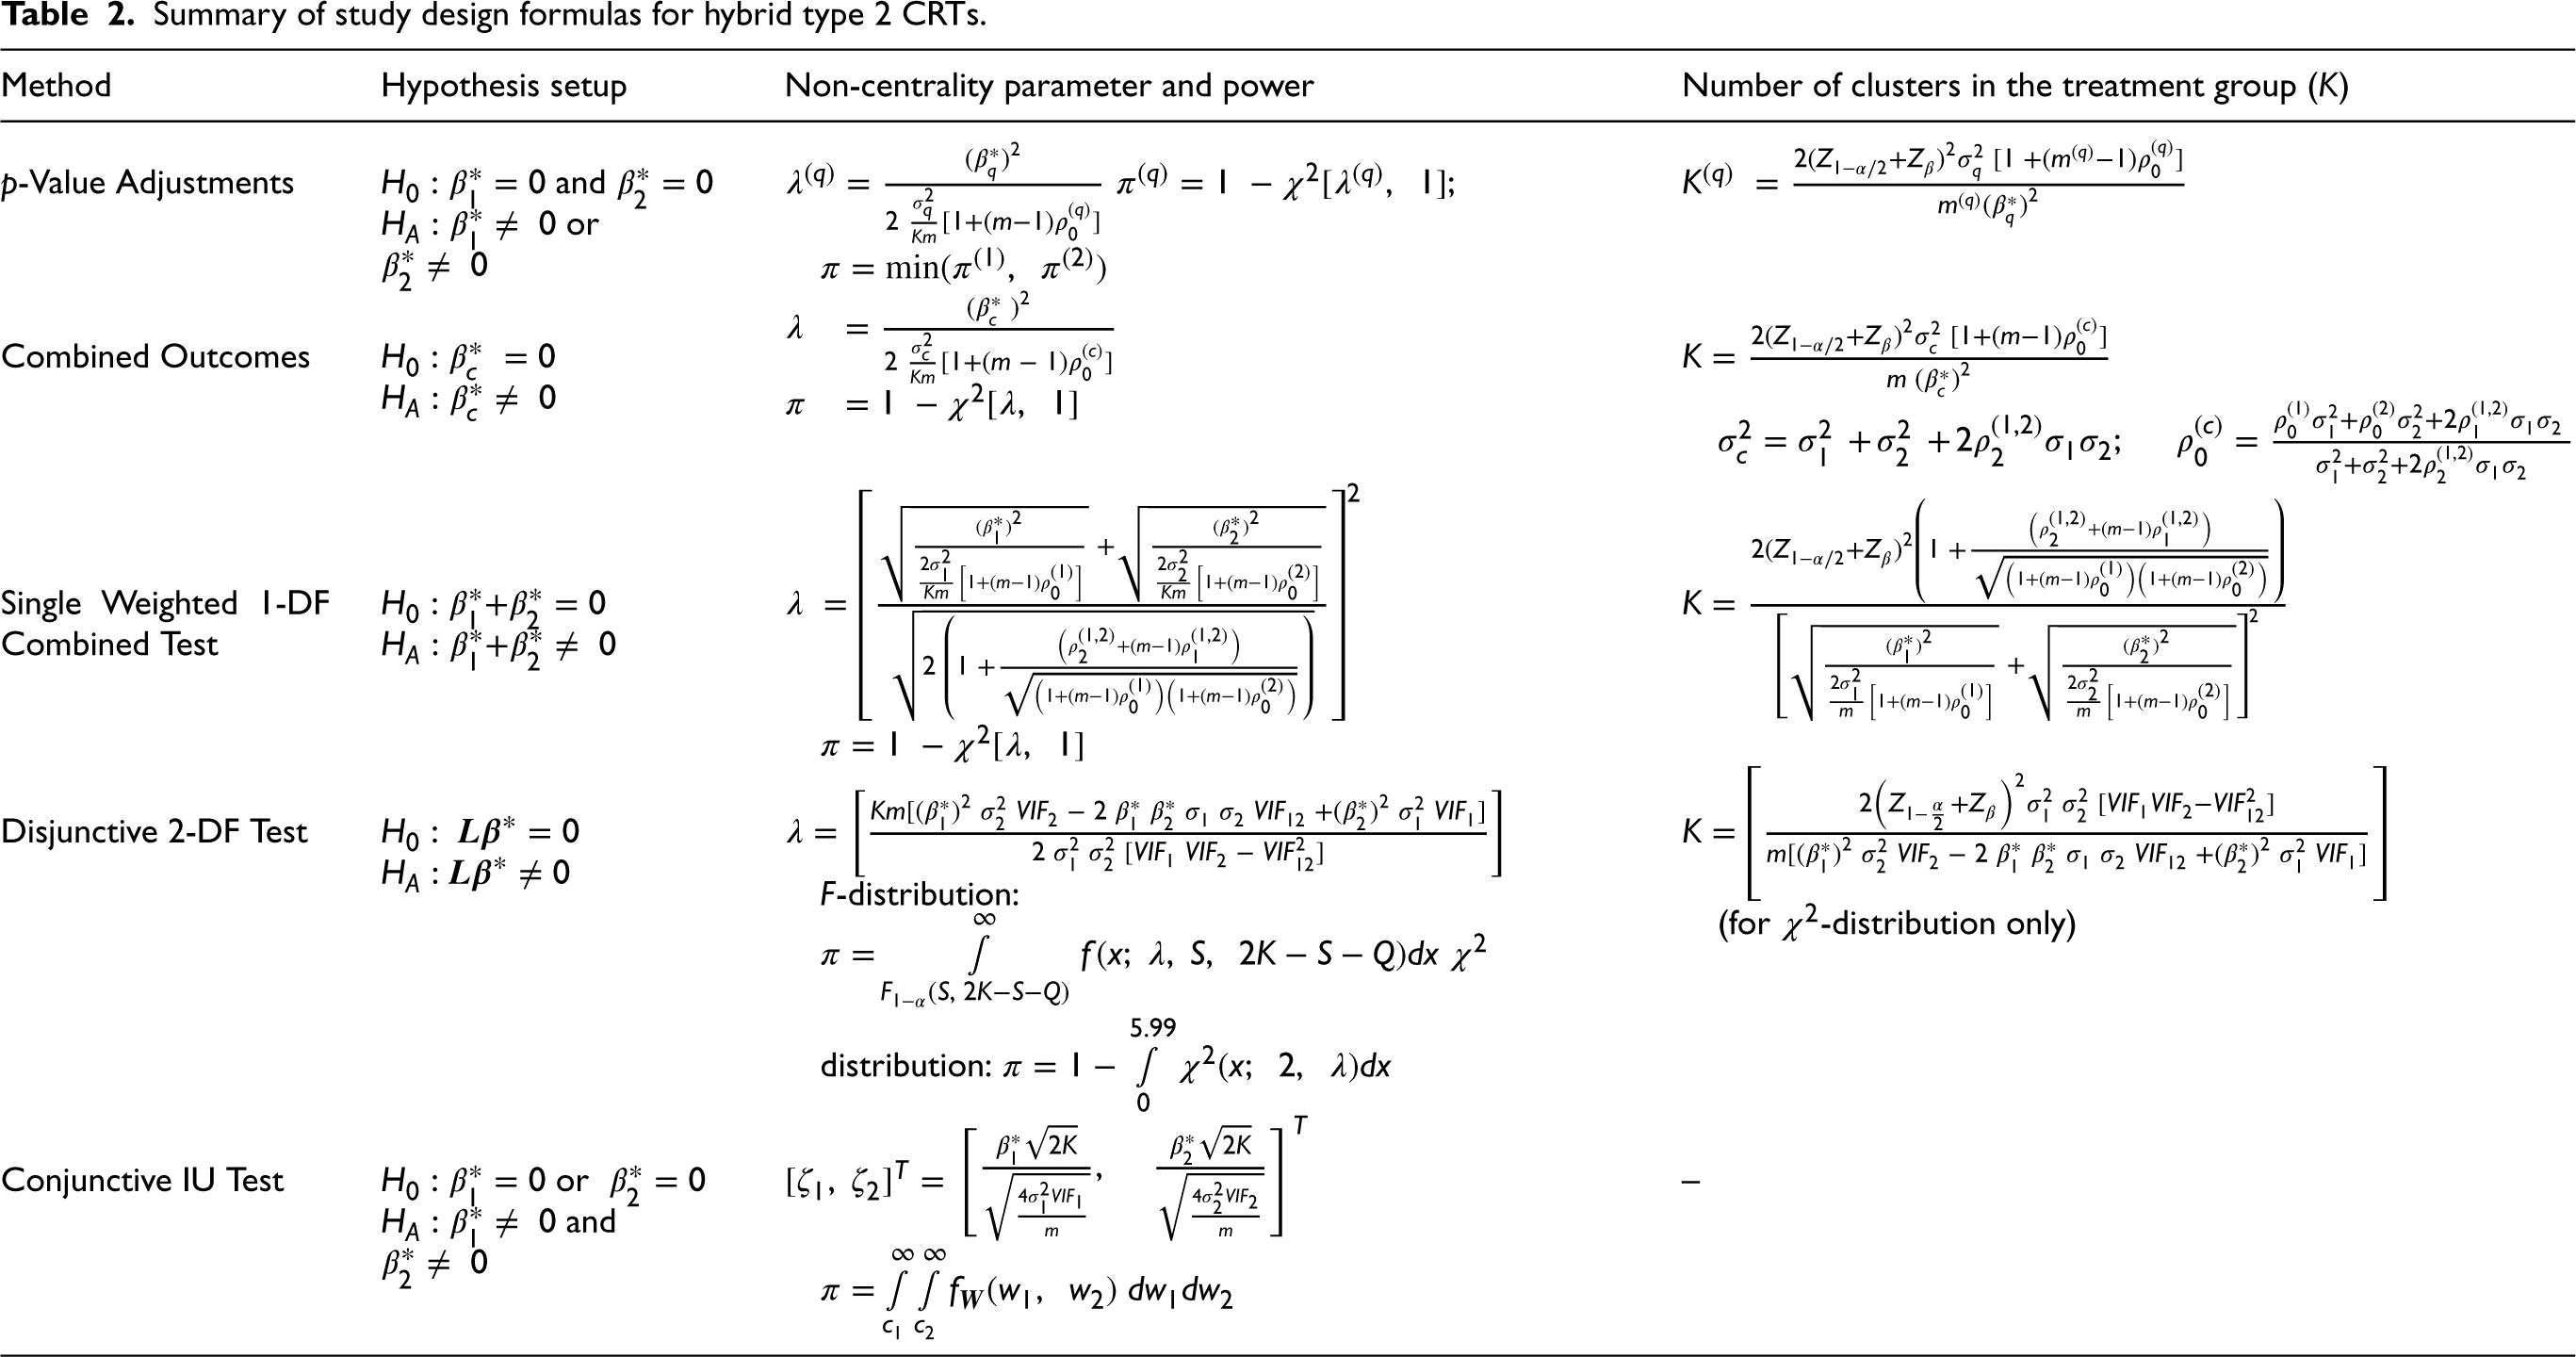
Summary of study design formulas for hybrid type 2 CRTs.
Throughout the following sections, we denote which tests utilize the disjunctive hypothesis, and which utilize a conjunctive hypothesis. For a disjunctive test, the null hypothesis is
The most popular method for addressing multiple testing is adjusting the p-value. There are three key ways to adjust for the p-value, namely the Bonferroni correction,
7
the Sidak method,
8
and the D/AP approach.
9
These p-value adjustment methods are used for a disjunctive hypothesis framework, where we have
Combined outcomes
The combined, or composite, outcomes approach combines the two outcome vectors into a single outcome.
11
A popular way of combining the outcomes is to sum them to produce 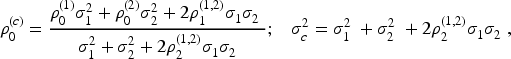
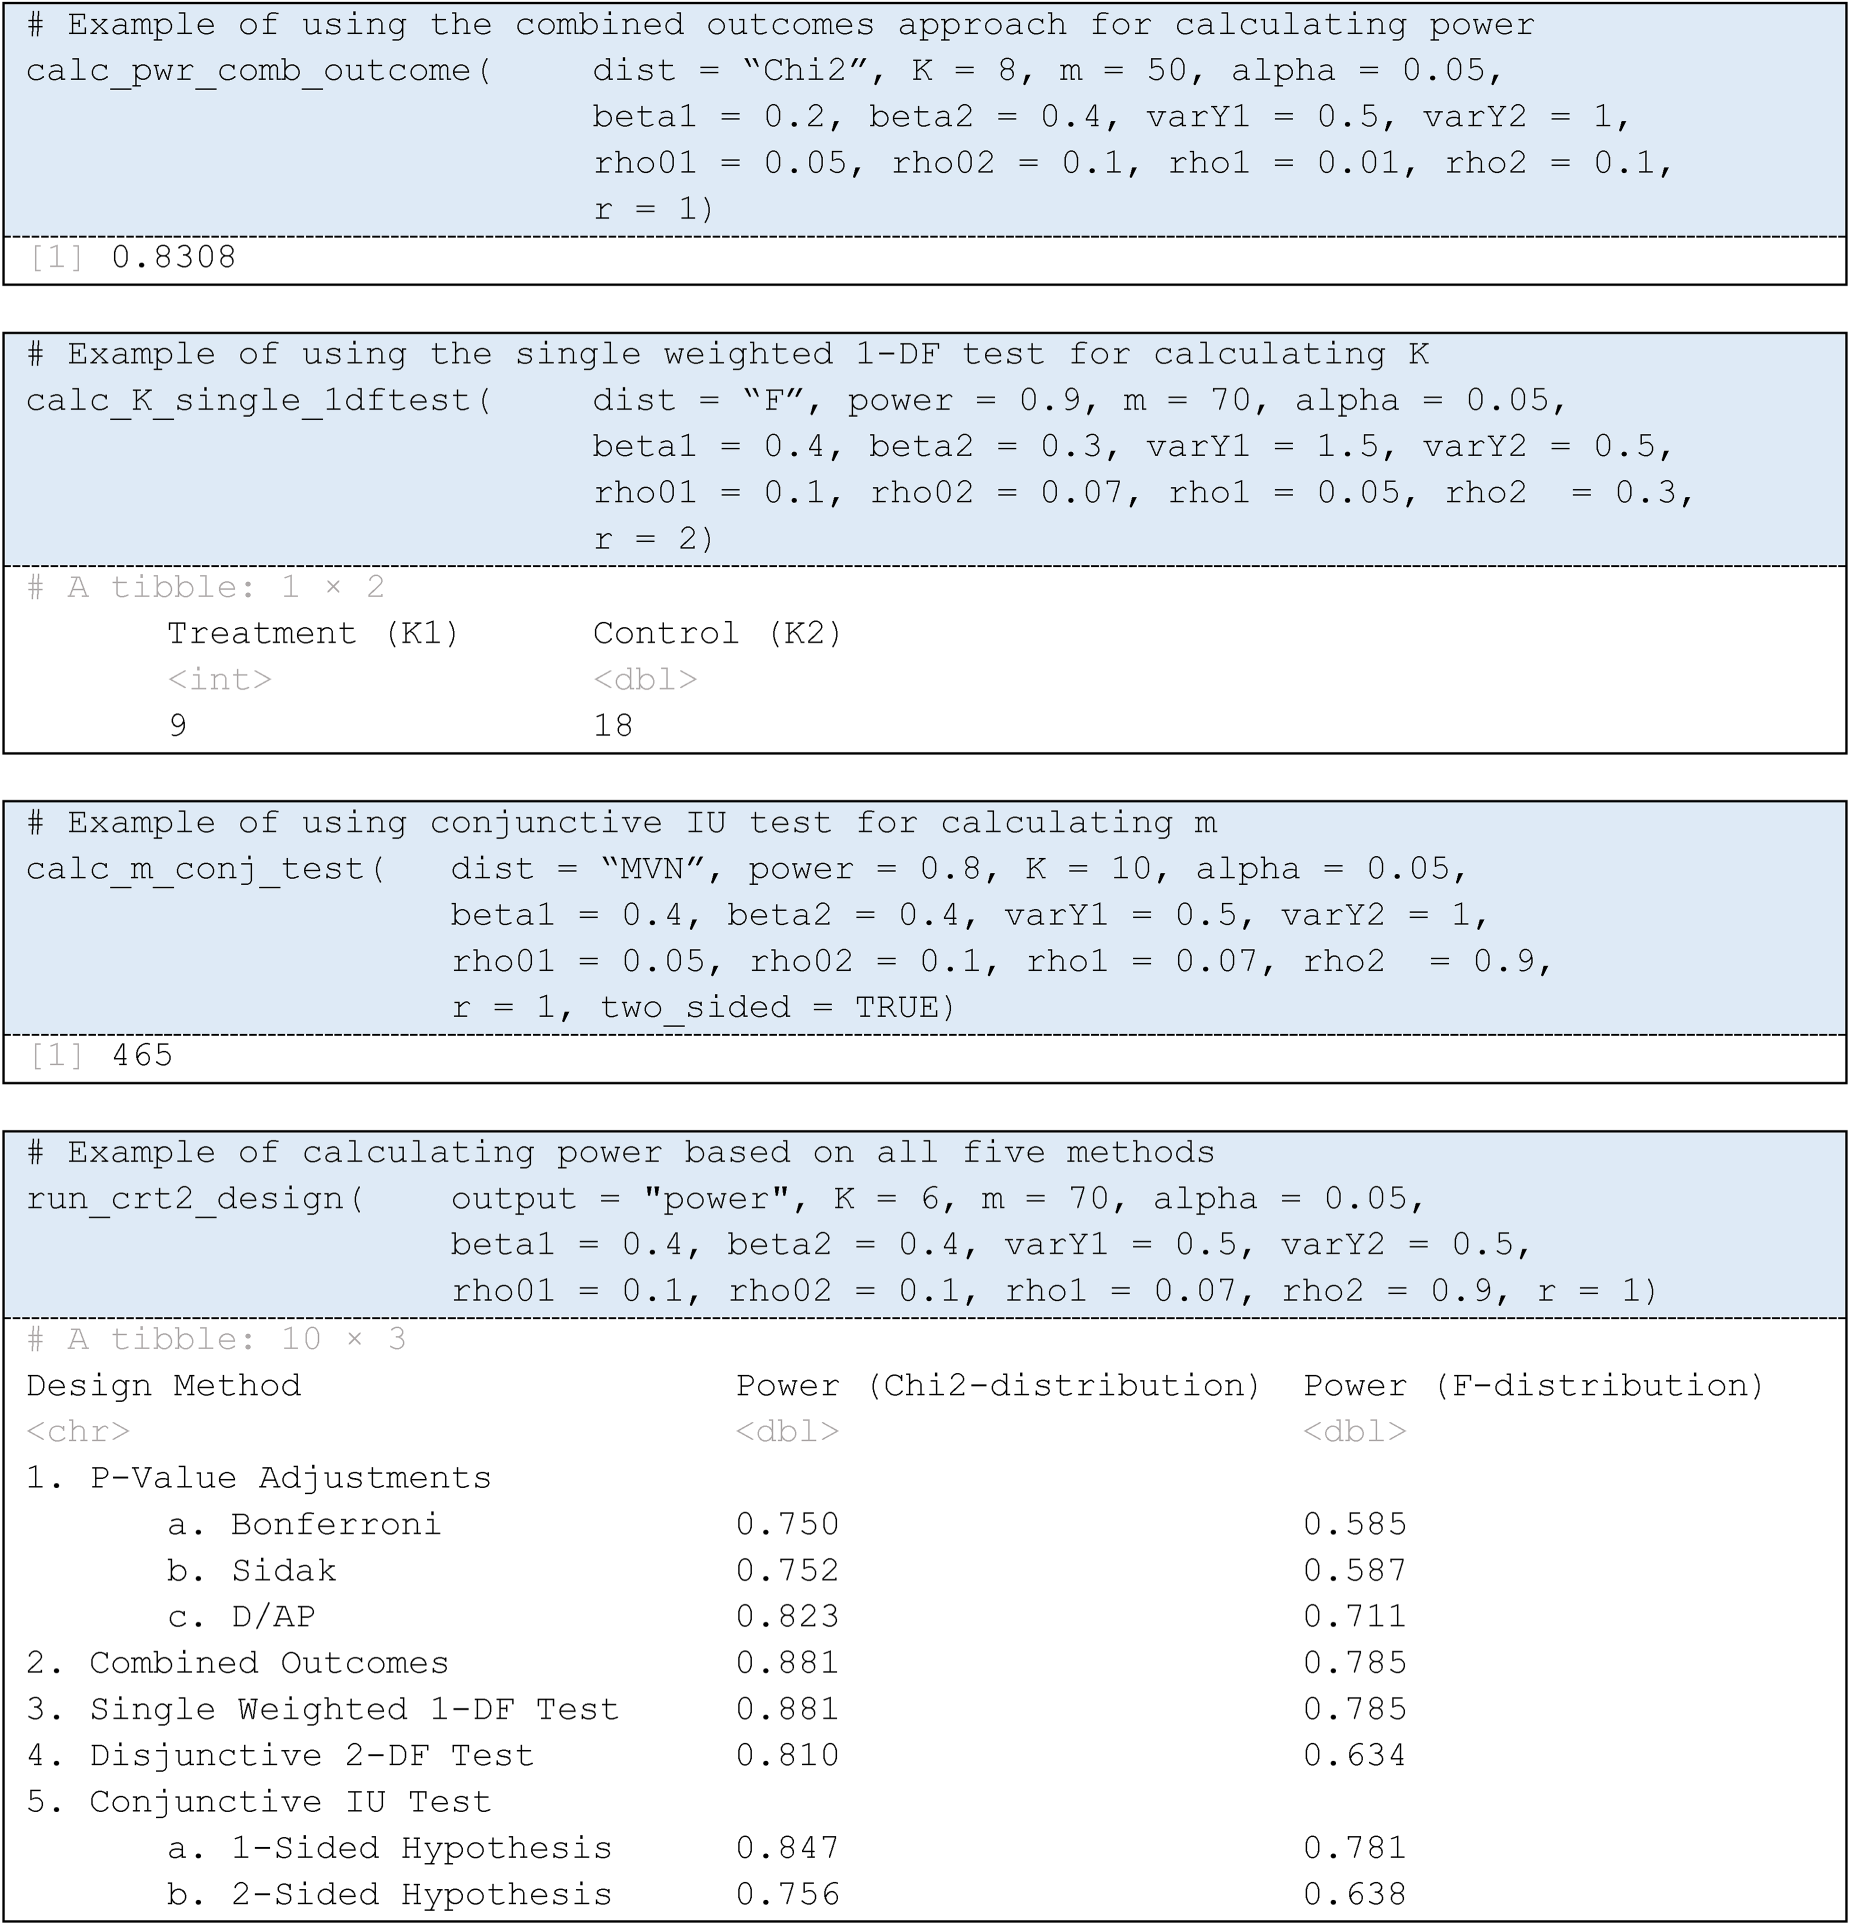
Single weighted 1-DF combined test
In this approach, two separate test statistics are weighted to create a single test statistic. Originally proposed by Pocock et al. (1987) and O’Brien et al. (1984) for the individual randomized controlled trial,12,13 this method was extended in Owen et al. to accommodate clustering.
3
Here, we are testing
Disjunctive 2-DF test
In this 2-DF test, we simultaneously test both outcomes for any departure from the null hypothesis. This test utilizes a linear hypothesis, and is written as
Conjunctive intersection–union test
The conjunctive test, or intersection–union (IU) test, requires that the treatment be effective on both outcomes in order to reject the null hypothesis. Thus, the hypothesis setup is written as
When referring to the various power, number of clusters, and cluster size parameters for each method, we use acronyms in the superscripts of these variables. Method 1: p-value adjustment methods uses the acronym “PADJ,” Method 2: combined outcomes approach uses the acronym “COMB,” Method 3: single weighted 1-DF test uses the acronym “W1DF,” Method 4: disjunctive 2-DF test uses the acronym “DIS2DF,” and Method 5: conjunctive IU test uses the acronym “CONJ.” So, for example,
Motivation and interpretation of methods
Different study goals and questions of interest can naturally lead to different hypothesis structures, and the choice of study design method depends on how evidence across outcomes will be interpreted in decision-making. When improvement in either outcome would support moving an intervention forward, a disjunctive formulation is appropriate. p-Value adjustment methods are a popular approach in practice and are often straightforward to conduct and communicate; the combined outcomes approach and single 1-DF approach summarize both outcomes into one signal, which can be useful when outcomes are measured on similar scales or when simplicity (i.e. a single test) is needed for planning. In contrast, when success with both outcomes is necessary to consider an intervention successful, a conjunctive hypothesis is appropriate, as targeted by the intersection–union test. No single method is globally preferable across different contexts. Instead, the appropriate approach depends on the scientific aims, resource constraints, measurement considerations, and the role each outcome plays in subsequent decisions. The results that follow therefore focus on illustrating how different design parameters affect the achievable power for each approach, clarifying the relative performance of different tests, and enabling researchers to select the method that best aligns with their goals in light of the power properties. These design methods, to our knowledge, are the methods one can possibly consider for this setting, and were identified through an extensive literature review in Owen et al. 3
Software description
Description of the R package and ShinyApp
The
List of crt2power functions
4
.
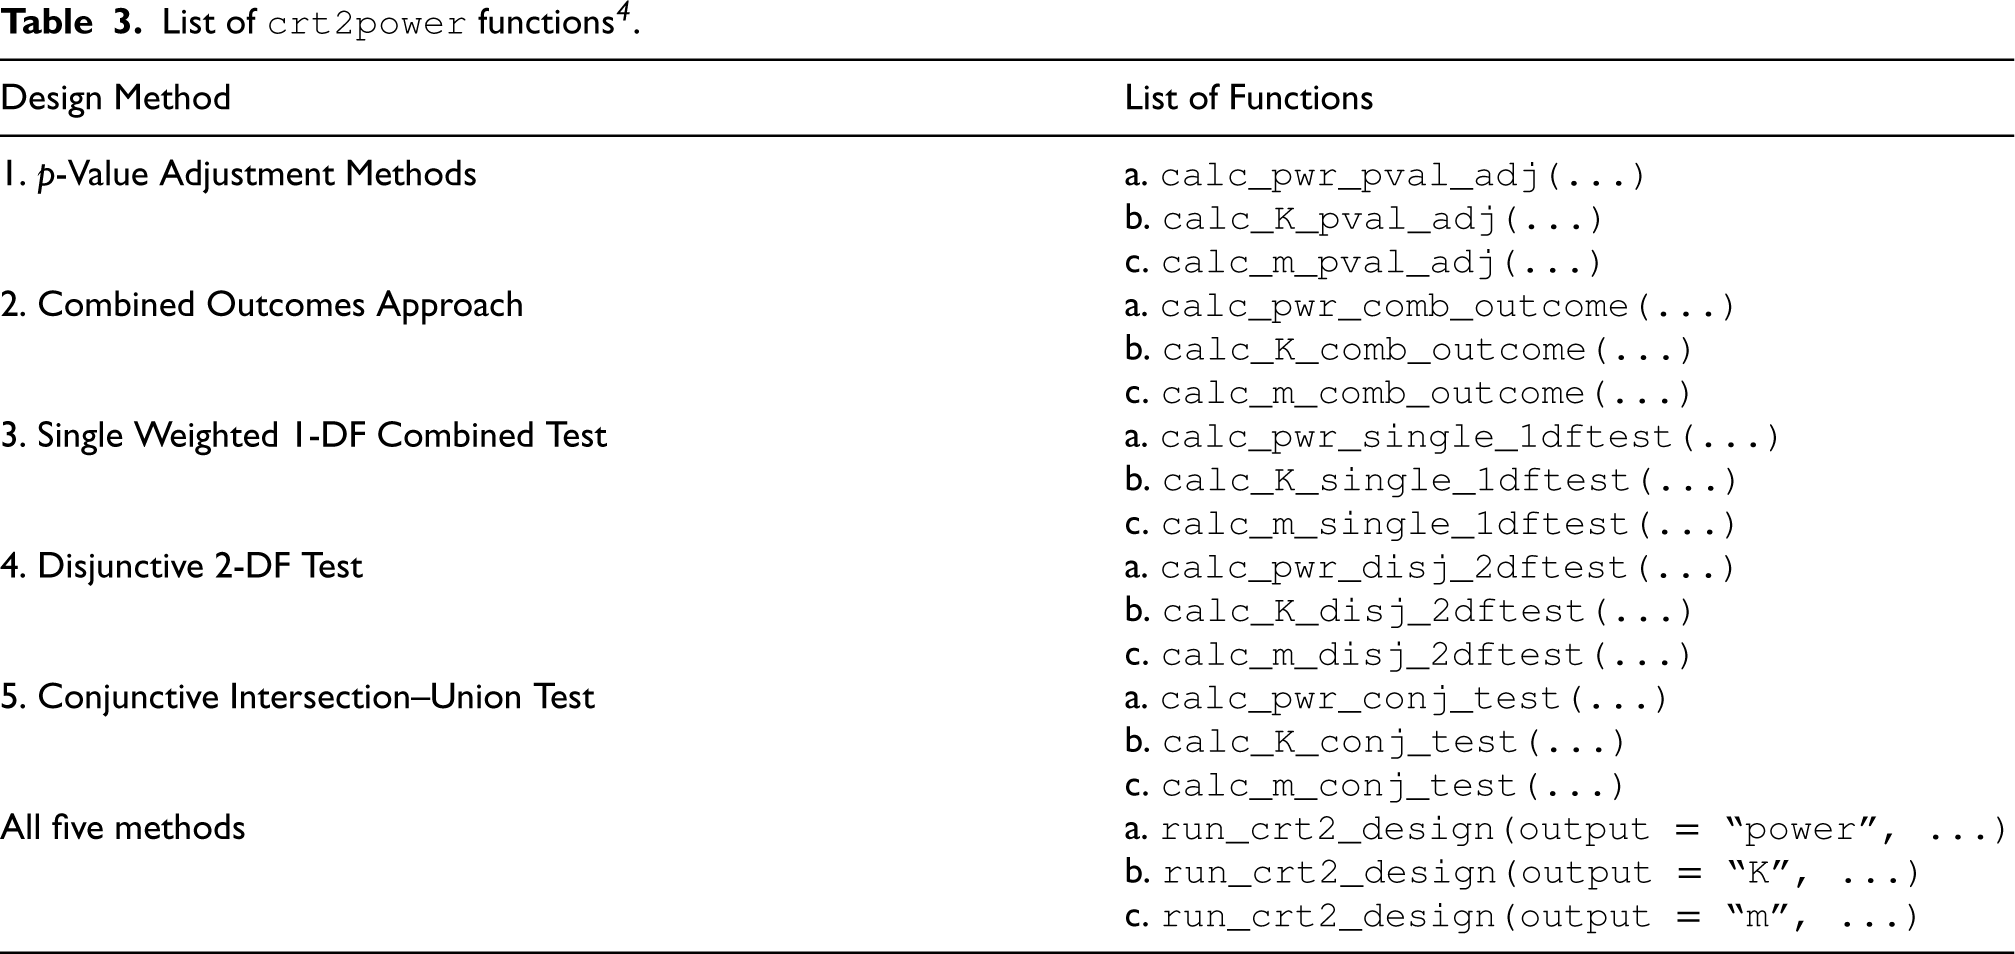
List of
In order to calculate either K, the number of clusters in the experimental group, m, the number of individuals in each cluster, or power (
ShinyApp and usage examples
Figure 1 shows R code using the crt2power for four different function calls one might conduct using this package, and Figure 2 shows the homepage and a usage example for the
Usage examples for the

Overview page of the
It is of interest to determine under which conditions some of these methods might be identical to others, if at all. This would simplify the choice of which method to use in the design phase of a hybrid type 2 CRT. In addition, it is of interest to determine if any method is globally more powerful than any other method, or if not, under which circumstances this would be the case. Thus, we conducted theoretical comparisons of the statistical power whenever possible, and when the mathematics was not tractable, we conducted a numerical analysis. The theoretical analyses, which we conducted first, helped guide the design of the numerical analysis, investigating the behavior of the design characteristics as input parameters.
In order to examine power in the theoretical analyses, we begin by comparing the equations for the non-centrality parameter for the design methods—namely,
Relationship between Methods 2, 3, and 4
Among the five study design methods, the methods that are the most similar in form are the ones that utilize a single test statistic that combines the two outcomes in some way, namely the combined outcomes approach, single weighted 1-DF test, and disjunctive 2-DF test. The p-value adjustment methods and the conjunctive test consider two test statistics—one for each outcome, and are thus different in form. For this reason, we began by first comparing the aforementioned methods to understand if any among them are equivalent under certain scenarios, or if one is globally more powerful. To compare the methods, we use the χ2-distribution.
Method 2: combined outcomes vs. Method 3: single weighted 1-DF combined test and Method 4: disjunctive 2-DF test
In Owen et al., it was found that if
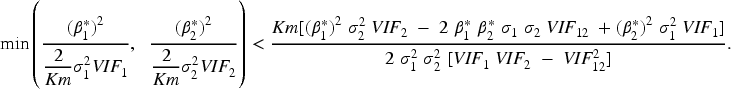
Method 3: single weighted 1-DF combined test vs. Method 4: disjunctive 2-DF test
For the single weighted 1-DF combined test and the disjunctive 2-DF test, we compared the equations for the non-centrality parameter,
Even when
Note that the equations for power can also be written in terms of their cumulative distribution functions (CDF) under the alternative. The CDF of the χ2-distribution makes use of the “Marcum Q-function,” denoted 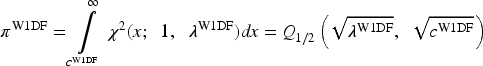
The Marcum Q-Function,
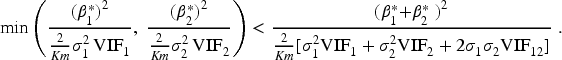
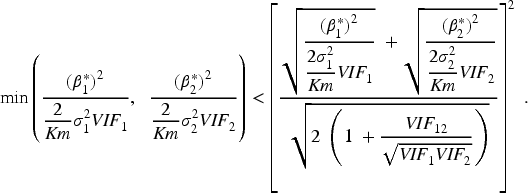
To better understand the case when 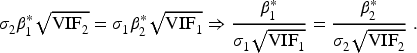
In other words, when the cluster-corrected standardized effect sizes,
We have established that when
Examination of Method 1: p-value adjustments
Based on the illustrative example shown in Owen et al., it was hypothesized that the p-value adjustment methods were less powerful than the combined outcomes test, the single weighted 1-DF test, and the disjunctive 2-DF test. 3 We compared their equations for the non-centrality parameter and statistical power to formally prove if this is the case.
For all of the p-value adjustment methods, the statistical power is
Method 1: p-value adjustments vs. Method 2: combined outcomes
We hypothesize that the non-centrality parameter for the p-value adjustment is smaller than that of the combined outcomes approach. That is,
Under the first case, we suppose that
Method 1: p-value adjustments vs. Method 3: single weighted 1-DF test
We examine the equations of the non-centrality parameters for the p-value adjustment method and single weighted 1-DF test. We aim to show:
Under the first case, we suppose that
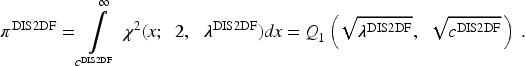
Method 1: p-value adjustments vs. Method 4: Disjunctive 2-DF Test
Examining the equations of the non-centrality parameters for the p-value adjustment method and disjunctive 2-DF test, we aim to show:
Under the first case, we suppose that
We compare both tests using the χ2-distribution, and note that the disjunctive test uses 2-DF instead of 1-DF. Due to the differing degrees-of-freedom, 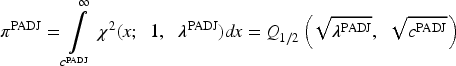

As previously noted, the Marcum Q-Function,
Summary of theoretical comparisons
The reason for why the p-value adjustment methods are globally less powerful than the combined outcomes approach and the single weighted 1-DF test can be intuitively understood through the property of the arithmetic mean. It states that for any two real numbers, a and b, it is always the case that
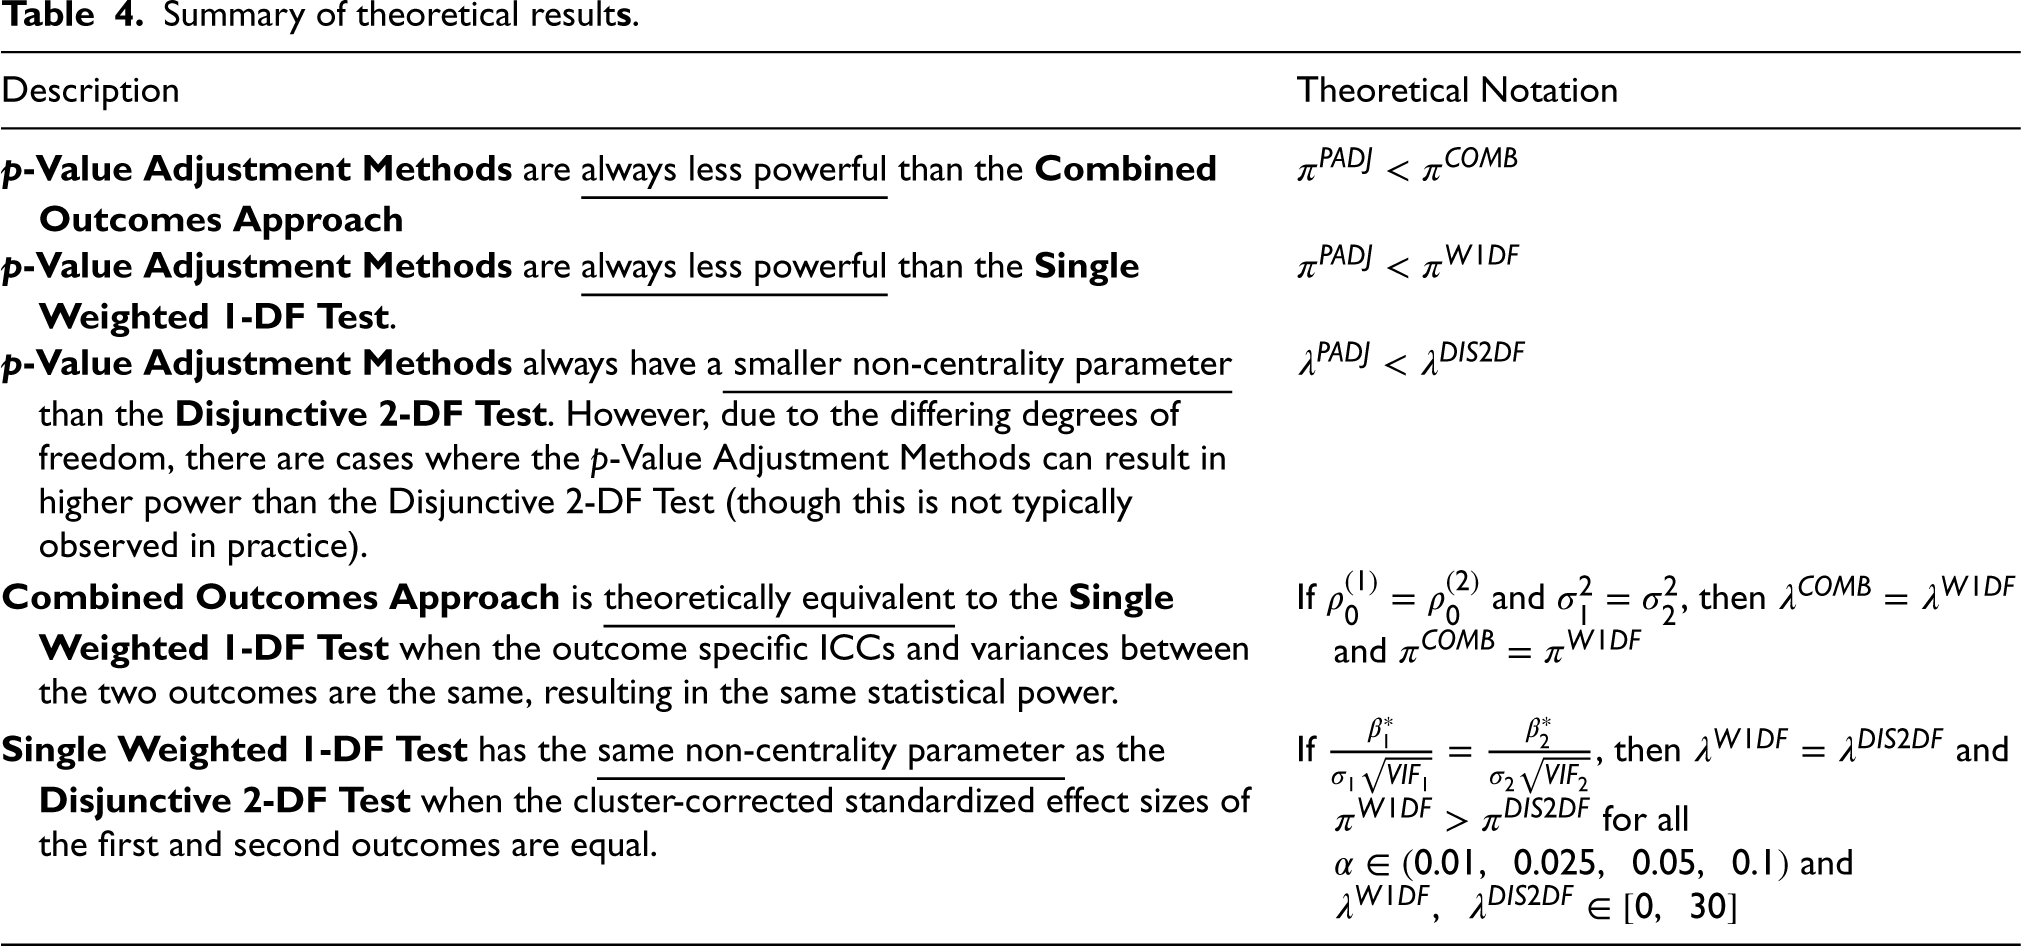
To summarize, we’ve shown that the p-value adjustment methods are globally less powerful than the combined outcomes approach and the single weighted 1-DF test, and that the p-value adjustment methods have a globally smaller non-centrality parameter than the disjunctive 2-DF test, but that it is still theoretically possible for the disjunctive 2-DF test to have a smaller power than the p-value adjustment methods. We’ve also shown that the combined outcomes approach is equivalent to the single weighted 1-DF test when the outcome specific ICCs and variances between the two outcomes are the same. Lastly, we’ve shown that the single weighted 1-DF test has the same non-centrality parameter as the disjunctive test when the cluster-corrected standardized effect sizes of the outcomes are equal. In this case, the single weighted 1-DF test will yield more power than the disjunctive 2-DF test. Table 4 shows a summary of these theoretical comparison findings along with the theoretical notation. To more thoroughly examine the performance of the study design methods, we continue on to the numerical evaluation.
Summary of theoretical results .
Summary of theoretical result
Overview and estimands
In the numerical evaluation, we explore the comparison of different testing procedures in terms of power under (a) varying cluster sizes and number of clusters; (b) varying values of the four correlations, namely the endpoint-specific ICC's, inter-subject between-endpoint ICC, and the intra-subject between-endpoint ICC; (c) varying values of the treatment effects on each outcome; and (d) varying values for the total variance of the two outcomes on study design. The goal of the evaluation was to identify which method of the five currently available for hybrid type 2 studies, if any, is globally the most powerful? If none are globally most powerful (which we hypothesize to be the case), under what design assumptions are each of the methods are most powerful? The numerical evaluation was needed because it was not possible to derive fully comprehensive theoretical answers to these questions, particularly for the conjunctive IU test and how it compares to the other methods. The code used to run the numerical evaluation is available on GitHub at https://github.com/melodyaowen/hybrid2numerical. Note that because exact expressions for all quantities of interest are available, there is no need for a simulation study. We discuss this point in greater detail later on.
Methods
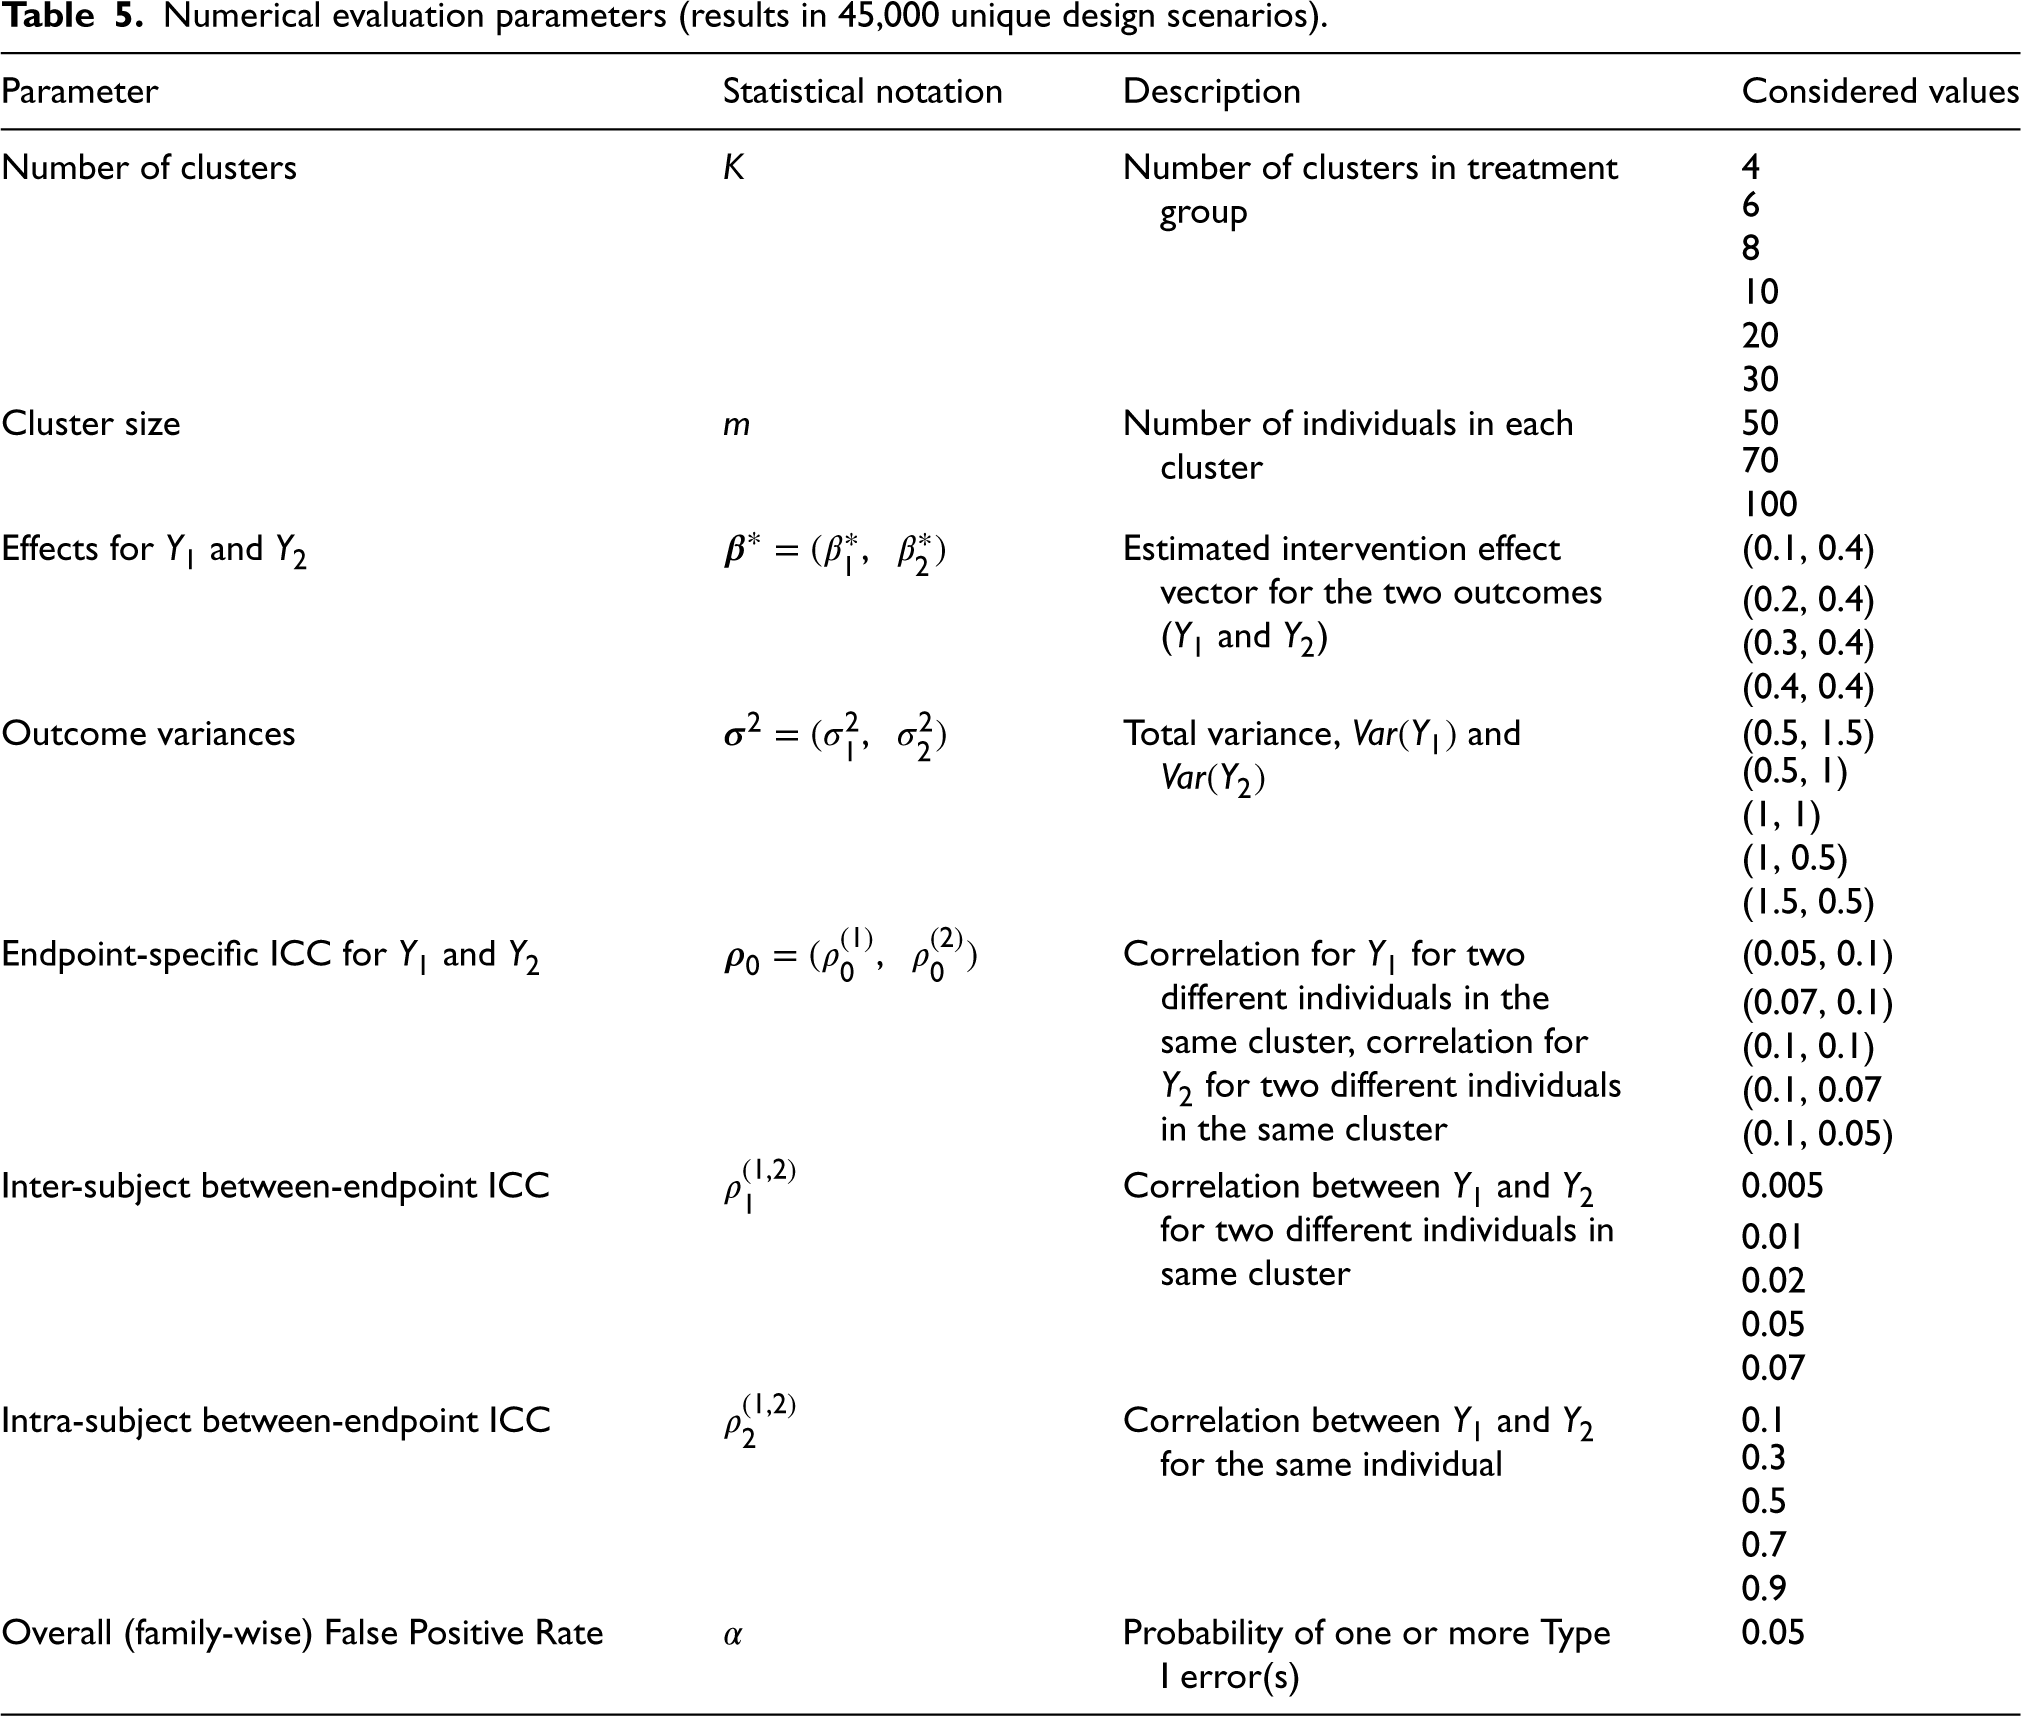
The parameters that are varied in the numerical evaluation, along with their values, are displayed in Table 5. Values of each parameter were chosen based on values commonly observed in real CRT data, and to ensure that a wide range of values were considered for each input parameter. We explored treatment effect scenarios where either
Numerical evaluation parameters (results in 45,000 unique design scenarios).
Numerical evaluation parameters (results in 45,000 unique design scenarios).
The number of clusters in each treatment group (
The numerical evaluation was conducted using R/RStudio. First, a data frame of every potential design scenario using all combinations of the inputs displayed in Table 5 was created. Here, a study design “scenario” refers to a unique set of the 10 input parameters that one could use to calculate statistical power. There were a total of 45,000 such input scenarios. For each scenario, the statistical power was calculated using each of the study design methods described in Section 2. The resulting power calculations were assessed in relation to each input parameter, and trends were summarized through figures and tables.
Four separate numerical analyses were conducted, which we refer to as Comparison I, Comparison II, Comparison III, and Comparison IV. The motivation for conducting four separate comparisons was because different probability distributions have been proposed to assess power for different tests. In particular, the disjunctive 2-DF test was derived using the F-distribution, but one can also use the χ2-distribution for this method. The p-value adjustment methods, combined outcomes approach, and single weighted 1-DF test can also either utilize the F-distribution or χ2-distribution, and all of these methods use a 2-sided test. The conjunctive IU test differs from the other tests because it is multivariate in nature, where a vector of test statistics is used (one for each outcome). It was originally derived using a multivariate t-distribution, but one can also use a MVN distribution. It is not feasible for this method to utilize a χ2-distribution or F-distribution because it is multivariate in nature, and there is no multivariate F or χ2-distribution. It is valid to compare the conjunctive IU test under a two-tailed MVN-distribution to the remaining methods under the χ2-distribution, and to compare the conjunctive IU test under the t-distribution to the remaining methods under the F-distribution. Furthermore, the conjunctive IU test as proposed conducts two 1-sided tests (one for each outcome), but to make this method comparable to the other methods, which are all 2-sided, we consider the conjunctive IU test with two 2-sided tests. On the other hand, recognizing that users may want to understand how the conjunctive IU test compares to the other methods when used as originally proposed (i.e. using two 1-sided tests), we also looked at this case. Thus, this results in four main comparisons—Comparison I: 2-sided method comparison using the F-distribution for Methods 1–4 and the two-sided t-distribution for Method 5; Comparison II: 2-sided method comparison using the χ2-distribution for Methods 1–4 and the two-sided MVN-distribution for Method 5; Comparison III: “as is” method comparison using the F-distribution for Methods 1–4 and the one-sided t-distribution for Method 5; and Comparison IV: “as is” method comparison using the χ2-distribution for Methods 1–4 and the one-sided MVN-distribution for Method 5. Table 6 summarizes these comparisons.
Summary of numerical analysis comparisons.
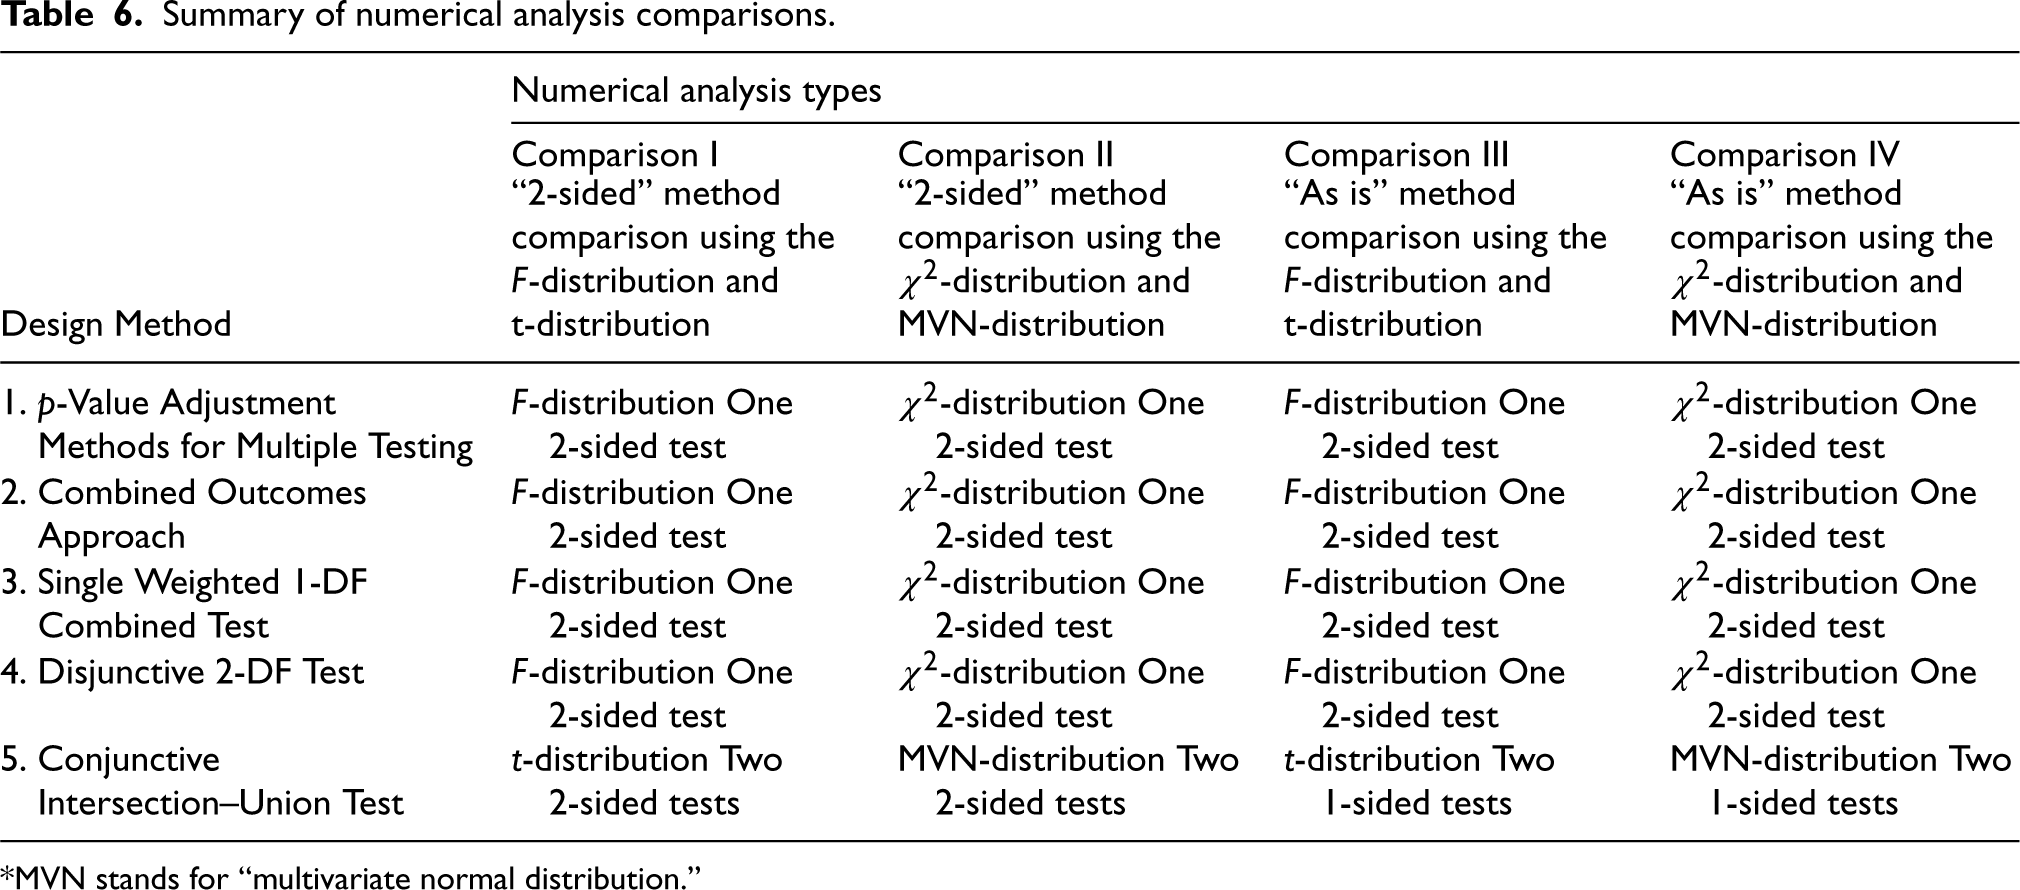
*MVN stands for “multivariate normal distribution.”
Next, we discuss the results of the numerical evaluation under Comparison I in depth. Though we do not display the results for Comparisons II–IV, we outline any key findings or differences in results that were found. We provide the corresponding figures and tables for Comparisons II–IV in the Supplementary Material.
Distribution of statistical power and overall method rankings
To gain an overall understanding of the statistical power yielded by each method across the 45,000 input scenarios, the distribution of power was examined, averaged over the 10 input parameters varied. Figure 3 displays histograms of statistical power for each method, along with the mean, minimum, and maximum power for each method. The three p-value adjustment methods tended to have lower power compared to the other methods, and the conjunctive test similarly had lower power generally. The combined outcomes approach, single 1-DF test, and disjunctive 2-DF test tended to have higher power among the methods. The ranking of the methods in terms of power was examined in order to better understand overall how the methods compared to one another. For each of the 45,000 input scenarios, each method was ranked 1 through 7; a method with a ranking of 1 means the method had the highest power, while a method with a ranking of 7 means the method had the lowest power. Figure 4 shows a heatmap of these rankings across scenarios—a darker color blue corresponds to a lower ranking (lower power), and a lighter color blue corresponds to a higher ranking (higher power). Included in this figure is a summary table with each of the method's mean ranking. The single weighted 1-DF test had a mean ranking of 1.61, while the disjunctive 2-DF test had a mean ranking of 2.06. The combined outcomes approach had a mean ranking of 2.13, while the conjunctive test had a mean ranking of 4.36. The p-value adjustment methods had the lowest mean rankings, with the Bonferroni method having the lowest mean ranking (6.93). These results give an overview of how the methods measure up against each other in terms of statistical power, but they also demonstrate that no method was globally better than all other methods. Next, we more closely examine trends for how each of the input design parameters affect the statistical power.
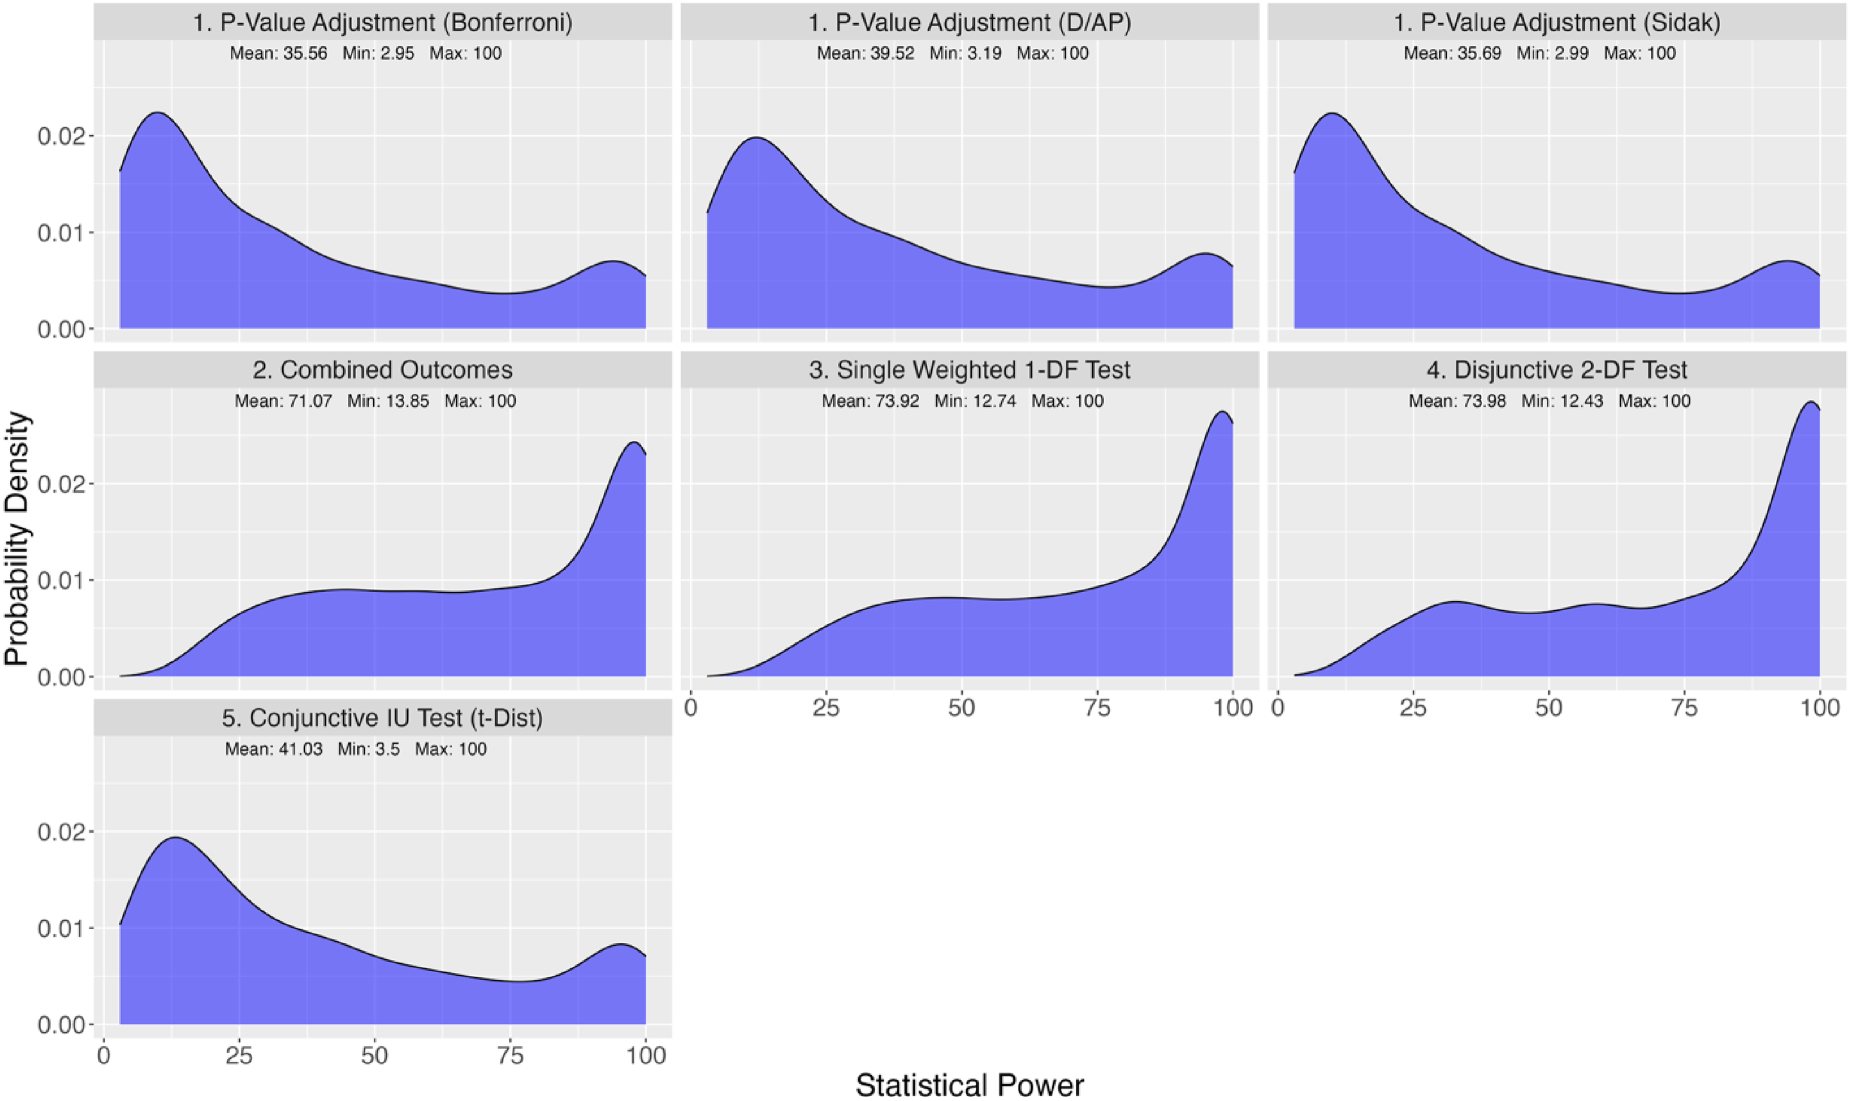
Distribution of statistical power for each design method among all 45,000 input scenarios for comparison I (F and t distributions with 2-sided conjunctive test).
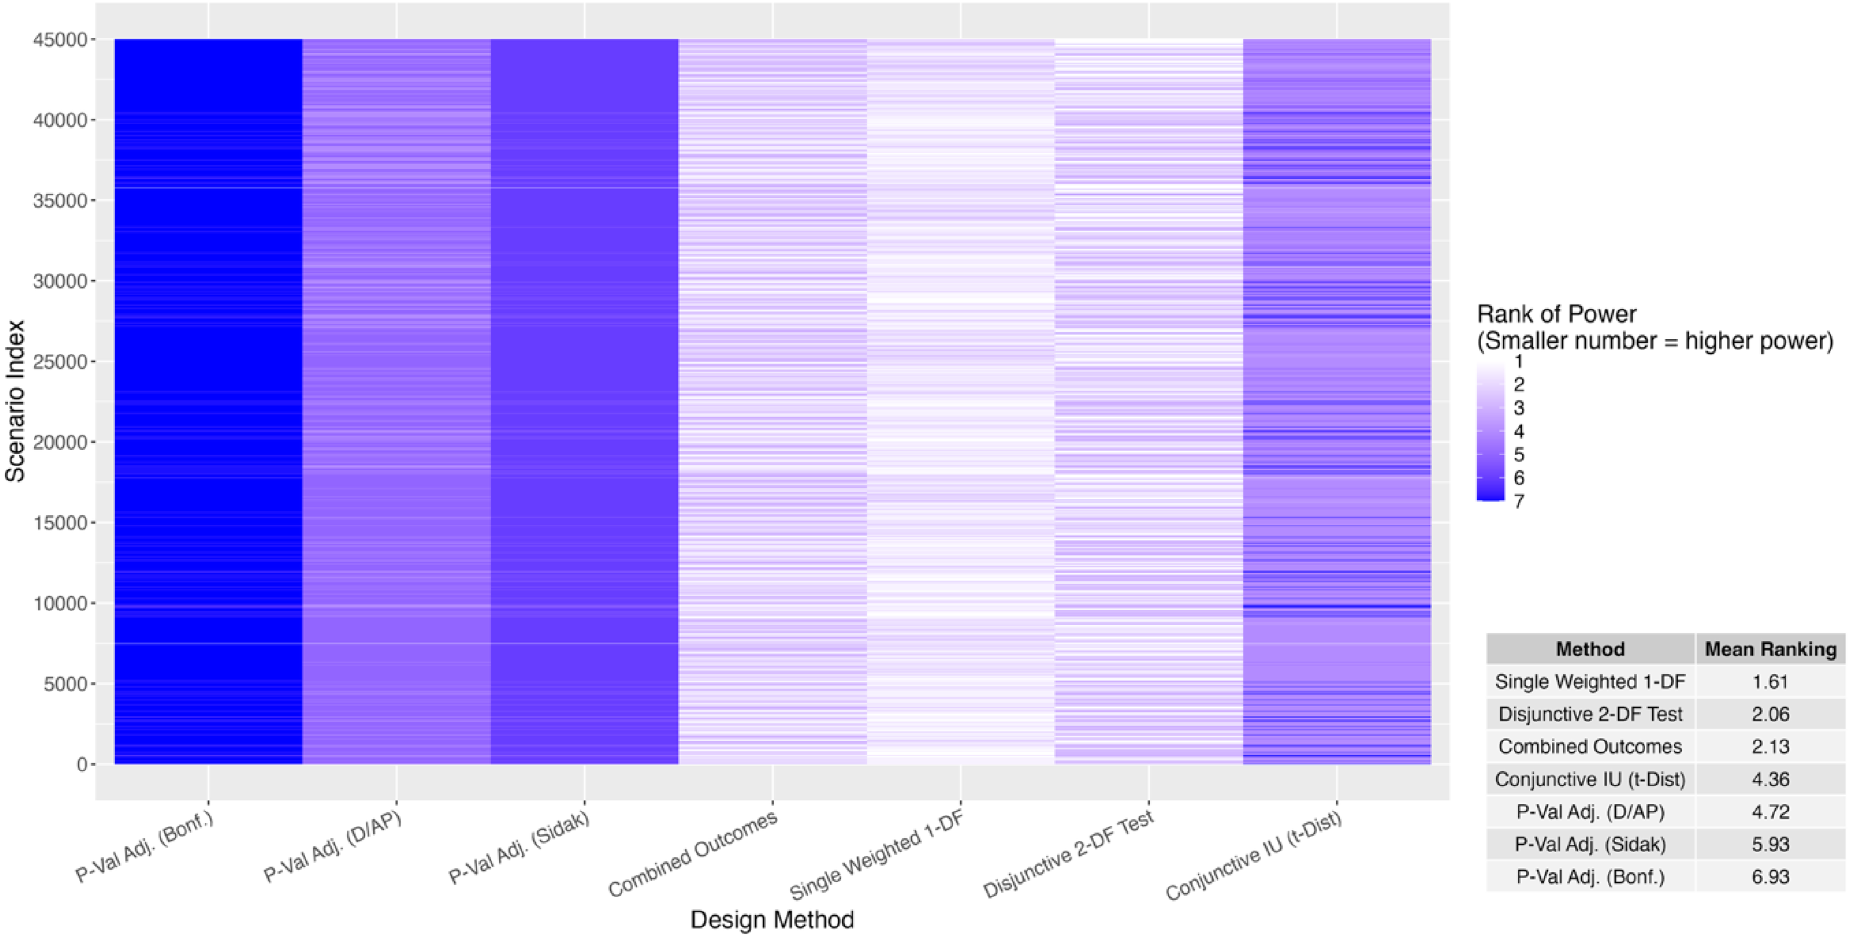
Ranks of all study design methods for each of the 45,000 input scenarios for comparison I (F and t distributions with 2-sided conjunctive test).
Before evaluating the numerical study results further, we conducted an additional evaluation that examined how each input parameter individually impacts power when allowed to vary over a larger set of values than what was feasible in the numerical evaluation, holding all other input parameters constant. This step was helpful in guiding which aspects of the numerical evaluation to report on. Values for the parameters that did not vary were chosen from the numerical evaluation parameters, and fixed at
As expected, it was found that as the number of clusters increases (
For m, the ranking of which method is the most powerful, second most powerful, etc. does not differ as m increases. As the ratio of the treatment effects (
When is each method most powerful?
When examining the statistical power through the numerical analysis of the five study design methods among the 45,000 input scenarios, we narrowed our scope to look the design methods that had at least one scenario where it was the most powerful among all the methods. Among those methods, we examined the conditions of
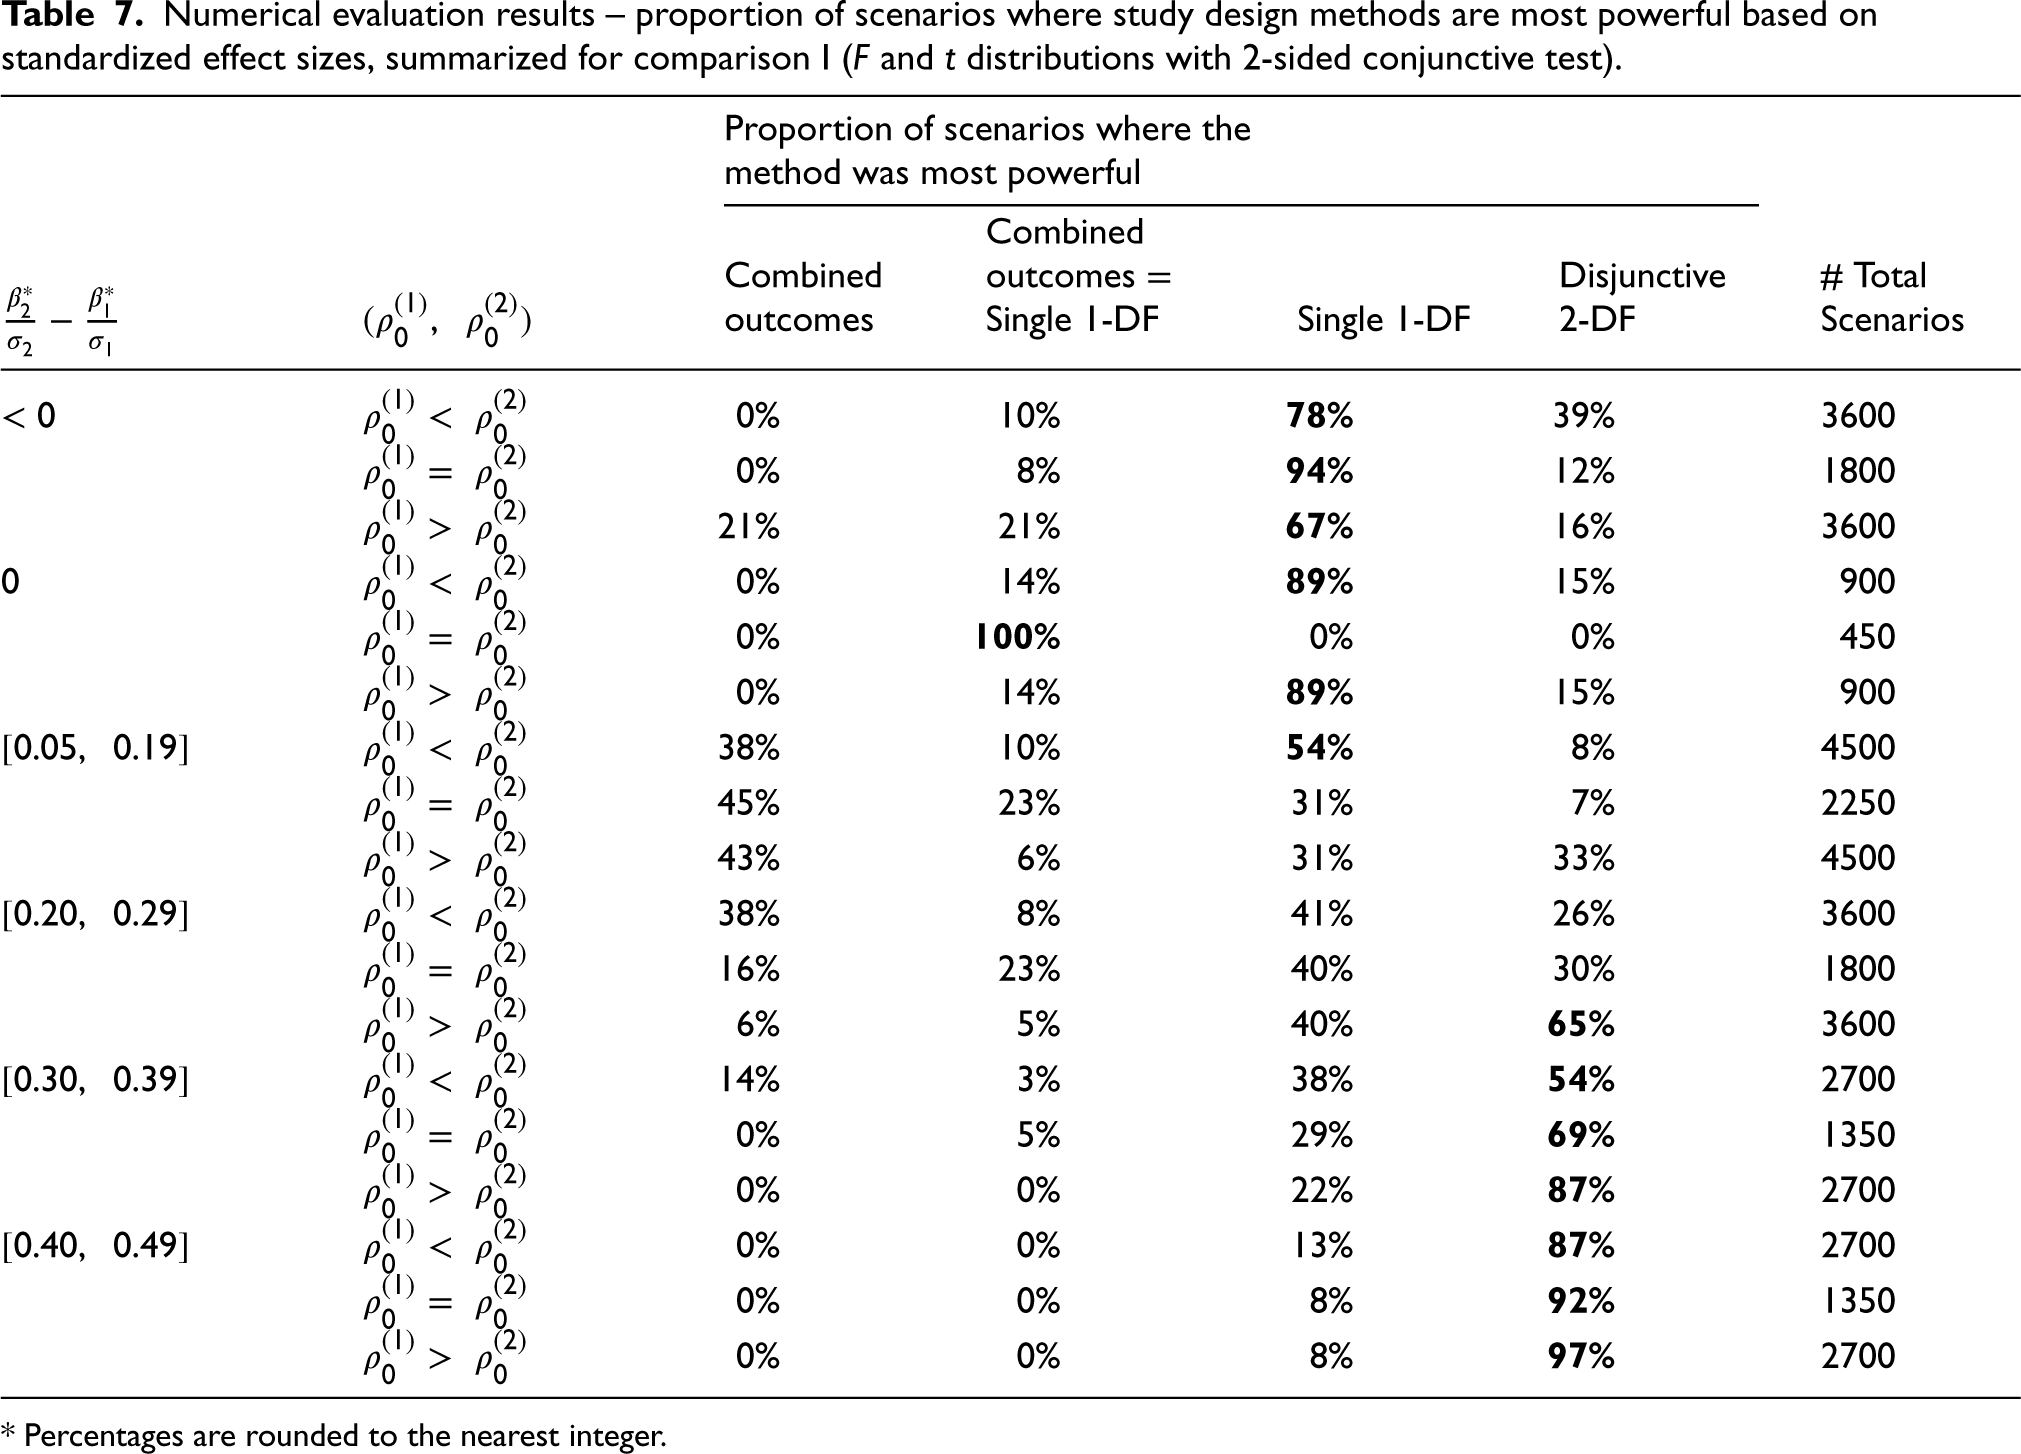
Under Comparison I, the combined outcomes approach, single weighted 1-DF test, and disjunctive 2-DF test all had scenarios in which they yielded the highest power, whereas the p-value adjustment methods and conjunctive IU test were never observed to have the highest power. To discern under which conditions these three methods were the most powerful relative to one another, we calculated the frequency each method had the highest power under different scenarios in terms of the standardized effect sizes (
Numerical evaluation results – proportion of scenarios where study design methods are most powerful based on standardized effect sizes, summarized for comparison I (F and t distributions with 2-sided conjunctive test).
Numerical evaluation results – proportion of scenarios where study design methods are most powerful based on standardized effect sizes, summarized for comparison I (F and t distributions with 2-sided conjunctive test).
* Percentages are rounded to the nearest integer.
Based on these results, we see that there are many cases for which the single weighted 1-DF test had the most power out of all the methods more than 80% of the time. In particular, when
Summary of trends for highest statistical power from numerical evaluation based on standardized and unstandardized effect sizes for Comparison I (F and t distributions with 2-sided conjunctive test).
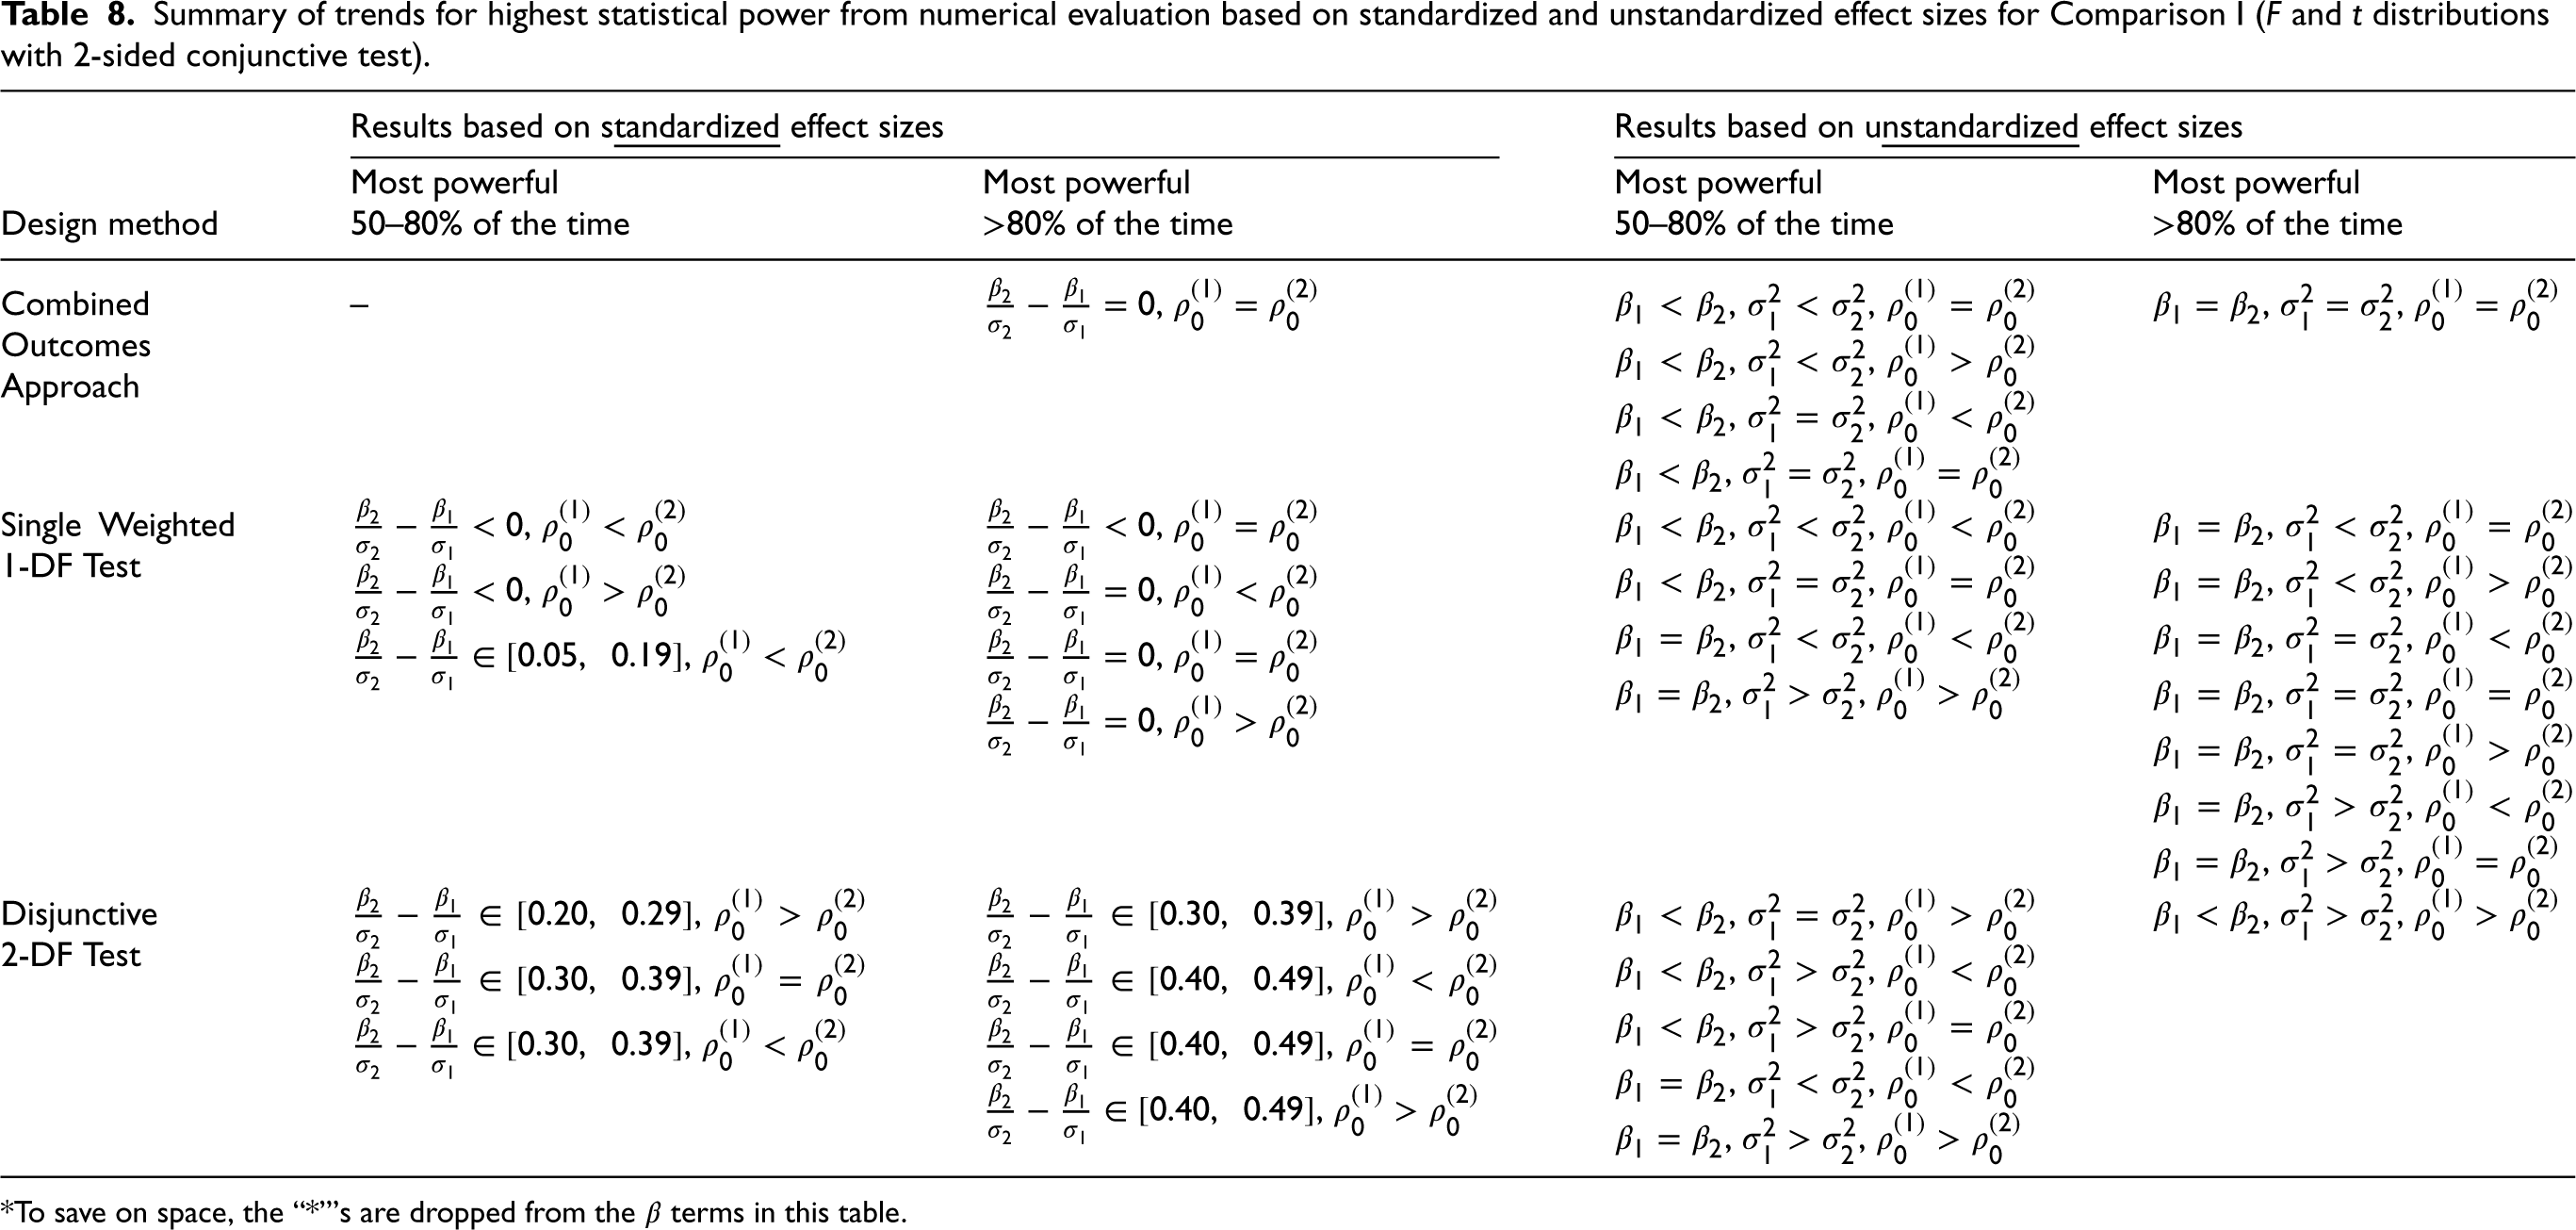
*To save on space, the “*”'s are dropped from the
Though the conjunctive test was never the most powerful among all the methods considered, it was important to better understand the situations in which this test is more powerful than arguably the most popular method, the Bonferroni p-value adjustment method. This is because this test is the only test that explores a conjunctive hypothesis, which many researchers may be interested in utilizing in the context of a hybrid 2 study. To this end, we narrowed our scope and looked solely at the numerical evaluation results for the conjunctive test and the Bonferroni adjustment method alone. Table 9 shows summary statistics for the power difference between the two methods, namely
Summary statistics for
stratified by input parameter values for Comparison I (F and t distributions with 2-sided conjunctive test).
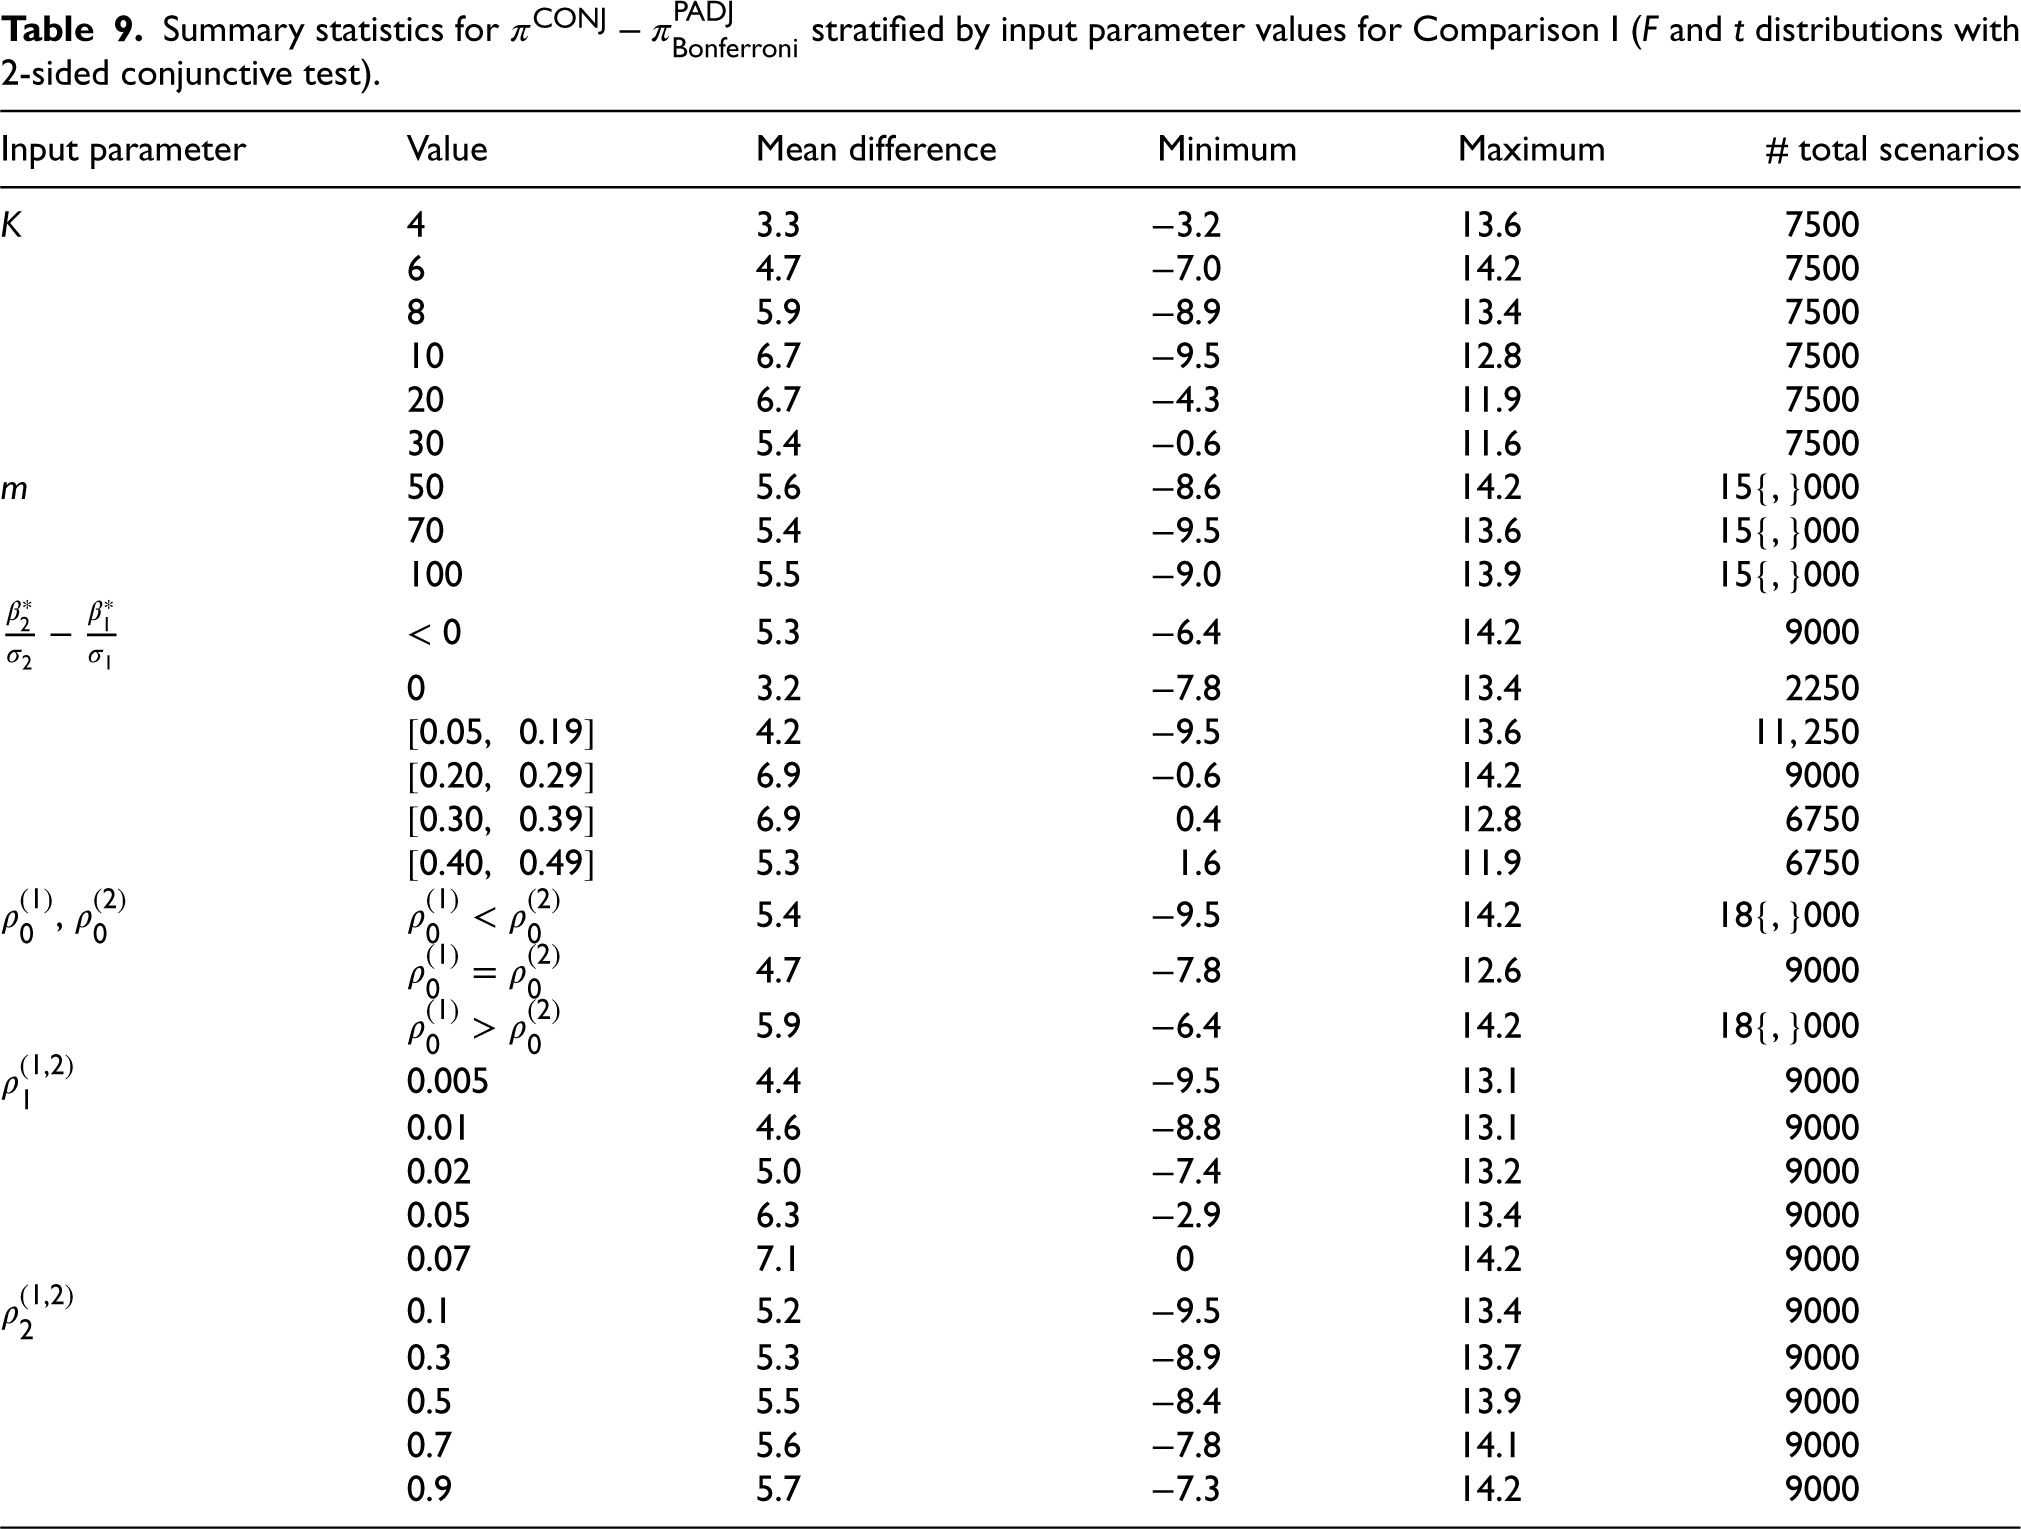
Summary statistics for
Similarly, we explored the degree to which the single weighted 1-DF test was more powerful than the conjunctive test. Although the single weighted 1-DF test had the highest average ranking of power among all the methods, it may be worth the loss of power when pursuing the conjunctive test due to its strength in hypothesis setup. Table 10 displays the percentage of scenarios where
Numerical evaluation results—proportion of scenarios for ranges of the power difference between the single weighted 1-DF test and conjunctive IU test, summarized for Comparison I (F and t distributions with 2-sided conjunctive test).
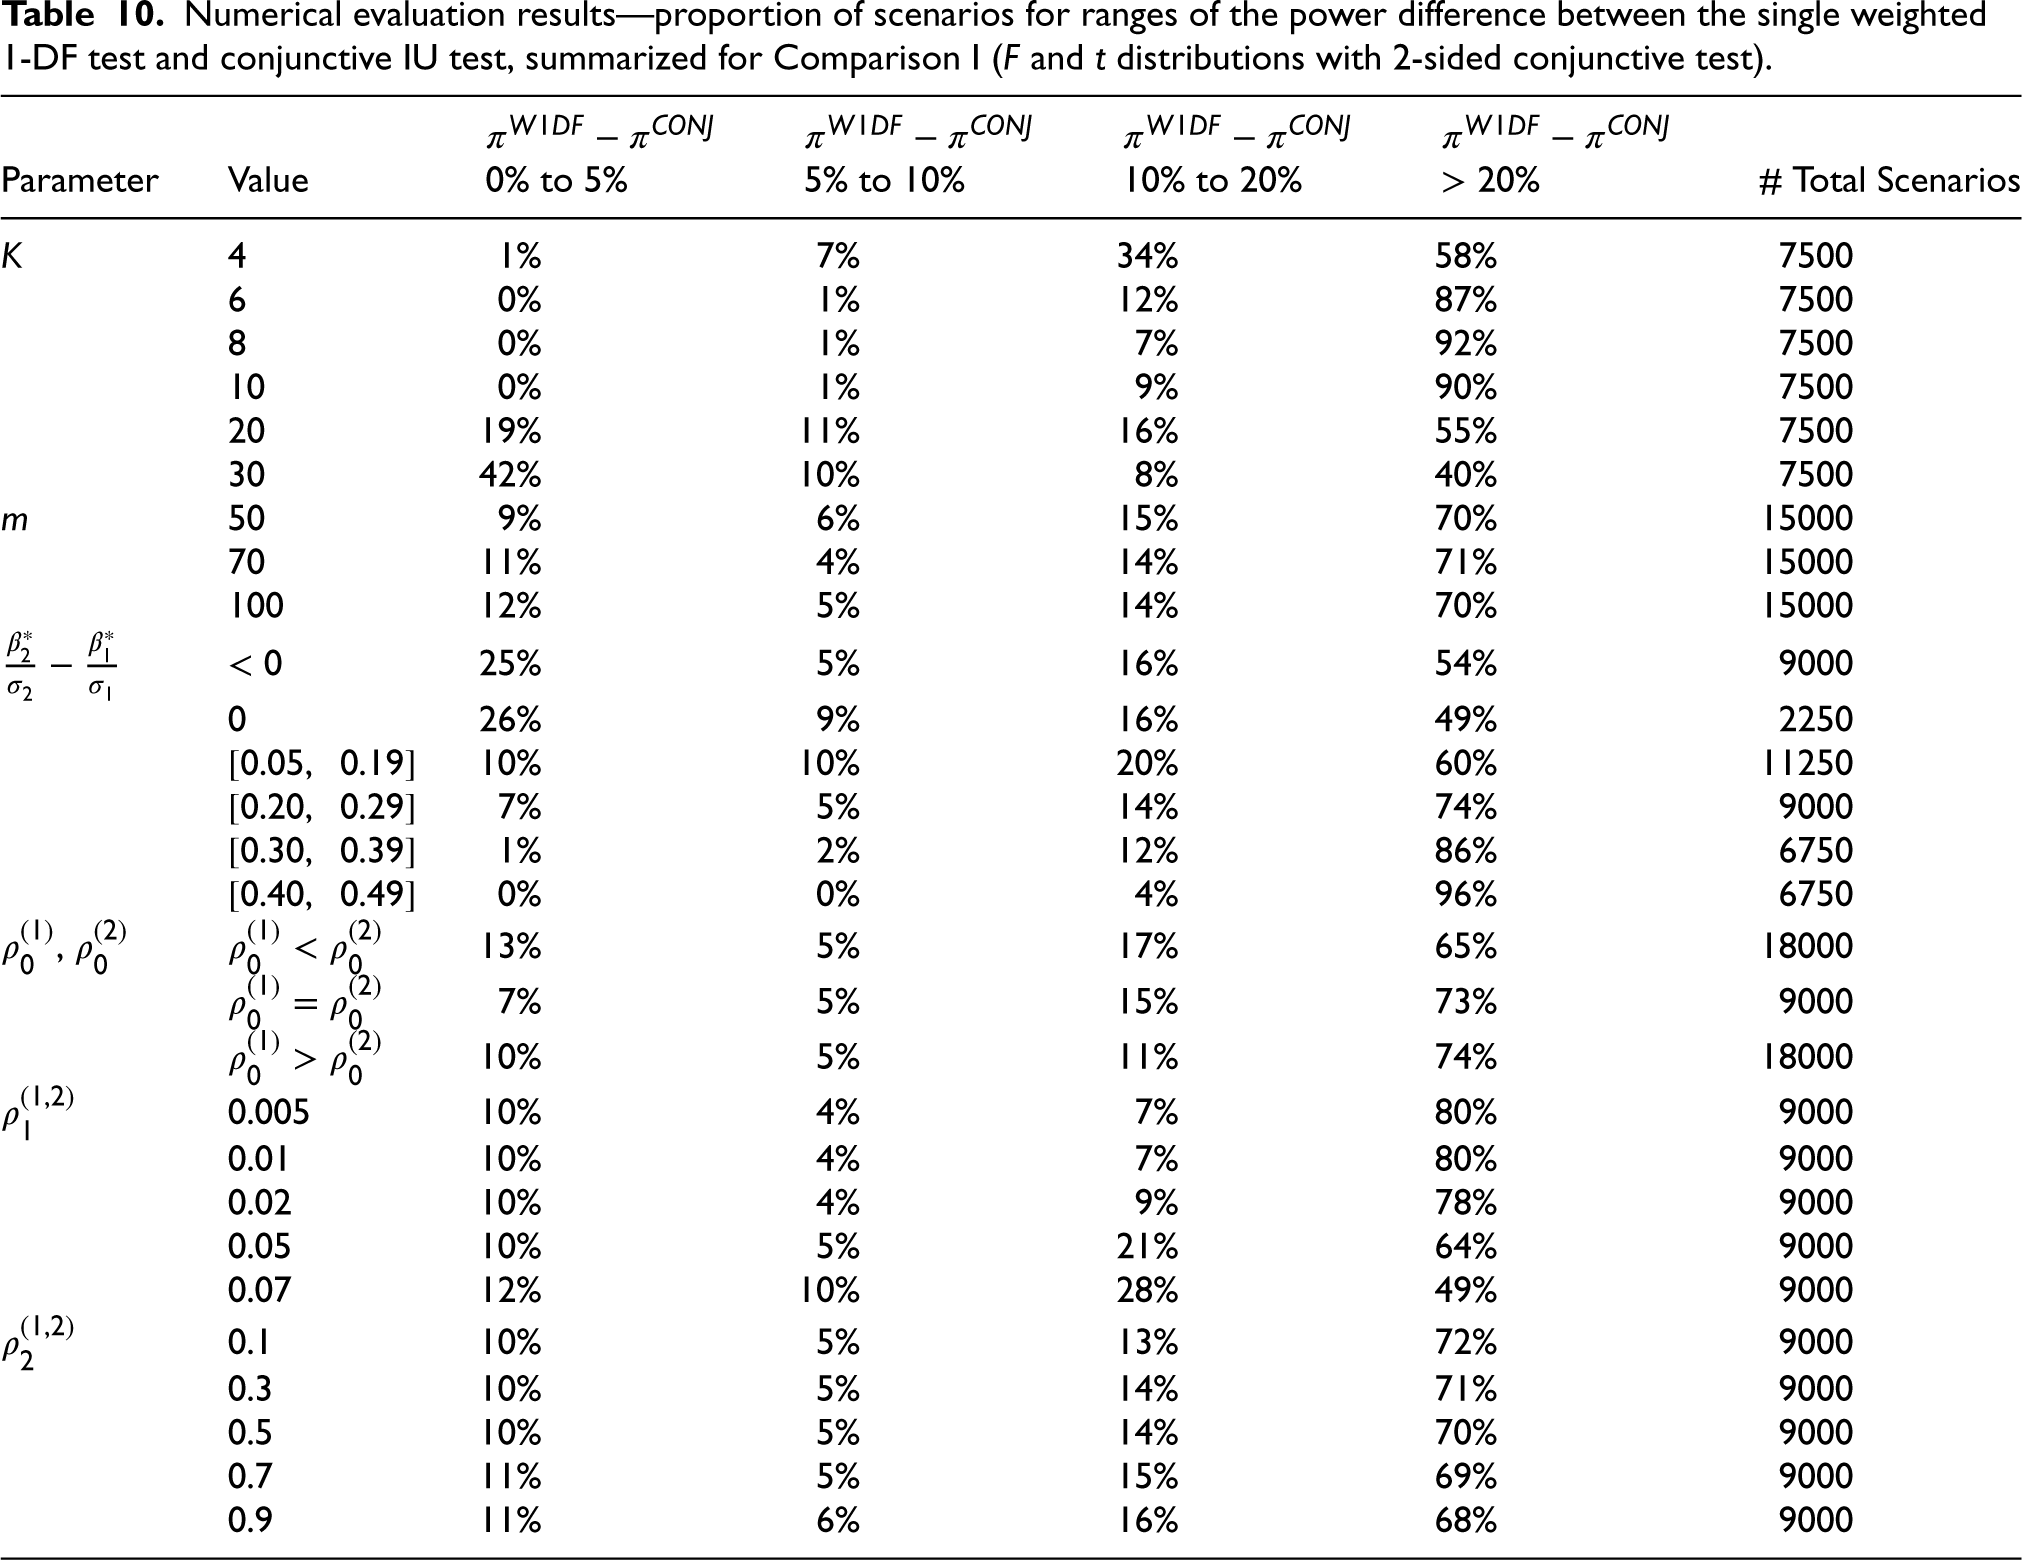
Numerical evaluation results—proportion of scenarios for ranges of the power difference between the single weighted 1-DF test and conjunctive IU test, summarized for Comparison I (F and t distributions with 2-sided conjunctive test).
Overall, the results did not change much between the different comparisons. The cases for when the combined outcomes approach, the single weighted 1-DF test, and the disjunctive 2-DF test are best remained largely the same, and are exactly equivalent the majority of the time. This is consistent for both the unstandardized and standardized results. We conclude that the choice of distribution (χ2-distribution vs. F-distribution, and MVN-distribution vs. t-distribution), does not largely impact which methods are most powerful. Similarly, whether or not the conjunctive IU test is 2-sided or 1-sided does not change the fact that it is more powerful than the Bonferroni p-value adjustment method. These results are available in the Supplementary Material (S.2-S.4).
Summary of results
Overall, the combined outcomes approach, single weighted 1-DF test, and disjunctive 2-DF test had the highest statistical power across the 45,000 design input scenarios. No method is globally most powerful, but we showed that the p-value adjustment methods are always less powerful than the combined outcomes approach and single weighted 1-DF test. When the outcome specific ICCs and variances between the two outcomes are the same, the combined outcomes approach is equivalent to the single weighted 1-DF test. Based on the average rankings of power for Comparison I, the most powerful methods in order are as follows: the single weighted 1-DF test, disjunctive 2-DF test, combined outcomes approach, conjunctive IU test, D/AP p-value adjustment, Sidak p-value adjustment, and Bonferroni p-value adjustment.
Treatment effects, outcome variances, and outcome-specific ICCs tend to have the largest impact on statistical power. The choice of reference distribution for hypothesis tests did not largely change which design methods were more or less powerful, though we note that the choice of reference distribution could potentially have an impact on the type I error rate, particularly in scenarios with a small number of clusters; future work could examine this. Table 8 summarizes the numerical study findings from Comparison I based on both the standardized effect sizes and unstandardized effect sizes, specifying under which cases a method has the highest power 50–80% of the time, and which cases a method has the highest power > 80% of the time. In general, we concluded that when the treatment effect sizes are the same, or when the standardized treatment effects are the same or close, the single weighted 1-DF test tends to have the highest power. When the treatment effects are different, the disjunctive 2-DF test tends to perform better, and as the difference between the standardized treatment effects increases, the disjunctive 2-DF test will yield higher power than the remaining methods. We revealed that the conjunctive test is more powerful than the Bonferroni method in the vast majority of scenarios. We also examined the degree to which the conjunctive test is less powerful than the most powerful method (single weighted 1-DF test). Table 11 summarizes both the results of the mathematical comparisons and numerical study by showing the relationship between each pairing of study design methods.
Matrix comparison of all statistical design methods .
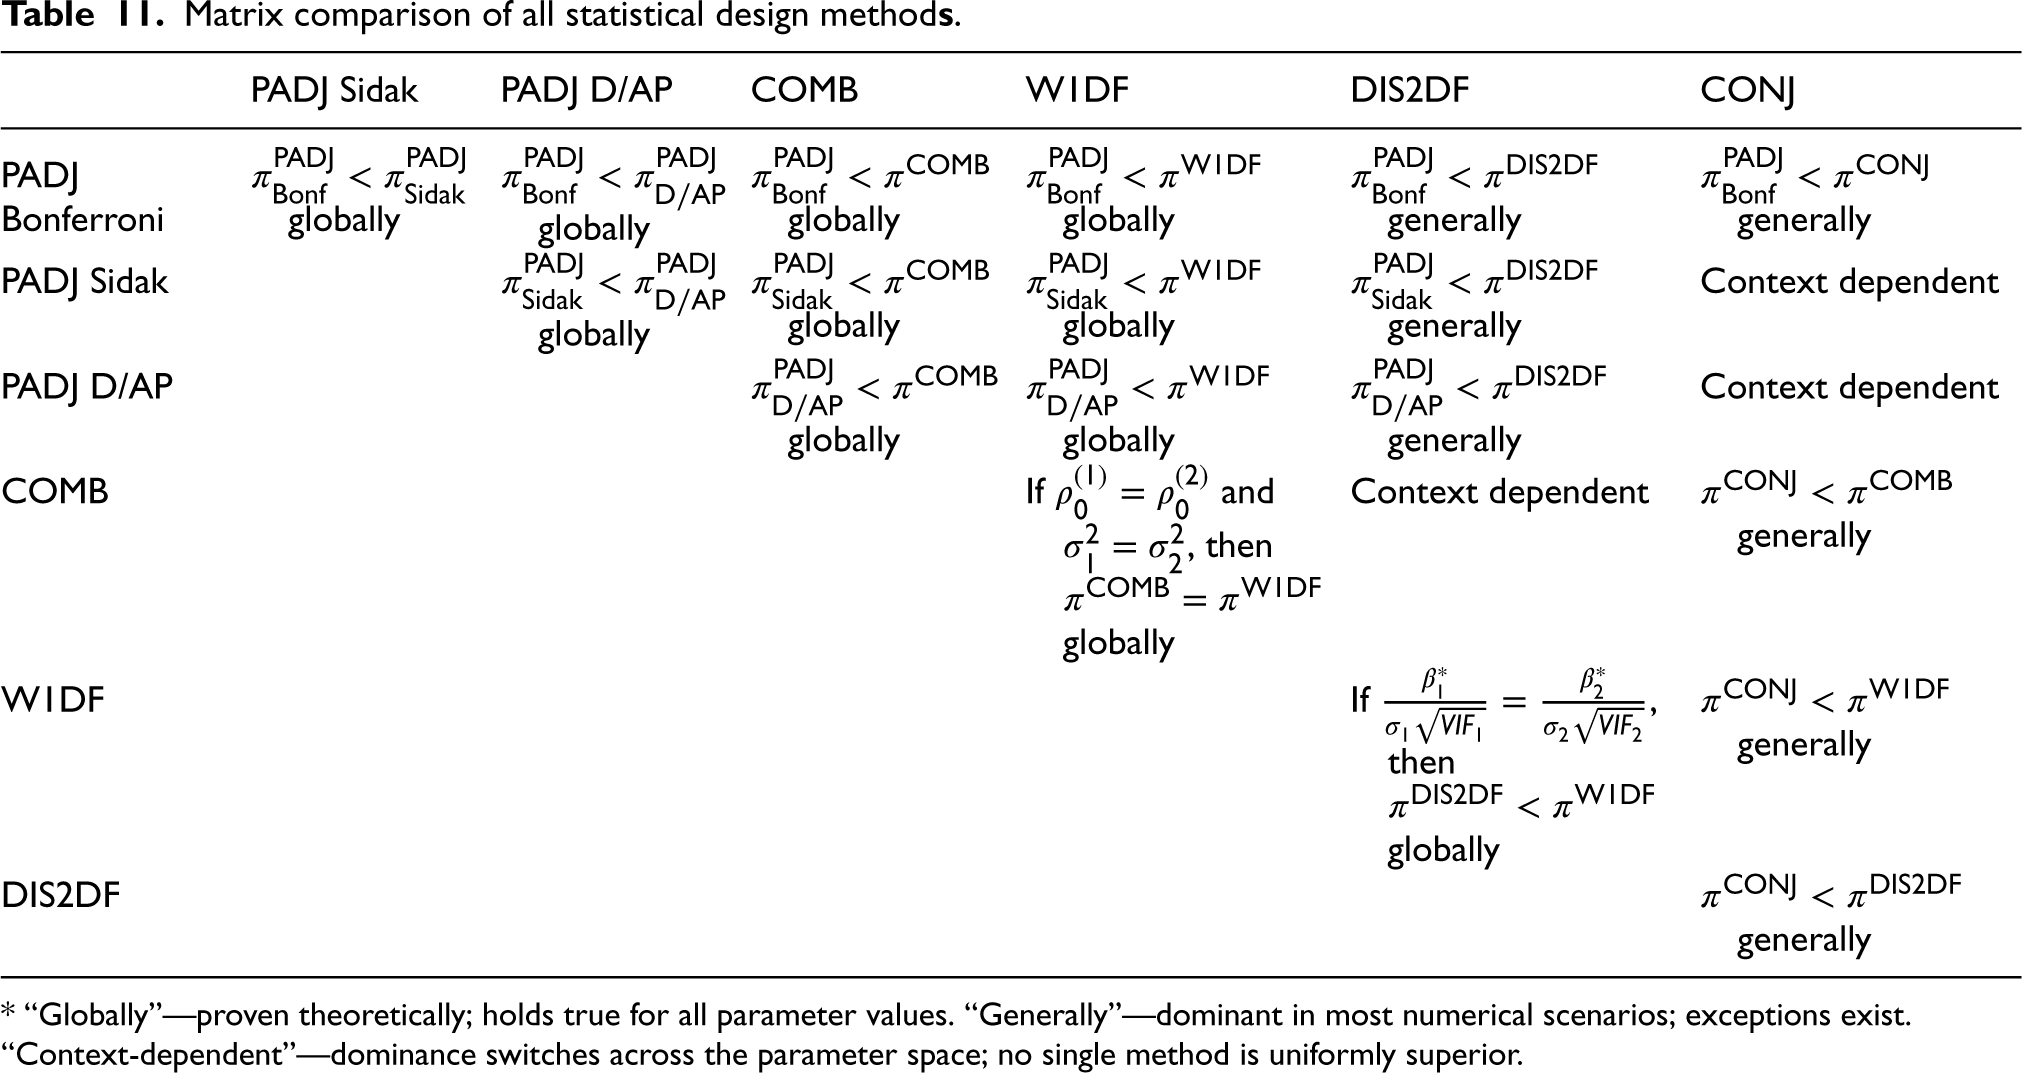
Matrix comparison of all statistical design method
* “Globally”—proven theoretically; holds true for all parameter values. “Generally”—dominant in most numerical scenarios; exceptions exist. “Context-dependent”—dominance switches across the parameter space; no single method is uniformly superior.
In this article, we examined the performance of a number of valid design methods for hybrid type 2 CRTs with continuous co-primary outcomes. These included the p-value adjustment methods, combined outcomes approach, single weighted 1-DF test, disjunctive 2-DF test, and the conjunctive test. A theoretical comparison of the power equations was conducted. It was proven that the p-value adjustment methods are globally less powerful than the combined outcomes approach and the single weighted 1-DF test. It was also shown that the non-centrality parameter for the p-value adjustment methods is always smaller than the non-centrality parameter for the disjunctive 2-DF test, but due to the differing degrees of freedom, there are theoretical cases where the p-value adjustment methods can result in higher power than the disjunctive 2-DF test. We also showed that when the cluster-corrected standardized effect sizes of the first and second outcomes are equal, then the single weighted 1-DF test will be more powerful than the disjunctive test. Lastly, when the outcome specific ICCs and variances between the two outcomes are the same, then combined outcomes approach is theoretically equivalent to the single weighted 1-DF test. 3
In the numerical evaluation, we explored comparisons that could not be obtained theoretically. We conducted four comparisons that differed in the choice of distribution and whether or not the conjunctive test utilized a 1-tail or 2-tail hypothesis. Results for all comparisons are given in the Supplementary Material, and we discussed the results from Comparison I in depth, which looked at a 2-tailed conjunctive IU test with the t-distribution, and all other methods using an F-distribution. It was found that the treatment effects, outcome variances, and outcome specific ICCs had the largest effect on power and which methods were more powerful than other methods. The combined outcomes approach, single weighted 1-DF test, and disjunctive 2-DF test had the most power, while the p-value adjustment methods and conjunctive IU test never had situations where they yielded the highest power. No method was found to be globally more powerful than another method. In general, the disjunctive 2-DF test did well when the treatment effects were not equal, while the single weighted 1-DF test did well when the treatment effects were equal. We also quantified the extent the extent to which the conjunctive test was more powerful than the popular Bonferroni p-value adjustment method, and also examined it in comparison to the most powerful method—the single weighted 1-DF test.
The choice of conducting a numerical evaluation was made because exact expressions are available for the quantities under consideration. These results can be interpretable as those when asymptotic inference is valid. It is beyond the scope of this paper to investigate relative finite sample performance of these methods, although such a study could be of further interest. Though our numerical evaluation covered 45,000 scenarios that included a wide range of input values for each parameter, and the additional analysis further allowed each individual parameter to vary over an even wider range of values, there are important limitations. We did not examine different values of the overall family-wise false positive rates, and limited our scope to
Table 8 shows in which scenarios a certain method has the highest power, to serve as a guide for researchers to better understand which methods to look into when designing their own hybrid 2 CRT. Though certain methods yielded higher power, we do not dismiss any of the methods as options altogether, for there may be situations where any of the methods could be most fitting depending on one's study and research goals. So, we also encourage the reader to make use of the
Supplemental Material
sj-docx-1-smm-10.1177_09622802261457277 - Supplemental material for A comparison of methods for designing hybrid type 2 cluster-randomized trials with continuous effectiveness and implementation endpoints
Supplemental material, sj-docx-1-smm-10.1177_09622802261457277 for A comparison of methods for designing hybrid type 2 cluster-randomized trials with continuous effectiveness and implementation endpoints by Melody A Owen, Fan Li, Ruyi Liu and Donna Spiegelman in Statistical Methods in Medical Research
Footnotes
Acknowledgments
This publication was made possible by CTSA Grant Number TL1 TR001864 from the National Center for Advancing Translational Science (NCATS), a component of the National Institutes of Health (NIH). Its contents are solely the responsibility of the authors and do not necessarily represent the official views of NIH.
Funding
The authors disclosed receipt of the following financial support for the research, authorship, and/or publication of this article: This work was supported by the Training in Implementation Science Research Methods, National Center for Advancing Translational Sciences (grant numbers T32HL155000, TL1 TR001864).
Declaration of conflicting interests
The authors declared no potential conflicts of interest with respect to the research, authorship, and/or publication of this article.
Supplemental material
Supplemental material for this article is available online.
References
Supplementary Material
Please find the following supplemental material available below.
For Open Access articles published under a Creative Commons License, all supplemental material carries the same license as the article it is associated with.
For non-Open Access articles published, all supplemental material carries a non-exclusive license, and permission requests for re-use of supplemental material or any part of supplemental material shall be sent directly to the copyright owner as specified in the copyright notice associated with the article.