
Abstract
In a previous article in this journal, I introduced Bruno Latour’s cartography of controversies and I discussed half of it, namely how to observe techno-scientific controversies. In this article I will concentrate on the remaining half: how to represent the complexity of social debates in a legible form. In my previous paper, we learnt how to explore the richness of collective existence through Actor-Network Theory. In this one, I will discuss how to render such complexity through an original visualization device: the controversy-website. Capitalizing on the potential of digital technologies, the controversy-website has been developed as a multilayered toolkit to trace and aggregate information on public debates.
Keywords
1. No exploration without representation
The cartography of controversies is a set of techniques to investigate public disputes especially, but not exclusively, around techno-scientific issues. It was introduced by Bruno Latour as a didactic exercise in Actor-Network Theory (ANT), but it gradually evolved into a full research method thanks to the contributions of a large research and teaching community. 1 Documenting such a method is the aim of this article and of a previous work published in this journal (Venturini, 2010). In that paper, I discussed how to observe controversies through an ANT approach. In this paper, I will propose some descriptive techniques. To be sure, such a distinction is largely artificial. In social cartography, observation and description always occur together. To explain why, let us run through some of the concepts introduced in my first paper.
According to the cartography of controversies, public debates (vaguely defined as situations where actors disagree) constitute the best settings for observing the construction of social life. In controversies, actors are unremittingly engaged in tying and untying relations, arguing categories and identities, revealing the fabric of collective existence. As it takes advantage of the multiplicity of viewpoints that emerge in controversies, social cartography has no reluctance to address their complexity. Certainly, such commitment has drawbacks. Encouraged to multiply viewpoints and perspectives, to contrast notions and methodologies, to explore the social where it gets most complicated, scholars are soon submerged by complexity. Each part claims its exception and the sum of the parts turns out to be greater than the whole. 2
Left alone, observations in social cartography quickly become too complex to be managed. That is why the task of unfolding the complexity of controversies should never be separated from the task of ordering such complexity. There is nothing particularly original about this idea. Exploration and representation always come together in cartography. No serious cartographer would travel a territory without taking notes, sketching plans, amending previous atlases. This is how maps have always been manufactured: through a recursive adjustment of observations and descriptions. 3 The same holds for the cartography of controversies. Social cartographers should work out their observations and descriptions at once. Right from the beginning of their campaigns, they will deal with maps. At first, such maps will be rough and incoherent. Yet, these initial and tentative sketches will support observation and facilitate their amending. 4
To say that no chicken comes without its egg, however, does not mean that chickens and eggs are one thing. Though always performed together, observation and representation should not be confused. As illustrated by Borges’ novel on the exactitude of science, nothing is vainer than a map tracing its territory point by point. 5 The map is not the (observed) territory, neither should it be. This is especially true for controversy mapping. What would be the interest of such a method if it could just deliver a reproduction of the observed phenomena? To be of any use, social maps have to be less confused and convoluted than collective disputes. They cannot just mirror the complexity of controversies: they have to make such complexity legible.
This is true when controversy mapping is practiced as a pure academic effort, but it is even more true when cartographers aspire to contribute to public debate. If we want social cartography to address any public larger than the STS community, we have to be realistic: there is a limit to the time that people can devote to controversies. Precisely because they are constantly busy in fighting their own battles, people are reluctant to dedicate attention to other issues. To use the words of an eminent pragmatist thinker:
The public will arrive in the middle of the third act and will leave before the last curtain, having stayed just long enough perhaps to decide who is the hero and who the villain of the piece. Yet usually that judgment will necessarily be made apart from intrinsic merits, on the basis of a sample of behavior, an aspect of a situation, by very rough external evidence. (Lippmann, 1927: 55)
Readers may have noticed a slight contradiction in my argument: first I claimed that sociological observations must be as complex as possible, then I add that observations must be coupled with descriptions, and now I am saying that descriptions must be as simple as possible. But how can simple descriptions fit complex observations? As readers may expect, there is no straightforward answer to such a question. 6 In my previous article, I reported that, when questioned about his cartography, Bruno Latour answers nonchalantly: “just look at controversies and tell what you see.” I explained why this makes the observation incredibly difficult. It is now time to turn to description and reveal that it is not any easier.
2. Building quakeproof representations
In my previous article, I introduced the notion of “second-degree objectivity.” Unlike positivistic “first-degree” objectivity, second-degree objectivity is not interested in identifying the matters of facts that arouse everyone’s agreement, but rather in revealing the full range of oppositions around matters of concern. 7 “Just observe” means remaining open to all perspectives. The same holds for “just describe” but with a crucial refinement: being attentive to all viewpoints does not mean granting everyone the same status.
Beginners often mistake second-degree objectivity for plain impartiality. Confronted with the evolutionism–creationism debate, for instance, they assume that both sides should be treated in the same way. This talk-show idea of equity has nothing to do with social cartography. Putting evolutionism and creationism on the same level is the surest way to misunderstand both. If this controversy is engaging, it is precisely because it opposes two diverging cosmoses. Imposing the same treatment on both is disrespectful at best. Objectivity does not come from crediting the same weight to all perspectives, not even from balancing the space allotted to each side. 8 Second-degree objectivity comes from attributing to each actor a representation that fits its position and relevance in the dispute.
Being proportional in social cartography means giving different visibility to different viewpoints according to, 1) their representativeness, 2) their influence, and 3) their interest.
(1) The representativeness of a viewpoint depends on how many actors subscribe to it. A statement or an argument shared by many of the actors of a controversy deserves more visibility than one that is relatively marginal. For example, in describing climate controversies, it would be misleading to give the same weight to the Intergovernmental Panel on Climate Change and to the Global Climate Coalition. To be proportional in description means conveying that scientists believing in global warming are ten times more numerous than their opponents. This does not mean, of course, that skeptics should be neglected. Not only because the goal of controversy mapping is to present as many viewpoints as possible, but also because representativeness is a matter of weighting much more than of counting. Yet, maps should avoid flattening the landscape of public debate. Not all perspectives are equally supported and social cartographers should find ways to render such disparity.
(2) When advised to consider a negotiation with the Pope, Joseph Stalin sarcastically replied: “the Pope? How many divisions has he got?” (as quoted by Winston Churchill in The Second World War, 1948, vol. 1, ch. 8). We now know that this was not a smart answer. The number of supporters or allies a viewpoint can mobilize is not the only criterion for deciding its relevance. Controversies have centers and peripheries, reliefs and valleys, frontiers and passes. In such territories, not all positions are equal and actors fight to build and occupy influential positions: positions that give them the power to affect the actions of other actors. Actors occupying influential positions deserve special attention because, like it or not, they will have better chances to shape controversies. 9 That is why, for example, to describe climate change negotiations it is important to relate not only the viewpoint of national leaders, but also that of the most influential NGOs and transnational corporations. Without the support of these actors, any agreement over global warming would have only the slightest chance of succeeding.
(3) If representative and influential viewpoints should have a central place in social cartography, they should not fill up the space of representation. Controversy mapping cannot content itself with majority reports, as the very rise of disputes depends on the presence of disagreeing minorities. It is disagreeing minorities who bring controversies into existence by refusing to settle with the mainstream and reopening the black boxes of science and technology. No matter how marginal, disagreeing viewpoints can be interesting because they offer original perspectives and question what is taken for granted. Something that is very visible on a map is not necessarily very visible in the territory (this is the very basis of treasure hunting). Cartographers may legitimately choose to map the proportionality of interest instead of size.
By suggesting three different criteria, social cartography allows scholars to adjust the notion of proportionality to their research goals. Researchers can focus on a sample of representative actors or concentrate on the most influential or spotlight marginal viewpoints, as long as they can justify their choice.
This is not just a question of formal justification. In exploring disputes, scholars venture into the thorniest of collective territories. In my previous article, I used the metaphor of magma to illustrate the bubbling nature of controversies. On such perilous flows, cartographic representations float as tectonic plates, colliding with the accounts provided by opposing actors, sinking under waves of quarrels, melting in the heat of conflicts. Representing a controversy is like building on a seismic fault. To endure the shake of disputes, descriptions must be quakeproof. The building metaphor suits perfectly the cartography of controversies. In mapping, as in building, resistance is obtained by three precautions:
(1)
(2)
(3) An essential property of this chain is that it must remain reversible. The succession of stages must be traceable, allowing for travel in both directions. If the chain is interrupted at any point, it ceases to transport truth – ceases, that is, to produce, to construct, to trace, and to conduct it. (Latour, 1999: 58)
The possibility to move through the chain of a scientific representation assures its flexibility. It allows other scholars to inspect each link of the chain and propose corrections or alternatives. This is the flexibility needed by social cartography: reducing the richness of controversies (to increase their readability) should never prevent the possibility of getting back to original complexity and proposing alternative simplifications.
To sum up, the objectivity of cartographic representations depends on the quantity and the quality of the work spent to build them. What is true for buildings is true for representations as well: the better they are built (the more they adapt to their territory, the more they are redundant and flexible), the more solid they will be.
3. Going digital
Readers who had the patience to follow my double journey through the observation and the description of controversies may now breathe a sigh of relief. All the recommendations of social cartography have been enunciated:
you shall listen to actors’ voices more than to your own presumptions;
you shall observe from as many viewpoints as possible;
you shall not restrict your observation to any single theory or methodology;
you shall adjust your descriptions and observations recursively;
you shall simplify complexity respectfully;
you shall attribute to each actor a visibility proportional to its weight;
you shall provide descriptions that are adapted, redundant and flexible.
Readers may legitimately feel discouraged: diving in magma and building on faults might seem impossible enterprises, especially by using the traditional equipment of social sciences. Luckily, in social cartography, there is no reason to be orthodox. In the exploration and visualization of collective debate, the use of original research techniques is not only admitted, but encouraged. In particular, the cartography of controversies turns its expectations towards digital methods.
Until a few years ago, social scientists conceived electronic media as new terrains for old methodologies. Researchers employed the traditional equipment of social sciences to harness the novelty of cyberculture, virtual communities, online identities, computer mediated communication. 10 Such an honorable enterprise has been somewhat defeated by the speed at which digital technologies have infiltrated modernity. Electronic interactions have become so pervasive that they can no longer be conceived as a separate social space. No longer limited to a specific sector, digital interactions are now woven throughout the fabric of collective existence. Follow digital threads and the social tapestry will be deployed. 11
Digital mediation adds to collective phenomena a couple of properties that are precious for cartographic purposes: traceability and aggregability. Of course, neither of them is unique to digital environments: all theories and methods have been developed to supply the same two properties. Yet, through digital mediation traceability and aggregability become intrinsic affordances of social phenomena.
To trace a phenomenon means converting it into a piece of writing. This process (also known as “inscription” 12 or “formalization” 13 ) plays a pivotal role in modern science. No matter if you investigate nuclear forces, legal bindings or neural synapses, if you work within the framework of science, you will eventually deal with words, charts or numbers. This holds also for social sciences, whose rationale is to provide formalized accounts of collective phenomena.
Now, the interesting thing about digital media is that everything they mediate is automatically traceable. To be fed into a computer 14 (or to be transmitted through a computer network) 15 phenomena have to be given a logical or mathematical form. There is nothing extraordinary in this remark and yet few seem to realize its consequences. If you compose a poem using a word processor, the versions you go through, the time you spend editing, the words you try, the verses you ponder, all the twists and turns of your inspiration can be easily tracked by your very typing software. The same may happen if you exchange emails with colleagues, share opinions in a forum, seduce someone in a chat room. Anything you say or do in a digital environment is traceable and often actually traced.
This fact has a major impact on social sciences. 16 Before the advent of digital mediation, social traceability was limited by the amount of resources that could be devoted to the endeavor. As extracting rich data on large populations was too expensive, scholars pulled the short blanket either by restricting the population (through qualitative methods) or by reducing the detail of data (through quantitative methods). In one direction, they floated towards psychological or micro-interactive accounts of social life. In the other direction, they drifted towards economical or macro-structural approaches. Digital mediation is rapidly rendering such an opposition obsolete. 17
Today, masses of dense information can be retrieved on vast populations with a reasonable effort. 18 A scholar interested in, say, agenda-setting is only a few clicks away from the archives of hundreds of newspapers and magazines, the records of television newscasts, the press releases of institutions and agencies, the full text of blogs, forums, and newsgroups. And that’s not all, with a little more effort she can access the biography and bibliography of anyone who reported the story, the number of times the story has been searched for on the Internet, the profiles of all the actors involved and so on.
Not only is a larger quantity of information accessible, but also new qualities are becoming traceable. Collective phenomena have long been divided into two dimensions: the micro-dimension of face-to-face interactions and the macro-dimension of systemic structures. Although coupled, these two dimensions have been considered as occupying two different layers of collective existence. 19 As syntax and phonetics, organs and cells, molecules and atoms, macro-structure and micro-interactions were considered as two impermeable spheres, one emerging from the other and yet remaining irreducible to it. ANT discarded such a distinction as a methodological bias. 20 As scholars had access either to the direct observation of situated interactions or to aggregated data on global structures, they were led to believe that these were two separate dimensions. The very notion of actor-network was introduced to follow collective phenomena without separating interactions from structures.
Easier said than done. Until the advent of digital technologies, no researcher ever had the chance to follow the assembly line of society. Consider a classical economist: she could investigate either a local set of exchanges (microeconomics) or the aggregated data of national assets (macroeconomics), but she couldn’t trace the path through which each single transaction contributed to the global economy. 21 Today, credit card databases as well as supermarket accountancy can provide insights on this path (and the more people that use credit cards and supermarkets, the more such insights become precise).
The ancient divide between the social on the one hand and the psychological on the other was largely an artefact of an asymmetry between the traceability of various types of carriers: what Proust’s narrator was doing with his heroes, no one could say, thus it was said to be private and left to psychology; what Proust earned from his book was calculable, and thus was made part of the social or the economic sphere. But today the data bank of Amazon.com has simultaneous access to my most subtle preferences as well as to my Visa card. As soon as I purchase on the web, I erase the difference between the social, the economic and the psychological. (Latour, 2007)
Imagine what this means for social cartography. Thanks to digital mediation, “observing controversies from all the concerned viewpoints” becomes more than a wishful slogan: it becomes actually possible. With a reasonable commitment and some computer skills, the students in our cartography course can follow controversies through media coverage, scientific literatures, legal indices, economical data and the blogosphere.
4. Navigating through digital datascapes
The new observation opportunities sown by digital mediation do not necessarily yield better researches. As said, more observation always calls for more representation. The proliferation of data made possible by digital techniques would be unintelligible without a commensurate effort in articulation: traceability is useless without aggregability.
To aggregate information means displaying it in a condensed form, transforming data so that a few elements become representatives of many others. Several examples can be provided: synopsis and listing in writing, calculation and inference in statistics, diagrams and stylizations in design. All these techniques (and many others) are used by scientists to make complexity readable. Consider a graph showing the increase of a given observable: the clarity of the representation is obtained through graphical operations (tracing a Cartesian plane, setting the points according to their coordinates, drawing the connecting lines), statistical operations (assigning values, classifying data, calculating averages) and literal operations (transcribing observations, paraphrasing transcriptions, comparing paraphrases). Through each transformation, observations gain readability by losing some of the original richness.
Certainly, aggregation is a risky process: it always entails the risk of dumping something important. That is why reversibility is so important. Like Theseus, scientists wouldn’t wander the maze of representation without a thread to follow back. By maintaining the reversibility of aggregation, researchers assure themselves (and their peers) the possibility of climbing back up their formalizations and then trying other descents. 22
To be sure, scientific descriptions did not wait for digitalization to become reversible. Serious social investigations have always offered access to non-aggregated (or less-aggregated) data. Yet, before digitalization, reversing formalizations entailed moving through different supports. Verifying a graph required moving from the chart to a calculator, from the calculator to the data table, from the table to the archive that gathered the notes, from the notes to the sampled population, from the sample to the actual phenomenon. Each step involved different devices and required a considerable effort. With digital techniques, disaggregating becomes much easier as all steps can be performed without taking the eyes off a computer screen.
Consider the many blogosphere maps available online: 23 not only do they portray the structures of the blogosphere (showing central and peripheral nodes), but they also allow tracing of each node’s connections and even reading the specific posts where the connections were made. The capacity for zooming through different levels of aggregation 24 is what makes digital representations so convenient for social sciences. Digital mediation fills the observation gap between macro-structures and micro-interactions as it provides the means to move from one to the other.
That is not all: not only is digitalization making aggregation chains easily reversible, but it is also gathering different chains in one homogeneous space. Today, historians, economists, psychologists, ethnographers (as well as biologists, mathematicians, physicists, chemists …) all use similar personal computers to transform and store data. They all feed data into similar databases, spreadsheets and word processors. Their papers can be found in the same online libraries, downloaded to the same hard disks and read on the same screens. Comparisons and hybridizations among disciplines become more frequent just because a great many technical obstacles are removed. Once again, this was not impossible before digitalization. However, the smoothness of these digital crossings is startling,
25
especially as a similar process is affecting the boundaries between scientific data and other types of information:
26
Owen Gingerich, the great historian of astronomy, spent a life-time retrieving all the annotations of all the copies of Copernicus’s first edition. … Nowadays, any scientist can do the same for each portion of each article he or she has published so long as the local library has bought a good package of digital data banks. But what is more extraordinary is that any journalist can do so as well for the latest Madonna video or the dirtiest rumour about Prince Harry’s love affairs. (Latour, 2007)
Yes, the cartography of controversy has a liking for digital techniques. With their support, the commandments of social cartography seem less extreme and the tasks of being sensitive in observation and legible in description appear less contradictory. Yet, the enthusiasm for digital innovation should not prevent us from acknowledging four simple facts:
search engines are not the web;
the web is not the Internet;
the Internet is not the digital;
the digital is not the world.
(1) Even if portals and search engines are constantly expanding their databases, they cannot grow as fast as the web. Every day hundreds of thousands of new pages are created and only a fraction is reached by the search crawlers. Sometimes contents remain invisible because they are too marginal or ephemeral, sometimes because they are concealed by their authors, and sometimes they are just forgotten. 27 (2) Even if more and more information is exchanged via the hypertext transfer protocol (http) and under the form of an xhtml page, a large slice of electronic traffic travels through other routes. Emails, teleconferences, chats, peer-to-peer exchanges, document transfers and many other data do not transit via web protocols. (3) Not all digital information is shared on a computer network and not all networks are connected to the Internet. For every piece of information diffused on the Internet, hundreds of other data are buried inside the memory of offline computers or limited to LANs (local-area networks). 28 (4) Even if in Western societies computers are more and more ubiquitous, important portions of collective life remain impermeable to digital mediation. No matter how pervasive technology will get, face-to-face interactions will never lose their importance. Last but not least, the world is bigger than Western societies (especially in an age of globalization) and other societies are proving to be much more resistant to digital penetration.
5. The 9+1 layers of a controversy-website
The four limitations just listed constrain the ambitions of digital methods, but do not diminish their interest. Several web-based tools are now available to support the investigation of techno-scientific debates. A large set of these tools has been identified and tested by the project MACOSPOL (MApping COntroversies on Science for POLitics). With the European Union support, MACOSPOL has brought together eight universities and research centers 29 in the effort to select the most interesting resources and the best practices in digital cartography. The result is a platform (www.mappingcontroversies.net) conceived as a toolkit for researchers who want to experiment in digital controversy mapping.
Tools, however, are only half of the story. To be used in a cartographic campaign, tools have to be connected and coordinated. Through MACOSPOL and our teaching experience at Sciences Po, we devised a basic framework for controversy mapping: the controversy-website. This framework is an atlas composed of nine different layers. 30
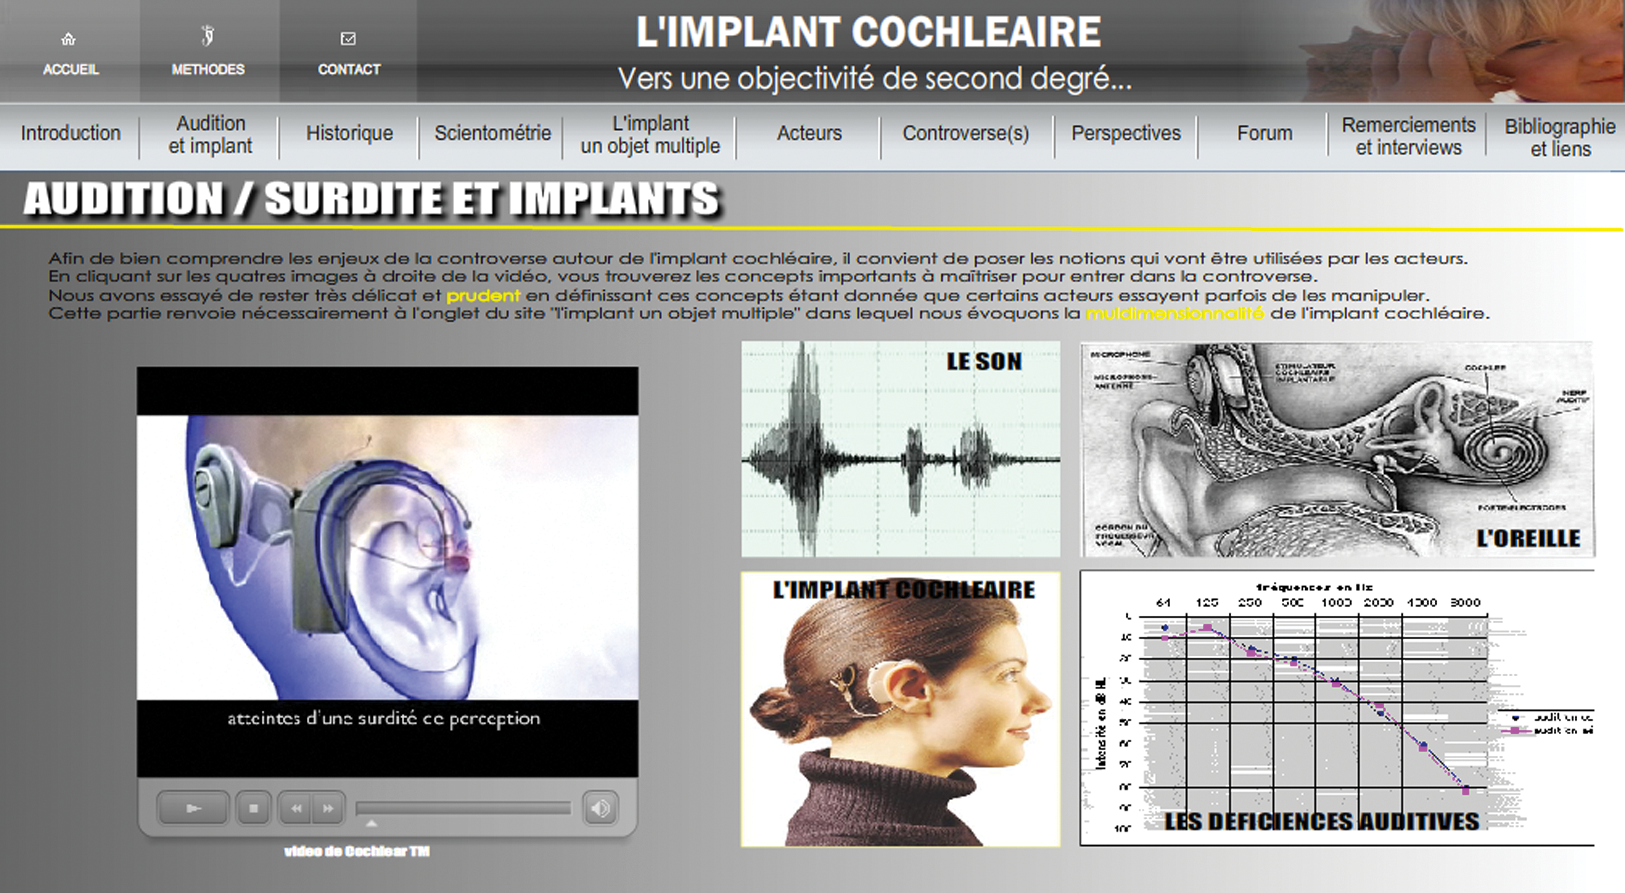
The glossary of the controversy on audio implants. 31 (Created by Guillaume Gobenceaux, Camille Treujou, Marion Teullier, Lorraine Dujardin, and Héloïse Temps, at Sciences Po).

Map of the controversy around the Hadopi law as it appears on the web. (Created by Corinne Lee, Héloïse Loichemol, Philippe Marchandise, Pierre-Edouard Nobles, and Samantha Roussoulère, at Sciences Po).
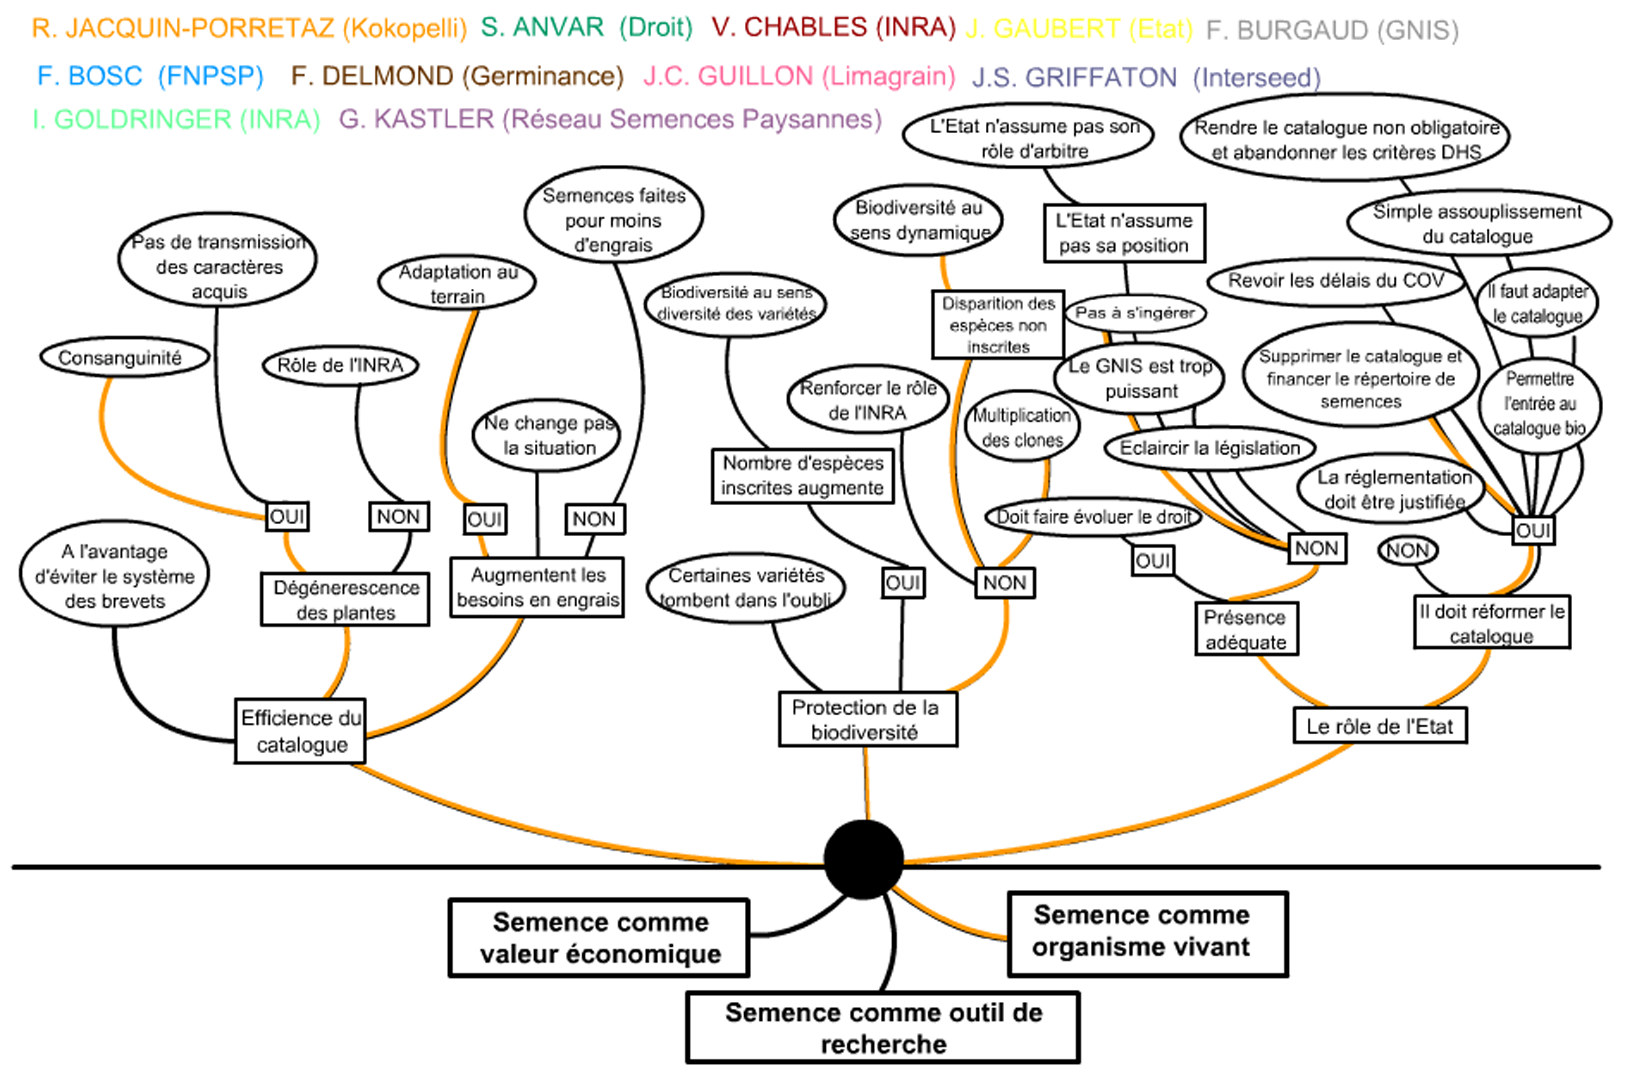
The controversy on seed catalogues and its related questions. (Created by Claire Bourrasset, Léa Eynaud, Violaine Pierre, Mélanie Pommerieux, Céline Ramstein, and Elisabeth Voisin, at Sciences Po).

The actor-networks of the “Tour Triangle” controversy. (Created by Bianca Reame, Justin Meade, Miguel Jacinto, Ryslaine Moulay, Thomas Berriet, and Yvette Jallade, at Sciences Po).

The cosmoses opposed by the controversy on algae infestations. (Created by Maud Borie, Camille Durand, Viviane Gravey, Melaine Loarer, and Marie Petit at Sciences Po).
A tenth layer exists and is both the most fascinating and the least developed in the cartography of controversies. Besides observing and representing public debates, controversy-websites might also provide a space to perform them. If there is one thing that sets the web apart from all previous media, it is the possibility to establish a symmetrical communication among a large number of actors. The web is the only broadcasting medium that does not distinguish irreversibly between source and audience. Of course, asymmetries do exist in online communication: it is the owner of a website who chooses which expressive spaces are left to visitors. Still, the very fact that websites’ owners are given this choice represents an unprecedented possibility. Interactivity allows involving visitors in the research process, collecting their observations, soliciting their contributions and gathering their comments. At best, through blogs, forums, groupware, and wikis, controversy-websites can become the very place where disputes are collectively elaborated and arranged.
According to several scholars working on politics with an ANT approach, the contemporary crisis of political representations is largely due to the difficulty of negotiating modern controversies within the existing public forums. Traditional institutions (such as parliaments, referendums, newspapers) may have difficulties in hosting techno-scientific disputes, because they are not issue-specific and because they are incapable of handling enough heterogeneity. 33 Based on heterogeneous observations and issue-centered representations, controversy-websites might become an interesting alternative setting for collective debate, thereby participating in the digital renewal of the public sphere. 34 Unfortunately, discussing such an intriguing possibility is well beyond the scope of this paper and must be postponed to further researches.
Developing controversy mapping beyond its original academic scope has been the main ambition of the MACOSPOL project, but much work remains to be done. Turning controversy-websites from a didactic exercise into a platform for public debate requires both further reflections on the conditions of public participation in techno-scientific discussions and further practical work on the tools that may facilitate such participation. The methods of social cartography are still far from being fully developed and far from achieving the double goal of observing the full complexity of controversies and making it easily readable. However, thanks to the inexhaustible creativity of our students and of Internet users constantly inventing and releasing new observation and representation tools, we are confident that the future of controversy mapping is already under way.
Footnotes
Notes
Author Biography