
Abstract
Citizen science can make major contributions to informal science education by targeting participants’ attitudes and knowledge about science while changing human behavior towards the environment. We examined how training associated with an invasive species citizen science program affected participants in these areas. We found no changes in science literacy or overall attitudes between tests administered just before and after a one-day training program, matching results from other studies. However, we found improvements in science literacy and knowledge using context-specific measures and in self-reported intention to engage in pro-environmental activities. While we noted modest change in knowledge and attitudes, we found comparison and interpretation of these data difficult in the absence of other studies using similar measures. We suggest that alternative survey instruments are needed and should be calibrated appropriately to the pre-existing attitudes, behavior, and levels of knowledge in these relatively sophisticated target groups.
Keywords
1. Introduction
A scientifically literate citizenry is necessary to understand and make informed decisions surrounding science, technology, and environmental issues (Miller, 2004). Although science literacy among the American population as measured by the Science and Engineering Indicators (SEI) has increased from 12% in 1957 to 21% in 2008 (National Science Board, 2008), more needs to be done to improve science literacy in the US if we are to have a predominately literate society. To address this growing concern, the National Research Council proposed changes to science teaching that engage learners in authentic inquiry or research (National Research Council, 1996). Science inquiry places learners in an education environment that promotes “asking questions, planning and conducting an investigation, using appropriate tools and techniques, thinking critically and logically about the relationships between evidence and explanations, constructing and analyzing alternative explanations, and communicating scientific arguments” (National Research Council, 1996: 105).
New avenues for scientific inquiry need to be explored (National Research Council, 1996), and informal science education programs can provide one of these avenues, especially in adult learners who no longer participate in formal education (Falk, 2005; Falk et al., 2007; Bell et al., 2009). Citizen science, a type of informal science education program where volunteers engage in authentic science projects and often with scientists, provides a way to engage the public in scientific investigation through training, education, and outreach (Bonney et al., 2009b; Silvertown, 2009). In the past decade, there has been a significant rise in the number of research studies utilizing citizen scientists and an increase in the number of volunteers that participate in these studies. Stakeholders in these programs are diverse with goals ranging from participant education to large-scale data collection not feasible using traditional methods (Dickinson et al., 2010). Irrespective of their initial goals, as these programs continue to grow, so does the need for data on their social impacts.
Reviews on this subject suggest that citizen science engages participants in science; provides opportunities for participants to gain scientific knowledge; allows exploration of the physical world; allows participants to reflect on science; and develops positive attitudes toward science (Bell et al., 2009; Bonney et al., 2009a). However, few studies have rigorously assessed the role citizen science can play in changing participant attitudes, behavior, and science literacy, leaving the field wanting in many areas (Trumbull et al., 2000; Bell et al., 2009; Bonney et al., 2009a). In response to this lack of data, we conducted an evaluation of a citizen science training program and describe here our results on participant learning gains and self-reported change in behavior. In addition, we discuss the need for formalized evaluation for citizen science projects.
A few studies have sought to measure science literacy, attitudes toward science, and any reported change in behavior in spite of a lack of formal evaluation metrics. For example, Trumbull et al. (2000) evaluated Cornell’s Seed Preference Test. The authors sought to determine whether participation in this citizen science program would increase understanding or attitudes related to the process of science. Using a post-project questionnaire, they found no difference between two study groups (i.e., those that had returned data and those that had not). However, qualitative analyses of 750 letters revealed that 80% showed evidence of science inquiry among participants (Trumbull et al., 2000).
In addition, through a volunteer stream monitoring program, Overdevest et al. (2004) compared learning gains in new recruits and volunteers currently participating in the program. In particular, the authors sought to evaluate whether participation improved content knowledge or changed behavior by assessing local political participation or development of more extensive social networks. Participation did not significantly increase factual understanding about stream and water resources. Volunteers with knowledge and interest in water resources were recruited to the program, so prior knowledge of these subjects likely existed for both test groups. The authors suggested future studies use evaluation methods designed to detect more advanced stages of learning (e.g., analysis, synthesis; see Bloom, 1956). What was notable, however, is that this study showed significant increases to social capital (i.e., political participation, growing personal networks, community connections; Overdevest et al., 2004), and little research has been done on the ability of these programs to increase social capital or promote capacity building.
Jordan et al. (2011), in their study on citizen scientist learning, found that content increased, but participation was insufficient to increase understanding of how scientific research is conducted. In addition, while participants reported increased awareness of the environmental issues studied, this translated into little change in behavior regarding these issues.
Finally, Brossard et al. (2005) evaluated The Birdhouse Network (TBN) to assess changes in science literacy, content knowledge, and attitudes. The program increased participants’ knowledge of bird biology, an effect attributed to the emphasis placed on that subject throughout the program. This study, however, revealed no significant change in participants’ attitude toward science or the environment and no significant change in participants’ understanding of the scientific process following participation.
What is lacking from these previous studies is a sense of how the data collection protocols are framed in the context of how researchers do science. Placing explicit emphasis on how general knowledge and skills taught in the program can be applied to answer additional research questions could improve a program’s impact on science literacy. Cooper et al. (2007), for example, urged using participatory research in ways that “begin with the interests of participants, who work collaboratively with professional researchers through all steps of the scientific process to find solutions to problems of community relevance.” Citizen science and participatory research programs have similar research and education goals, but citizen science programs typically occur at larger scales and do not incorporate iterative or collaborative action (Finn, 1994; Cooper et al., 2007). Here, we describe and evaluate a citizen science training program with the primary goal of answering our program’s large-scale research questions while providing citizens with the knowledge and skills necessary to develop and answer research questions of local interest.
2. Questions and hypotheses
In this study, the National Science Foundation (NSF) evaluation framework (Friedman, 2008) was adopted and integrated with measures used by other informal science education programs to evaluate an invasive species citizen science program. In particular, we used similar methods to those of Brossard et al. (2005) to make our results directly comparable to their findings.
Content knowledge gains and science literacy
Brossard et al. (2005) used an experiential education framework to formulate hypotheses related to knowledge gain from participation in a citizen science program. Experiential education consists of a concrete experience for a learner and facilitation of reflection on that experience for the learner (Joplin, 1985; Tuss, 1996). Other studies support use of this framework in the context of citizen science (Palmer, 1992; Messmore, 1996). We tested the hypotheses that training to prepare for a citizen science program would increase understanding of: the scientific method, invasive species ecology, global positioning systems, and vegetation monitoring.
Numerous factors contribute to an individual’s science literacy in the United States, including formal education, gender, age, and religion (Miller, 2004; National Science Board, 2008). We selected a suite of factors from our evaluations to determine if any of these factors might predict our participants’ understanding of the scientific process.
Attitudes toward science and the environment
Brossard et al. (2005) also used the Elaboration Likelihood Model to formulate hypotheses related to how attitudes toward science and the environment change in response to the public participating in scientific research. This model states that persuasion is possible when thoughtful attention is given to persuasive stimuli (Petty and Cacioppo, 1981, 1986). For example, an individual motivated to join a citizen science program is more likely to read educational materials in a manner that persuades them to agree with the arguments made in those materials. Therefore, we tested the hypothesis that participation in a citizen science training program would result in positive attitudes towards science and the environment.
Self-reported change in behavior
Changes in behavior from participating in citizen science may include improving species habitat, observing environmental changes, engaging in related political processes, or feeling empowered to make changes (Bonney et al., 2009a). We tested the hypothesis that participation in the training would show expected changes in participant behavior from his/her current behavior.
Changes across experience
We acknowledge that participants in citizen science programs may represent a self-selected group biased to include those with greater knowledge and stronger environmental values than the general public, making it difficult to assess change across time. Although longitudinal datasets in this field are rare, individuals with less experience in diverse citizen science programs may show greater changes in knowledge and attitudes. Such a finding would justify efforts to expand informal education programs to larger audiences; therefore, we examined difference in attitudes and science literacy across multiple levels of prior experience.
3. Methods
The National Institute of Invasive Species Science citizen science program
The National Institute of Invasive Species Science (NIISS; see www.citsci.org) is a consortium of government and non-government organizations formed to develop cooperative approaches for invasive species research that meet the needs of multiple stakeholders. In 2006, the organization began to develop a national citizen science program to effectively coordinate data collection efforts among scientists, natural resource managers, and the public.
Centering this program on invasive species research was important for several reasons. Invasive species research depends on large pools of data across large areas over time (Lodge et al., 2006; Crowl et al., 2008). Citizen science has been effective for use in research programs of this type (Bonney et al., 2009b). People serve as primary pathways for new invasions, so educating citizens on the issue could help prevent invasive species spread (Mack et al., 2000; Kiritani and Yamamura, 2003). The issue has also generated diverse stakeholder support among land management agencies, states, tribes, and conservation organizations due to the widespread environmental and economic damage caused by these species (Mack et al., 2000; Lodge and Shrader-Frechette, 2003; Pimentel et al., 2005). The program could draw on this widespread interest to help recruit participants, while expanding education opportunities to a larger audience.
NIISS educational program
As part of the NIISS program, staff developed training presentations and related educational materials that could be easily adopted by existing volunteer organizations. These were divided into four modules (30–45 minutes each), providing flexibility to meet the diverse needs of program participants. The goals of the training were to: 1) educate participants on invasive species, their threats, and what people can do to stop their spread; 2) teach global positioning systems (GPS) and their uses; and 3) teach tested monitoring protocols that can be used to answer local research questions of interest while facilitating the adoption of standardized data collection methods for addressing research questions at broader spatial scales.
The invasive plant monitoring protocol taught in the training was based on levels to accommodate participants with diverse knowledge and skills. Level one involved the collection of species location data with a GPS unit, and emphasized opportunistically sampling locations as participants drove or hiked through a natural area. Trainers discussed how opportunistic sampling biases and limits the types of analyses that can be done with the data. Trainers provided a list of research questions that can be answered using the level one protocol: 1) What invasive species are currently coming into a local area?; 2) How widespread are these species?; and 3) What habitats are these species invading? Participants were told that finding answers to these questions may help them modify their sampling design to target a specific species or habitat of interest.
Level two incorporated plots and used other sampling designs (random, stratified-random, systematic) to ensure that data remained unbiased and could be extrapolated to the larger study area. The plot is a large circle (168 m2) with three 1 m2 subplots located within the larger circle (see Barnett et al., 2007). Trainees recorded presence/absence and cover of all species they had been trained to identify. Trainers provided participants with research questions addressed by the level two monitoring protocol: 1) Have efforts to control a species been effective?; 2) Is the population of a species growing or shrinking over time?; 3) Does the population of a species differ in different habitats?
Our final objective with this training was to provide citizen scientists with the knowledge and skills to collect and disseminate data on invasive species that addressed local research questions of interest. As a national organization with limited means for oversight, we placed emphasis on capacity building among participating organizations to carry out scientific research independently. Trainers told participants to seek out additional help from professionals when developing a local monitoring program and provided a list of regional contacts to facilitate future collaboration. Therefore, this training program provided an ideal platform for testing our hypotheses.
Training workshops
The treatment group attended an eight-hour training that included an indoor component with the following lessons: an introduction to invasive species (30 minutes); an introduction to global positioning systems (GPS; 45 minutes); an introduction to sampling design and vegetation monitoring protocols (levels one and two taught; 45 minutes); and use of a website for data entry (see www.citsci.org; 35 minutes). Trainers taught lessons with a scientific inquiry approach to provide application of the content to the scientific method (National Research Council, 1996; Krasny et al., 2003). We provided an additional outdoor training component that included field exercises in identifying plant species (35 minutes), recording a location and navigating with a GPS unit (35 minutes), and implementing the vegetation monitoring protocol (35 minutes). Remaining time was allocated for introductions, breaks, and evaluations.
Participant recruitment
We held two invasive plant species trainings in 2009 at the University of Wisconsin Arboretum, Madison, WI and Colorado State University’s Environmental Learning Center, Fort Collins, CO. Recruitment of participants involved advertising within existing volunteer organizations. We provided potential participants with a short survey, asking questions on demographics and willingness to participate in the treatment (i.e., attend the training) or control group (i.e., respond to a mail-in survey). All individuals were placed into the group they selected. Demographic data were collected from individuals not interested in participating in any capacity within this recruitment pool to ensure our experimental group adequately represented the sample population.
Evaluation
We administered evaluations using the pretest-posttest control group design (Campbell and Stanley, 1963). The control group was given a pre-training evaluation only due to the short duration of the study (one day). Each participant in the treatment group provided a personalized code that was used to match pre- and post-training responses while keeping responses anonymous. We performed all statistical analyses on evaluation responses in SPSS (Version 18; 2009). We tested all data for normality and transformed variables as needed. We used chi-square statistics to test for differences in demographic variables between the control and treatment groups.
To assess science literacy, participants responded to the standard SEI question on what it means to study something scientifically (Q1–Q2; Table 1; Brossard et al., 2005; National Science Board, 2008). We asked two additional open-ended questions related to science literacy specific to invasive species science and the content covered in our training (Q3–Q4; Table 1). We developed additional evaluation questions to measure knowledge of invasive species, global positioning systems, and vegetation monitoring protocols (Q5–Q16; Table 1). Once developed, questions were examined by subject experts and evaluators to ensure correctness and clarity. The post-training evaluation included all these questions with the addition of one asking participants to rank their overall satisfaction with the training program.
Science literacy and content knowledge questions included on pre- and post-training evaluations. For questions that had coded responses, Krippendorff’s alpha is provided.
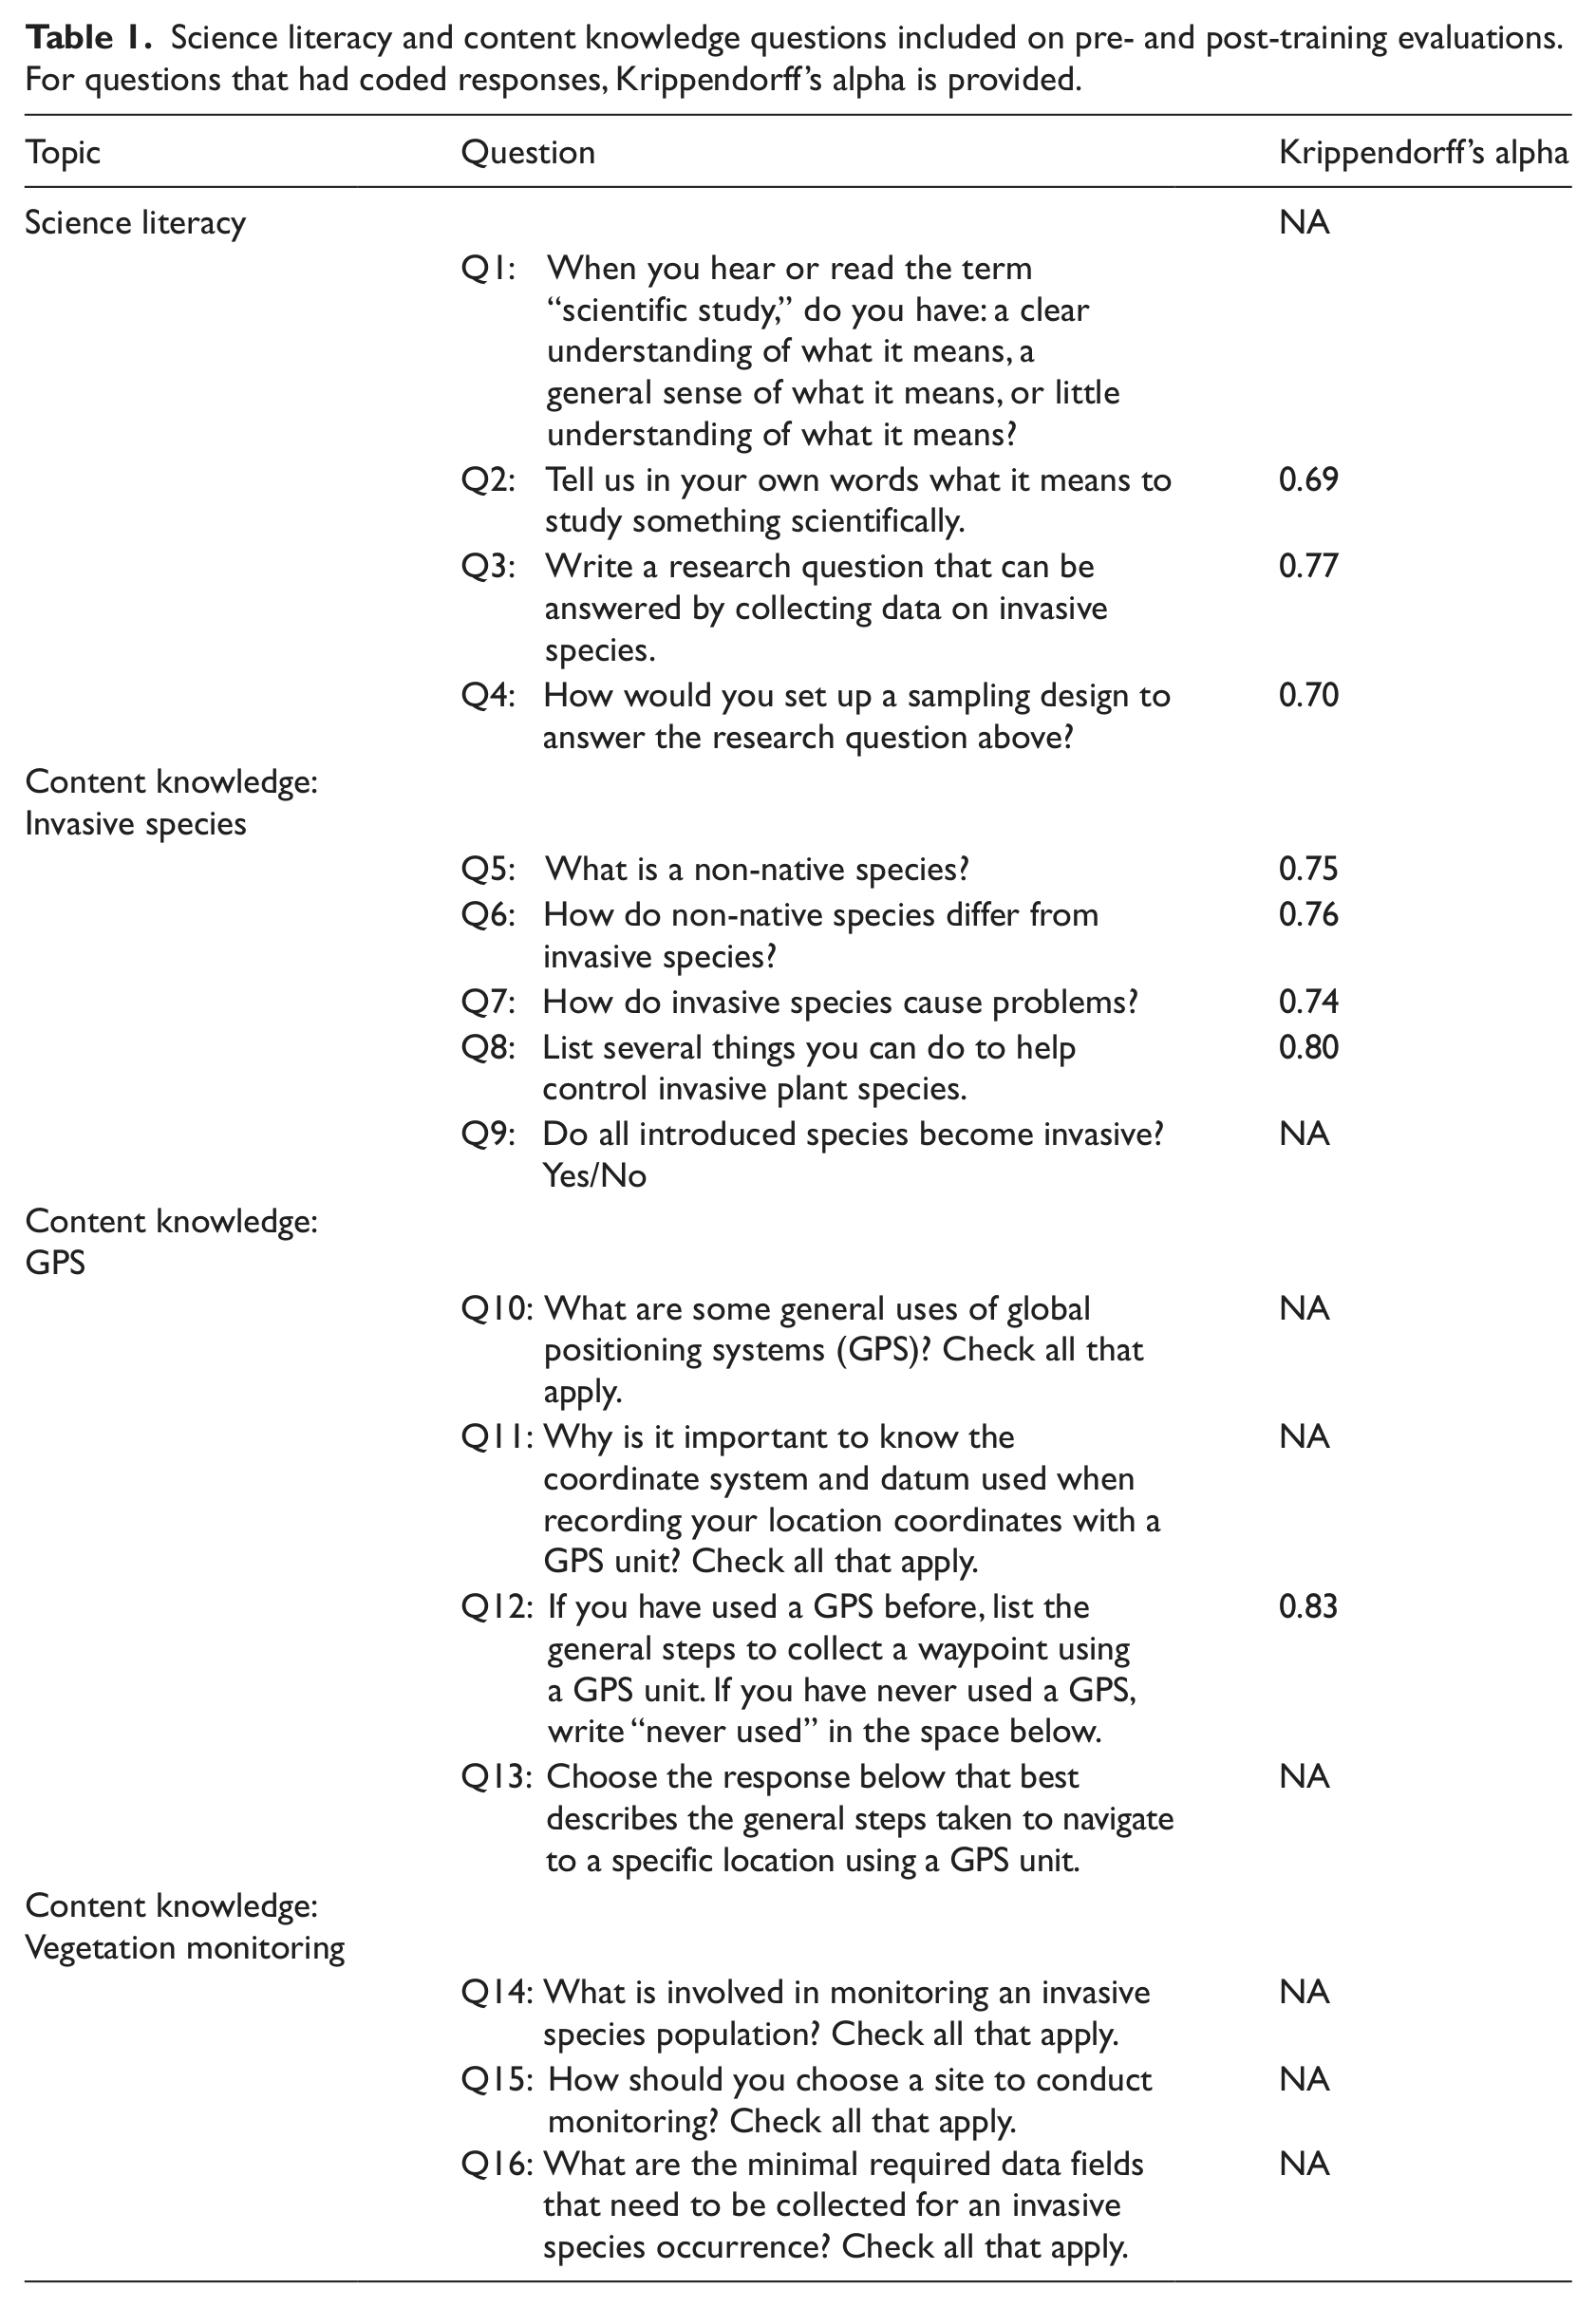
We estimated science literacy by summing points for questions two through four (Table 1). Responses to the standardized science literacy question were coded with five categories: 1) responses describing a scientific study as theory building and testing; 2) responses focusing on experimental studies that include the use of controls; 3) responses describing careful and rigorous comparisons; 4) responses showing none of these levels of understanding; and 5) no response (National Science Board, 1996). We determined interrater reliability among three coders (including the primary researcher) using Krippendorff’s alpha statistic (α; Krippendorff, 2004a, b). Each participant was given a point for responses that included codes 1, 2, or 3 (Table 1). Once an acceptable α was reached (α = 0.69), a final code was assigned based on the majority of coders with rare disagreements resolved via discussions (Lacy and Riffe, 1996; Lombard et al., 2002).
We also coded responses for the training-specific science literacy questions. Three coders were trained on the initial coding scheme using a random subset of 30 responses (Lombard et al., 2002, 2003). This process produced an adequate interrater reliability for 17 unique research question codes (α = 0.77) and 19 sampling design codes (α = 0.70; Krippendorff, 2004a, b). Responses to both content-specific questions were scored as valid or invalid (one or zero; Q3; Q4; Table 1). Valid research questions could be answered by conducting a scientific study. Valid sampling designs could address the proposed research question. Because some participants provided multiple valid responses, total science literacy scores across these three questions ranged between zero and five.
Three evaluators coded responses to the open-ended content knowledge questions, and Krippendorff’s alpha determined interrater reliability (Table 1; Krippendorff, 2004a, b). Each code was then assigned a score. Unclassifiable, no response, and “I don’t know” received a score of zero. We assigned points for correct responses, and these were additive if the question included the potential for multiple correct responses. Once we tabulated scores, each content knowledge section was standardized to a ten-point scale to create an overall score for invasive species, GPS, and vegetation monitoring. A ten-point scale made our results directly comparable to the TBN study (Brossard et al., 2005).
We assessed attitudes toward science with a modified version of the attitude toward organized science scale (MATOSS; Brossard et al., 2005). MATOSS scores range between -8 (strong negative attitude toward science) to +8 (strong positive attitude toward science). We created an index using responses to this scale (Brossard et al., 2005). Attitude toward science was assessed for Wisconsin participants only (N = 31).
We assessed attitudes toward the environment using a subset of the new environmental paradigm (NEP) scale scored on a five-point scale from strongly disagree to strongly agree (Dunlap and Van Liere, 1978; Dunlap et al., 1992). The NEP scale ranges between 0 (against human efforts to limit environmental impacts) and 3 (in favor of such efforts). We generated an index from responses to this scale.
Participants responded with their level of experience to a list of skills related to the training (vegetation sampling design, plant identification, invasive plant identification, vegetation monitoring) on a five-point scale: 1) no experience; 2) little experience; 3) some experience; 4) proficient; or 5) expert. We assessed personal behavior and engagement by asking how frequently volunteers participated in: volunteering for environmental organizations, attending community events related to environmental issues, removing/controlling invasive species, monitoring invasive species, educating others about invasive species. Scored responses included never, a few times each year, each month, every week, or every day. We generated an experience index using these nine questions related to participants’ monitoring skills and frequency of volunteer participation. To assess behavior independently of the experience index, we generated a behavior index using responses from the five personal engagement and behavior statements.
For each respondent, indices were computed by summing the response for each item after reversed items had been recoded. The alpha-Cronbach reliabilities of the indices were 0.54 (attitude toward science), 0.67 (attitude toward the environment), 0.83 (behavior), and 0.88 (experience). Although the reliability for the science attitude measure was low, we still used the index to facilitate comparisons to other studies (Brossard et al., 2005).
We tested for significant differences in the science literacy scores, content knowledge scores, attitude toward science index, attitude toward the environment index, behavior index, and experience index between treatment and control groups with a t-test. A paired t-test examined significant differences in pre- and post-training scores for the treatment group (Campbell and Stanley, 1963).
We used regression tree analyses to evaluate which variables (age, education, content knowledge score, attitude toward the environment, experience) best predicted science literacy pre- and post-training. Regression tree analysis results in classes of samples differentiated by dichotomous predictive dependent variables. The PRE score generated by this analysis can be equated to the adjusted R2 from a multiple regression. We then used regression to assess whether the experience index was correlated with the science literacy score, the three content knowledge scores, attitude toward science index, or attitude toward the environment index. Behavior was not included in this analysis because the experience index included behavioral responses.
4. Results
Participant demographics
Participants (N = 166) were more likely to be employed than non-participants (N = 48; χ2 = 16; p < 0.01), but the two groups did not differ in age, gender, education, or profession. No differences existed between control (N = 73) and treatment (N = 31) groups for Wisconsin participants, but the control group (N = 34) was somewhat younger than the treatment group (N = 28) in Colorado (χ2 = 11; p = 0.05). Across both states, the control group had slightly more higher income households (82%) than the treatment group (77%; χ2 = 7.8; p = 0.05). Slightly more females participated in the training (75%) than in the control group (61%; χ2 = 3.6; p = 0.06). From these results (see Appendix at http://pus.sagepub.com), we concluded that our participants represented the sample population fairly well and data could be combined across states for both treatment (N = 59) and control (N = 110) groups.
Most participants were between the ages of 55 to 64, female, had a college degree and were from higher income households, resembling demographics of participants in other informal science education programs (Nicholson et al., 1994; Overdevest et al., 2004; Brossard et al., 2005; National Science Board, 2008). Participant motivations for attending the training included an interest in learning plant identification skills (47%), environmental issues (42%), invasive species or invasive species monitoring (39%), and learning to use GPS units (39%). Although 22% of participants ranked interest in science as a reason for attending, only 8% ranked it as the primary reason. After training, 51% of participants rated the training as excellent, 46% rated it as good, and 3% rated it as average.
Science literacy and content knowledge
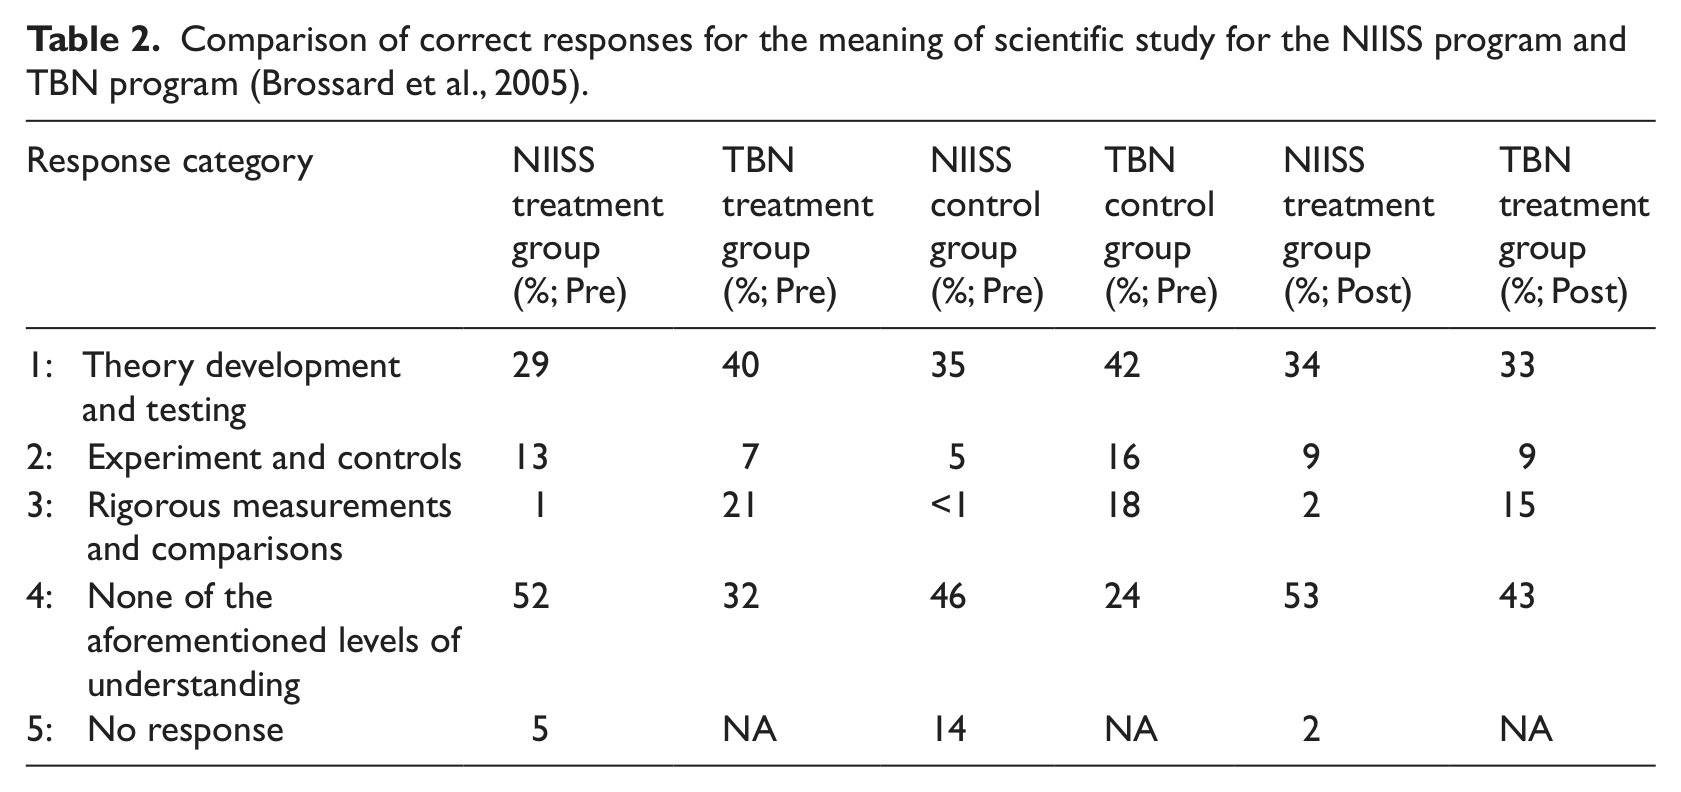
Treatment and control groups had similar science literacy scores (t = 0.07; p = 0.95). Similar to the TBN study (Treatment: 76%; Control: 68%), the percentage of participants that could answer what it means to study something scientifically (Treatment: 41%, Control: 43%; Brossard et al., 2005) was higher than that of the general population (average 21% from 1988–2006; National Science Board, 2008). However, participants responded correctly only 40% of the time (Table 2). These values were lower than those found for the TBN study (Treatment: 76%; Control: 68%). Post-training scores improved slightly to 45%, but not significantly.
Comparison of correct responses for the meaning of scientific study for the NIISS program and TBN program (Brossard et al., 2005).
Science literacy scores based on all three open-ended science literacy questions improved from pre- (1.7±0.13) to post-training (2.0±0.12; t = −2.4; p = 0.02). Approximately 40% of participants could explain a scientific study prior to the training, but 83% could write a valid research question and 39% could provide a valid sampling design. Participants significantly improved their responses to context-specific questions following training (Research Question: 92%, Sampling Design: 56%) but not their ability to explain a scientific study (45%).
Valid research questions and sampling designs provided by participants in each coding category shifted after training (Table 3). For example, research questions related to invasive species distribution/presence rose from 5% to 14%, while research questions related to abundance rose from 14% to 19% (Table 3). Participants proposing a valid sampling design rose from 39% to 56%, and 10% correctly placed their response into the context of the training protocol (Table 3).
Coding scheme developed for participant responses to the questions: “Write a research question that can be answered by collecting data on invasive species” and “How would you set up a sampling design to answer the research question?”.
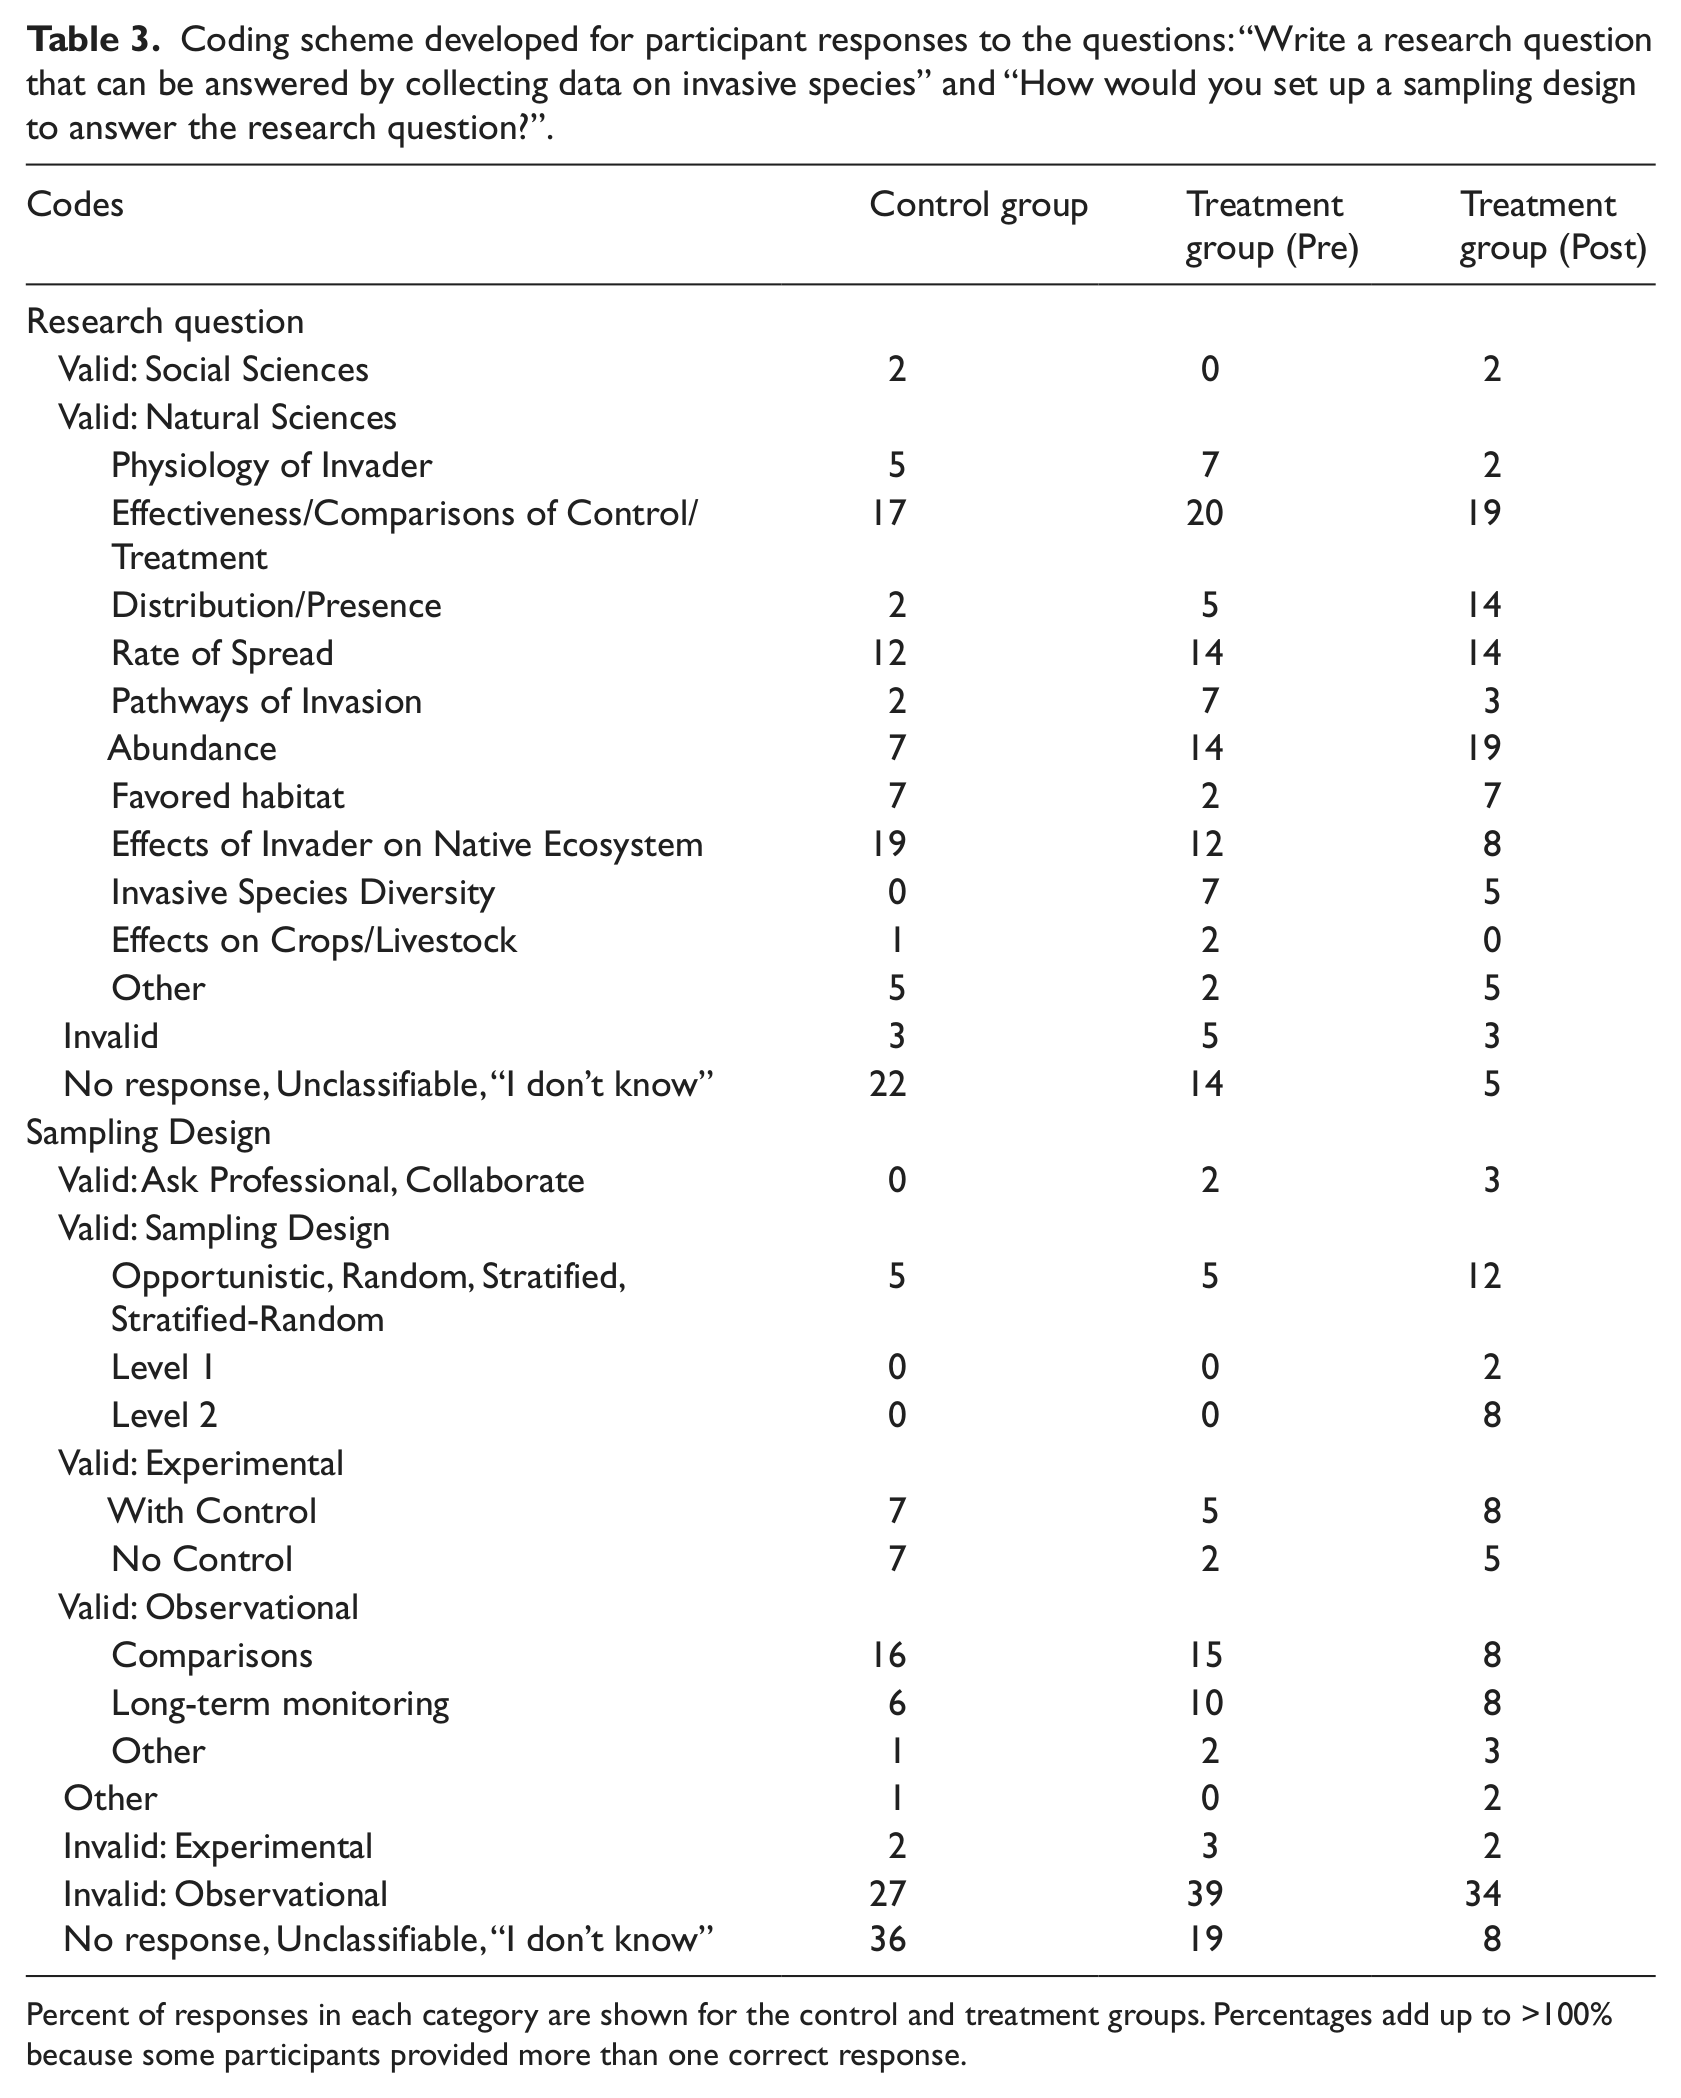
Percent of responses in each category are shown for the control and treatment groups. Percentages add up to >100% because some participants provided more than one correct response.
The treatment group had more knowledge of invasive species before training (7.3±0.18) than the control group (6.3±0.14; t = −4.6; p < 0.01). Training further improved their knowledge (8.0±0.16; t = −3.6; p < 0.01). The treatment and control groups had similar knowledge of global positioning systems (5.3±0.17 vs. 4.8±0.21; t = 1.8; p = 0.07). The groups also had similar levels of knowledge regarding vegetation monitoring (Treatment: 7.0±0.32; Control: 7.3±0.26; t = 0.83; p = 0.41). Training improved scores for GPS (t = −14; p < 0.01) and vegetation monitoring (t = −6.7; p < 0.01).
Participants’ knowledge of these subjects contributed to their science literacy scores. The regression tree for pre-training scores identified the pre-content knowledge score and education as independent predictors explaining 19% of the variance (Figure 1A); whereas, post-training science literacy depended on the post-content knowledge score, age, and education (explaining 28% of the variance; Figure 1B).
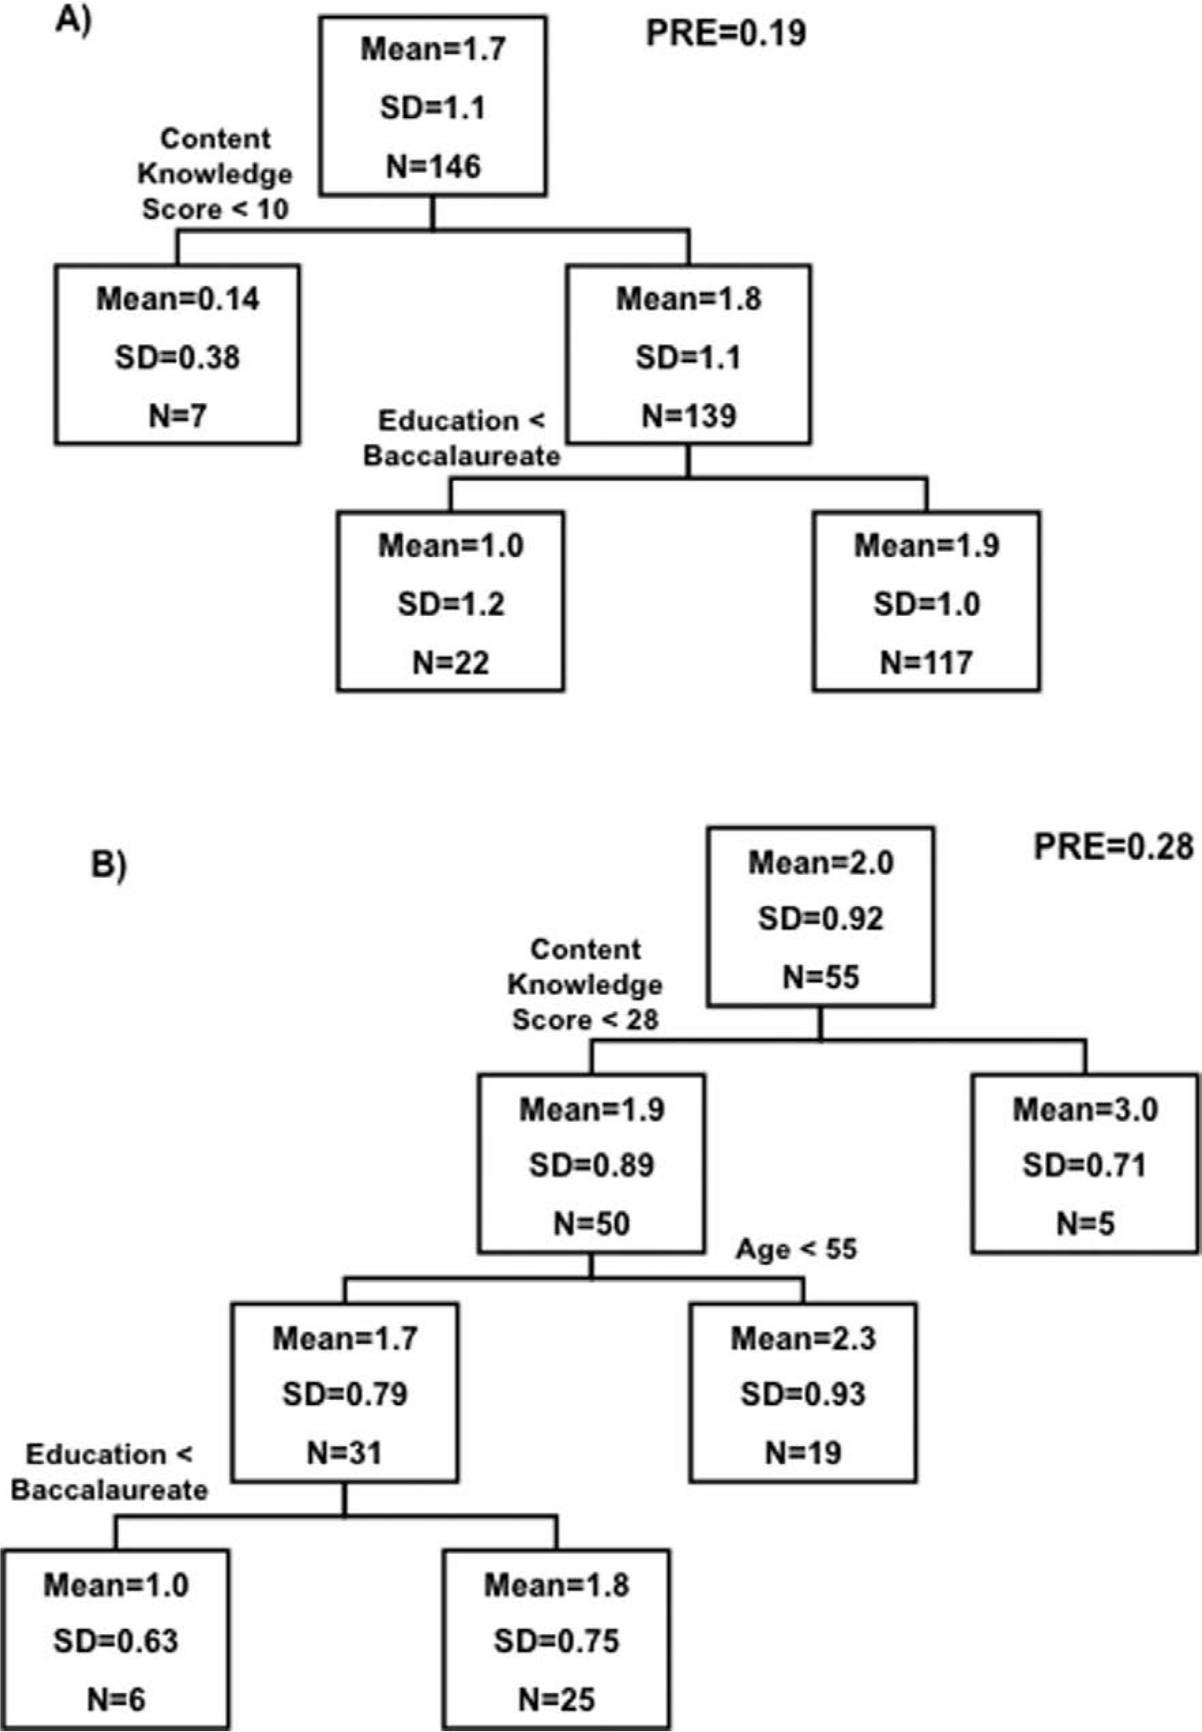
Regression tree analyses for pre-training (A) and post-training (B) science literacy scores for the control and treatment groups.
Attitudes toward science and the environment
The treatment and control groups from our study showed a slightly positive attitude toward science with MATOSS scores of 0.87 and 0.74, respectively. Responses to individual statements varied between citizen science programs and the general public, likely demonstrating the complexity of attitudes toward science in these diverse populations (Table 4; Brossard et al., 2005; National Science Board, 2008).
Percentage of responses to the MATOSS and the NEP/humans with nature subscale statements for the NIISS and TBN studies prior to participation (Brossard et al., 2005).
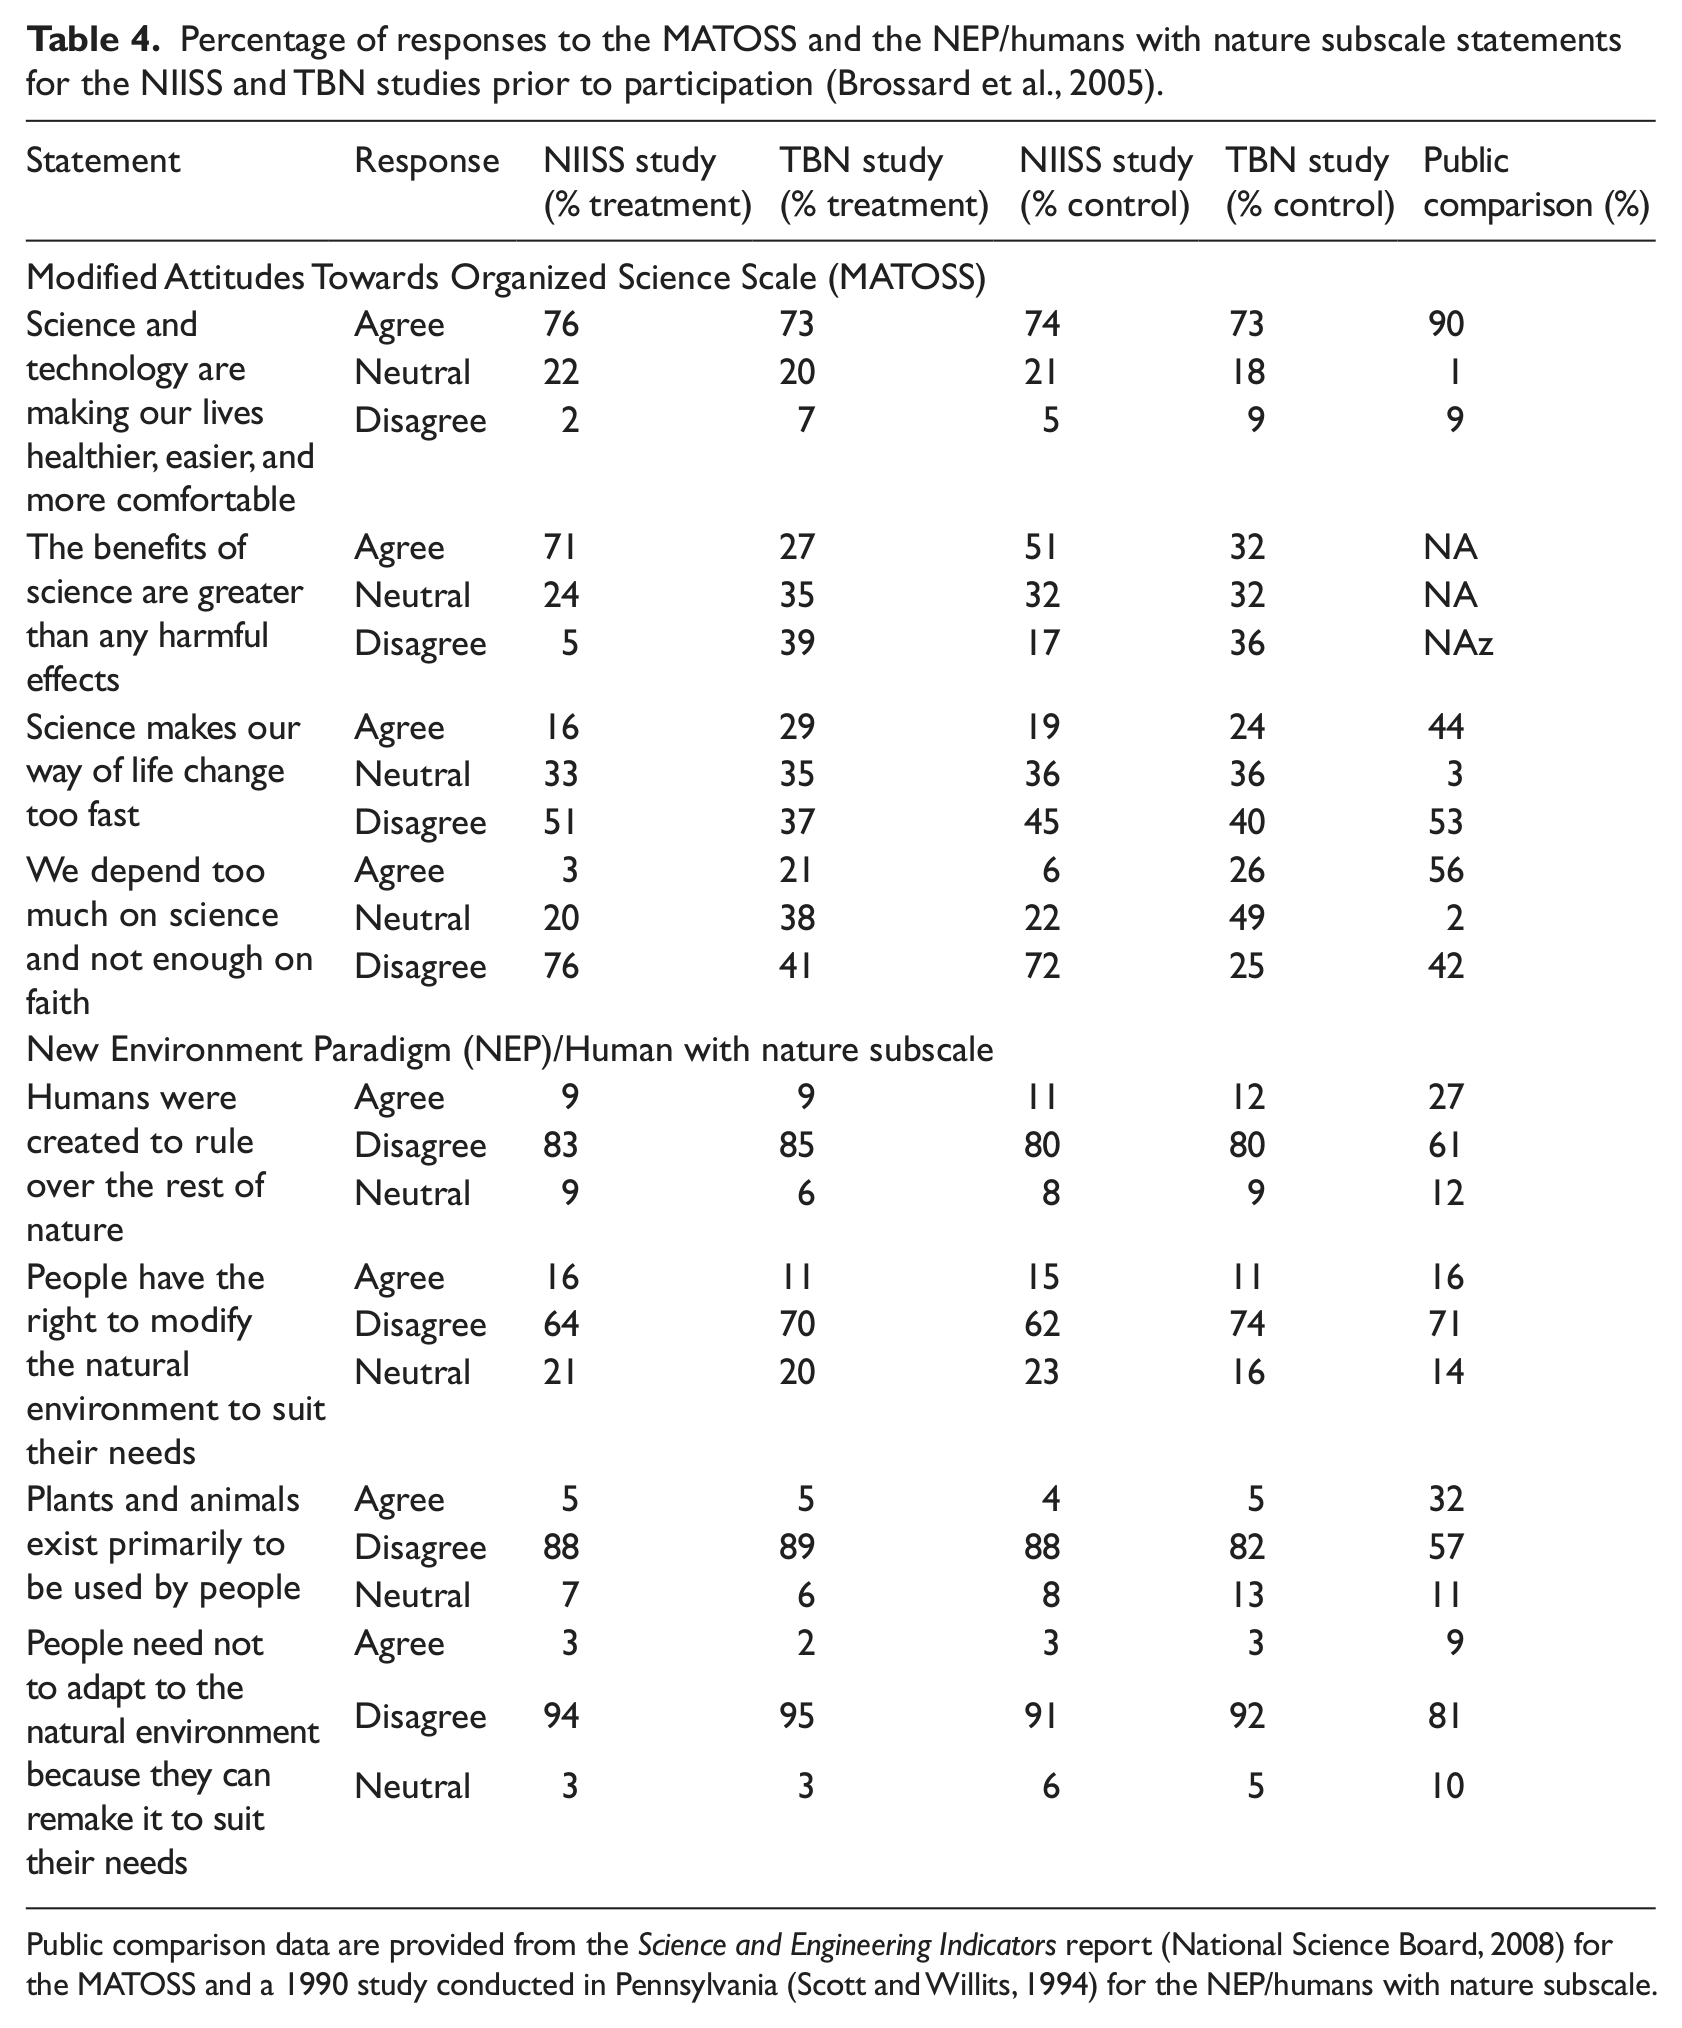
Public comparison data are provided from the Science and Engineering Indicators report (National Science Board, 2008) for the MATOSS and a 1990 study conducted in Pennsylvania (Scott and Willits, 1994) for the NEP/humans with nature subscale.
Participants in both citizen science programs expressed similar environmental attitudes (Table 4; Brossard et al., 2005). Participants had low NEP scores (treatment: 0.41; control: 0.42; Table 4), and these scores did not differ between pre- and post-training. Generally, citizen science program participants had lower scores than the general population (Table 4; Scott and Willits, 1994). Treatment and control groups had similar attitudes toward science (t = −0.95; p = 0.35) and toward the environment (t = −0.66; p = 0.51). No differences existed between pre- and post-training scores for attitudes toward science (t = 1.2; p = 0.22) or the environment (t = 0.06; p = 0.95).
Personal engagement and behavior
Participants in the treatment and control groups participated in activities measuring behavior at similar frequencies (treatment: 2.17; control: 2.29; t = −0.90; p = 0.37). We found significant difference in current behavior and planned behavior following the training (t = −6.4; p = <0.01), a finding that provides needed data to support the belief that such changes might occur (Bonney et al., 2009a).
Potential effects of experience on knowledge and attitudes
Treatment and control groups had similar levels of experience (2.4±0.10 vs. 2.2±0.08). Interestingly, the experience index did not appear to be correlated with the science literacy score, attitude toward science index, or GPS knowledge score. All the variables positively correlated with the index explained little variation in invasive species knowledge (R2 = 0.08; p < 0.01), vegetation monitoring knowledge (R2 = 0.11; p < 0.01), or attitude toward the environment (R2 = 0.06; p < 0.01).
5. Discussion
The growth in citizen science programs over the past two decades suggests that we need to evaluate their effectiveness in meeting educational goals (Cohn, 2008; Bonney et al., 2009b). Here we found that participation in an invasive plant citizen science training program resulted in content learning gains, an increase in process skills, and an increase in self-reported intention to engage in pro-environmental activities (also see Crall et al., 2011).
Our results must be interpreted with some caution. Krippendorff (2004a) recommends that alpha statistics ranging between 0.67 and 0.80 be used for drawing tentative conclusions only. Alpha values may have improved in our study by limiting the number of coding categories, but we did not want to lose the level of detail provided by our analyses. In addition, this study reflects one point in time. We tried to compensate for this weakness by looking for changes across individuals based on prior experience. A longitudinal dataset should provide additional insight into some of our findings, but collection of these data was beyond the scope and financial resources of this study.
Science literacy
Citizen science program participants appear to be more scientifically literate than the general population according to this and other studies. However, the low percentage of participants able to provide an acceptable description of a scientific study suggests that improvements should be possible. Brossard et al. (2005) found no statistically significant evidence suggesting that TBN participants changed their understanding of the scientific process. Our results supported this finding when using the same SEI instrument as TBN to measure scientific understanding. Similarly, Jordan et al. (2011) found little change in process understanding in the Spotting the Weedy Invasives project. In this study, the authors borrowed from the Nature of Science (Lederman et al., 2002) and Image of Science (Driver et al., 1996) scales and focused on two process skills: correlations versus causation and controlling variables strategy.
The lack of a correlation between prior experience and participants’ science literacy suggests that science literacy may not improve with additional years of participation, but examination of a modified experience index (in contrast to the one used in this study) and extensive longitudinal datasets are needed to examine this relationship further. For future programs, more focus should likely be placed on putting the material presented in context of the scientific method (Lewenstein and Bonney, 2004; Brossard et al., 2005; Bell et al., 2009).
In addition, Bonney et al. (2009a) recently described different models of public participation in scientific research projects based on level of engagement in the scientific process: contributory, collaborative, and co-created. For contributory projects, like citizen science projects, scientists design programs for which members of the public primarily contribute data and engagement in science may be limited. For collaborative projects, scientists design the program but the public spends much time refining project design, analyzing data, or disseminating findings in addition to contributing data. Co-created projects are designed by scientists and the public working together to address research questions of common interest with participants actively involved in most steps of the scientific process. Here, participants largely drive project goals and might be expected to mentally and emotionally invest in the project. Because these projects are designed to meet specific community needs, they are more likely to draw concerned citizens into science that might not otherwise be involved in such activities. The review demonstrated that the more individuals are involved with all aspects of the scientific process, the more likely they will demonstrate increased learning outcomes. Additional research is needed to provide support and further development of these models.
Brossard et al. (2005) discussed the possibility of participant motivation being a potential contributor to what material is learned and/or retained. For example, general interest in science was not a primary reason for individuals to participate in our program. Instead, most participants attended out of interest in the specific content provided by the training. This notion is further supported by the improvement the training made on participants’ knowledge of invasive species, global positioning systems, and vegetation monitoring and improvement in participants’ proposing of valid research questions and sampling designs. Shifts in the percentage of participants who wrote research questions and sampling designs specific to those discussed in our trainings also occurred. Cover estimates provide good measures of abundance for plant species, and the number of participants who wrote research questions related to abundance increased. The number of participants providing a valid sampling design increased and provided evidence that the program influenced the ability of participants to develop appropriate methods to answer a research question of interest.
The change seen among participants in science literacy using these context-specific measures is relevant to the question of how science literacy should be measured in formal and informal settings (Bauer et al., 2007). More specifically, participants likely applied the content and process knowledge learned to experiences relevant to them (i.e., free-choice learning; Dierking, 2005; Falk, 2005; Meyers, 2005; Falk et al., 2007). Other studies that examined the role of a contextual model for defining science literacy in informal environments as well as ours support this conclusion (Wynne, 1992; Gross, 1994; Wynne, 1996; Bauer et al., 2007; Cronje et al., 2011).
Attitudes toward science and the environment
The attitudes an individual has toward science and the environment are complex and can be difficult to measure (Miller, 2004; Brossard et al., 2005). This is especially true for audiences that may already have strong positive attitudes compared to the general population (Brossard et al., 2005). This may account for our findings not supporting our hypothesis that attitudes would improve following participation in our training program and across level of experience. Our participants showed a slightly positive attitude toward science and a strong positive attitude toward the environment prior to participation.
Our findings are consistent with the TBN study and may reflect similar factors (Brossard et al., 2005). Brossard et al. (2005) discussed the possibility that TBN educational materials did not include enough persuasive content that would result in attitude changes as expected under the elaboration likelihood model (Petty and Cacioppo, 1981, 1986). Therefore, changes in the way our materials were presented could have produced a different result with respect to attitudes for our study, but this was not the case. Our program involved a day’s training with direct contact between program leaders and participants, with educational content to augment the training presentations. In contrast, educational materials were sent to TBN participants and the time spent studying these materials was unknown. Interactions among TBN participants with TBN staff by phone, email or an electronic mailing list were encouraged, but not required. Future studies should explore how diverse interactions between program leaders and participants might affect changes in attitudes.
Our results and TBN’s demonstrate that citizen scientists have stronger positive attitudes toward the environment than the general public (Scott and Willits, 1994; Brossard et al., 2005). Due to this, the standard questionnaire used to detect changes in environmental attitudes may cover the wrong scale, making it insensitive for these groups. To account for this ceiling effect, more specialized environmental attitude statements should be included (Bell et al., 2009). Questions designed to examine changes in attitudes specific to the training might also prove more effective. For example, our program could add questions to evaluations regarding attitudes toward invasive species issues (e.g., “I think most of the concern about invasive species has been exaggerated,” “I am concerned about the issue of invasive species,” or “There are already enough laws to protect the environment from invasive species”).
Another possible explanation for not finding any changes in attitudes in both studies relates to their short duration (one day and one field season). Typically, changes in attitudes among adult populations require multiple interventions over long periods of time (Merriam et al., 2007). Additional interventions may be needed for the effects of these programs to affect participants’ attitudes. Because many volunteers participate in several citizen science programs, collaboration among informal science education programs on evaluation design might be essential to detect these changes. A majority of our study’s participants were extremely satisfied with the training program, so it is likely these individuals would return to other like trainings when the opportunity arose.
Personal behavior and engagement
The review conducted by Bonney et al. (2009a) concluded that behavior change is possible through the public’s involvement in scientific research although there is currently little evidence to support this. Slight changes in behavior were evident in participants of the Spotting the Weedy Invasives citizen science project (Jordan et al., 2011). The degree to which behavior change occurs might relate to the breadth and amount of an individual’s participation (i.e., contributory versus co-created project; Bonney et al., 2009a). Our study found significant changes in current behavior and planned behavior among our volunteers, but additional research will be needed to determine if planned changes in behavior result in actual behavioral changes. Might behavior change be more substantial in projects where participant investment is greater? Such questions need additional research.
6. Conclusions
Although this study has provided additional insight regarding the role of citizen science programs on participants’ attitudes, behavior, and science literacy, it is difficult to compare among other projects. This difficulty underscores the need for standardized measures to compare results of surveys across multiple audiences (the general public and citizen scientists). These should be developed to capture changes within informal science education programs, including subscales to incorporate training-specific subjects (e.g., invasive species, birds). Our study was only able to assess education impacts after a day of training, so quantitative and qualitative data from participants collected over time will be needed to make better assessments within these impact categories. Many citizen science programs work on similar conservation issues and should collaborate to provide enhanced and coordinated experiences across programs.
The framework for evaluating informal science education projects developed by NSF provides a strong basis for development of evaluation materials to meet the needs of numerous citizen science programs (Friedman, 2008). Our study made use of this resource and findings provided in Brossard et al. (2005) to begin assessing the best ways to evaluate these programs. The recently implemented DEVISE project (Developing, Validating, and Implementing Standardized Evaluation Instruments) spearheaded by Cornell University will help professional science educators obtain strategies and tools for evaluating the educational and social impacts of informal science education projects with an emphasis on projects that engage the public in scientific research.
Once developed, these measures could be disseminated to the larger citizen science community using existing and developing cyberinfrastructure resources. A citizen science website (www.citsci.org) providing customized project development allows project managers to customize online data entry forms (Crall et al., 2010). Forms are developed using a standard set of biotic and abiotic variables that allow data across projects to be pooled into a common data source. These same customization features may provide the technology necessary for diverse projects to create customized evaluations using a standard set of evaluation measures (Newman et al., 2011). Because some volunteers may be members of multiple projects, login information can provide the longitudinal data needed to track individual changes over time. As citizen science and other informal science education programs continue to grow, developing these and additional tools assumes increased importance.
Footnotes
Acknowledgements
This work was funded by the National Science Foundation under grant number OCI-0636213. DMW was supported by the NSF - Ecology program (DEB-0717315) and National Research Initiative grant #2008-35320-18680 from the USDA National Institute of Food and Agriculture Biology of Weedy and Invasive Species program. Logistical support was provided by the Natural Resource Ecology Laboratory at Colorado State University, the USGS Fort Collins Science Center, the University of Wisconsin-Madison Arboretum, and the Colorado State University Environmental Learning Center. Special thanks to Marian Farrior, Brad Herrick, and Brendon Panke, who helped coordinate the event at the Arboretum. The authors would also like to thank Rick Bonney, Alan Knox, Pete Nowak, Tina Phillips, Mark Renz, and Jake Vander Zanden for providing edits to earlier drafts of this manuscript. We would like to especially thank all the citizen scientists who participated in our training.