
Abstract
Photographs are widely used to visualise science. However, the influence of visual quality of photographs on the effectiveness of science communication is often disregarded and seldom tested. This study examines how the visual quality of photographs affects science communication on interpretive signage within Xixi National Wetland Park, China. Results show that a high-quality photograph on the signage significantly increased the following affective and cognitive aspects of communication: (1) a visitor’s intention to read the signage, (2) enjoyment of reading the interpretive information, (3) understanding and (4) recall of the information on the signage. This study offers empirical evidence for the benefits of using high-quality photographs to visualise science. To improve the effectiveness of science communication in interpretive products, we argue that the quality of the selected photographs should be considered seriously.
1. Introduction
Visualisation by figurative graphics (e.g. photographs and drawings) has been considered a powerful and widely used tool to increase the public’s interest and understanding of science (Frankel and DePace, 2012; Houts et al., 2006). Curtis et al. (2012) noted that visual arts such as images could synthesise complex scientific facts and ideas in an engaging form, which makes the scientific discourse more attractive and easier to understand (Houts et al., 2006). Given this, researchers have been increasingly interested in whether and how different types of images can enhance science communication (Frankel and DePace, 2012; Hansen and Machin, 2013; Houts et al., 2006).
The effectiveness of images for science communication can be classified into two aspects: cognitive and affective, which represent two of the most important outcomes of successful science communication (Burns et al., 2003). First, individuals who read scientific information alongside relevant images performed much better in knowledge recall compared with those with the same information without any images (Delp and Jones, 1996; Patel et al., 1990). For example, Patel et al. (1990) conducted a study in Africa with the context of the preparation and administration of treatment for dehydration. Results suggested that participants could recall more information after reading the material with pictures compared with the material without any pictures.
Second, images may evoke positive emotional responses that enhance attention and engagement (Houts et al., 2006; Serafini, 2011; Van Dijck, 2008). In a health communication study, Delp and Jones (1996) gave half of their patients’ treatment instructions in a handout with images, but gave the other patients handouts with no pictures: patients with an illustrated handout (text plus pictures) were more likely to read it. Earlier, Levie and Lentz (1982) and Levie (1987) had reported that children preferred stories with images than those without images, since the visual representation was more enjoyable for them.
Many types of images have been used to communicate science to the general public, such as photographs, drawings and diagrams. Among these images, photographs, as a form of contemporary art, have their specific importance and advantages (Carr, 2012; Frankel, 2001; Husain et al., 2017). Not only can such visual arts evoke emotions (i.e. affective outcomes; Curtis et al., 2012; Silvia, 2005), but photographs are able to present the real status of creatures, objects or scenes in a relatively objective and appealing way (Caivano, 2008; Curtis et al., 2012; Husain et al., 2017). For instance, tiny insects and unfamiliar endangered birds are difficult to encounter and identify for the majority of people. Through photographs, the public are provided visual access to such creatures, which may increase their understanding of associated science stories (Antal et al., 2020; Houts et al., 2006; Husain et al., 2017). Another reason for emphasising photographs here is that they are both quick to produce and easy to appreciate compared with other types of images requiring artistic investment (Henkes, 1975; Jacobi and Schiele, 1989; Schifanella et al., 2015; Van Dijck, 2008). Nowadays, photographs are used commonly by both the science community (Carr, 2012; Findlay, 2016; O’Connell et al., 2010) and the general public (Statista, 2018; Van Dijck, 2008). Photographic images can, therefore, provide a link between scientific stories and the public (Betts and McNaughton, 2003; Caivano, 2008; Carr, 2012).
When considering how photography enhances science communication, the visual aesthetic quality of photographs needs to be taken into account (Frankel, 2001; Husain et al., 2017). Given that such visual quality may significantly influence the visual appeal of a photograph and an observer’s emotional responses (i.e. affective responses; Redi and Povoa, 2013; Slykhuis et al., 2005), integrating a visually appealing photograph into science stories may well have positive implications for the effectiveness of communication (Antal et al., 2020). However, there is still a lack of empirical research on how and to what extent photographs with different visual qualities can affect their outcomes in the field of science communication, and this is especially so regarding signage for visitors to national parks.
2. Can high-quality photographs enhance science communication within national parks?
National parks, because of the significant natural and cultural heritage protected within their boundaries, are attractive destinations for tourists (Hvenegaard and Dearden, 1998; Hwang et al., 2005). Even though there are a variety of reasons given by tourists for visiting a national park, there is an almost universal consensus that learning about or connecting with nature (e.g. nature excursions, biodiversity encounters and education) is one of the most vital motivations to visit such parks (Sharma and Gupta, 2020; Van der Merwe and Saayman, 2008). Given that most park visitors are not nature specialists (Akama and Kieti, 2003; Arabatzis and Grigoroudis, 2010; Scholtz et al., 2013), the interpretation of local natural attractions plays, therefore, an important role in enabling visitors to enrich their experience of protected areas and increase their understanding of nature (Department of Conservation, 2005; Tubb, 2003).
Within national parks or other protected areas, interpretation is defined as ‘an explanation of the natural, cultural or historic values attached to places’ (Department of Conservation, 2005: viii). Here, nature interpretation can be considered as science communication about such scientific subjects as biodiversity, geology and conservation (Tilden, 2009). The effective interpretation of nature stories enables visitors to gain interests, understanding and awareness of local natural attractions in an enjoyable way (Department of Conservation, 2005; Ismail, 2008). The potential effectiveness of such interpretation closely aligns with the general goals of science communication: awareness, enjoyment, interest, opinion-forming and understanding (Burns et al., 2003).
When discussing nature interpretation within the context of science communication, the role of photographs should not be disregarded: visualisation can be one of the most effective means of science communication. Potentially, photographs can be a powerful tool to present scientific stories about nature (Frankel and DePace, 2012; Houts et al., 2006). However, even though the use of photographs has been proven to help to communicate science, and even though the use of imagery is widespread in interpretative materials (e.g. signage) in national parks (Dandan, 2012; Department of Conservation, 2005; Province of Nova Scotia, 2008), there has been no research or empirical evidence to measure the contribution that photographs make to science communication within national parks. Thus, this study focused on how photographs with different visual qualities can engage people and, thereby, improve the effectiveness of science communication through nature interpretation products within national parks. Considering suggestions from the works of Burns et al. (2003) and Ham and Weiler (2006), the effectiveness of the interpretive signage for communication was measured by affective outcomes (e.g. general attractiveness and reading engagement) and cognitive outcomes (e.g. understanding and recall of knowledge; Burns et al., 2003; Ham and Weiler, 2006; Tilden, 2009). This measurement was undertaken via a survey of visitors to China’s Xixi National Wetland Park (XNWP), who viewed interpretive signs on which the qualities of the photographs had been manipulated.
3. Methodology
The design of the manipulated interpretive signage
The study area is a Chinese national park in Zhejiang Province: the XNWP. The content (layout, text and image) of interpretive signage was manipulated so as to make it possible to analyse the influence of a single element (i.e. the photograph) on the attention of visitors and its effectiveness for communication. Three manipulated interpretive signs were set up successively within XNWP. Photographs with different visual appeal were incorporated onto the manipulated signs, while all their other elements (layout and textual information) remained the same.
The scientific content in the manipulated signs was about the Common Kingfisher (Alcedo atthis). This bird species was used as the subject because it is one of the most common, widespread and recognisable wetland birds in China (Zhao, 2001). Common Kingfishers are abundant in XNWP, and their shining plumage makes it easy to identify the species, although they are difficult to locate in the wild due to their small body size, which ranges from 15 to 18 cm (Zhao, 2001). Unless one is a skilled birdwatcher, most general tourists are not likely to see this bird. Additionally, its behavioural and ecological traits, together with the details of its plumage colours, are unlikely to be unknown to most Chinese tourists, making the Common Kingfisher an ideal species for this field work.
The same text information about the Common Kingfisher was on each of the three variants of the manipulated signs alternated during the field survey. There were three sections of textual information on each sign. The first section was a general introduction to the Common Kingfisher, including taxonomy, plumage colours, distribution, habitat and so forth. The second section was Six Interesting Facts about a Common Kingfisher, which interpreted some of the unique morphological and behavioural characteristics of this species. The final section pointed out the relationship between Common Kingfishers and wetland conservation from ecological and conservational perspectives. Apart from the scientific name of the bird, all the textual information was presented in Chinese for the mainly Chinese audience.
Different qualities of images were used in the same position on the three signs. Specifically, a high-quality photograph of Common Kingfisher was organised on the first sign (Figure 1a), while the second sign presented a poor-quality photograph of Common Kingfisher (Figure 1b). On the third sign, a logo of XNWP was used instead of a photograph (i.e. the ‘control’ group, Figure 1c).

Three manipulated interpretive signage for the survey in XNWP: the signage with a high-quality photograph (a), with a poor-quality photograph (b) and the control group without a photograph (c). Photographer (a): Martha de Jong-Lantink (CC BY-NC-ND 2.0). Photographer (b): Charles Lam (CC BY-SA 2.0).
The visual qualities of the selected photographs were measured based on the aesthetic scores using an online application: Acquine (Datta and Wang, 2010). Acquine measures the aesthetics of images based on a combination of computational aesthetic assessment and the judgement from human observers Datta et al. (2006) and Datta and Wang (2010). According to Acquine, the high-quality photograph of the Common Kingfisher had an aesthetic score of 8.9 out of 10.0 while the score of the poor-quality one was 4.6, reflecting a noticeable difference in visual quality. Photographs were selected and downloaded from www.flickr.com based on a Creative Commons (CC) Licence (Creative Commons, 2017).
Survey design
The field work was conducted over three equal time periods, all located at the same place: south of the main walk path in XNWP, from June to July 2017. One of the three manipulated signs was displayed during each time period. Each sign’s effectiveness was measured via field observations of tourists’ willingness to read the signage as well as a questionnaire testing the effectiveness of the manipulated signage to communicate science.
During the field observations, the researcher was located approximately 15–30 m away from the sign and recorded whether a pedestrian stopped to read the sign (i.e. stood still and looked at the signage) or just passed by without stopping. When observing the visitors, we did not say or do anything that potentially attracted visitors’ attention. Therefore, the only reason that might make visitors stop was the signage itself. The results were recorded as the frequency (i.e. the number of people) of stops and ‘passing’ under the three different experimental conditions (i.e. different signage). The time of the observation under the three conditions was the same (from 10 am to 12 am during all the three time periods), so that the frequencies of stops for the three experiments were comparable.
A questionnaire survey was used to examine the specific role of photographs during the reading experience and post-reading response. Individuals in the research area (i.e. south of the main walk path in XNWP) were randomly invited to read the sign and complete the questionnaire, but no more than one person per group of visitors participated in the survey.
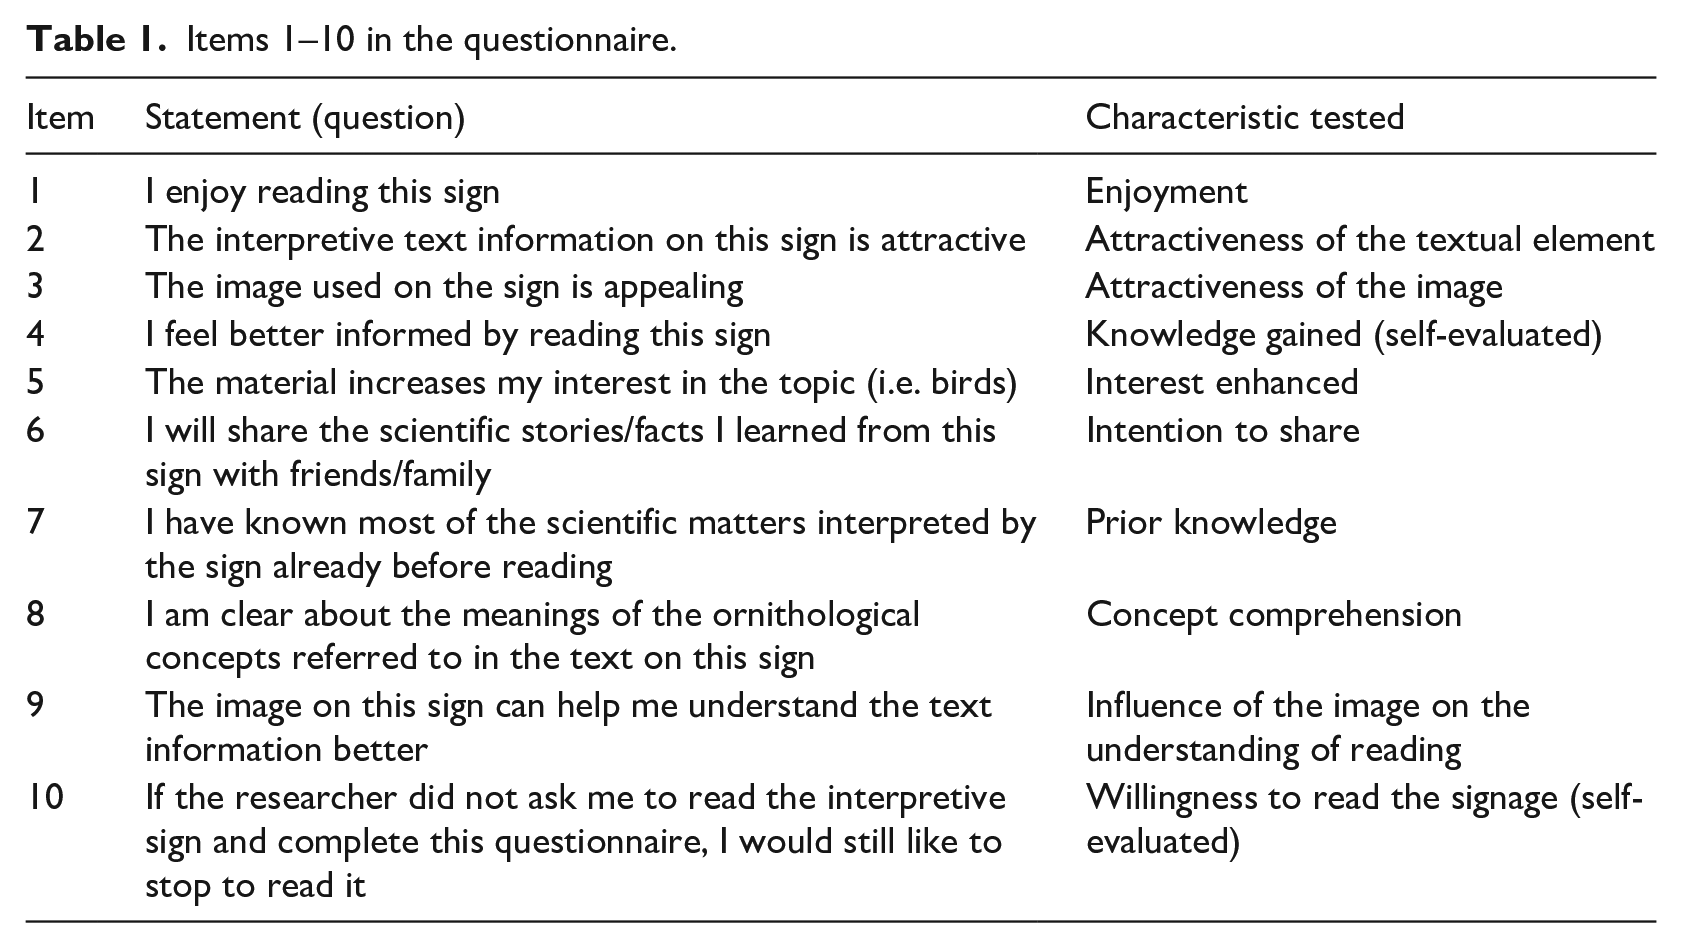
The survey consisted of three sections in total. The first section had a series of socio-demographic items: age, gender, education and the participant’s interest in birds. The second section examined the effectiveness of the signage for science communication (Ham and Weiler, 2006), including the participant’s evaluation of the attractiveness of the photographic and textual elements of the sign, their prior knowledge of the subject, as well as a statements on reading experience (e.g. enjoyment, understanding, interest enhanced) and post-reading response (items 1–10, see Table 1). Some of the items testing comprehension, enjoyment and supports were developed from the works of Burns et al. (2003) and Macedo-Rouet et al. (2003), while others were designed based on the elements and detailed content of the scientific information about Common Kingfisher contained in the signage. A 5-point Likert-type scale (from ‘strongly disagree’ to ‘strongly agree’) was applied to describe a participant’s perceptions of the statement associated with each item.
Items 1–10 in the questionnaire.
Once a participant completed all the items above, the researcher would turn over the sign. The participant was, thereby, not able to read the signage when completing the next section in the questionnaire. The last section of the questionnaire (Items 11–18) was a knowledge test on the scientific information contained in the signage. This test included eight questions covering the visual traits (four questions) and behavioural traits (four questions) of the Common Kingfisher (see the visual and behavioural groups in Table 2), included in the textual information on the signage. While the information tested with regard to visual traits was also apparent in the photographs (both high-quality and poor-quality photographs), there were no such visual clues available to participants in the control group, who were presented with a logo on the sign instead of a photograph of a Common Kingfisher.
Questions in the knowledge test section.
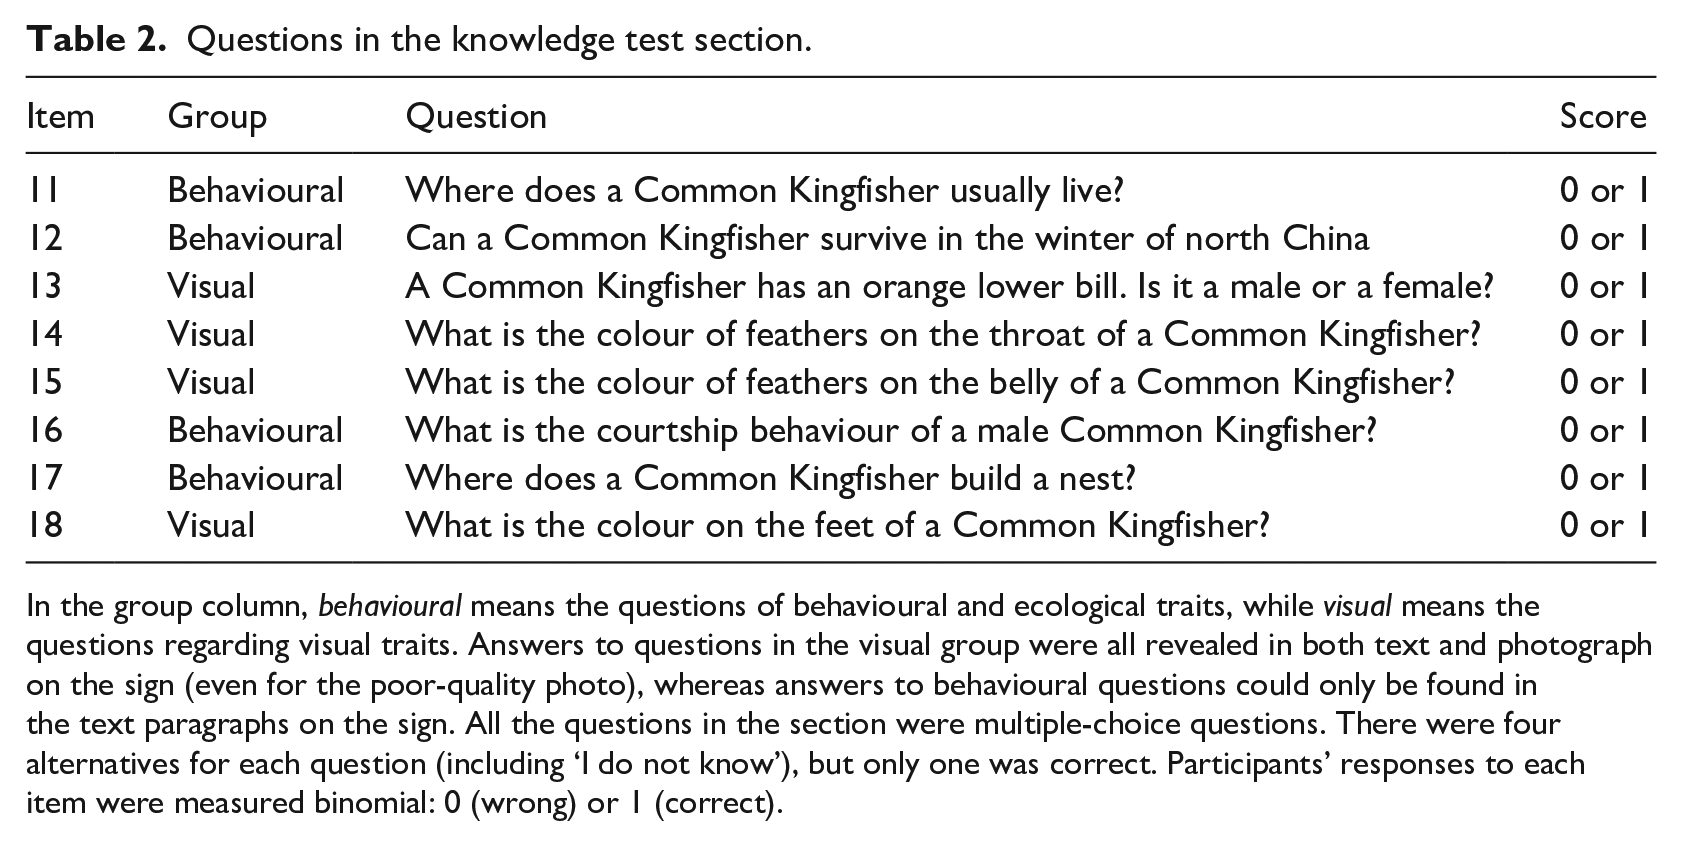
In the group column, behavioural means the questions of behavioural and ecological traits, while visual means the questions regarding visual traits. Answers to questions in the visual group were all revealed in both text and photograph on the sign (even for the poor-quality photo), whereas answers to behavioural questions could only be found in the text paragraphs on the sign. All the questions in the section were multiple-choice questions. There were four alternatives for each question (including ‘I do not know’), but only one was correct. Participants’ responses to each item were measured binomial: 0 (wrong) or 1 (correct).
As shown in Table 2, the total scores for all the visual and behavioural questions were calculated separately, generating two new variables for the subsequent analysis: the sum of the scores for the four visual questions (Items 13, 14, 15 and 18, noted as SumVisual) and the sum of the scores for the four behavioural questions (Items 11, 12, 16 and 17, noted as SumBehavioural), reflecting the extent of knowledge recall after reading for each participant. It is thus possible to check how photographs can affect participants’ performance on knowledge recall.
Data analysis
To avoid potential bias from personal interests when testing the effectiveness of science communication, the participants’ interest in birds was used to cluster respondents. Participants were divided into three groups according to their self-declared interests in birds when completing the questionnaire: specialised bird watchers or bird enthusiasts (SB), people with a general interest in birds (GB) and those are not interested in birds (NB).
From observation data findings, a chi-square test was adopted to compare the frequencies of stops (reading) and scans among the three signs (Pallant, 2013), with post hoc pairwise comparisons using a z-test (Sharpe, 2015). For the questionnaire, we grouped the correlated items by factor analysis to check whether participants’ perception of the visual quality of the photograph is related to one or more aspects of the effectiveness of science communication. A p component analysis (PCA) was used to extract factors (Lambert et al., 1990). For the knowledge test, the variable SumVisual (sum of the scores for all the visual questions) and SumBehavioural (the sum of the scores for all the behavioural questions) for each participant were used to describe the participants’ knowledge recall of the visual and behavioural facts presented in the signage. One-way and multi-factor ANOVAs were applied here to explore the potential difference of the test scores (SumVisual and SumBehavioural, respectively) among different groups and subgroups. SPSS Version 24.0 was used to conduct the statistical analysis.
4. Results
To read or not to read? Observation on the attractiveness of the manipulated interpretive signs
A total of 2705 tourists passed by the manipulated signs during the field work observations. Frequencies of stops were transformed into proportions of the number of stopped visitors to the total number of visitors passing by. The chi-square test identified that visitors’ intention to read was significantly affected by the manipulation of images (Pearson’s chi-square = 56.36, p < .001 for the proportions of the frequency of reading to the total passing). Specifically, the sign with a high-quality photograph received the highest proportions of stops (16.4%), while the sign without a photograph (i.e. the control group) had a much lower attractiveness (8.7%), the pairwise comparison also suggested a significant difference between the above two groups (Pearson’s chi-square = 25.04, p < .001). Finally, the sign with a poor-quality photograph had the lowest proportion of stops among the three groups, accounting for 5.9% of all the tourists who passed by that sign. The pairwise comparison also gave a significant difference between the poor-quality and the control groups (Pearson’s chi-square = 5.06, p = .025).
Linking qualities of photographs with reading experience
A total of 1216 participants completed the questionnaire. The socio-demographic information (see the supplemental material) showed that younger people (age between 18 and 34 years) comprised 34.0% of the total participants, which is higher than the average for the same age group in Hangzhou city (22.3%; Bureau Hangzhou Statistical, 2018). Moreover, 86% of the participants had completed tertiary education, which is not reflective of the national data in China and the city data for Hangzhou (Bureau Hangzhou Statistical, 2018; National Bureau of Statistics of China, 2017). A relatively young and well-educated sample population is probably because Zhejiang University, a major university in China, is located nearby, being only about one kilometre from the entrance to XNWP (Zhejiang University, 2017). The proportion of female respondents (52.0%) was slightly larger than that of males (47.4%), presenting a similar gender ratio to the data of Hangzhou city (Bureau Hangzhou Statistical, 2018). Only 9.4% declared themselves as knowledgeable bird enthusiasts (SB), the majority of participants not having specific knowledge about birds (GB or NB), though 48.4% declared themselves as generally interested in birds.
The ten items in the second section of the questionnaire evaluated visitors’ experiences of reading the manipulated signs (Cronbach’s alpha = .769). Factor analysis extracted the different aspects of the effectiveness and clarified the aspect in relation to photographs. Factors were extracted via PCA and then subjected to a varimax rotation, so that the results could be better interpreted (Pallant, 2013). A total of three factors were extracted, explaining 64.8% of the total variance (Table 3).
Three dimensions of evaluating the effectiveness of the manipulated signs for science communication.
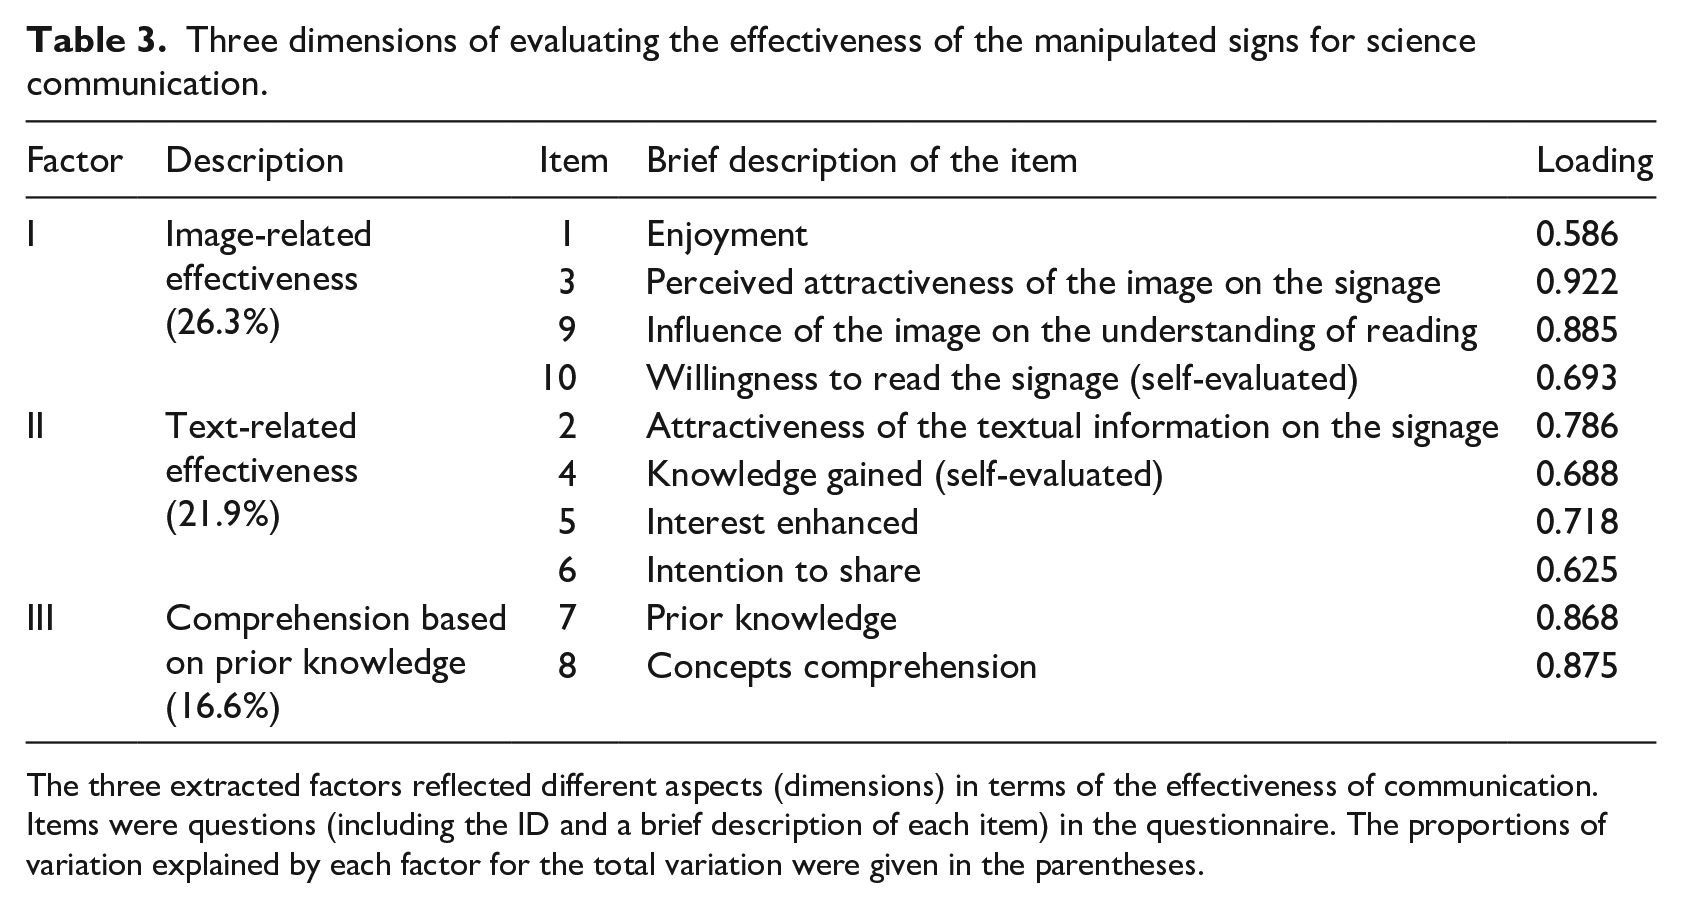
The three extracted factors reflected different aspects (dimensions) in terms of the effectiveness of communication. Items were questions (including the ID and a brief description of each item) in the questionnaire. The proportions of variation explained by each factor for the total variation were given in the parentheses.
Factor 1 (image-related effectiveness), was the most important factor. It tested the perceived visual appeal of the image on the signage (Item 3) and had a loading of 0.922, suggesting this factor was closely related to the perceived visual quality of photographs. The perceived visual appeal of images here was basically determined by the manipulation of visual quality: a high-quality photograph means a significantly higher perceived appeal (ANOVA, F = 1709.02, p < .001; post hoc test after ANOVA: p < .001 between the high-quality group and any of the other two groups, p = .83 between the poor-quality and the control groups, tested by Item 3 in Table 1). Apart from the perceived visual appeal of images, three more outcomes were identified as the contribution of a high-quality photograph by this factor: compared with the poor-quality and the control groups, the signage with a high-quality photograph promoted understanding of reading (Pearson’s r = .79, p < .001 between visual appeal and understanding), enhanced enjoyment of reading (Pearson’s r = .47, p < .001 between visual appeal and enjoyment of reading), and increased perceived willingness to read (Pearson’s r = .62, p < .001 between visual appeal and perceived willingness to read).
Factor 2 suggests the attractiveness of the text, rather than images, was correlated to the three aspects (Items 4, 5 and 6) of the effectiveness of communication. It was, therefore, named as text-related effectiveness. It explained 21.9% of the total variance, which was just slightly less than that of the first factor. This factor was described by participants’ evaluation of the text, knowledge gained, interest enhanced as well as intention to share, suggesting attractive textual content on the interpretive signage could better inform participants, increase their interests and encourage to spread information.
Factor 3 was characterised by participants’ prior knowledge and comprehension of the ornithological concepts appeared on the signage. This factor suggested a close relationship between prior knowledge and comprehension of the concepts interpreted by the signage. It is thus defined as the influence based on prior knowledge. This dimension is unaffected by visual quality: all the correlation coefficients between the visual appeal of photograph and any of the items above were not significant (Pearson’s r = .04, p = .10 between visual appeal and prior knowledge; r = 0.03, p = 0.14 between visual appeal and comprehension of the relevant ornithological concepts).
The knowledge test: Recall of knowledge acquired from the signage
The purpose of the knowledge test was to examine the recall of the scientific information interpreted by the signage and to find the potential role of the quality of photographs. As defined in methodology, SumVisual and SumBehavioural represented the sum of scores (i.e. number of correct answers) for the four visual trait questions and the four behavioural trait questions, respectively, which ranged between zero and four as there were four questions for each section. Both SumVisual and SumBehavioural were not affected by respondents’ age, education, sex and any interactions between these factors (multi-factor ANOVA, all p-values > .05). The visual qualities of photographs had a significant influence on SumVisual (multi-factor ANOVA, F = 26.62, p < .001), but not on SumBehavioural (multi-factor ANOVA, F = .23, p = .80), while participants’ interests in birds had a significant impact on both SumVisual (multi-factor ANOVA, F = 52.76, p < .001) and SumBehavioural (multi-factor ANOVA, F = 49.65, p < .001). Figure 2 shows the specific influence of the quality of photographs and interest on SumVisual (Figure 2a) and SumBehavioural (Figure 2b), respectively.
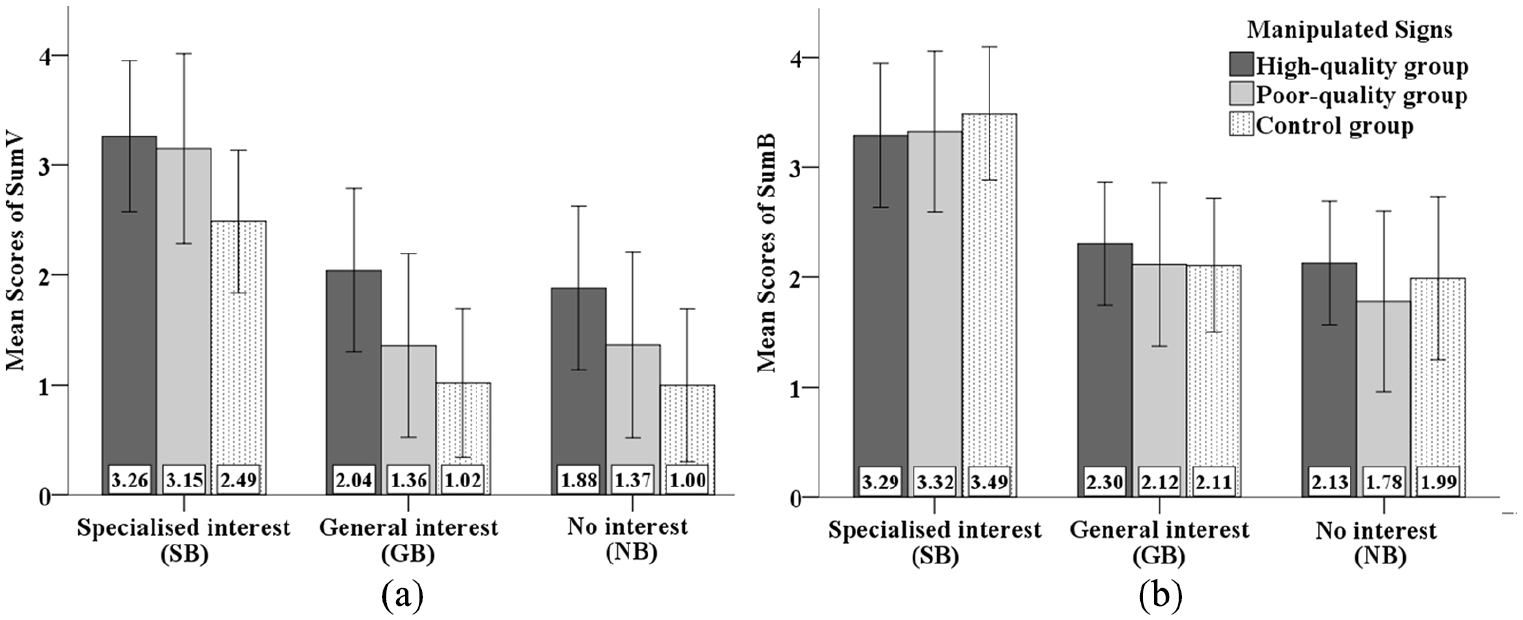
Distributions of scores of the knowledge test (in percentages), n = 1206. The mean scores of (a) SumVisual (questions regarding visual traits) and (b) SumBehavioural (questions regarding behavioural traits) across subgroups (three quality groups and three levels of interests) are given. Error bars present standard deviation.
The significant influence of interests on the results of the knowledge test revealed that participants might answer the test question based on their prior knowledge rather than the knowledge acquired through the signage, especially for those who were grouped as knowledgeable bird enthusiasts (SB). The mean score of SB was significantly higher than that of GB and NB in both parts of the knowledge test (for SumVisual: p < .001 between the mean scores of SB and GB, as well as SB and NB; for SumBehavioural: p < .001 between the mean scores of SB and GB, as well as SB and NB, post hoc tests after ANOVA). Given that, SB knew more about the Common Kingfisher, including the questions asked in this test, which was a factor that may impact the analysis on the role of visual quality in knowledge recall.
Taking the influence of interests (i.e. prior knowledge) into account, we compared the role of visual quality of photographs in knowledge recall within the three interest groups (see Figure 2), respectively. For SB, the use of a high-quality photograph did not help them recall more information about the visual traits (ANOVA, F = .41, p = .53) or the behavioural traits (ANOVA, F = .05, p = .82) of the bird.
The scores of GB and NB were comparable: visual quality had a significant influence on their recall of knowledge of both visual traits of the bird (ANOVA, F = 91.87, p < .001 for GB; F = 58.51, p < .001 for NB) and behavioural traits (ANOVA, F = 5.73, p = .003 for GB; F = 10.73, p < .001 for NB). As illustrated in Figure 2a, both GB and NB got significantly higher scores for visual trait questions (SumVisual) after reading the signage with a high-quality photograph than those in the poor-quality (p < .001 post hoc tests after ANOVA for both GB and NB) and the control groups (p < .001, post hoc tests after ANOVA for both GB and NB). Regarding the questions about behavioural traits (SumBehavioural), the mean score of respondents in the high-quality group was higher than those in the other two groups (p = .004, post hoc tests after ANOVA, between the mean scores of high-quality and poor-quality groups; p = .003, post hoc tests after ANOVA, between the mean scores of the high-quality and control groups). Similarly, NB in the high-quality group also recalled more information about behavioural traits than those in the other two groups (p < .001, post hoc tests after ANOVA).
5. Discussion
Intention to read an interpretive sign
This study examined the role of photographs in enhancing science communication from both affective and cognitive aspects. The affective outcomes included any emotional responses towards the interpretive signage (Ham and Weiler, 2006; Ismail, 2008). Among such emotional responses, willingness to read (i.e. attention) is one of the vital aspects of evaluating the effectiveness of signage for communication. This factor is important because if individuals are not attracted by the signage (i.e. decide not to read), they are unlikely to acquire knowledge through this signage. Results based on the observation suggest that the visual quality of the photographs had a significant influence on tourists’ intentions to read the signage: the more appealing the photograph, the more attractive the signage was to the tourists and the more likely it was to engage them in reading.
The relationship between appealing images and the audience’s emotional response (e.g. attention, enjoyment) has been explored by several scholars. For example, Redi and Povoa (2013) introduced the notion of observers’ visual attention deployed through judging the aesthetic appeal of images. A Korean study focusing on human brand images found that the appeal of images had a significantly positive influence on a customer’s visual attention and willingness to purchase the relevant product (Seo et al., 2012). For the interpretive signage used in this study, we looked at similar types of responses: to be attracted (attention) and to stop to read the signage (take action). Based on this attention-to-response procedure, both studies confirm the importance of high-quality images for people’s visual attention and their subsequent responses.
So why do visitors decide to read the interpretive signage within a national park? According to the observational results with the three manipulated signs, the visual quality of the photograph on the signage was the only significant element that affected tourists’ willingness to read. However, from the perspective of tourists, the attractiveness of the signage or the photograph was probably just one of the many factors that potentially motivated them to stop to read (Scherer et al., 2001). Tourists’ general attitudes towards the interpretive signage and their interests in the topic (e.g. the Common Kingfisher) interpreted on the signage may also play a role.
Interestingly, the attractiveness of the signage with a poor-quality photograph was even lower than that of the control group, although this apparent difference between the visitors’ perceived appeal of the images in the two groups was not significant. It should be noted that the poor-quality photo of Common Kingfisher used here had a very low aesthetic score (although the bird was still identifiable) and such a poor photograph would, hopefully, be unlikely to be used by most national parks under real circumstances. Nevertheless, this experiment revealed that the use of photographs does not always enhance science communication. Using a poor-quality photo may be no better than using no photographs at all and, potentially, may even decrease the overall attractiveness of signage.
The influence of a high-quality photograph: Affective and cognitive outcomes
The factor analysis reflected three distinct dimensions to evaluate the effectiveness of the signage: image-related effectiveness, textual content-related effectiveness and the influence of prior knowledge. The linkage between visual appeal and the effectiveness of interpretation was revealed by the first factor, which explained the largest proportion of the total variance in the factor analysis.
Participants’ experience of reading was more enjoyable and easier with the signage with a high-quality photograph. Such a positive influence of images on the enjoyment of reading had been identified by researchers previously (Houts et al., 2006; Levie and Lentz, 1982). However, they did not focus on how such a contribution of images to reading enjoyment was affected by the visual quality and appeal of the photographs. Our study suggests that only an appealing photograph can significantly enhance participants’ enjoyment. This finding reveals the importance of using high-quality photographs for communication, because enjoyment, as a positive emotional response, is considered to be an important aspect of the effectiveness (i.e. affective outcomes) of the interpretation of natural stories within national parks (Ham and Weiler, 2006) and the communication of science in other spheres, generally (Burns et al., 2003).
The relationship between the visual quality of photographs and understanding from reading can be explained by the role of visualisation in science communication: one of the major purposes of using interpretive signage within national parks is to increase tourists’ understanding of science stories (e.g. biology and geology; Department of Conservation, 2005; Tilden, 2009). As reported in the results, most participants were not knowledgeable in the particular topics interpreted by the signage (e.g. birds). Similarly, whether the general public has difficulty understanding the scientific material has also been a vital aspect of evaluating the effectiveness of science communication (Burns et al., 2003; Evans and Durant, 1995). Photography, as a means of visualising science, has become an appropriate way to visualise and abstract unfamiliar scientific information for the general public (Caivano, 2008; Henkes, 1975; Van Dijck, 2008), and can therefore improve understanding of reading in the context of interpretive signage. Also, photography can present natural subjects in an objective and appealing way, which may help tourists better understand the relevant interpretive content (Caivano, 2008; Curtis et al., 2012; Husain et al., 2017). The findings in the present study confirmed such contributions of photographs, but also emphasised that the contribution of photographs to science communication is significant only if photographs are of high visual quality.
The role of high-quality photographs in knowledge recall
We designed the knowledge test in the last section of the questionnaire to test the recall of the information interpreted on the signage. Results report a significant influence of the visual quality of photographs on knowledge recall: participants performed much better in the test after reading the signage with a high-quality photograph than the signage with the poor-quality photograph and the control group. This trend was especially noticeable in the visual trait section (corresponding to SumVisual in the results, see Figure 2 for the comparisons of the mean scores across different subgroups).
The linkage between the high-quality photograph and knowledge recall may be explained from the perspective of emotional affinity, which was defined as ‘visitors report emotional responses to the experience or emotional connections with the animals they observed’ (Ballantyne et al., 2011). Positive emotions play an important role in knowledge gain as they can prompt curiosity (Berlyne, 1960), and often related to the willingness to acquire more relevant knowledge (Renninger et al., 2014). As stated by Mihaly and Hermanson (2001), emotions are one of the most important motivations to learn and explore. For example, an Australian study on wildlife tourism suggested if tourists were impressed by the wildlife encountered during the tour, such an emotional affinity would motivate them to learn and remember the interpretive information about the wildlife themselves, the relationship between human and wildlife, as well as actions that they could take for conservation issues (Ballantyne et al., 2011).
This leads one to consider how to promote positive emotions or emotional affinities through nature tours. According to previous research, tourists are likely to be impressed and promote emotional affinities through the experience of nature exposure activities (Ballantyne et al., 2011; Tubb, 2003). For such activities (e.g. nature tourism), the positive emotional responses to such experiences are evoked by an important factor: aesthetics of nature (e.g. wildlife). Medved and Oatley (2000), in the context of marine wildlife encounter tourism, argued that tourists were likely to benefit from the mutual relationship between aesthetic and emotional aspects. Specifically, aesthetics might prompt enjoyment as well as other positive impressions, including emotional affinity, and such positive emotions then probably contribute to knowledge gain through interpretation (Hvenegaard, 2017; Tubb, 2003). Our study found that participants enjoyed reading the sign with a high-quality photograph. Such positive emotion prompted by aesthetics might be an important reason why participants had the best performance in knowledge recall in the high-quality group. Therefore, the affective and cognitive aspects of the effectiveness of science communication are related to each other, and both aspects can benefit from using high-quality photographs.
6. Conclusion and implications
In the context of interpreting natural sciences within national parks, this is the first empirical study that examines the specific role of the visual quality of photographs in science communication. It can be concluded that, indeed, the visual quality of photographs has a significant influence on both affective and cognitive outcomes of science communication. First, the visual quality of the photograph is closely related to observers’ emotional responses to the interpretive material. An interpretive sign with a high-quality photograph is more attractive to observers and significantly enhances their reading enjoyment. More importantly, such positive emotions such as enjoyment may result in: (1) increased motivation for subsequent, deeper encounters with science (Burns et al., 2003) and (2) the possibility of longer stays and repeat visitation (Bramwell and Lane, 1993; Munro et al., 2008), which are considered as main management goals for natural areas (Kuo, 2002), as well as goals for science communication (Burns et al., 2003).
Second, in terms of cognitive effectiveness, results suggest that both understanding and recall of knowledge were positively influenced by the visual quality, especially for those who are not knowledgeable in the relevant area (e.g. GB and NB in this study). The findings reveal the significance of the visual quality of photographs for improving individuals’ understanding and knowledge of natural science. With a higher level of knowledge, individuals are likely to have a more positive attitude towards the relevant scientific topic (Glikman et al., 2012; Tisdell and Wilson, 2004). When communicating about widely discussed scientific topics, such as climate change, genetic modification and conservation, public support is considered a vital aspect (Fletcher, 2019; McComas et al., 2014; Tisdell and Wilson, 2004) and, thus, the use of high-quality photographs may help change audiences’ attitudes and promote their willingness to support relevant scientific issues.
Visualisation is associated with observers’ visual attention, emotional responses, understanding and recall of knowledge (Allen, 2018; Houts et al., 2006; Silvia, 2005). Our study’s findings not only confirm the above relationships empirically within the context of science communication in national parks, but also emphasise the importance of visual quality of the images used for science communication. In particular, the use of poor-quality photographs significantly weakens the efficacy of visualisation, reducing audience engagement – when photographs are used to visualise science in interpretive materials, their visual quality should be considered seriously.
A limitation of this study is that the participants were not reflective of the general public in China (National Bureau of Statistics of China, 2017). Additional studies with a more general sample population would enable consideration of visual and textual efficacy of interpretative signage in different cultural contexts. Also, it is important that even though a high-quality photograph significantly increased the attractiveness of signage, the majority of the visitors (83.6%) did not stop. Further studies on interpretive signage are still needed to improve its attractiveness. Furthermore, the content could be varied to identify interpretive appeal of other subject matter or pictorial content including computer generated graphics and other design techniques. The relationship between photographic content and computer or mobile technologies (e.g. QR Code) utilised in scientific communication or interpretation are other future study areas (Kalogiannakis and Papadakis, 2017).
In summary, we argue that not all photographs are equally effective as a means of visualisation of science: photographs with high visual quality appear to be more likely to motivate individuals to stop and read scientific content or interpretive narratives, potentially evoking positive emotional responses and enhancing the audience’s understanding and recall of knowledge. Photographs – in particular those perceived as appealing ones – will, and should, continue to be a significant component of not only national park interpretation, but also other forms of science communication.
Supplemental Material
sj-pdf-1-pus-10.1177_0963662520982535 – Supplemental material for A picture is not always worth a thousand words: The visual quality of photographs affects the effectiveness of interpretive signage for science communication
Supplemental material, sj-pdf-1-pus-10.1177_0963662520982535 for A picture is not always worth a thousand words: The visual quality of photographs affects the effectiveness of interpretive signage for science communication by Lei Zhu, Lloyd S. Davis and Anna Carr in Public Understanding of Science
Footnotes
Funding
The author(s) received no financial support for the research, authorship and/or publication of this article.
Supplemental material
Supplemental material for this article is available online.
Author biographies
References
Supplementary Material
Please find the following supplemental material available below.
For Open Access articles published under a Creative Commons License, all supplemental material carries the same license as the article it is associated with.
For non-Open Access articles published, all supplemental material carries a non-exclusive license, and permission requests for re-use of supplemental material or any part of supplemental material shall be sent directly to the copyright owner as specified in the copyright notice associated with the article.