
Abstract
Climate communication is a thriving research area spanning science, social science, and humanities. The field has grown explosively in recent years, necessitating increased efforts to synthesize and make sense of the resulting profusion of studies. To support scholars navigating this quickly evolving knowledge domain, we developed a knowledge map of the climate communication research landscape by applying network analysis and data visualization techniques to the metadata from 2995 publications on climate communication. The map reveals a dense web of connections among five distinct knowledge communities, indicating a tightly knit and intensely collaborative knowledge domain, and suggests new avenues for the application of climate communication knowledge, in particular to support climate services and co-production. The climate communication knowledge map answers the call for synoptic perspectives on areas of science communication while demonstrating a novel visual approach to knowledge synthesis for science communication domains.
Keywords
1. Introduction
Climate communication is a dynamic field of study that has grown explosively in the past 5 years. As more scholars have taken up the challenge of communicating climate issues, the field has addressed an increasingly broad range of questions with theories and methods from disciplines across science, social science, and humanities (Moser, 2016). This welcome trend poses a practical problem for researchers and practitioners wishing to keep up with current developments (Cagle and Tillery, 2015; Moser, 2016). Climate communication studies are published in an array of outlets, and despite recent syntheses and reviews, few tools exist to help climate communicators integrate findings from different studies for real-world application (Corner and Clarke, 2017; Jensen and Gerber, 2020; Moser, 2016). The growth, diversity, and dispersion of such research combined with the pressing nature of many science-related issues such as climate change has prompted calls within science communication for “attempts to generalize, to put scattered evidence together in a bird’s eye view of the research landscape” (Corner and Clarke, 2017; Fischhoff, 2011; Jensen and Gerber, 2020; Moser, 2016; National Academies of Sciences, Engineering and Medicine, 2017; Peters, 2020: 371).
We provide a synoptic perspective on one area of science communication research by applying network analysis and data visualization to metadata from 2995 publications on climate communication in Web of Science. Specifically, we generate and analyze a knowledge map of climate communication research, tracing the many pathways to public understanding of climate science and positioning them in relation to one another. This quantitative, inductive approach mines citation data to paint a picture of collective climate communication knowledge in action. Like all maps, knowledge maps are useful for orienting oneself in relation to key landmarks, planning journeys through untraveled regions, or making strategic decisions about what uncharted areas to explore (Chen et al., 2014; White and McCain, 1998).
2. The need for a synoptic description of climate communication research
Climate communication research studies how individuals and groups develop and share climate knowledge and the ways they can be moved to act in response to such knowledge (Comfort and Park, 2018). But action on climate knowledge is bound up with individual and collective value judgments about life, society, and the future and nearly always requires decision-making under conditions of social and scientific uncertainty (Corner and Clarke, 2017; Johnson, 2012). As a result, climate communication research touches nearly every corner of scholarship. This breadth produces a certain degree of fragmentation, as climate communication research is not reliably located in either communication or climate journals, terms are used inconsistently across the literature, and case studies and segmentation analyses can be difficult to summarize and compare (Baram-Tsabari et al., 2020; Cagle and Tillery, 2015; Füchslin, 2019; Moser, 2016).
Less fragmentation might ease the production of evidence-based guidelines for practitioners, but even if that synthesis were straightforward, it is not clear who the audience should be (Siders, 2019). The practice of climate communication is as fragmented as the research, with journalists, scientists, public relations officers, NGOs, think tanks, scientific societies, governments, extension professionals, museum specialists, and corporations all participating (Mellor et al., 2008; Moser, 2010; National Academies of Sciences, Engineering and Medicine, 2017; Nerlich et al., 2010; Smith, 2020). A recent review found that more entities communicate about climate than any of the other science topics considered (Milani et al., 2019). Given that climate communication happens in a diversity of contexts and to a kaleidoscope of audiences, serious thought is needed about how to make research usable for climate communicators without oversimplifying it (Kahan, 2014; Moser, 2016).
The compounding fragmentations of climate communication research and practice mean the structure of the knowledge domain is not readily apparent, and the lack of a disciplinary lingua franca makes it challenging to discover that structure with traditional literature reviews (Baram-Tsabari and Lewenstein, 2017). Communication scholar Anne Gammelgaard Ballantyne (2016) describes the situation as a large but disorganized toolbox; science engagement specialist Brooke Smith (2020) uses the analogy of a bustling transit network with no transit authority providing coordination. In such a situation, taking stock of current knowledge and applications is key to supporting future research that is relevant and effective in the face of mounting challenges for science and society (Baram-Tsabari and Lewenstein, 2017; Gerber et al., 2020; Jensen and Gerber, 2020; Smith, 2020).
3. Why network perspectives on knowledge domains are useful
Modern citation practices have in effect produced a long-term dataset describing the evolution of knowledge (De Solla Price, 1963). Network analysis of this bibliometric data can reveal the structure governing knowledge flow and development. Conceptualizing climate communication research as a knowledge network foregrounds the understanding that structural elements of knowledge organization enable and constrain discovery and search processes, and therefore augment or inhibit problem-solving (Chen, 2016; Henry and Vollan, 2014; Neal et al., 2015).
Knowledge mapping uses metadata from academic publications to build relational networks of authors, journals, and other variables, depicting emergent consensus from “an army of indexers” (Garfield, 1955: 110). In this way, knowledge networks distill literature into “writings related by use” based on “repeated statements of connectedness by citers with subject expertise” (White and McCain, 1998: 329). These bibliometric techniques have been applied to some aspects of climate (e.g. Huo et al., 2021; Larosa and Mysiak, 2019; Lemos et al., 2019) and science communication (e.g. Gerber et al., 2020; Suerdem et al., 2013), generally without network analysis and visualization. But visualization is a crucial element that distinguishes the method from other styles of systematic review.
Visual knowledge mapping summarizes abstract and complex relational data about knowledge in an intuitive way, so it can be considered as an interrelated whole (Bastian et al., 2009; Chen et al., 2014; Fabrikant, 2000). A visualization affords a different experience than lists or tables of text, allowing innate visual acuity to discern patterns and relationships (Couclelis, 1998; Fabrikant et al., 2010). Visualization is achieved by spatializing network data, positioning nodes in relation to one another with an algorithm that repels nodes from one another unless they are connected by links (Chen, 2016). Rather than relying on an expert to select information to highlight, this quantitative approach aggregates many individual decisions to afford a bird’s eye view of the collective knowledge enterprise, revealing knowledge in the aggregate, in action, and in context, which may yield different insights than traditional systematic reviews (Chen et al., 2014; Evans and Foster, 2011; McLevey and McIlroy-Young, 2017). Knowledge maps support collaboration, planning, brainstorming, and communication within a knowledge domain (Chen et al., 2014; Nakamura et al., 2019). They also support what can be thought of as collective troubleshooting, by clarifying cases in which “ghost theories” or outdated and disproven knowledge still inform research (Ballantyne, 2016; Evans and Foster, 2011). An example of this familiar to science communicators is the persistence of the deficit model of science communication.
Recently, Asmi and colleagues applied bibliometric strategies to climate communication literature to describe the shape of the field and present narrative descriptions of its communities. Their emphasis was on visualization for analysis purposes (using network tools to partition the literature into meaningful groupings) (Asmi et al., 2019; Hepworth and Canon, 2018). There is an opportunity to do more by using visualization for communication (to act as a tool usable by others in the field). Specifically, knowledge mapping can identify new insights about the climate communication system and produce knowledge maps to aid with coordinating and integrating the diversity of research in the field. That is, “not only to summarize, but to make sense of” climate communication research (Peters, 2020: 371).
4. Methods
We used exploratory bibliometric network analysis and knowledge mapping to gain a bird’s eye view of climate communication research. The goal of this analysis is to identify and visually synthesize patterns and relationships within a dataset of publication records. An exploratory bibliometric network analysis proceeds by: (1) defining the data sample, (2) projecting data into network form, (3) identifying structural features of the network, and (4) visualization (De Nooy et al., 2005). We used Python packages metaknowledge (McLevey and McIlroy-Young, 2017), networkx (Hagberg et al., 2008), and Louvain (Aynaud, 2020) for data management, network construction, and network analysis, and the program Gephi for network visualization (Bastian et al., 2009).
Research objectives
The objectives for this study are to:
Generate a knowledge network to reveal the structure of climate communication research;
Understand key features and mechanics of the knowledge network;
Synthesize findings visually as a knowledge map.
The research questions are:
How many communities are present within climate communication research, and what are the defining features of these communities?
How often is knowledge shared between communities?
What types of nodes and links are most important for connecting the network (bonding ties) or combining ideas (bridging ties)?
Data
Bibliometric data were taken from Web of Science on July 31, 2020, using the search query TS = (climat* NEAR chang* AND communicat*). 1 This query was used by Moser in her 2016 review of climate communication research. Titles and abstracts for each of the 5934 results were manually reviewed to ascertain direct or explicit relevance to climate communication. The manual review followed the process described in Moser (2016) and was similar to the inclusion/exclusion criteria used by Ballantyne (2016). Articles were removed if they dealt exclusively with climate science, only mentioned the need to communicate in passing, or were primarily about climate impacts and adaptation strategies (vs communicating about impacts and adaptation). We included climate services and decision support literature wherever possible, so long as some emphasis was on communication, interface, co-design, or engagement. We retained 2995 (50.5%) of the original records, which suggests the correct application of Moser’s criteria (she retained 53.2% of the records from her initial data pull). More than 50% of the articles in our final dataset were published in 2016 or later, meaning that since Moser (2016), half again as much research on climate communication has been published.
Network representations
We created an article-level bibliographic coupling network from the 2995 Web of Science entries. Bibliographic coupling places links between articles (the “nodes” in this network analysis) when they cite the same sources, assuming that articles citing many identical sources apply knowledge in similar ways or for similar purposes. The more times two articles cite identical sources, the stronger their link becomes. When visualized, articles with the strongest connections self-organize into major research themes and appear on the knowledge map as groups of densely clustered nodes; the space between the clusters represents the conceptual distance between the topics (Belter and Seidel, 2013; Nakamura et al., 2019). We chose a bibliographic coupling network because we were primarily interested in discovering and depicting patterns in how existing knowledge is combined and applied, and because these networks can include recently published articles as well as works that have not been cited (Belter and Seidel, 2013). As is customary, the giant component (the largest group of connected nodes) was extracted for further analysis (Chen, 2016).
Network analysis
To describe network structure, we calculated the following metrics:
Density, a measure of network cohesion. Density is the percentage of all possible connections actually present in the network; high density indicates a highly interactive network (De Nooy et al., 2005; Henry and Vollan, 2014).
Modularity, a measure of network grouping. Modularity rates how well a network can be separated into subcommunities, or the extent to which the distribution of connections in a network differs from the expected distribution in a randomly generated one of the same size (Brown et al., 2016; Chen, 2016; Newman, 2006). Modularity is a value between −1 and 1, where 0 represents the modularity of a randomly generated network. Negative scores indicate the absence of community structure; positive scores indicate its presence (Newman, 2006). A network with recognizable community structure should show a modularity > 0.3; however, real networks may not attain this due to overlap or nesting of communities (Chen, 2016; Larosa and Mysiak, 2019).
Transitivity, a measure of network clustering. In a clustered network, a high proportion of observed connections between nodes will be transitive. A transitive connection occurs when two nodes connected via a third are also directly connected to each other, so the pattern formed by these connections makes a triangle (instead of a V). Transitivity is calculated by multiplying the number of triangles in the network by three, and then dividing by the number of unconnected V shapes. Transitivity is a value between 0 (connections are never transitive) and 1 (connections are always transitive); in real networks values of 0.1 to 0.5 are typical (Newman, 2003). Networks with high transitivity have redundant links and short connection paths.
To describe the functions of individual nodes, we calculated centrality scores:
Betweenness tallies the number of times the shortest path of connection between any two nodes in the network travels through the node being considered (De Nooy et al., 2005). Betweenness is high for nodes that connect many others who would not be connected otherwise (or whose connecting paths would be significantly longer). In an article network, betweenness centrality may favor recent papers (Baggio et al., 2015).
Degree calculated based on the number of connections a node has to others (De Nooy et al., 2005). Degree centrality is high for nodes that have many connections (gained by sharing bibliography items with many other papers). In an article network, nodes of high degree may be keystone papers or review articles, or may simply have long bibliographies.
We identified community structure within this knowledge domain by applying the Louvain community detection algorithm, which discovers communities by assigning nodes to groups in ways that maximize intracommunity density (links between entities in the same group) while minimizing intercommunity density (links between entities in different groups) (Blondel et al., 2008; Lambiotte and Panzarasa, 2009). Communities can be thought of as coherent subgroups within the broader network. The algorithm identifies the presence and boundaries of these communities based on the observed network structure, but cannot reveal the reason for the observed structure. To understand the topic(s) of focus for the identified communities, we used simple text processing tools in Python, making frequency counts of lemmatized keywords and title words from the papers in each community. Community names were chosen based on the manual inspection of these frequency lists (focusing on words with prevalence of at least 10%) and the most common publication outlets for each community (Belter and Seidel, 2013; Kajikawa et al., 2007; Nakamura et al., 2019). We then checked the community names against the 20 highest-degree papers for each community, to ensure they were representative. A simple way to think about this process is that the Louvain algorithm quantitatively delineates the communities, and the most frequently occurring keywords, title words, and publication outlets qualitatively describe the communities.
Network visualization
To produce clear and comprehensible visualizations, we stratified the network by connection strength and node degree and removed nodes that became disconnected from the giant component as a result of this pruning (Lambiotte and Panzarasa, 2009). We visualized nodes only if they were connected to other nodes with a strength of at least five (meaning papers are included and/or linked only if they cite at least five identical references). Common thresholds for pruning an article network range from a link strength of 3 to 10 (Baggio et al., 2015; Belter and Seidel, 2013; Tang et al., 2017). We chose five because 60% of the nodes are still present (1770 in the filtered network out of 2863 in the complete one), but only 3.5% of the connections are (19,212 out of 533,676), making it computationally tractable to visualize. These choices represent a balance between including as many weak connections as possible (to capture potentially novel patterns in knowledge application), making the resulting visualizations clear and useful, and emphasizing signal over noise.
We plotted the network in Gephi to depict the conceptual distance between different communities in the knowledge domain. Conclusions can be drawn from the shapes of these visualizations. For example, a spiky cluster of nodes likely has connections to many other communities, while a tightly clustered ball of nodes likely has primarily internal connections (Kajikawa et al., 2007). In these visualizations, we looked for evidence of archetypal structures known to facilitate certain types of knowledge exchange:
Structural diversity, or a “swiss cheese” pattern, where a web of connections links tightly grouped communities separated by empty spaces or “holes.” This structure is thought to be good for knowledge generation, because nodes near structural holes have access to a broad range of knowledge not available within tightly bound communities (Burt, 2000; Chen, 2016; Suerdem et al., 2013).
Social cohesion, or a “spaghetti ball” pattern, where a dense and messy network exhibits redundant connections between nodes and communities. This structure is thought to be good for sharing tacit knowledge and developing collective identity, due to the many redundant connections between nodes (Burt, 2000).
Both structures are present to some degree at different scales of every network, as captured by the concepts of “bonding” and “bridging” ties. A bonding tie, which links two similar entities, supports trust, understanding, and action, and signals consensus. A bridging tie, which links two dissimilar entities, may be more difficult to form, but yields novel information (Burt, 2000; Henry and Vollan, 2014; Neal et al., 2015). A network characterized primarily by bonding ties would appear tightly clustered and interwoven, suggesting that knowledge was frequently linked in diverse ways across the network. A network characterized by bridging ties would appear as an archipelago of weakly connected knowledge communities.
5. Results
The 2995 items in the final dataset were published between 1996 and 2020 in 1034 different outlets. Eighty-six percent of the records were journal articles, but no single journal published more than 5% of the total. Collectively the articles use 3498 different keywords. Only 19% of the records are classified as communication studies by Web of Science, meaning a database search limited to communication studies would miss most of this research. Relatively few authors repeat participation in this network: about 60% published in this knowledge domain just once, and only 7% published five or more times.
From this data, we produced the bibliographic coupling network in Figure 1. Articles (nodes) in this network are linked when they use at least five identical sources to corroborate or contextualize knowledge claims. Knowledge communities are recognizable as groups of articles that substantiate their research by referencing consistent bodies of scholarship. The 1770 nodes in the knowledge map share 19,212 connections. The density of the network is 0.13, meaning there is a 13% chance that any two articles in the network cite at least five identical sources in their bibliographies. The transitivity is 0.45, meaning when a paper shares five references with two other papers, there is a nearly one in two chance those papers also share five references. The network modularity is 0.24, meaning the patterns of connections in this network make it difficult to decompose into clearly delineated communities. Taken together, these metrics suggest the climate communication knowledge domain is highly interconnected and integrated, without pronounced divides between different groups or topics, as evidenced by the “spaghetti ball” pattern of the visualization (Figure 1). This is a knowledge domain defined by social cohesion, not structural diversity.

A knowledge map of climate communication research produced from the article bibliographic coupling network. Five communities comprise the network, each indicated by a label on the surrounding circle. In the online figure, nodes in each knowledge community are color-coded. The size of the node indicates its relative betweenness centrality, meaning that bigger nodes in this map are responsible for connecting disparate pieces of knowledge. These numbered nodes are identified in the text below the figure, where stars mark nodes that also have a high degree.
Despite the somewhat low modularity, Louvain community detection identified five communities. We named these communities based on inspection of the most frequently occurring keywords, title words, and publication outlets in each community, omitting the words “climate,” “change,” and “communication” (because these search terms generated our dataset). These five communities can be thought of as studying distinct pathways to public understanding of climate science:
Risk Perception and Communication contains 463 articles primarily published since 2007. Dominant journals are Risk Analysis, Climatic Change, and Journal of Risk Research. “Risk” is the overwhelmingly salient keyword applied (260 times), followed by “perception” (194), “public” (105), “environmental” (71), “behavior” (82), “social” (58), “adaptation” (57), and “flood” (55). Similar title words predominate. This is the only community where “science” was not a frequently occurring word. This community is primarily interested in factors governing risk perception and the effect of risk perception on behavior. This pathway to public understanding of climate science involves assessing and influencing the risk assessments people make and providing mitigation and adaptation options in line with those perceptions.
Individual Perceptions of Climate Change contains 375 articles primarily published since 2013 in communication-focused journals. Dominant keywords are “science” (216 times), “public” (79), “environmental” (60), “social” (55), “political” (50), “medium” (41), and “perception” (38). Less salient keywords such as “motivate” (31), “framing” (29), “reasoning” (27), “attitude” (26), and “psychology” (23) suggest this community is primarily interested in how social and psychological factors govern perceptions of climate change. This pathway to public understanding of climate science involves comprehending the knowledge people have about climate science and the psychological and cultural factors influencing the interpretation of climate information.
Climate Messages in the Media contains 391 articles published since 2004, with a small decline beginning in 2018. Most are published in communication-focused journals. This group has the highest number of occurrences of the keyword “communication” (231 times). Other keywords frequently used are “medium” (215), “science” (185), “environmental” (132), “analysis” (112), “public” (84), “framing” (84), “social” (71) “discourse” (61), “journalism” (59), “risk” (50), “news” (50), and “policy” (46). In title words, “coverage” (51) also stands out. This community is primarily interested in understanding how mass communication about climate issues affects public understanding and acceptance. This pathway to public understanding of climate science involves strategically crafting messages to address lack of knowledge and pre-existing biases, and deploying those messages in the media ecosystem.
Visual and Affective Communication contains 284 articles published steadily since 2000. Dominant journals are Environmental Communication and WIREs-Climate Change. After “environmental” (67 times), the most frequently occurring keywords are “visual” (61), “science” (48), “public” (45), “education” (43), “social” (39), “engagement” (38), “adaptation” (36), “risk” (33), and “behavior” (32). Overlap between this community’s keywords and others may explain the community’s central position on the map, suggesting there is wide diversity in editorial selection. This community is primarily interested in engaging people with climate knowledge. This pathway to public understanding of climate science involves engaging people in facts and stories about climate, and emphasizes education, interactivity, and visual communication.
Decision-making and Stakeholder Engagement has 257 articles and has grown steadily since 2000. It is the smallest community, but the articles comprising it have the largest selection of keywords. These articles are published primarily in climate and environment journals. “Science” is the dominant keyword (152 times), followed by “adaptation” (149), “risk” (101), “management” (99), “policy” (93), “knowledge” (78), “environmental” (78), “decision” (69), “model” (66), “social” (65), “participatory (62), “uncertainty” (61), “sustainability” (59), “assessment” (53), and “stakeholder” (50). Title words indicate that, in addition to being adaptation-focused (“adaptation” occurs in 109 titles), this community is dominated by case studies (“case” occurs 55 times and “study” 47). This community is primarily interested in using communication strategies as tools to support action on climate knowledge. This pathway to public understanding of climate science involves strategic information provision to support managers, policymakers, and citizens in understanding and acting on climate knowledge.
Table S1 (online supplementary material) shows keywords and title words with >10% prevalence in each community, and frequently occurring publication outlets for each. We checked the community names against the 20 highest-degree papers in each community (Table S2), to ensure they accurately described each community’s core.
We expected two patterns of knowledge application in this network: nodes with a high degree playing primarily bonding roles (connecting similar sources of knowledge to form the communities described above), and nodes with high betweenness playing primarily bridging roles (connecting dissimilar or previously uncombined sources of knowledge from more than one community). Overall, few nodes have high betweenness centrality (large size nodes in Figure 1), suggesting that diverse knowledge sources are frequently combined in different ways for climate communication projects. This is evident in Figure 2, which shows two different views of the same network: one with only cross-community connections, and one with only internal community connections. 12,638 (about ⅔ of the total) connections link nodes in the same community, with 6575 (about ⅓ of the total) connections crossing communities (Figure 2). 2
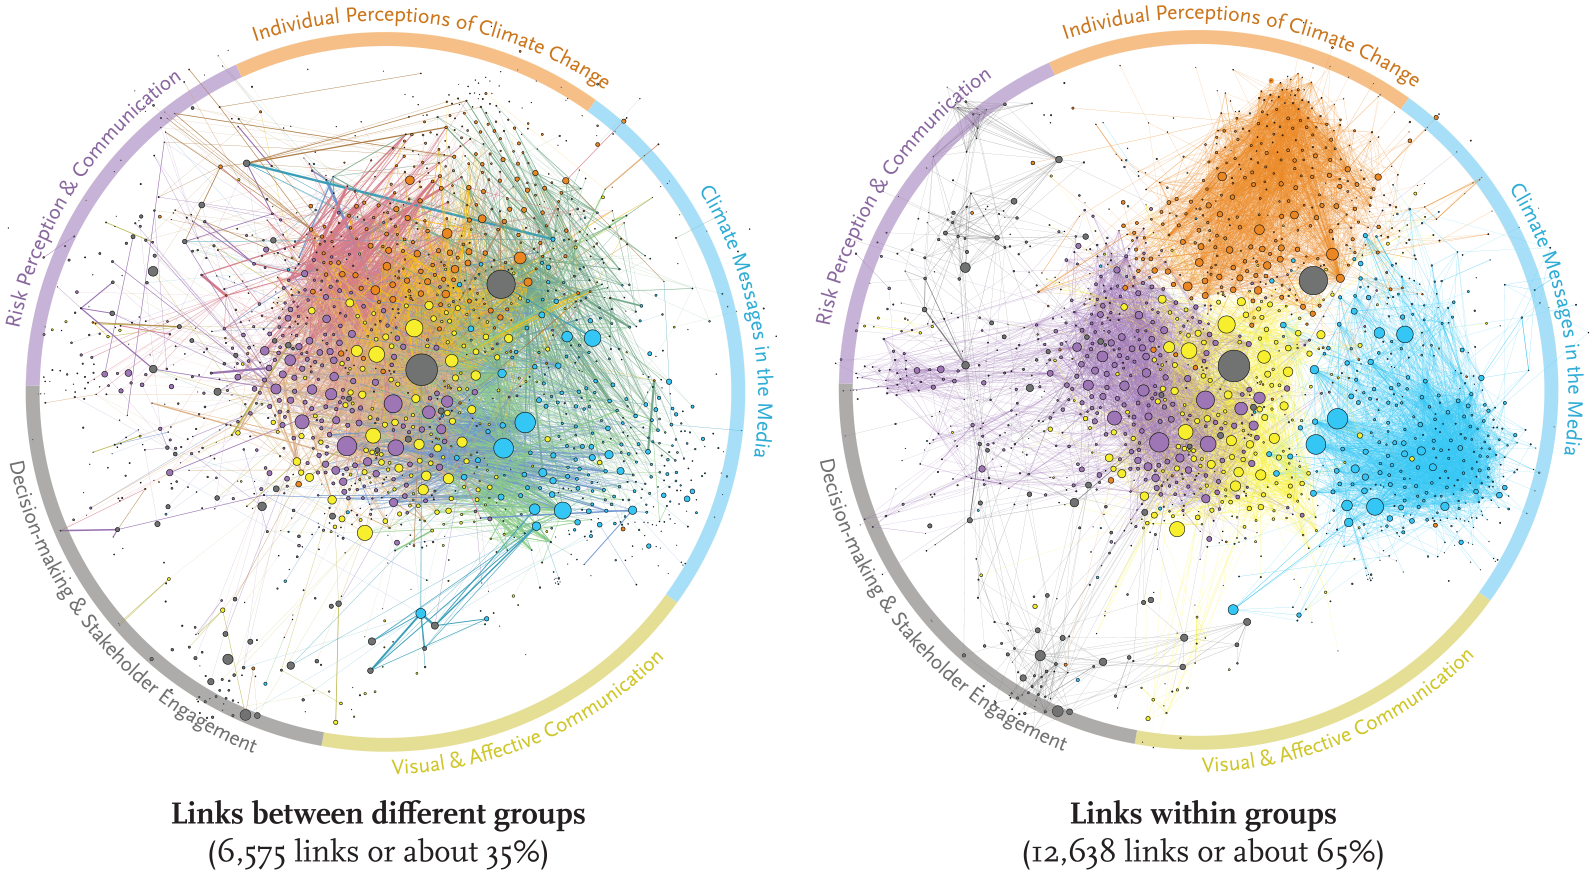
Contrasting view of cross-community connections and internal community connections.
Nodes with high betweenness often have a high degree (starred papers in Figure 1). The high degree nodes generally have longer bibliographies, which affords more opportunities for connection to other nodes (and increased likelihood of combining pieces of knowledge in a novel way). However, there are a handful of nodes with high betweenness but lower degree. These nodes play notable bridging roles despite having relatively fewer connections than the starred nodes. These articles can be thought of as the network weavers, because they connect disparate or previously uncombined sources of knowledge to support their research. For example, the big gray node (#1 in Figure 1) has the largest betweenness centrality in the entire network and the 10th-largest degree. This node draws on a diversity of sources unique to its knowledge application (high betweenness) while connecting strongly with other papers (high degree).
To understand linkages between the five knowledge communities, we considered the total weighted connection strength between them and the percentage of nodes from each community involved in cross-community links (Figure 3). The most strongly linked communities are Risk Perception and Communication with Individual Perceptions of Climate Change (1387 links with 46% and 53% of nodes participating, respectively), and Risk Perception & Communication with Visual and Affective Communication (1427 links with 46% and 60% of nodes participating, respectively). However, if we consider an insularity index (ratio of in-community to out-community links), Visual and Affective Communication participates in twice as many outside-community links (3198) as inside-community ones (1575) (Figure 3). By this standard, Climate Messages in the Media is the most insular, with 1000 fewer outward-facing links than inward-facing ones. Decision-making and Stakeholder Engagement sends as many outward links as inward ones, but on average a smaller percentage of its nodes participate, meaning relatively fewer nodes are key for connecting the larger body of climate communication knowledge with this community’s work. This reinforces two suppositions suggested by the knowledge map (Figure 1): Visual and Affective Communication is at the center because it frequently applies knowledge commonly used in other communities; Decision-making and Stakeholder Engagement is on the periphery because it rarely applies knowledge commonly used in other communities.

Strength of knowledge exchange between the five communities. Each community of nodes has been aggregated into a single node, sized proportionately based on its weighted degree (total number of connections weighted by strength of those connections). All links between nodes of different communities have been collapsed into one, as have all links between nodes within the same community (these are the “U-turn” links at each node). The numbers indicate the total connections between the nodes, the thickness of the line indicates the summed weight of all the connections, and the percentages indicate how many of the nodes in each community participate in that link. For example, at the bottom of the chart, 16% of the nodes in Decision-making and Stakeholder Engagement and 14% of the nodes in Climate Messages in the Media participate in the 92 cross-community connections.
6. Discussion
The climate communication knowledge map (Figure 1) reveals a dense web of connections among five distinct knowledge communities, indicating a tightly knit and intensely collaborative knowledge domain. Each knowledge community has a strong intellectual tradition bounding its inquiry (as evidenced by the discernible community structure), but these traditions do not seem to limit that inquiry (as evidenced by the web of cross-community connections). Scholars in this knowledge network frequently combine diverse sources in their search for new ways to comprehend and support public understanding of climate science. Two conclusions can be drawn from this knowledge map: (1) public understanding of climate science likely requires multiple complementary strategies; and (2) work in climate services, decision support, and co-production offers an opportunity bridge between communication research and practice.
Public understanding of climate science requires multiple complementary strategies
The knowledge map shows that climate communication strategy cannot be distilled to a few key techniques matched neatly to use cases. The high rate of connection and low insularity (Figure 3) likely results from (and affirms) this important characteristic of climate communication: it happens in a diversity of contexts and for a range of goals, necessarily requiring different approaches. It makes sense that scholars would reach across the knowledge domain to better understand or support climate communication efforts in particular spaces or contexts, producing the dense web between communities as they study, develop, and test different strategies.
Recent science communication landscaping efforts corroborate this emphasis on cross-discipline collaboration (Gerber et al., 2020; Trench and Bucchi, 2015). Network studies of climate-tinged social sciences found similar “spaghetti balls” of knowledge reminiscent of the climate communication knowledge map (Wang et al., 2018). Previous work identifying messy networks as hindering intellectual progress may simply not apply in these social-scientific and application-focused knowledge domains. Still, in a research landscape this complex, making climate communication research useful and usable for practitioners is even more imperative—and even more challenging. With half of the research published since 2016, and only a third of the researchers participating repeatedly in the network, it is not straightforward to survey, select, and apply the available evidence.
The knowledge mapping performed in this study can be thought of as a data-driven attempt to identify and describe the multiple strategies available to climate communicators. The maps provide a visual index to different areas of knowledge, which can be studied and developed by researchers and leveraged in different situations by practitioners to describe or foster public understanding of climate science. It is productive for researchers to focus on specific aspects of public understanding of climate science (e.g. climate messages in the media), but it is unlikely these researchers would suggest that focus was the only way to achieve public understanding of climate science. This is why we have chosen to represent these five knowledge communities as distinct pathways to public understanding of climate science: they are complementary routes to the same goal.
A practitioner wishing to locate relevant research might look at the five pathways and ask which best describes their communication context or goal. The position of that community in the knowledge network could suggest other pathways to consider or even combine. Looking at knowledge this way helps make sense of the multiple factors affecting the success of climate communication in the real world: media messages are not delivered separately from cultural ones; risk perception may be influenced by visual and affective cues that are not necessarily rational.
Mapping these communication pathways empowers communication practitioners to select, combine, and apply available evidence-based techniques. Mapping provides needed context considering the fragmentation (across disciplines, outlets, and scholarly traditions) of climate communication research and the lived sense of disorientation this can produce for those working in the field, conditions which have been identified as potential barriers to moving climate communication knowledge from research to practice (Cagle and Tillery, 2015; Moser, 2016). Orienting scientists and communicators to the research landscape and the five pathways to public understanding of climate science could support a sense of cohesion in the field.
Climate services and co-production offer an opportunity to bridge between climate communication research and practice
The network structure revealed in a knowledge mapping project can suggest new opportunities for knowledge application. Network analysts look for structural holes in a mapped network because they represent an opportunity to bridge between areas of knowledge infrequently combined. Structural holes are spanned by bridging ties, which link two dissimilar entities and may represent a novel combination of information. The climate communication knowledge network is overwhelmingly characterized by bonding ties, where similar entities share many connections, causing the formation of the dense web of four knowledge communities at the center of the map (Figure 1). The high transitivity and low modularity observed in this network results from this central group of communities which, while distinct, share information frequently. One community, however, is connected to the network by bridging ties: Decision-making and Stakeholder Engagement.
From a network perspective, Decision-making and Stakeholder Engagement behaves differently from the other four communities. It is on the periphery of the map, distanced from the core of the knowledge network. It sends as many outward links as inward ones, scoring a 1 on the insularity index, but a smaller percentage of nodes participate in these outward links (Figure 3). It is connected to the broader network by a relatively smaller subset of papers than generally observed in this network. As a result, it is the one element of this knowledge map that forms a promising structural hole, which could offer novel directions for knowledge application.
Research in this community focuses on communication strategies to encourage scientifically informed decision-making. It supports managers, policymakers, and citizens in understanding and acting on climate science. Articles in this community emphasize participation and stakeholder engagement and focus on communicating about adaptation, impacts, and risk management. Many studies involve co-design, climate services, data provision, and decision support tools. The fact that this knowledge community does connect occasionally to the broader climate communication knowledge domain confirms other work speculating that on-the-ground climate knowledge delivery systems could utilize strategies from climate communication research to augment success (Bartels et al., 2013; Cagle and Tillery, 2015; Kruk et al., 2017). But these studies are generally published in climate- or environment-focused journals, and some scientist/practitioner authors may not be familiar with the full array of research-supported tools available to climate communicators.
Fully documenting why Decision-making and Stakeholder Engagement is relatively cognitively isolated would require a different research approach than used here. But because the network map reveals this structural hole, and because effective climate service provision relies on participatory processes which produce not only the transfer of scientific information, but also engagement, tacit buy-in, and trust-building (Larosa and Mysiak, 2019), this could be a particularly fruitful avenue to explore for integrating research and practice in climate communication. Climate services and other activities carried out by Decision-making and Stakeholder Engagement researchers could benefit from the broad array of tools studied and practiced in the other knowledge communities; similarly, researchers from other knowledge communities might benefit from having a living laboratory where climate communication strategies could be developed, applied, or tested. In fact, some scholars in risk communication (Lindenfeld et al., 2012, 2014) and climate services (Donkor et al., 2019; Ponce de Leon and Cotangco, 2018) have previously called attention to this opportunity and encouraged scholars and practitioners to reach across the gap. The salience of the recently published large gray node from this community (Cook and Overpeck, 2019) illustrates the potential benefit of building these bridges.
Limitations and future work
Knowledge mapping is a powerful exercise for gaining a data-driven, synoptic perspective on knowledge in action, but the inherent abstraction and quantification simplifies the scholarly enterprise and does not reflect its full complexity. For example, all citations do not inform a paper equally, and this data-driven approach cannot make judgments about the worthiness of certain citation patterns. Furthermore, insights from bibliometric analyses are predicated on the data that generates the network, meaning if Web of Science does not index social science and humanities research at the same rate as scientific research, contributions from these fields may be overlooked (Andrés, 2009; Archambault et al., 2006). We feel these compromises are worth the bird’s eye perspective gained, which can be augmented by future work to add other databases and make the knowledge map interactive.
A final limitation affects our conclusions about this knowledge domain specifically. We have interpreted the network structure as evidence that climate communication research is a highly interconnected field, whose researchers have a wide knowledge of the many ways public understanding of climate science can be influenced. But it is plausible the network structure suggests the opposite: a disorganized body of knowledge produced by scholars who publish only once in the field and may lack the time to familiarize themselves with the knowledge domain or ground their work with insights from the most relevant pathway. Likely, both interpretations are true to some degree, but sorting out which connections support which interpretation is beyond the scope of this article. In either case, a knowledge mapping exercise represents an important first step in understanding what pathways to public understanding of climate science are currently being pursued, and how well they support each other. A ripe area for future research would be understanding how widely or skillfully the pathways to public understanding of climate science are followed by communicators.
7. Conclusion
In this study, we mapped the climate communication research domain and its five key pathways to public understanding, presenting a visual overview that may be thought of as a subway map guiding communicators (Smith, 2020). Our approach has relevance for scholars and practitioners in science communication more broadly, who are seeking new techniques for knowledge synthesis, transmission, and translation among the many individuals and entities involved in communicating science. By providing a snapshot of climate communication research, the map prompts interrogation of assumptions about existing climate communication knowledge and sparks insight about new areas which may benefit from the increased application of evidence-based climate communication strategies. Future work to make this knowledge map interactive, and to update it regularly, could make climate communication research more useful and usable for practitioners, supporting them in seeking relevant evidence to apply within the context of their existing skills and expertise gained through experience.
We called this article “mapping pathways to public understanding of climate science” because a knowledge mapping project is a bit like paving paths across a grassy field based on data describing the routes people actually walk across it. The links in the knowledge map can be thought of as the footpaths traveled for the purpose of assembling knowledge and evidence. Rather than contributing new information about how to communicate climate information, this study attempts to augment current researchers’ and practitioners’ abilities to locate and contextualize useful knowledge, thereby increasing the impact of what we already know about how to communicate climate science.
Supplemental Material
sj-pdf-1-pus-10.1177_09636625221079149 – Supplemental material for Mapping pathways to public understanding of climate science
Supplemental material, sj-pdf-1-pus-10.1177_09636625221079149 for Mapping pathways to public understanding of climate science by Chelsea R. Canon, Douglas P. Boyle and K.J. Hepworth in Public Understanding of Science
Footnotes
Funding
The author(s) received no financial support for the research, authorship, and/or publication of this article.
Supplemental material
Supplemental material for this article is available online.
Notes
Author biographies
References
Supplementary Material
Please find the following supplemental material available below.
For Open Access articles published under a Creative Commons License, all supplemental material carries the same license as the article it is associated with.
For non-Open Access articles published, all supplemental material carries a non-exclusive license, and permission requests for re-use of supplemental material or any part of supplemental material shall be sent directly to the copyright owner as specified in the copyright notice associated with the article.