
Abstract
The requirements of the knowledge-based economy and the contribution of information and communication technology (ICT) to socio-economic change have had a significant impact upon regional economic performance in the European Union. So far, however, the literature on the implications of the ICT paradigm for labour productivity growth has largely neglected the (sub-national) regional dimension. By using experimental micro-data, this paper first provides a picture of the regional contributions to labour productivity growth in Italy in the period 2001–2005. Second, it explores the relationship between ICT production and regional labour productivity in the same reference period. In line with previous studies at the country level, our findings highlight a strongly positive relationship between ICT production and regional labour productivity growth, at the same time suggesting a complementary relationship between ICT production and diffusion in explaining interregional differences in productivity performances.
Keywords
Introduction
Since the mid-1990s Italy has experienced a pronounced labour productivity slowdown: the causes of this prolonged deceleration have not yet been clearly identified (Daveri and Jona-Lasinio, 2005). This productivity slowdown, coupled with the historically strong territorial imbalances observed among the Italian regions, have provided the underlying motivation of this work, which looks simultaneously at regional and national labour productivity growth in the early 2000s.
The pervasiveness of general purpose information and communication technologies (ICTs) and the contribution of intangible assets to socio-economic growth are among the main underlying explanations of regional growth differentials within the European Union (e.g. Autant-Bernard et al., 2011; Bergman and Usai, 2009; Dettori et al., 2011; Marrocu et al., 2012; Ortega-Argilés and Moreno, 2009). However, it is rather unclear whether the ICT paradigm is spurring greater socio-economic cohesion or, on the contrary, stronger territorial polarisation of wealth. The literature on ICTs and productivity growth has largely neglected the (sub-national) regional dimension, mainly for lack of adequate data allowing for dynamic territorial analyses.
Conversely, there is widespread evidence showing that the ICT sector has been an important driver of productivity growth in some OECD countries (OECD, 2003). Economists generally agree that total factor productivity (TFP) acceleration in ICT production was a significant contributor to the speeding up of overall TFP during the 1990s. Many studies have argued that TFP growth was largely, if not entirely, due to innovations in industries producing ICT goods and services. These innovations, in turn, raised the labour productivity in industries that used ICT because of capital deepening: in particular, falling ICT prices reduced the user’s effective cost of purchasing high-tech capital, leading firms to increase their desired capital stock (see OECD, 2003, for a comprehensive review of the empirical literature).
In this paper we provide some evidence on the relationship between ICT production and regional labour productivity in Italy in the years 2001–2005 a period of severe slowdown in the Italian economy. The main research questions addressed are the following: (1) what was the contribution of individual regions to the Italian labour productivity growth in the first half of the 2000s and (2) is there a relationship between ICT production and regional labour productivity performance?
The experimental micro-data used in this work are gathered from the Provisional Estimate of Value Added of Enterprises and the System of Accounts of Business Units (SABU), covering exhaustively all Italian firms with 100 or more employees. The analysis is conducted in two steps. In the first one we decompose the national labour productivity growth, measured at the firm level, in order to identify both what kind of contribution was the most relevant and which territorial units contributed the most/least to the Italian aggregate growth in the period considered. In the second step we explore whether a statistical relationship is found between ICT production and regional labour productivity.
The paper is structured in six sections. The next section summarises the literature background on the relationship between ICT and labour productivity growth, with particular reference to its spatial dimension. The section after that introduces the data, whilst the fourth provides the picture obtained by decomposing the Italian labour productivity growth in the period 2001–2005 by region and by sector within each region. The fifth section first describes the methodology applied to explore the relationship between ICT production and regional labour productivity; the results from our panel of firms are then discussed. The final section concludes by indicating future research directions.
The research context
ICT and productivity growth
Productivity is both an outcome and a crucial measure of the contribution of technological progress to economic growth. 1 However, the relationship between technological paradigms and productivity has been extensively discussed, both theoretically and empirically, but only partially understood. 2 If, on the one hand, investment in innovation and technological progress are universally acknowledged as the major determinants of productivity, economic theories differ substantially in their interpretations of what technology and knowledge are, to what extent they influence productivity growth, and how such relationships evolve over time. The copious empirical literature offers a myriad of examples – mostly at the aggregate level of countries and industries – which, however, are hardly conclusive given the diversity of theoretical standpoints, methodologies and databases.
On the other hand, conclusive evidence on the link between technological progress – and in particular the ICT paradigm – and productivity is likely to remain a chimera as long as its determinants become more numerous and difficult to capture. The addition of explanatory variables other than traditional innovation input (e.g. research and development, R&D) and output (e.g. patents) indicators – such as capabilities, organisational change, investment in intangibles, just to mention a few – do provide an increasingly accurate picture of the relation between new technologies and productivity, at the same time introducing further complexity and creating major challenges for policy design. As rightly put by Bartelsman and De Groot (2004), ‘a plethora of proxies for “anything that can matter” has been tried’, making it increasingly tricky to build an integrated analytical framework able to provide guidelines for both empirical and policy analysis.
The difficulties in understanding such a multifaceted link lie in the multi-level and long-term adaptation process of industrial societies to the technological paradigm of the ‘information age’ (e.g. Amendola et al., 2005; Brynjolfsson, 1993; Castells, 2000; Jorgenson, 1995). Indeed, analogies have been made to the electrification age, or even to the industrial revolution, in terms of magnitude of the impact and enduring gestation. The possibility of ‘extended learning curves’ implies that, for new investments in knowledge and technologies to fully deploy their benefits, it is necessary to develop complementary and related innovations – technical, organisational, social and institutional – which might require exceptionally long evolutionary processes of learning and adjustment (see, among others, David, 1990, 2000; Freeman and Soete, 1994; Gordon, 2000; Pérez, 2002; Wilson, 1995).
A major controversial point in the literature regards the distinction between ICT production and ICT adoption and use. Although both capital-deepening effects (i.e. the accumulation of ICT capital such as hardware, software and communication equipment) and acceleration effects (i.e. technical change brought about by the technological paradigm) in principle apply to both ICT production and use and have been recognised as critical in the literature on productivity growth, divergence exists over the relative importance of ICT production versus ICT use. On the one hand, some scholars have argued that productivity gains are mostly driven by industries classified as ICT-intensive, and in particular some business service sectors with high degrees of ICT adoption (e.g. Stiroh, 2002; Van Ark et al., 2002). Others have instead claimed that the bulk of the benefits of the ICT paradigm in terms of productivity have to be ascribed to ICT production (e.g. Daveri and Silva, 2004; Gordon, 2003).
A further complication pertains to the heterogeneity of manufacturing and service activities within the ICT industry. On the one hand, some empirical evidence has pointed to remarkable differences in productivity between hardware and software (IT) and communication equipment (CT) production, which might be ascribed to the different nature, age and demand of the technology employed in IT productions (newer, more science-based, facing higher competition) from those in the CT sectors (e.g. Acconcia et al., 2008; Daveri and Silva, 2004; Iammarinoet al., 2004). Indeed, even within the software industry, notable differences are present between the more sophisticated applications – such as software systems for integrating firms’ processes – and more standardised products (Acconcia et al., 2008). On the other hand, the literature (e.g. Broadberry and Ghosal, 2005; Guerrieri and Meliciani, 2005) has shown remarkable variation in terms of productivity levels and growth between traditional and highly regulated services (e.g. retail and wholesale trade, transports, telecommunications) and knowledge-intensive service activities (e.g. IT services or financial and insurance services). Some of these service industries are in fact ICT producers, though at the same time intensive users of the same technologies. The ICT industry as a whole requires comparatively wide access to specialised goods and services, which include laboratories, university research, legal and financial services among others (Barrios et al., 2008).
Likewise, on the user–producer controversy there is no conclusive evidence. It can be argued that the hypothesis of ICT-adoption-led growth, and its emphasis on technological diffusion, cannot be so easily disentangled from that of ICT-production-led growth. Most likely, productivity gains are achieved by the combination of the capacity to generate new goods and services and the capacity to transmit and diffuse new knowledge, which in turn are contingent on highly situated social and institutional structures and their response to technical change. In other words, more than mutually exclusive categories, ICT production and ICT adoption should be seen as complementary forces influencing productivity. The degree of interdependence and relatedness of knowledge generation and diffusion, and of competences and capabilities across industrial and technological structures, are all critical factors underlying productivity trends, accounting for the huge difficulties in reaching firm conclusions on the ‘productivity paradox’. 3
The regional dimension of ICT and productivity
However, even though productivity is principally the outcome of micro-level decisions related to the choice of inputs to obtain a certain output, contextualisation seems to undoubtedly matter. The basic unit of analysis is the firm, as the main economic agent, whose behaviour and performance are, however, strongly influenced by different external factors, such as geographical location and sectoral affiliation. High firm heterogeneity in productivity levels and growth translate, in the aggregate, into sharp and persistent differences in productivity across countries (e.g. Ahn, 2001; Barnes et al., 2001; Bartelsman et al., 2005) and industries (e.g. Bartelsman and Doms, 2000; Bottazzi et al., 2002), as well as across regions within the same national borders (e.g. Cozza et al., 2012; Castany et al., 2009; Cingano and Schivardi, 2004; Del Monte, 2003; Dettori et al., 2011; Di Giacinto and Nuzzo, 2006; Ortega-Argilés and Moreno, 2009).
Looking more specifically at the spatial dimension, the technological gap tradition has long indicated social capability and technological congruence as the main factors underlying productivity differentials across space (see, among others, Abramovitz, 1986; Fagerberg, 1987, 1994; Fagerberg et al., 1994; Ohkawa and Rosovsky, 1973). Social capability refers to the overall capacity of the region to engage in innovative processes and in the consequent institutional change. Technological congruence points to the distance of the region from the technological frontier or, in other words, its capacity to implement the technical properties connected to the new technological paradigm (Fagerberg et al., 1994). The first concept thus refers to the path-dependent evolution of the region as a socio-economic ‘whole’ or system, whilst the second concept points mainly to the local industrial structure and the scope for convergence between old and new technologies (Fagerberg and Verspagen, 2002, 2007; Von Tunzelmann, 2009).
Technological gap models stress the ambiguous effect of two different forces, both carrying strong spatial implications: on the one hand, the capacity to generate innovation, which tends to widen productivity differentials; on the other hand, the capacity to diffuse innovation, which tends to narrow them. Incidentally, such observations seem to point to some degree of complementarity between production and adoption of new technologies, particularly when looking at regional and local imbalances.
When considering the regional level of analysis, the specific factors that become critical in explaining productivity growth are local industrial structures (sectoral composition, average firm size, R&D intensity, investment propensity etc.), scale and scope of geographical agglomeration (degree of urbanisation and diversification, and spatial externalities in terms of localised labour markets, specialised suppliers, knowledge spillovers etc.) and local demand conditions. However, the potential for localised externalities and spillovers depends on social institutions and practices for the generation, absorption and diffusion of new knowledge or, in other terms, on those localised social capabilities without which economic growth and change cannot be sustained.
Following this line of argument, regions with a knowledge and production base more apt to adjust to technological change tend to attract the production of those goods and services that have higher inputs of knowledge and intangibles (for example human capital) along their value chain (see also Østbye and Westerlund, 2011; Petrakos et al., 2011; Piazza-Georgi, 2002). As industries producing ICT goods and services have high rates of technological innovation, those regions in which the share of ICT-producing firms is higher than the average should be those most likely to experience comparatively higher productivity growth, along with higher labour unit costs (e.g. Acemoglu and Shimer, 2000; Fagerberg, 1988; Miguélez et al., 2011). Such regions are better equipped to exploit new opportunities, to adapt existing activities to changing business models and to learn faster how to build cutting-edge advantages. New and non-standardised types of goods and services are also prevalently produced, at least initially, in more diversified and open regions, which serve as hubs and often show the required magnitude, diversity and sophistication of both supply and demand to support the growth of new markets (e.g. Cheshire and Carbonaro, 1995; Dunford and Smith, 2000; Duranton and Puga, 2004; Van Winden and Van der Meer, 2003; Weterings and Boschma, 2009).
The location in the region of industries with a clear technological advantage, such as ICT-producing industries, is thus seen as a main source of regional productivity (e.g. Barrios et al., 2008; Böckerman, 2002; Daveri, 2004; Rigby and Essletzbichler, 2000). ICT-producing firms favour regional locations that offer greater opportunities of developing new knowledge combinations and applications with other industries, facilitating inter-industry resource reallocation and flows. At the same time, ICT producers not only contribute directly to regional productivity growth, but are a source of new products and processes that spread to firms in other industries through linkages and networks at least partially localised in the region (e.g. Cuadrado-Roura and Garcia-Tabuenca, 2004).
To conclude, it is obviously problematic to assess whether the performance of a specific region corresponds simply to the sum of selected individual behaviours – e.g. the activities of the resident firms –or to that of the regional system as a whole. Yet, as stressed by Feldman and Martin (2005), firm success and regional economic growth are mutually dependent and their interdependence may set up virtuous (or vicious) cycles. Firms’ success depends on their external environment: there is no unilateral causality nexus but, rather, a coevolutionary process (Iammarino, 2005). On the other hand, spillovers can be a side-product of technical progress in the ICT-producing industries, but they also stem from complementarities with innovations generated in other sectors: thus, given the highly localised nature of spillovers, the location of ICT production organisations is a crucial factor for an assessment of the link between new technologies and regional labour productivity.
The data
Difficulties in measurement have been at the core of explanations for the productivity paradox. Because information and knowledge are intangible, any increase of their content in goods and services is likely to be underestimated compared with any increase of traditional inputs (Brynjolfsson, 1993). Indeed, both ICT-producing and ICT-intensive industries face serious problems in accounting for changes in quality and variety. Nonetheless, progress has been made since the adoption, at the EU level, of the System of National Accounts (ESA95), allowing for the ease of some of the problems faced in the estimation of intangible activities, among them the reclassification of software as a capital good.
In regional analyses, the general problems of measuring ICT-related activities are coupled with those connected to the estimation of regional aggregates. In this respect, one of the most serious biases in territorial investigations concerns firm multilocation, as in most surveys the variables are estimated on the assumption that the firm is located in only one (headquarters) region, thus not allowing to control for multilocated (and multisectoral) firms. In what follows, this limitation is overcome, as aggregates on production activities are allocated to the region where the unit carrying out the relevant transactions (local kind-of-activity unit, KAU) is resident (Eurostat, 1996).
The data used in this work come from the Provisional Estimate of Value Added of Enterprises and the System of Accounts of Business Units (SABU), covering the whole population of Italian firms with 100 or more employees and providing the possibility for dynamic analyses. The Italian National Institute of Statistics (ISTAT) is among the few European statistical offices that release information about ICT capital goods at both industry and geographical level. In order to identify ICT firms at the regional level, micro-data classified by economic activity (ATECO91, based on NACE Rev. 1) are employed, 4 allowing for a detailed sectoral analysis, where production processes can be considered less heterogeneous and thus productivity changes may be more representative of the underlying technological change. In accordance with the OECD definition (OECD, 2000) – compatible with ATECO91 – ICT-producing industries comprise three sectors: hardware, software and communication equipment.
The analysis is carried out with reference to the period 2001–2005 and the sub-national breakdown refers to the NUTS 2 level, corresponding to the 20 Italian administrative regions. 5 The variables covered in the dataset are the following: value added, investment, employment, employment class, sectoral code, regional code, multiregional code, labour costs. The panel includes 7,200 firms with more than 99 employees.
In line with the discussion in the previous section, the contribution of ICT-producing industries is likely to be greater the higher their relative weight in the regional economy is. Map 1 provides an overview of the location of ICT-producing firms expressed in terms of their percentage share on the total number of firms by region in the period 2001–2005.
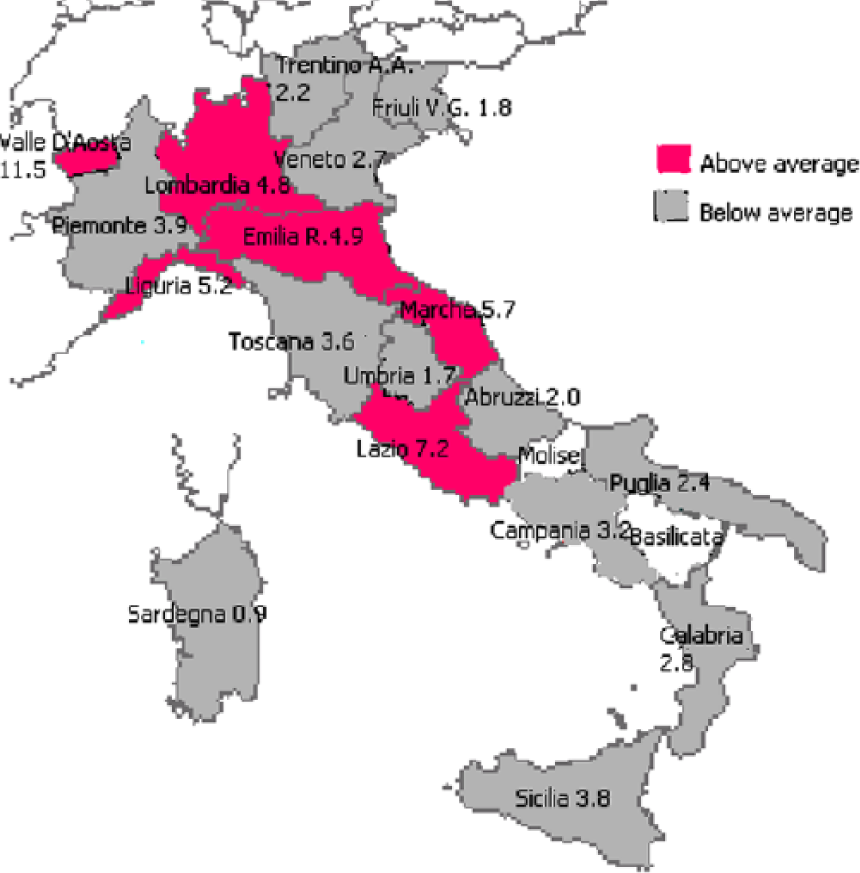
Location of ICT-producing firms by region (% of regional total; national average = 4.1%).
Decomposing labour productivity growth: regional and sectoral contributions
The decomposition method
The analysis of the contribution of the 20 Italian regions to national productivity growth is done by means of the aggregate productivity decomposition approach first devised by Oulton (1998), and subsequently applied to different units of analysis (i.e. firms, industries, countries) by Baily et al. (1996), the OECD (2001a, 2001b, 2003), Bartelsman and De Groot (2004) and Gozzi et al. (2005) among others. 6
Aggregate productivity growth can be decomposed into the contribution of each region taking into account three different effects: within-region, level reallocation and growth reallocation. The effect on the aggregate productivity growth within each particular region depends in turn on the relative size of sectors making up the regional industrial structure. Thus, regional productivity is decomposed into the contribution of industrial sectors, i.e. looking at the same three components: within-sector, level reallocation and growth reallocation. 7
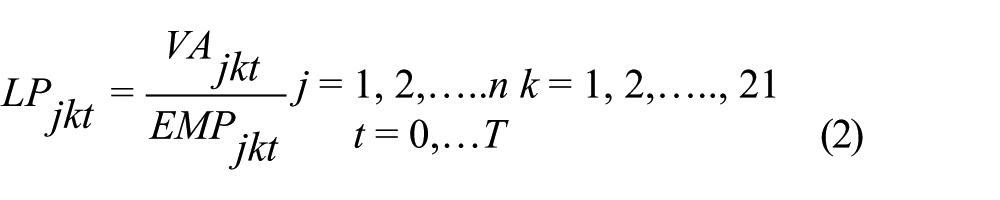
Throughout this paper, our measure of labour productivity 8 for each firm i at time t is as follows:

Labour productivity of each sector j in each region k is given by:
Thus, the aggregate regional productivity is:

As stated above, the contribution of each sector to the aggregate regional productivity growth depends on the relative size of that sector within the region, which is measured in terms of employment share. Thus, in each region k, the size of each sector is:

The proportional growth of labour productivity in sector j between time 0 and T in each region k is given by:

This can be decomposed into the three different effects highlighted above: 9
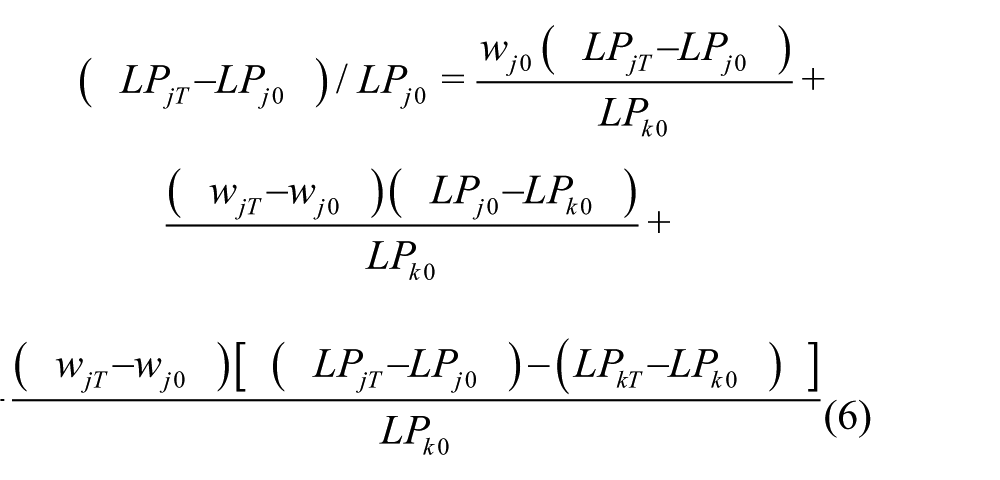
Ceteris paribus, aggregate regional labour productivity growth increases if there is either one or a combination of the following effects: (a) a rise in the productivity growth of a sector weighted by its share of regional employment in the initial year (first term on the right hand side of (6)), or within-sector effect; (b) a rise in the employment share of a sector with productivity level higher than the regional average in the initial year (second term in (6)), or level reallocation effect; (c) a rise in the employment share of a sector with a productivity growth higher than the regional average (third term in (6)), or growth reallocation effect. 10
Results
The results of the productivity growth decomposition for the Italian regions are reported in Table 1. 11
Regional contribution to national labour productivity growth (2001–2005)
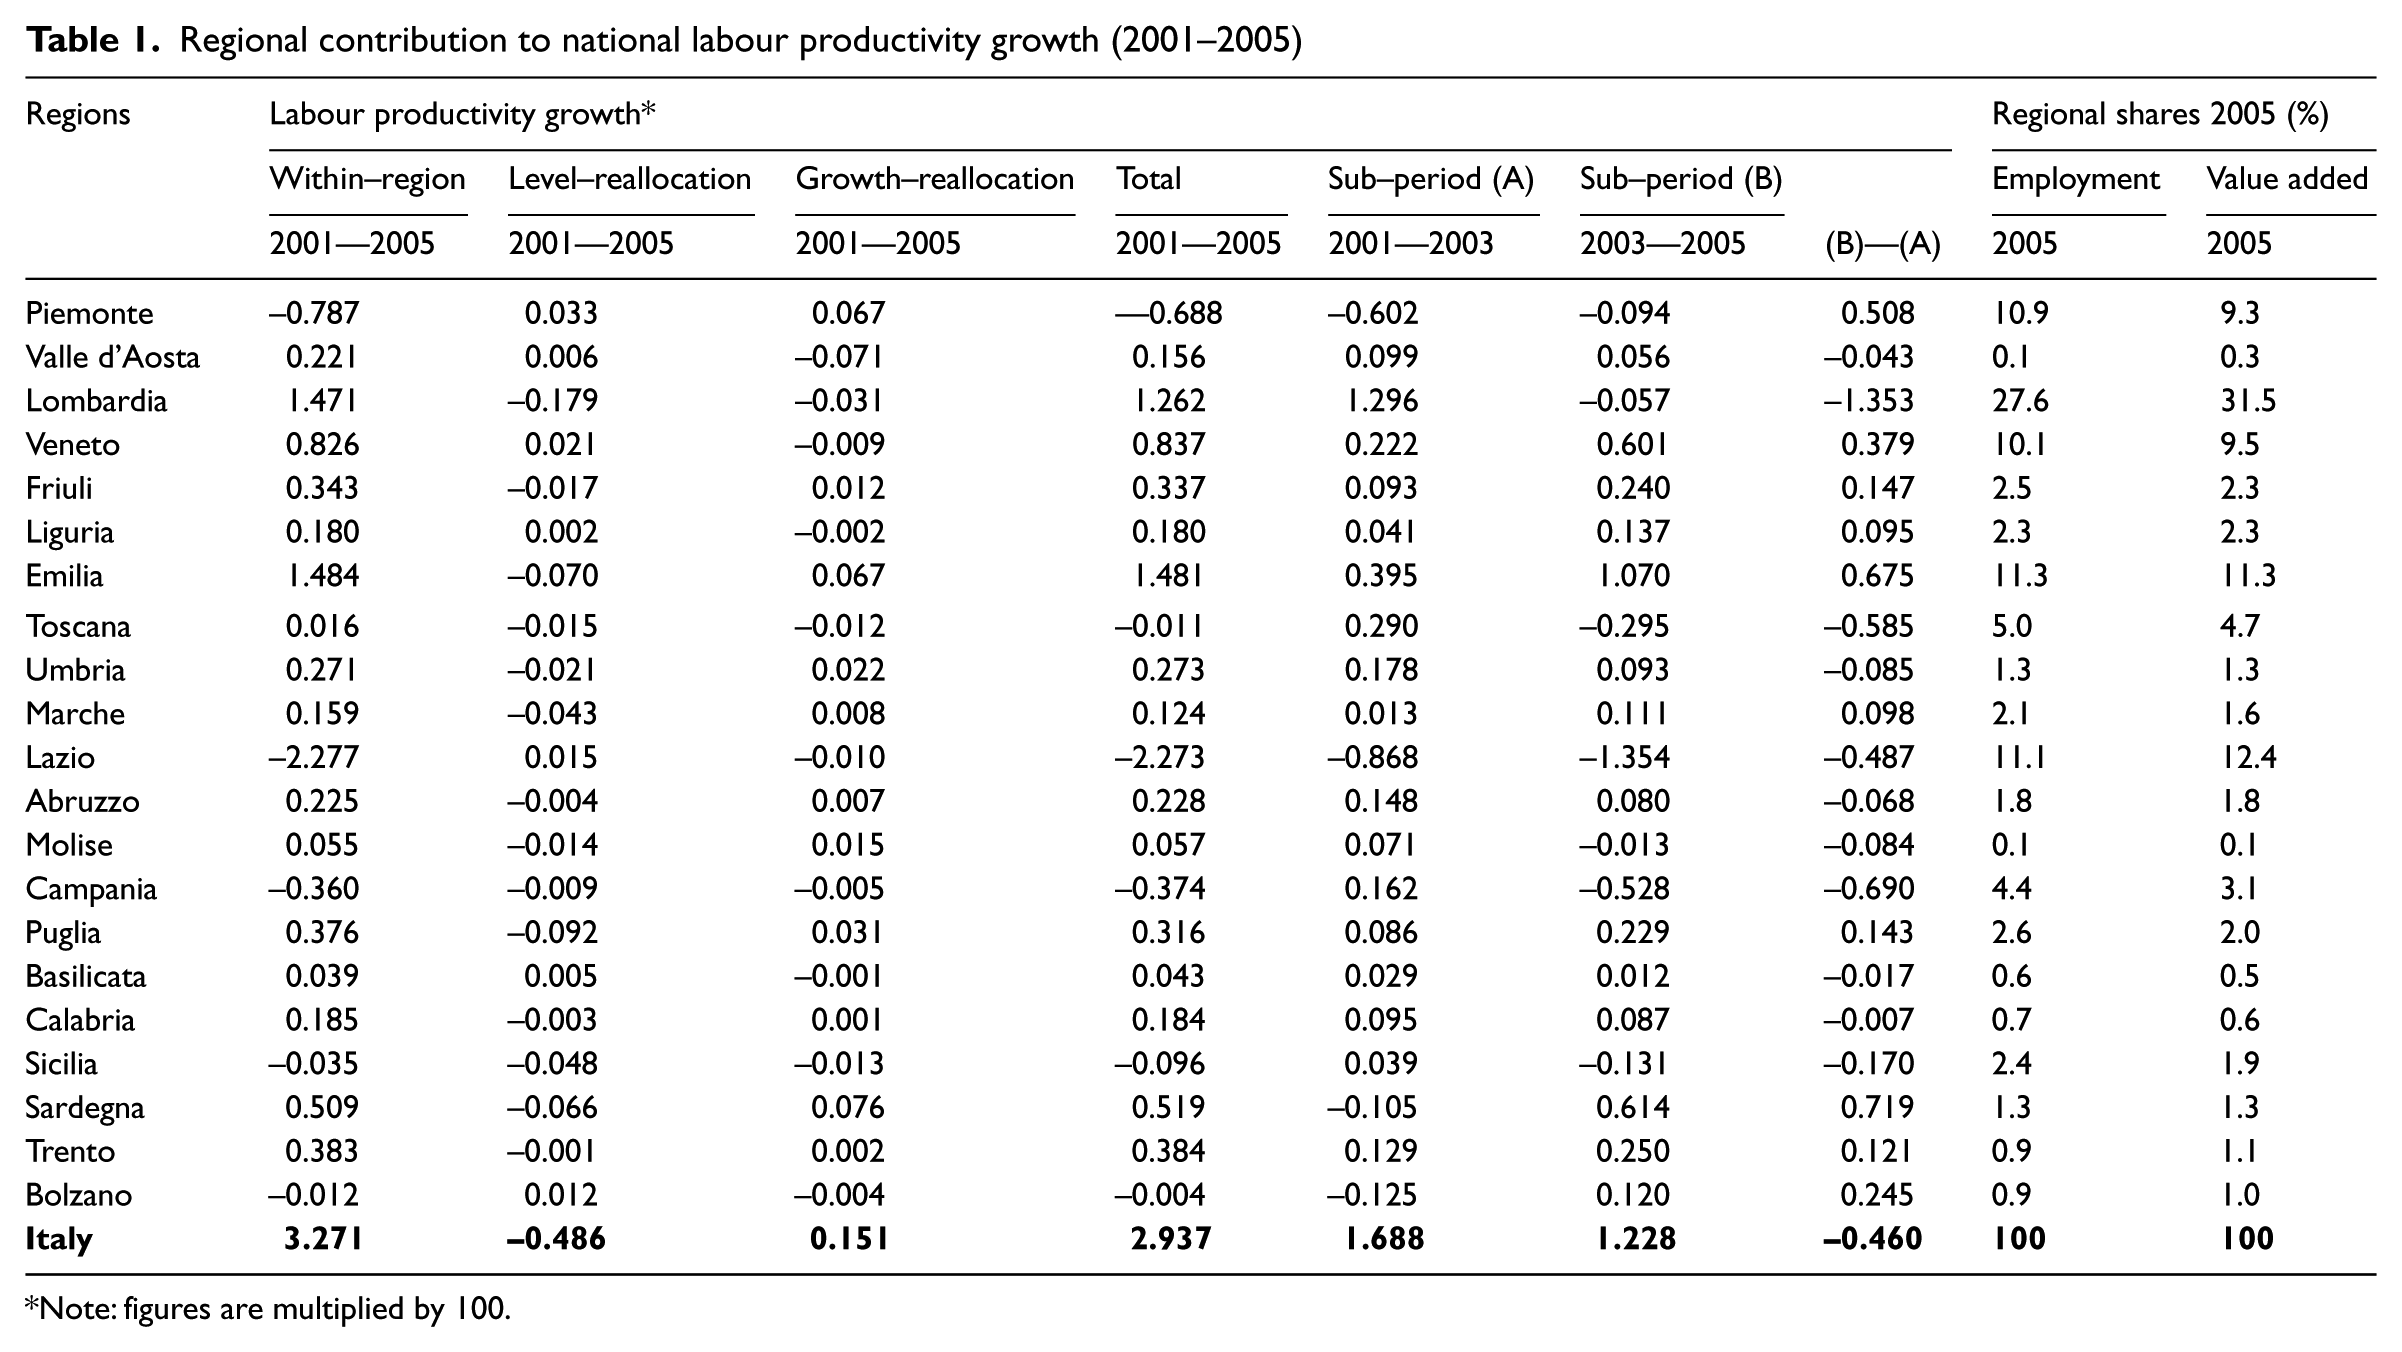
Note: figures are multiplied by 100.
As pointed out by previous studies (Daveri and Jona-Lasinio, 2005), the slowdown of Italian economic growth since the mid-1990s and throughout the 2000s has been mainly attributed to a declining labour productivity, holding back in all industries but utilities (with manufacturing accounting for about half of the slowdown). Looking at Table 1, Italy as a whole recorded a labour productivity growth of 2.9 in the period 2001–2005, with a decreasing trend in the latest years here considered (2003–2005). The regions that contribute most to the national growth are Lombardia (1.3), Emilia (1.5) and Veneto (0.8), with the first experiencing a slowdown in 2003–2005, whilst the other two regions strengthened their positive contribution particularly in the second sub-period. On the negative side, the regions holding back the country’s labour productivity performance most are Lazio (with a strongly negative figure of –2.3, resulting from a steady deterioration over the 5 years here considered), Piemonte (–0.7) and, to a lesser extent, Campania (–0.4), whose drop is particularly visible in the second sub-period. Some of the southern regions – such as Puglia (0.3) and, quite outstandingly, Sardegna (0.5, the highest contribution of the whole Mezzogiorno, increasing over the 5 years considered) – provide a noticeable input to the Italian productivity growth, higher than that of the central regions and some of the traditional northern industrial cores.
In the decomposition analysis at the regional level, the within-region effect, which captures the gain (or loss) in the aggregate labour productivity growth of each region weighted by its initial employment share, accounts for the bulk of productivity trends. In other words, the contribution to national productivity growth comes mainly from those regions whose firms registered increases in efficiency and competitiveness: thus, regional contributions differ on account of different micro-level dynamics. Conversely, reallocation effects are rather weak, overall displaying a small negative level reallocation and a negligible positive growth reallocation. As stated above, reallocation (or between-regions) effects grasp the gain (or loss) in aggregate labour productivity stemming from a rise (or fall) in the employment share of a region with productivity levels/growth rates higher (lower) than the national average. This seems to indicate that, in the period considered, there was no substantial shift of employment away from higher-productivity/faster-growing regions to other, less productive, areas.
It is interesting to report a few observations on the decomposition by sector within each region for those regions that register the strongest (either positive or negative) productivity variation over the 5 years. The highest contribution to Lombardia’s labour productivity growth comes from Other services (2.5), Metals (0.9) and Electrics (0.6), all showing a strongly positive within-sector effect, with only the first industry experiencing a small negative level reallocation effect. 12 Noteworthy, the contribution of the ICT-producing industry is positive for all three ICT sectors, particularly for Software and Communication equipment (0.4 in both). In Veneto, the two most dynamic industries in terms of labour productivity growth are Other manufacturing (4.4) and Wholesale and retailing trade (3.1), both registering a high within-sector effect, accompanied by relatively pronounced positive between-sector effects: in this region, therefore, some shift of employment to above-average productivity industries occurred over the period considered. In Emilia, remarkable within-sector effects characterise the positive contribution of Other manufacturing (4.0), Metals (3.5) and Wholesale and retailing trade (3.2): the ICT sector as a whole, and Software in particular, also provides a positive contribution to the regional labour productivity performance.
The negative productivity growth recorded in Piemonte – not surprisingly given the crisis of Fiat during the period considered – is almost entirely attributable to Means of transport (–12.5), showing an exceptionally negative within-sector effect, yet accompanied by overall positive (though small) between-sectors effects. Lazio’s drastic and persistent fall in productivity is concentrated in Wholesale and retailing trade (–19.1) and it is entirely of a within-type, whilst Campania follows Piemonte’s fate in the sharp decline of labour productivity in Means of transport (–13.5), with similar (though higher) between-sector effects.
More generally, the contribution of ICT-producing industries to regional growth turns out to be positive in the large majority of cases. The contribution of Hardware is always positive, no matter its regional location; Software shows among the highest inputs to regional productivity, which are negative only in the case of four regions, namely Trentino Alto-Adige, Umbria, Sicilia and Calabria; Communication equipment is instead more geographically specific, contributing always positively to regional productivity growth in the north – but in Trentino – and in the centre – but in Lazio – but displaying consistently negative values in the whole Italian Mezzogiorno.
Overall, the results of the decomposition exercise carried out above seem to indicate that the regions that contributed most to the modest aggregate labour productivity performance in Italy are those which benefited the most from the efficiency-enhancing effects of innovation and technological progress. Indeed, as shown by the plot reported in Figure 1, a positive correlation emerges between the average labour productivity growth of ICT-producing firms in a region and the ‘within’ contribution to national growth of each region.

Labour productivity of ICT-producing firms and regional contribution to growth.
Furthermore, as argued in the second section above, the productivity growth of regions which attract high shares of ICT-producing industries should be comparatively higher, because of the high rates of innovation in such industries; however, by using the new products and services provided by ICT producers – computers, the Internet, software, etc. – the overall growth rate of the region can be further enhanced (Acconcia and Del Monte, 2003). As a preliminary indication of such a complementary relationship between ICT production and ICT use, a positive correlation between the contribution ‘within’ to the national productivity growth and a proxy for ICT use (share of firms using the Internet) 13 by region is shown in Figure 2; ICT use is then contrasted with the average labour productivity growth of ICT-producing firms in Figure 3, supporting the positive association found in the literature (see, among others, Atzeni and Carboni, 2006; Giunta and Trivieri, 2007).

ICT use and regional contribution to growth.
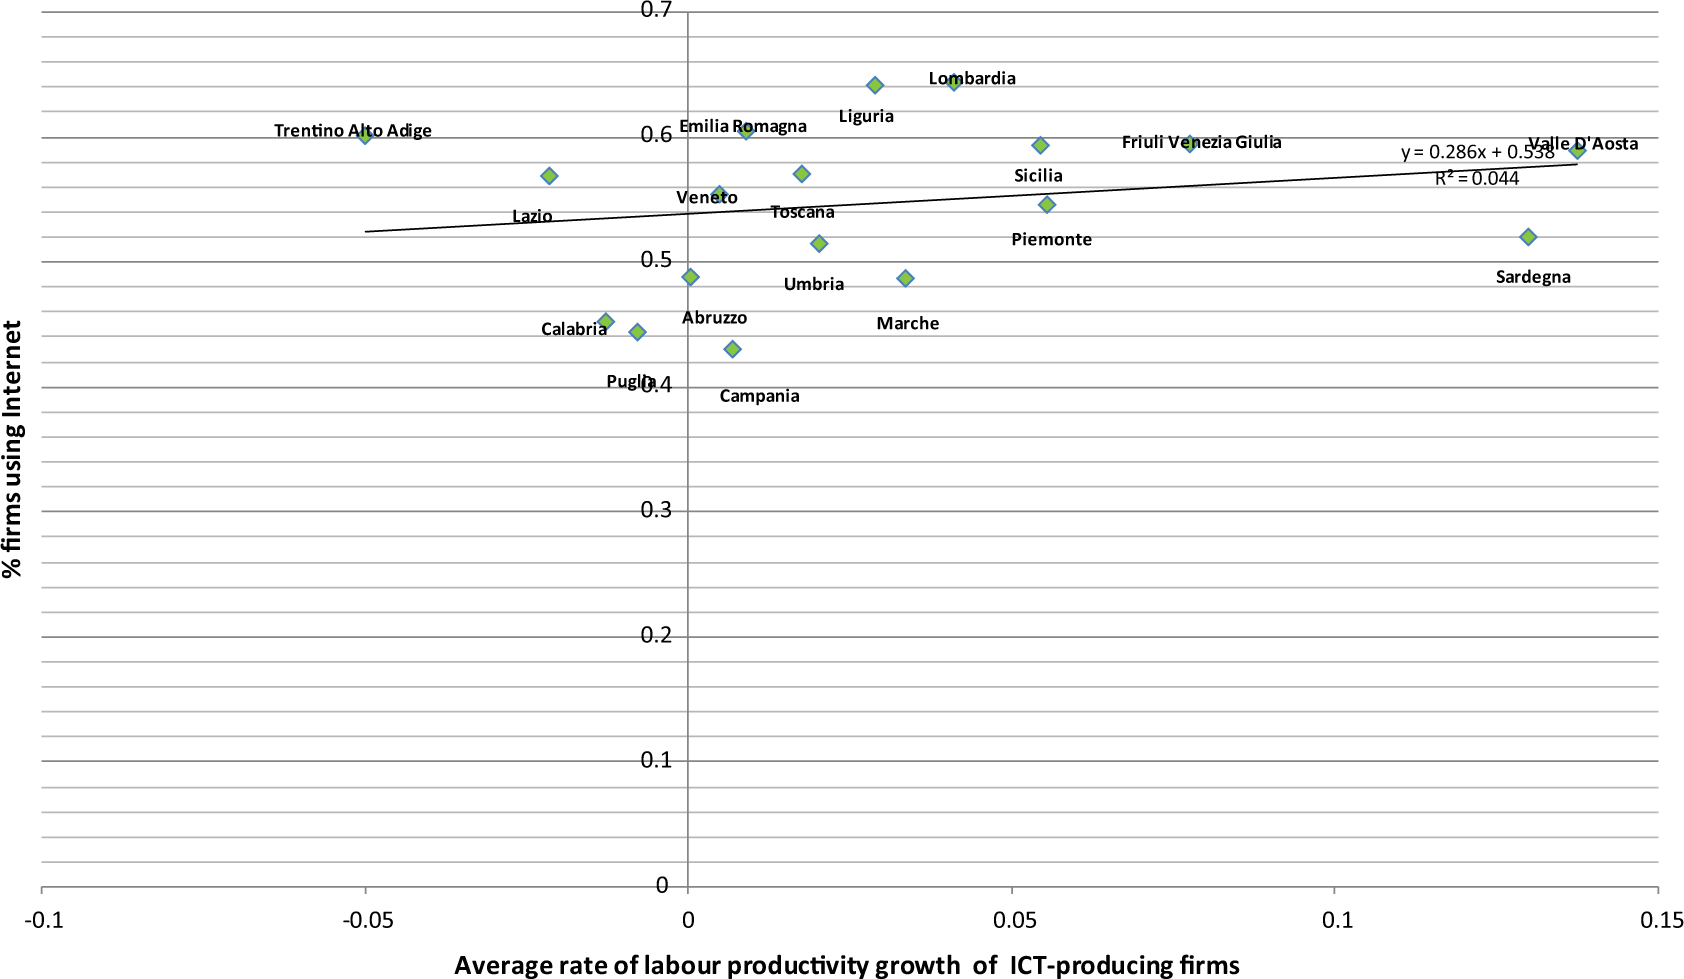
Labour productivity of ICT-producing firms and ICT use.
ICT production and regional productivity
The production function framework
As discussed in the section on literature background above, industries and regions are made up of heterogeneous individual firms, showing large and persisting differences in productivity performance. Moreover, large-scale reallocation of outputs and inputs between producers occurs over time, also and perhaps mostly within industries, and such a reallocation from less to more productive businesses has been shown to contribute significantly to aggregate productivity growth in a variety of OECD countries. Furthermore, most of the literature on ICT and productivity concludes that disaggregated data are needed to tie productivity performance to business practices (e.g. Greenspan, 2000; Stiroh, 2002). These considerations underlie the choice to implement our analysis firstly at the firm level and then replicating it at a more aggregate level by fitting the productivity model (equation (7) below) to observations on the average productivity for each region. 14 For notational convenience, we embody in our specification the assumption of constant returns to scale (see Daveri and Jona-Lasinio, 2008).
We consider a value-added production function, instead of an output-based one. 15 Subject to this qualification, in each period t, the production function for firm i at time t is the following:

where firm value added Y (in logs) is a log-linear function of the labour input L, capital services K and the efficiency parameter A.
The estimates of the effects of ICT production are based on a simple linear model for productivity. We denote the log of the efficiency parameter A of firm i in region j at time t by ln(Ai), and let DS be an indicator of ICT (or, alternatively, manufacturing or service) firms. Then we can write:

where βA,iis a firm effect, the coefficient βsis the effect of ICT production (manufacturing, services) on labour productivity, DS identifies ICT (or, respectively, manufacturing and services), δt is a period effect common to all firms and uit is a residual.
Empirical strategy
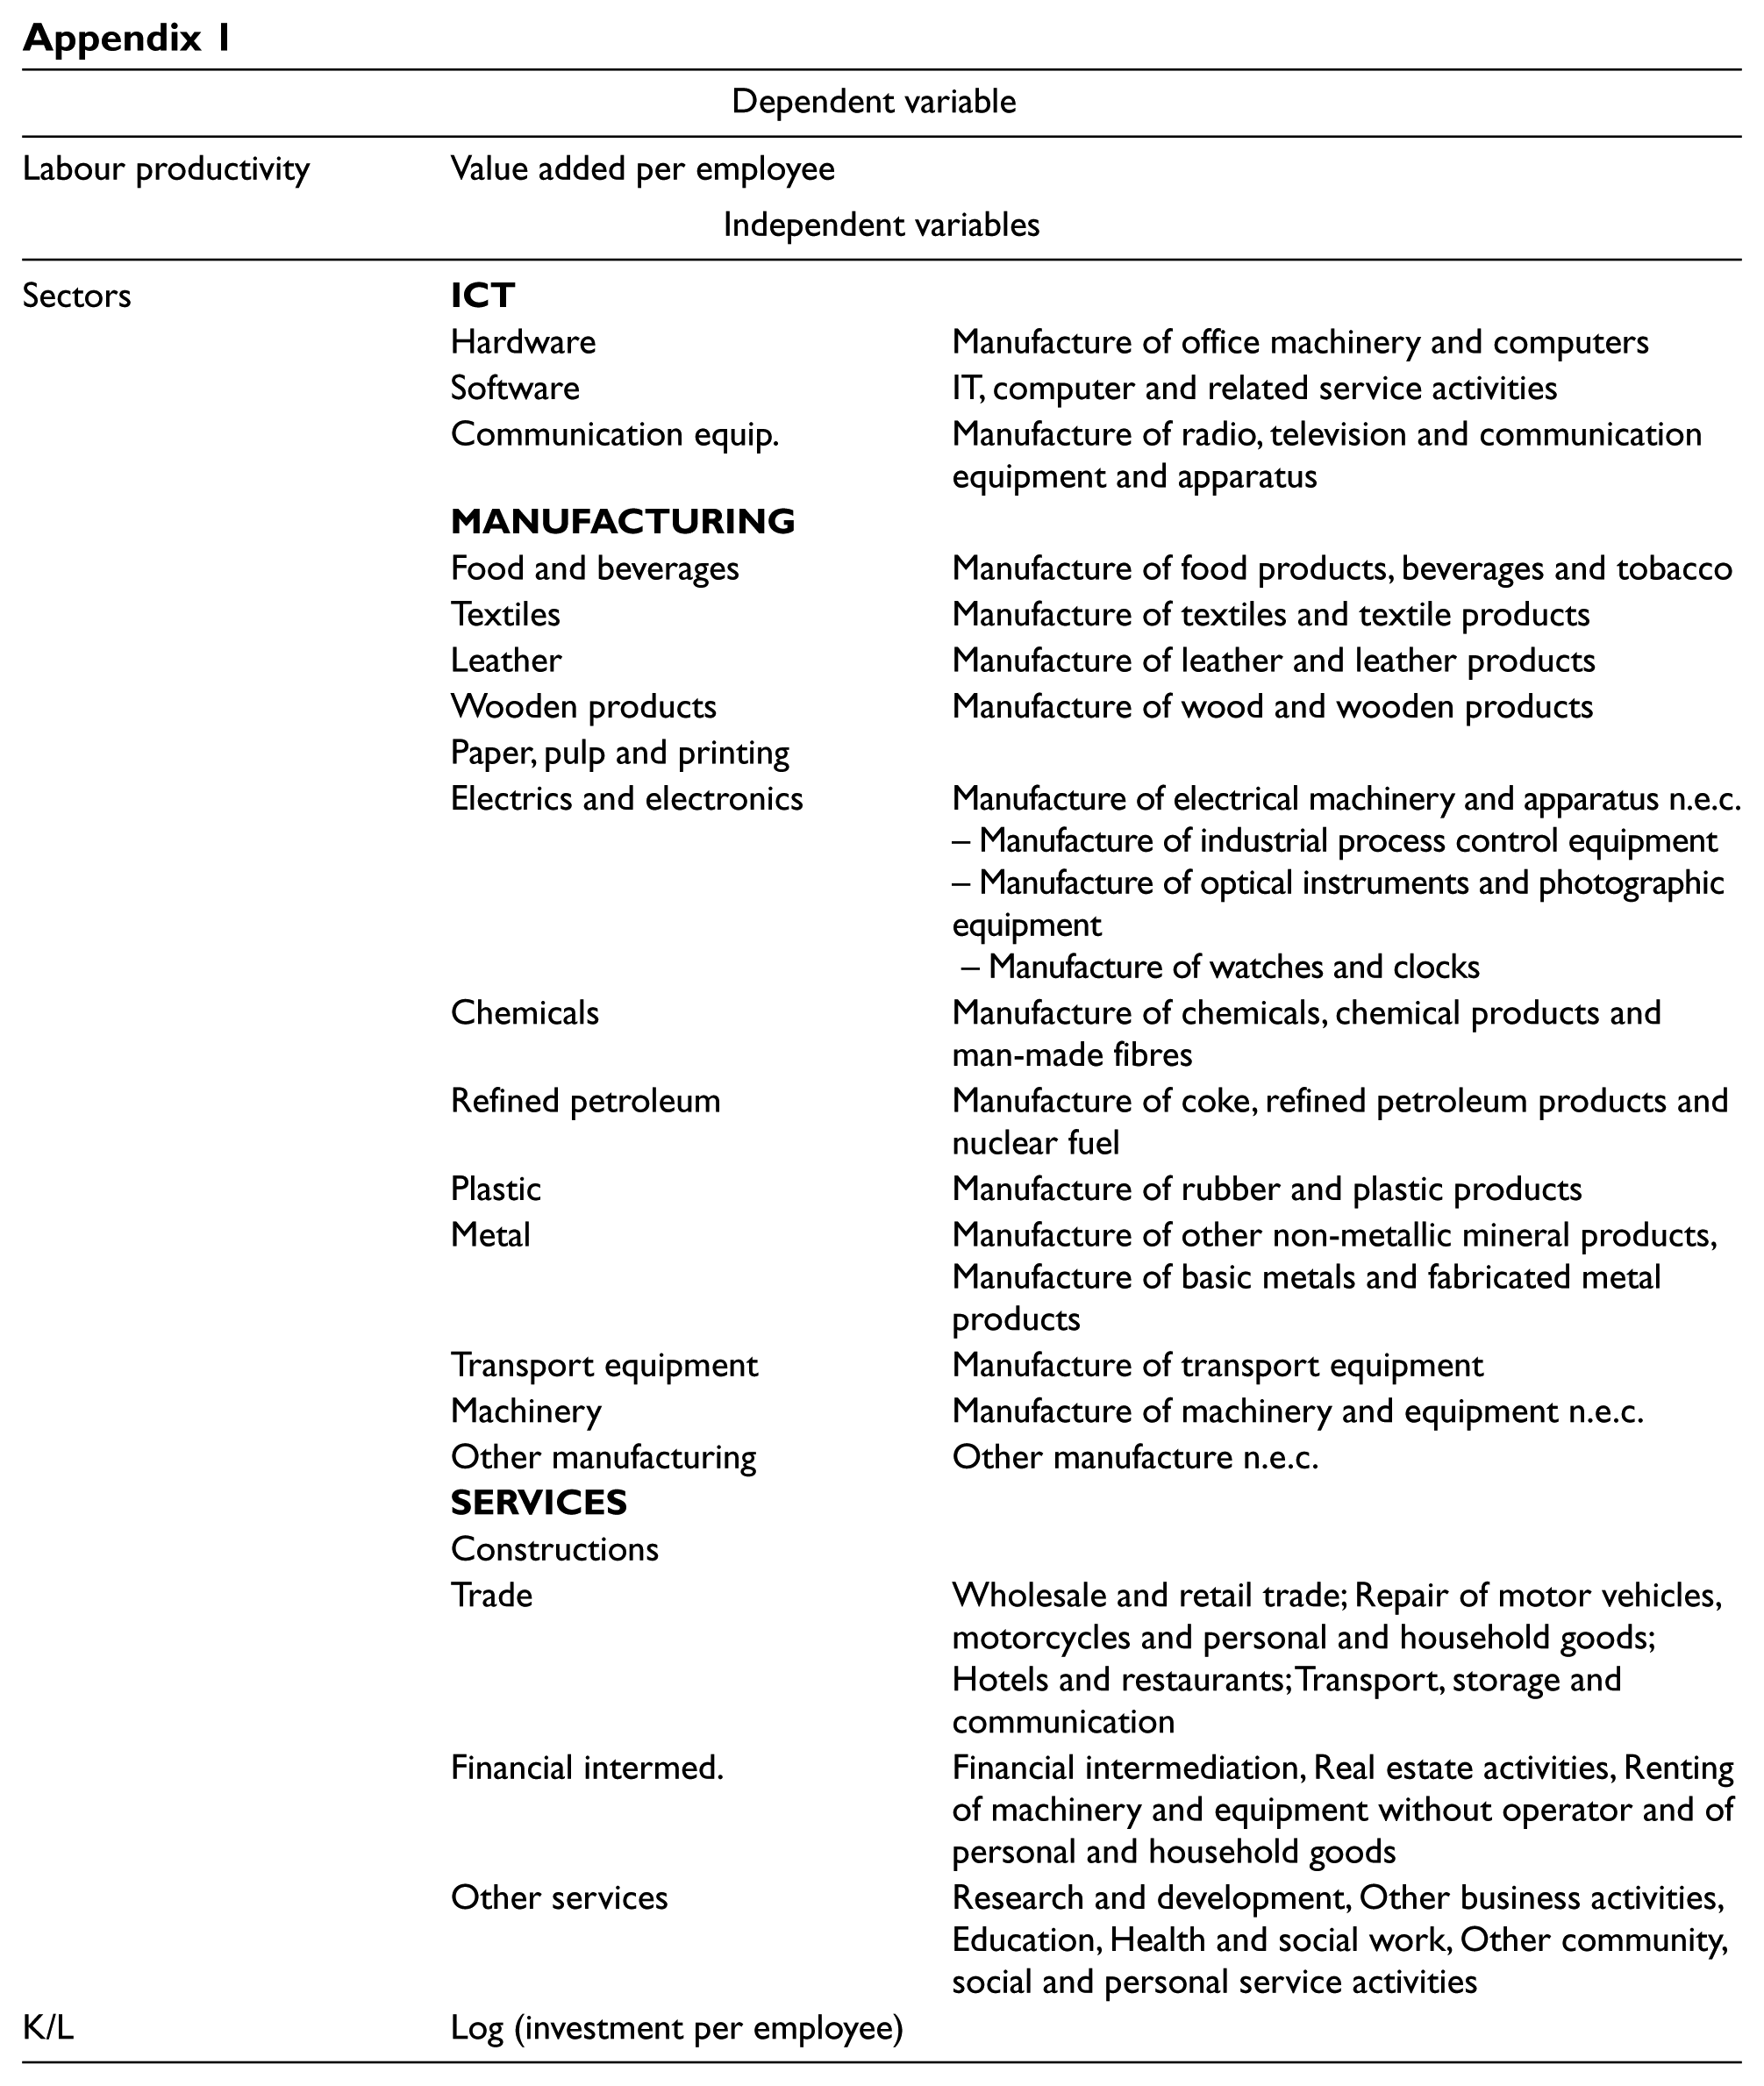
To evaluate the relationship between ICT production and productivity we relate labour productivity to per-capita investment (taken as a proxy for capital stock at the firm level) and to our main variables of interest: sectoral dummies representing respectively ICT, manufacturing and service firms (see Appendix 1 for variable description). We carry out this exercise both at the firm level for each region and for regional average values.
Our intended goal here is to identify some partial correlation between sectoral structures – with particular attention to the ICT-producing industry – and firm/regional productivity by estimating the coefficients of the dummy variables in equation (8). To obtain an empirically usable equation for estimating such a relation we substitute the expression for the log of A from equation (8) into equation (7), and subtract the labour input on both sides. Such a simple transformation provides an expression that relates labour productivity to both the capital-labour ratio and the industry dummies.
We estimate a panel regression that relate the value added per employee in each firm i (region j) at time t (LPit; with i = 1,.., 7200, and t = 2001, .., 2005) to the firm capital labour ratios (KLit) as well as the set of our industry (Ds) and (Dt) time dummies.
In short, our baseline specification is as follows:

where the last three terms indicate that the error term is decomposed into industry-invariant period-specific components, time-invariant firm specific components and a white-noise residual that varies across both time and firm dimensions.
We start estimating equation (9) for 7,200 firms over 2001–2005 by OLS with industry-specific dummy variables and heteroskedasticity-consistent standard errors. Even upon choosing value added as a dependent variable (as discussed above), a remaining key estimation issue is the possible endogeneity of right-hand side variables, namely the capital–labour ratio. 16 We thus resort to instrumental variables estimates: our instruments for the capital–labour ratio are the log-levels of the same variable lagged twice, and our set of industry dummy variables. 17
Results
Table 2 presents the results on regional average values from the OLS estimates with industry-specific dummy variables and from the two-stage least square (2SLS) estimates.
Regional labour productivity and regional sectoral structure – LSDV and 2SLS estimates on regional average values

Robust standard errors in parentheses.
significant at 5%; ** significant at 1%.
The reported value of the centred R-squared refers to the second stage of each regression.
As expected, our proxy for capital stock exerts a highly positive and significant impact on productivity in all the specifications of the model. More importantly for our purpose here, a strongly positive and significant relationship emerges between ICT production and labour productivity growth for the estimates on the regional means. Indeed, this finding holds as well for both the LSDV and 2SLS estimates at the firm level for each region, whose results are reported in Table 3 only for those regions which contributed the most (i.e. Lombardia, Emilia and Veneto) and the least (i.e. Piemonte, Lazio and Campania) to the national productivity growth in 2001–2005.
Regional labour productivity and regional sectoral structures – 2SLS estimates
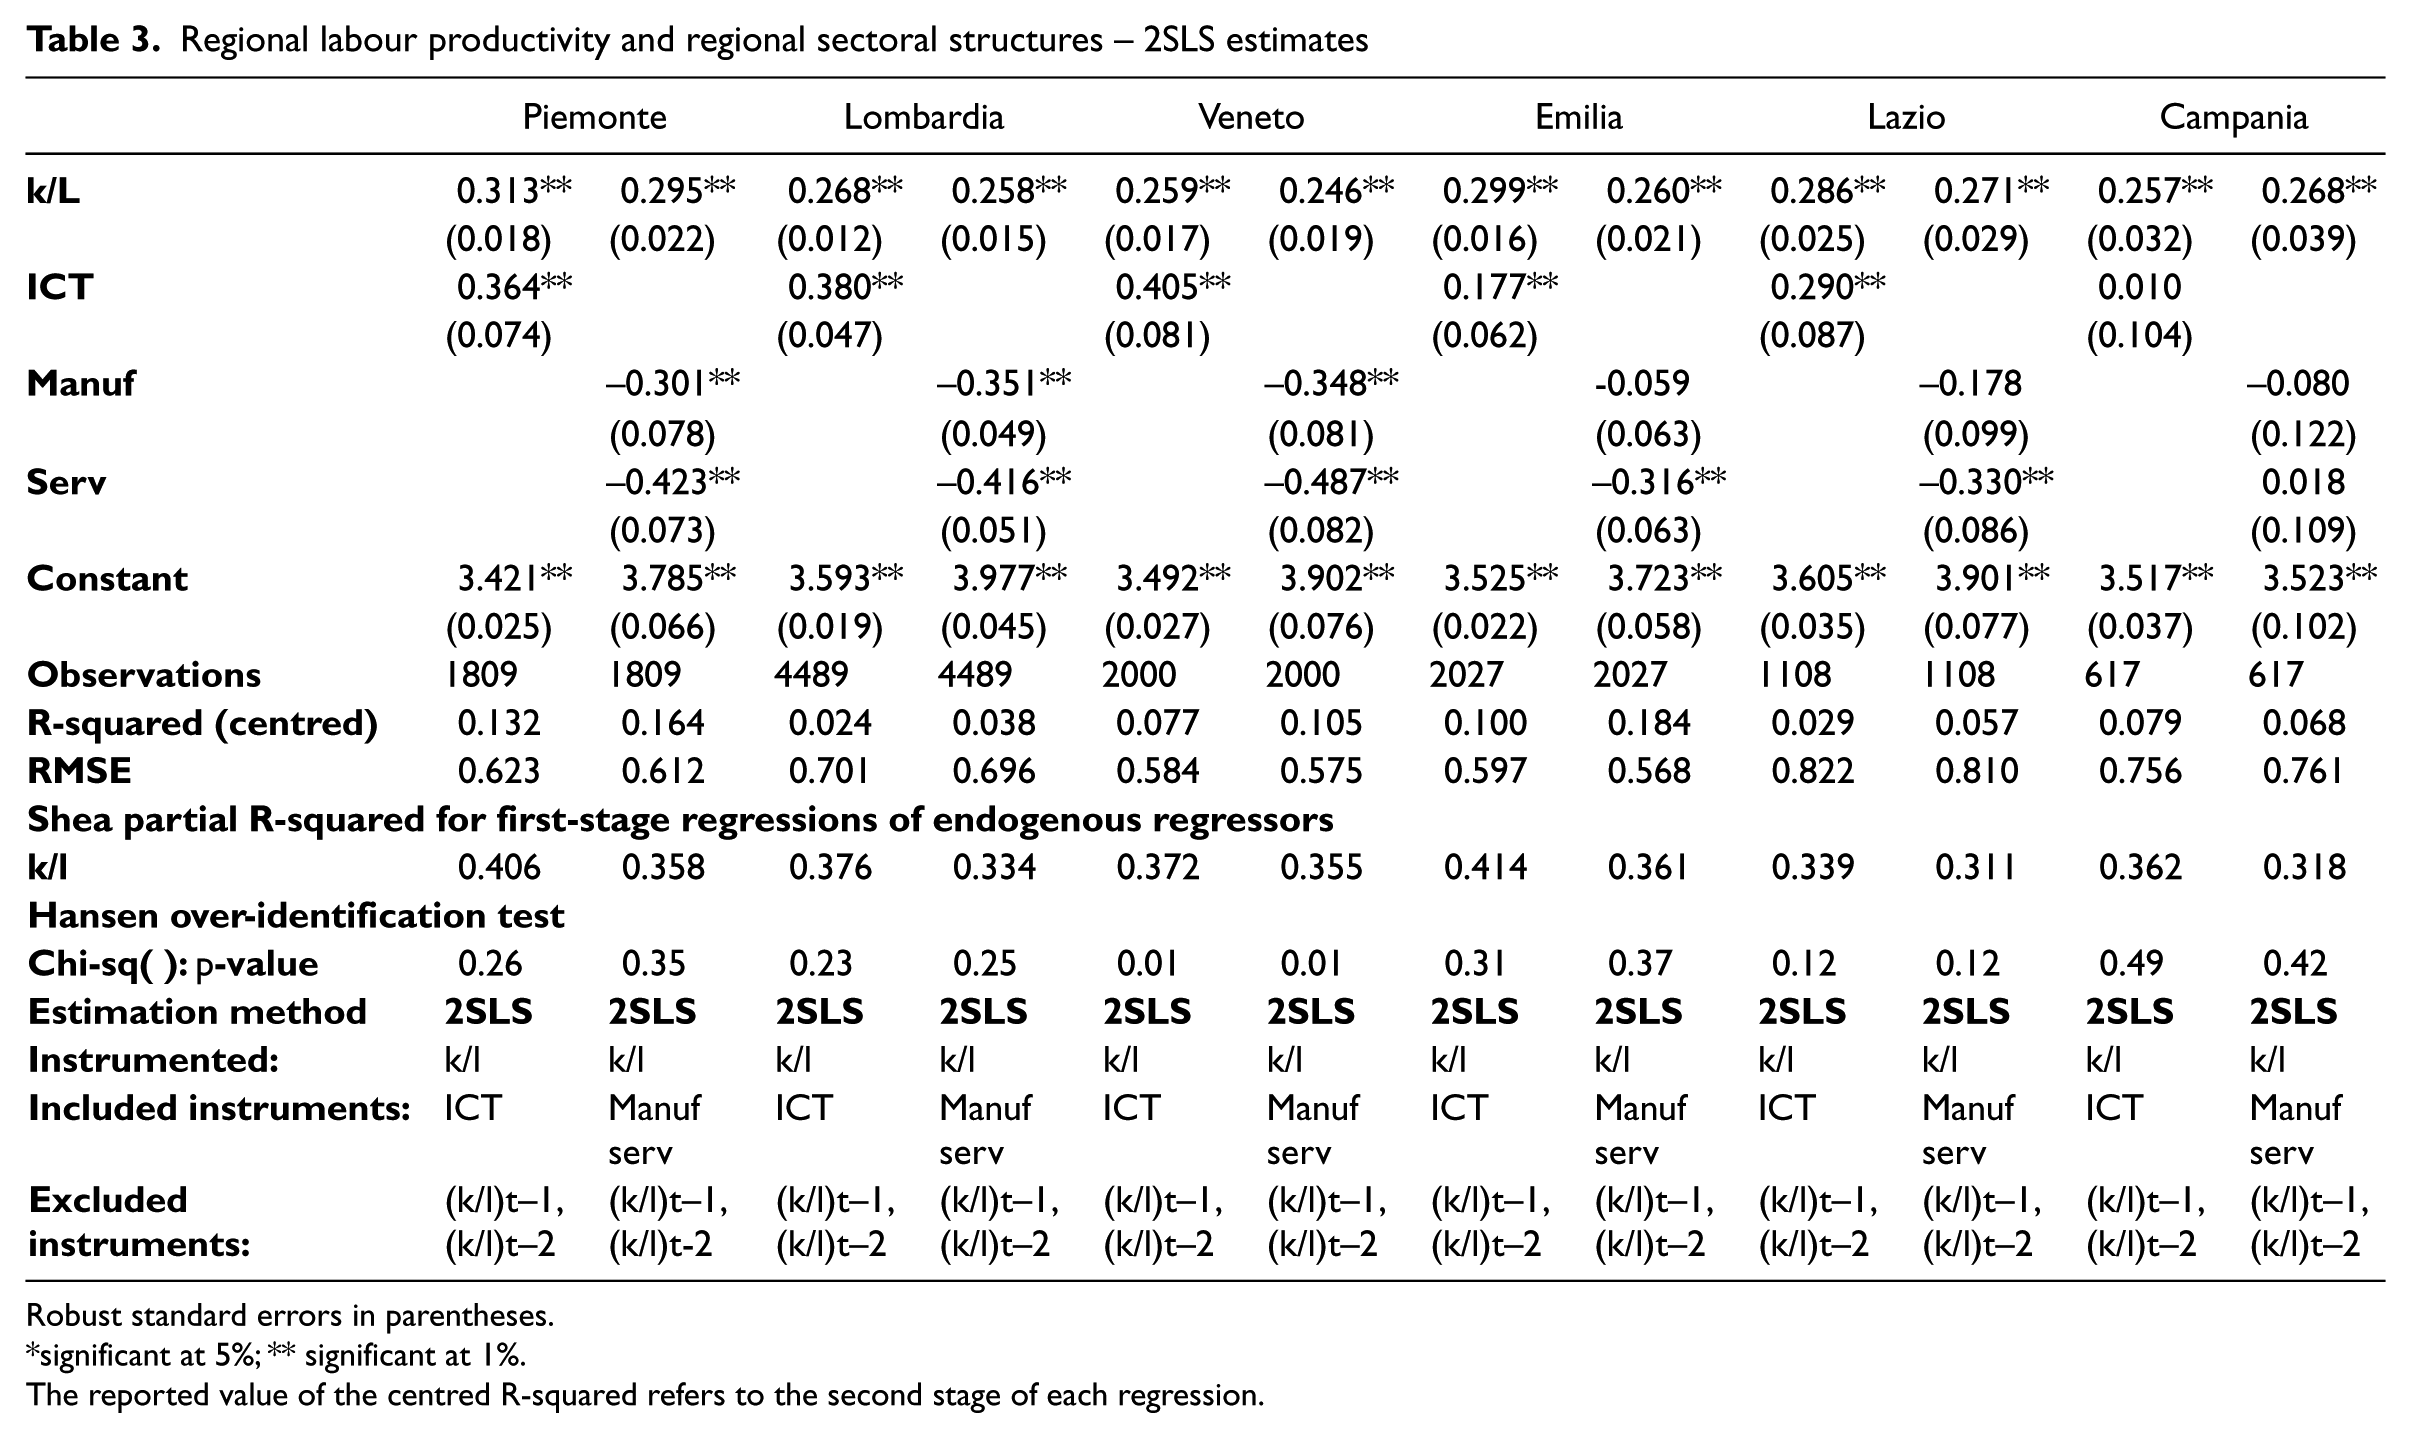
Robust standard errors in parentheses.
significant at 5%; ** significant at 1%.
The reported value of the centred R-squared refers to the second stage of each regression.
The results show in fact a highly significant (1% level) and positive association between ICT productions and labour productivity in nine Italian regions out of 18 (as from Map 1, Molise and Basilicata were excluded because of the lack of ICT-producing firms). In the remaining regions (Valle d’Aosta, Trentino Alto-Adige, Friuli Venezia-Giulia, Liguria, Marche, Abruzzo, Campania and Puglia), the coefficient is always positive but not significant. The only exception, showing a negative (though not significant) relationship between the ICT indicator and labour productivity, is Sicilia. Conversely, the variables for Manufacturing and Services display a strongly negative association with labour productivity growth, both for the regressions on the regional means and for those of many individual regions. Indeed, in the latter case, although the negative coefficients are not always significant (as in the case of Manufacturing in Emilia, Lazio and Campania in Table 3), the regions that display positive coefficients (never significant, though) are only Valle d’Aosta, Trentino Alto-Adige and Sicilia in the case of Manufacturing, and Campania and Sicilia in the case of Services.
Overall, our results indicate that the growth of the Italian labour productivity in the first half of the 2000s is mainly due to the efficiency-enhancing effects of technologically leading industries such as ICT. The strength of such an association is still particularly evident in those regional innovation systems – such as Piemonte, Lombardia and Veneto 18 – where the industrial and institutional structures have been able to adjust more rapidly to technological change and to attract the production of those goods and services with higher inputs of knowledge and intangibles. On the other hand, the positive effects of ICT-producing firms in Italian regions are not enough to counterbalance the rather poor performance of the rest of the economic structure. The general negative performance of manufacturing – recorded in particular in the same traditional industrial regional cores (e.g. Piemonte, Lombardia, and Veneto) – and of services – still less advanced than in other European economies – confirms once more that the Italian specialisation model as a whole is closer to a ‘falling behind’ pattern than to a ‘catching up’ trajectory, somewhat locked in to an innovation-adverse economic and institutional development path.
Conclusion
In this paper we have investigated the picture framing the slowdown of Italian labour productivity since the mid-1990s by taking into account the relationship between ICT-producing firms, productivity and regional performances. The first step of our analysis, that is the decomposition of the overall national productivity growth by region – and by industry within each region – has served not only the purpose of identifying those territorial units which contributed the most/least to the Italian aggregate growth in the period considered, but also that of uncovering the critical importance as engine of the (modest) Italian growth of the ‘within’ contribution. In other words, the regions that contributed most to the aggregate productivity growth are those in which the average growth of labour productivity of ICT-producing firms was the highest. In the second step, the econometric analysis has provided further support to the descriptive picture, confirming the efficiency-enhancing effects of the location of ICT production on regional performances in terms of labour productivity.
The analysis here reported, however, sheds light only on one side of the relationship between new technologies and labour productivity. Indeed, part of the productivity gains attributed to the ICT-producing industry is likely to be ascribed to ICT use. The hypothesis of ICT-adoption-led growth, and its emphasis on technological diffusion, cannot be disentangled from that of ICT-production-led growth. Most likely, regional productivity gains are achieved by the combination of the capacity to generate new goods and services and the capacity to transmit and diffuse new knowledge.
The clarification of the complementarity between ICT use and ICT production is critical to provide sensible directions to policy makers. To become an attractive location for industries based on general-purpose technologies, a region needs capabilities and institutions that favour the systemic and interrelated nature of innovation and technological change, ensuring also widespread knowledge diffusion and adoption: in other words, the region needs a system in place. Thus, the principal role that policy intervention – at the international, national and regional levels – can play is that of supporting the establishment of systemic relationships among the regional actors and bridging the supply and demand of ICT – and other general-purpose technologies – within the regional environment. As argued by Bell and Pavitt (1997), whilst public policies generally facilitate the accumulation of production capacity, they often fail to provide incentives and opportunities for technological learning, thus not supporting the accumulation and upgrading of technological capabilities and absorptive capacity in both firms and regions.The ICT drift helps individuals, firms and places not only to produce more, but to produce new things in new ways (Steinmueller, 2001). In this respect, the same ICTs might be used in a variety of different ways in order to enhance socio-economic conditions and reduce regional gaps (Mansell and Steinmueller, 2000). Not all firms and regions are obviously expected to be on the frontier of the prevailing technological paradigm, but some new technology production capacity, and the associated structural change, is required to build the competence to take advantage of the social and economic rewards of technological progress (Steinmueller, 2001).
The preliminary exercise here presented is currently being developed in several directions. First, the analysis should be extended longitudinally to capture firm dynamics (in the present paper we have considered the balanced panel of Italian firms with more than 99 employees) and implications of productivity growth for regional convergence. Second, and relatedly, in order to understand in depth the dynamics of regional growth in Italy, it is essential to replicate the present exercise for ICT-producing small firms (data are available from the Sample Survey of the System of Accounts of Business Units addressed to Italian small and medium-sized firms with fewer than 100 employees), which play a major role in the Italian industrial structure and whose behaviour may shed additional insights of specific regional performances. Third, as discussed throughout the paper, the demand side of the relationship between ICT and productivity should be integrated into the investigation; the complementarity between demand and supply of ICT urgently needs a resolution.
Footnotes
Appendix
| Dependent variable |
||
|---|---|---|
| Labour productivity | Value added per employee | |
| Independent variables | ||
| Sectors |
|
|
| Hardware | Manufacture of office machinery and computers | |
| Software | IT, computer and related service activities | |
| Communication equip. | Manufacture of radio, television and communication equipment and apparatus | |
|
|
||
| Food and beverages | Manufacture of food products, beverages and tobacco | |
| Textiles | Manufacture of textiles and textile products | |
| Leather | Manufacture of leather and leather products | |
| Wooden products | Manufacture of wood and wooden products | |
| Paper, pulp and printing | ||
| Electrics and electronics | Manufacture of electrical machinery and apparatus n.e.c. – Manufacture of industrial process control equipment – Manufacture of optical instruments and photographic equipment – Manufacture of watches and clocks | |
| Chemicals | Manufacture of chemicals, chemical products and man-made fibres | |
| Refined petroleum | Manufacture of coke, refined petroleum products and nuclear fuel | |
| Plastic | Manufacture of rubber and plastic products | |
| Metal | Manufacture of other non-metallic mineral products, Manufacture of basic metals and fabricated metal products | |
| Transport equipment | Manufacture of transport equipment | |
| Machinery | Manufacture of machinery and equipment n.e.c. | |
| Other manufacturing | Other manufacture n.e.c. | |
|
|
||
| Constructions | ||
| Trade | Wholesale and retail trade; Repair of motor vehicles, motorcycles and personal and household goods; Hotels and restaurants; Transport, storage and communication | |
| Financial intermed. | Financial intermediation, Real estate activities, Renting of machinery and equipment without operator and of personal and household goods | |
| Other services | Research and development, Other business activities, Education, Health and social work, Other community, social and personal service activities | |
| K/L | Log (investment per employee) | |
Acknowledgements
The authors are grateful to the partners of the Intangible Assets and Regional Economic Growth (IAREG) Project for the useful comments and suggestions received during the project workshops and conferences. They would like also to thank two anonymous referees for their valuable and constructive comments. All errors remain our own.
Funding
The research leading to these results has received funding from the European Community’s Seventh Framework Programme (FP7-SSH-2007-1. 216813) under grant agreement n° 216813.