
Abstract
Several studies have detected a positive relationship between the spatial dynamics of cultural and creative industries (CCIs) and their social and economic outcomes. In this article, we draw upon the Economic Complexity Index (ECI) as a proxy to capture the social interactive nature that characterises CCIs and the way this affects firm performance. Our assumption is that more complex locations, endowed with different types of more sophisticated production capabilities, allow CCI firms to perform more strongly. This can depend on the higher opportunities of complex knowledge sharing and cross-fertilisation processes among different types of CCI firms or with non-CCI firms. The focus is on Italy, a country with a long-standing historical tradition in culture and creativity. We draw upon an original panel database at firm and province level (for the period 2010–2016) to compute two different ECIs, one for the CCIs and another one for the rest of the economy. Moreover, we analyse the effects these two types of complexity on the performance of firms within sectors with different levels of cultural and commercial value. We find that economic complexity of CCIs but not economic complexity of the rest of the economy matters for CCI firm performance. However, the effect is relatively weak. The same finding applies to all CCI firms, irrespective of their type of sector. Policy implications and directions for future research are discussed.
Introduction
The cultural and creative industries (CCIs) have become a significant part of the modern economy, contributing to a growing proportion of global gross domestic product (GDP), growth and employment (OECD, 2018; UNESCO, 2018). While governments and policy makers have increasingly invested in these industries to revitalise countries, regions and cities across the world, academic communities have thoroughly examined their characteristics, dynamics and role as drivers of economic development. A substantial body of research has focused on the geographies of CCIs by exploring their tendency to concentrate in specific places as well as the determinants and economic consequences of this phenomenon. Most importantly, several studies have pointed out how these dynamics of spatial concentration are linked to positive economic outcomes for places and CCIs (e.g. Bakhshi et al., 2008; Chapain et al., 2010; De Vaan et al., 2013; Klement and Strambach, 2019b; Lee, 2014).
The strong symbiosis between creativity, economy and places has made the notion of cultural and creative clusters increasingly popular among scholars and policy makers (Bloom et al., 2020; Chapain and Sagot-Duvauroux, 2020). Traditional forms of agglomeration economies, including, for example, the proximity to interrelated specialised firms, skilled workers, resources or infrastructures for the generation of economies of scale, can also be applied to CCIs. In particular, these knowledge-intensive industries draw upon a key self-reinforcing mechanism of growth, where localised creative communities foster social interactions, cross-fertilisation of ideas, learning processes and knowledge exchange, which make both businesses and entrepreneurship thrive (Brandellero and Kloosterman, 2010; Chapain et al., 2010; Cohendet et al., 2014; Martin and Moodysson, 2011; Scott, 2014; Storper and Venables, 2004; Turok, 2003).
However, while agglomeration scholars have shown how benefits arising from being within clusters lead to superior firm performance, little research has so far looked at the effects of CCIs agglomerations on the growth, productivity and profitability of these firms. According to De Vaan et al. (2013), CCI firms benefit from variety in employee’s expertise in geographic clusters that reach a critical scale allowing for rich network interactions. More recently, Tao et al (2019) emphasised how the diversity of economic activities and people clustered in one place contributes to raising the productivity of CCI firms. In this regard, few studies have applied the concept of relatedness or related variety – which suggests that it is easier for regions to specialise in industries in which they already have relevant knowledge and capabilities (e.g. Frenken et al., 2007; Hidalgo et al., 2007) – to CCIs. These works show how firms benefit from the proximity to both CCI and non-CCI firms thanks to processes of cross-fertilisation, knowledge spillovers, and spread of stimuli, creativity and ideas between similar and different types of activities, yielding positive effects on innovation and economic growth of places (Cohendet et al., 2014; Innocenti and Lazzeretti, 2019; Klement and Strambach, 2019a; Lee, 2020).
CCIs are indeed characterised by a complex network of connections between different typologies of organisations and actors within an area, which benefit from their proximity (Iansiti and Levien, 2004). In other words, CCI agglomerations seem to be positively affected by the number, quality and diversity of such organisations and actors clustered within an area (Holden, 2015). In view of this, we assume that the performance of CCI firms, which are considered as interconnected parts of their larger environment (Comunian, 2019), depends on the complexity of the location in which they are embedded (Markusen et al., 2011).
In this article, we draw upon the Economic Complexity Index (ECI), introduced by Hidalgo and Hausmann (2009), to test whether the complexity of locations affects the performance of cultural and creative firms. The ECI is commonly described as a measure of diversity (number) and sophistication of productive knowledge in a location. More complex locations have more diverse and sophisticated production capabilities, less competitors, and higher opportunities to diversify and capture more value because of many productive specialisations and interactions between different types of knowledges (Balland and Rigby, 2017). We rely upon the ECI as a proxy for the social interactive nature that characterises CCI firms. More specifically, we assume that more complex locations, endowed with different types of more sophisticated (rare) production capabilities, allow CCI firms to perform more strongly. This can depend on higher opportunities of complex knowledge sharing and cross-fertilisation processes among different types of CCI firms or with non-CCI firms. We look at economic complexity of both CCIs and the rest of the economy. Moreover, using the sectorial classification provided by the ‘concentric circle model’ (Throsby, 2001), we examine the different effect of both economic complexity of the CCIs and of the rest of the economy on the performance of firms belonging to different types of CCIs. In this regard, we assume that more complex locations will affect more the performance of firms within industries characterised by high cultural content (and low commercial content). Our focus is on the Italian context, which has a long-standing tradition in the cultural and creative sector and, over the last decade, has shown an increase in consumption expenditure and cultural employment higher than the European average (Eurostat, 2018).
The article is structured as follows. The following section discusses the agglomeration benefits of cultural and creative clusters and the application of the two measures of relatedness and economic complexity to CCIs. Moreover, it presents an overview on the importance of CCIs and related policy context in Italy. The third section describes the data employed for the analysis and provides details on the methodology. Findings are discussed in the fourth section, while the last section summarises the main results and provides some policy implications and directions for future research.
Theoretical background
Cultural and creative clusters: agglomeration benefits
Over the last two decades, CCIs have drawn the increasing attention of international scholars as an essential feature of post-industrial economies and important drivers of economic growth and development 1 in countries, regions and cities across the world (OECD, 2018). Clusters and the array of concepts adopted for describing the agglomeration of CCIs at different levels of geographical scale (e.g. hubs, districts, quarters, neighbourhoods, milieus) have gained growing visibility in the analysis of linkages between industries and people (Bloom et al., 2020; Chapain and Sagot-Duvauroux, 2020; Kozina and Bole, 2017). In particular, several studies have detected a positive relationship between social and economic outcomes of CCIs, which are knowledge-intensive in nature, and a social network nature that characterises this type of industries (e.g. Bakhshi et al., 2008; De Vaan et al., 2013; Innocenti and Lazzeretti, 2019; Klement and Strambach, 2019b; Lee, 2020).
Over time, agglomeration scholars have highlighted how the benefits of being within a cluster lead to superior firm performance. Marshall (1920) described the concept of ‘external economies of scale’ to explain productivity increases, which are attributable to factors external to individual firms such as the access to infrastructure and services, skilled labour pools, and specialised suppliers. Porter (1998) argued that those firms within a cluster can strengthen their competitiveness because of the presence of challenge and pressure associated with the presence of competitive industries. This contributes to stimulating the growth of businesses. Most importantly, clusters are characterised by a high degree of embeddedness, which facilitates networking, nurtures social interactions, and enables informal knowledge exchange within a location (Tallman et al., 2004). The social aspect of firms’ agglomerations was particularly emphasised by Becattini (1990: 38), who defined the industrial district ‘as a socio-territorial entity which is characterised by the active presence of both a community of people and a population of firms’, yielding positive spillovers. Some other agglomeration benefits mentioned in the literature include improvement of labour productivity (Ciccone and Hall, 1996), better collaboration (Saxenian, 1994) and innovation (Harrison et al., 1996; Hervás-Oliver et al., 2018).
Likewise, the concentration of resources and capabilities of CCI firms in a specific location encourages knowledge spillovers, learning processes, cross-fertilisation of ideas and innovation, which make both businesses and entrepreneurship thrive (Antonietti, 2015; Bakhshi et al., 2008; Chapain et al., 2010; Lee, 2014; Turok, 2003).
However, while several works have examined the effects of CCI agglomerations on regional productivity (e.g. Boix-Domenech and Soler-Marco, 2017; Boualam, 2014), little research has looked the impact on firm-level variables. De Vaan et al. (2013) examined the survival patterns of 4607 firms and 1229 subsidiaries in the global video game industry to look at the effect of localisation externalities on firm performance. They provided evidence that firms benefit from variety in employee’s expertise in geographic clusters that reach a critical scale allowing for rich network interactions. Falck et al. (2018) found that cultural amenities generate positive social return by attracting highly skilled workers, which, in turn, increase the productivity of workers and firms. Tao et al. (2019) highlighted that urbanisation economies – arising from industry diversity in a city – raised the productivity of Chinese firms in the creative industries (CIs) between 2012 and 2014. In this regard, the diversity of economic activities and people can facilitate coordination between diverse knowledge bases, new forms of entrepreneurship among different agents and industries, as well as stimulate ideas and creativity (Cerisola, 2018). However, more research analysing the effects of the social interactive nature of the CCIs on the growth, productivity and profitability of these firms is needed.
Relatedness between the CCIs and the rest of the economy
Over time, the variety/diversity framework, as opposed to specialisation, has drawn the increasing attention of evolutionary economic geographic scholars interested in investigating the determinants of innovation and local growth (e.g. Boschma and Frenken, 2009). The literature on relatedness or related variety suggests that it is easier for regions to specialise in industries in which they already have relevant knowledge and capabilities thanks to pre-existing concentrations of related industries (e.g. Frenken et al., 2007; Hidalgo et al., 2007). Related variety growth contributes to innovation and employment in related sectors and increases both sectoral and regional productivity with important policy implications (Asheim et al., 2011; Frenken et al., 2007; Neffke et al., 2011).
Few studies have so far applied the concept of relatedness to CIs. Higher related variety among CIs implies that firms can benefit from inter-sectoral knowledge spillovers and that regions will be able to successfully diversify in new industries that use similar skills, competencies or knowledge bases (Berg and Hassink, 2014). Cognitive proximity in the CIs has been regarded as a key factor in fostering innovation and economic development in the area, through processes of mutual exchange, cross-fertilisation and knowledge spillovers (e.g. Cicerone et al., 2021; Innocenti and Lazzeretti, 2019; Klement and Strambach, 2019b; Lee, 2020). Also unrelated variety – proximity between firms with no substantial similar competences – becomes particularly significant in the context of symbolic knowledge creation, where a heterogeneous environment made of different individuals with diverse cognitive frameworks can be an important source of inspiration and of fruitful collaborations (Cohendet et al., 2014; Klement and Strambach, 2019a).
Several studies have emphasised a positive relationship between creative and non-creative sectors. Bakhshi et al. (2008) explored the links between the CIs and other sectors in the United Kingdom to assess the contribution of CIs to innovation derived from a process of inter-sectoral cross-fertilisation. Their findings support the idea that supply chain linkages to the creative sector are positively related to innovation elsewhere in the economy. Innocenti and Lazzeretti (2019), using data on employment on Italian provinces, adapted the methodology proposed by Hidalgo et al (2007) to explore relatedness between creative and other sectors. They found that the major interactions occur between creative sectors and other apparently distant sectors, which seem to have a high degree of cognitive proximity. According to their study, relatedness in the CCIs fosters employment growth by promoting interactions and stimulating creativity. In a similar vein, Lee (2020) found evidence that relatedness mattered for CIs growth in the recovery period following the 2008/2009 financial crisis. More recently, Casadei et al. (in press) showed high levels of relatedness between some creative services and other creative, non-creative services and manufacturing industries in the United Kingdom – interpreted as a sign of the strength of production relationship in terms of knowledge, inputs, or complementarities.
To summarise, CCIs are characterised by a complex network of connections between different typologies of organisations and actors within an area, which benefit from knowledge sharing and cross-fertilisation processes that foster economic growth (Iansiti and Levien, 2004). In this regard, CCI agglomerations seem to be positively affected by the number, quality and diversity of organisations and actors clustered within an area. We can therefore assume that the performance of firms, which are considered as interconnected parts of their larger environment (Comunian, 2019), depends also on the complexity of the location in which they are embedded (Markusen et al., 2011).
Economic complexity: an application to CCIs
In this study, we draw upon the ECI (Hidalgo and Hausmann, 2009) to test whether the complexity of locations affects the performance of cultural and creative firms. The ECI is commonly described 2 as a measure of diversity (number) and sophistication of productive knowledge in a location. The main assumption is that complex locations have more diverse and sophisticated (rare) production capabilities and knowledge, less competitors, and higher opportunities to diversify and capture more value because of the many productive specialisations that may be connected to new opportunities (Balland and Rigby, 2017). In other words, the ECI emphasises how the production process of a specific product/service implies the interaction of different knowledges, which enable the innovation and production of more complex products. We rely upon the ECI as a proxy for the social interactive nature that characterises CCI firms.
The ECI has been variously adopted at global (Felipe et al., 2012), national (Hausmann and Hidalgo, 2013), sub-national (Reynolds et al., 2018) and city-level (Nepelski and De Prato, 2015) to examine the relationship between economic complexity and various economic outcomes. A host of empirical works have detected a robust link between the ECI and important economic variables such as GDP per capita or lower inequality (Felipe et al., 2012; Ferrarini and Scaramozzino, 2016; Mealy and Coyle, 2019). However, to the best of our knowledge, no studies have so far applied this concept to the CCIs.
In view of all this, we want to first test the following two hypotheses:
H1. More complex CCI locations, endowed with different types of more sophisticated production capabilities, allow CCI firms to perform more strongly because of higher opportunities of complex knowledge sharing and cross-fertilisation processes among different types of cultural and creative activities.
H2. More complex locations, endowed with different types of more sophisticated production capabilities not related to the cultural and creative sector, allow CCI firms to perform more strongly because of higher opportunities of complex knowledge sharing and cross-fertilisation processes with non-CCI activities.
However, the CCI sector is characterised by different types of industries with distinct characteristics and type of performance that can be diversely affected by the complexity of locations. In this regard, the ‘concentric circle model’ (Throsby, 2001) offers a useful sectoral view of the CCIs based on the proposition that CCIs are characterised by cultural or economic value. According to this model, creative ideas originate in the core creative arts and diffuse outwards through a series of layers or concentric circles (i.e. radiation process). The proportion of cultural content decreases (with increased commercial content) by moving outwards from the centre. According to Throsby (2008: 150) ‘the diffusion of ideas may arise through the fact that creative people who generate them actually work in different industries, providing direct input to the production of cultural content in industries further from the core’. Therefore, creative ideas and innovation spread from sectors with higher cultural content to sectors that commercialise that content by means of social interactions among CCI agents.
Following this model, we want to test the following two hypotheses:
H3. More complex CCI locations, endowed with different types of more sophisticated production capabilities, will affect more the performance of firms with high cultural content (and low commercial content) and belonging to the inner circles of the CCI ‘concentric circle model’.
H4. More complex locations, endowed with different types of more sophisticated production capabilities not related to the cultural and creative sector, will affect more the performance of firms with high cultural content (and low commercial content) and belonging to the inner circles of the CCI ‘concentric circle model’.
An overview of CCIs in Italy
The focus of our analysis is on Italy, where the cultural and creative sector has a long tradition due to the high endowment of cultural goods and places. Over the last decade, Italy has shown an increase in consumption expenditure and cultural employment higher than the European average (Eurostat, 2018). Italian CCIs have mainly grown thanks to a flourishing tourism, fairs, and festival sector, as well as to increased innovation activities, design laboratories and Information and Communication Technologies. In 2018, these industries contributed nearly 96 billion to the national economy (6.1% of total GDP), with around 1.55 million people employed (Fondazione Symbola, 2019). In the same year, the occupation rate for CCIs grew by 1.5 per cent compared with a 0.9 per cent growth rate in total industries. More specifically, this sector mainly consists (in terms of value added and employment) of the ‘cultural industries’ (e.g. radio, TV, videogame, software, music, publishing), which represent about a third of the Italian CCIs, followed by the ‘creative industries’ (e.g. design, media, architecture), performing arts (e.g. theatres), and activities related to conservation and promotion of cultural heritage (e.g. museums, libraries) (Dent et al., 2020; Eurostat, 2018).
Both at national and regional level, very few policies have been implemented to the development of this sector, and CCIs have drawn the attention of policy makers only recently. The ‘White Book on Creativity’ (Santagata, 2009) was aimed at positioning cultural and creative firms in the Italian economic scenario and at delineating the best policy practices for their development, in terms of creativity for innovation (to foster new technologies) and for social life (with the focus on territories and networks). Over the last decade, there has been increasing attention on policies for the development of the CCI sector as a tool for urban regeneration, social inclusion and sustainability (Wilson et al., 2020). These recent practices have switched the focus from a centralised system of decision, to a more peripheral one, where regions, provinces or labour market areas become the focal actors of policy implementation.
Data and the empirical strategy
To test the relationship between economic complexity and CCI firm performance, we first drew upon firm-level data from the Aida Bureau van Dijk database, 3 which provides a good representation of the distribution of Italian firms by size 4 and sectors (Grazzi et al., 2003). It includes data on firm performance and a set of firm characteristics such as number of employees, patents, R&D investments and company addresses. CCI firms were selected based on the recent Eurostat’s 2018 NACE Rev. 2 classification (see Table A1 in the Supplemental Appendix). The second step relates to data at sector and province level to build our ECI and some control variables. We used data from the ASIA database provided by ISTAT (Italian National Institute of Statistics), which collects information on the number of business local units at the NUTS3 (i.e. province) level for four-digit industry codes (NACE Rev.2). The third database, mainly used for the remaining control variables at province level, is the ISTAT-ASTI database (Atlas of Territorial Infrastructure Statistics) to gather information on other NUTS3 province characteristics. All the data, at both firm and province levels, covered the period from 2010 to 2016.
After some standard cleaning procedures, like removing outliers and firms without at least 3 years of reported information in the balance sheet, 5 we obtained a final sample of 4223 firms distributed across 103 Italian provinces 6 for the 7 years under analysis. This final sample was compared (using a t-test comparison of means) with the total CCI population in AIDA on some key variables (i.e. firms’ geography, sector and size), showing that our sample has characteristics similar to the Italian CCI population.
Figure 1 shows the geographical distribution of cultural and creative firms for the period under investigation. 7 Overall, there is a tendency of CCI firms to concentrate in the northern and central-northern regions of Italy. Between 2010 and 2016, the number of CCI businesses increased, with firms slightly more distributed across some southern regions and provinces in 2016. However, a gap in terms of CCI specialisation and value added still exists, with southern regions less capable of translating their renowned historical and artistic heritage into wealth. Both in 2010 and 2016, there was a higher geographical concentration of CCIs in Milan and Rome, which are well-known cultural and creative hubs (the former specialised in fashion design, the latter in cinema and television). Lombardy and Lazio are indeed the first two Italian regions by CCI contribution (to the local economy) in terms of value added and employment, followed by Piedmont (with Torino renowned for design) and Marche, which is known for its cultural heritage and the music industry. Tuscany, particularly the provinces of Florence (for a tradition in heritage, arts, museum, fashion and tourism), Arezzo (specialised in jewellery) and Siena (for tourism), is also a key hub for Italian CCIs (Fondazione Symbola, 2019).

Sample’s geographical distribution of CCIs, 2010–2016.
Figure 2 displays the sectoral distribution of our final sample according to the Eurostat’s 2018 classification. The sample is mostly represented by firms specialised in design and photography, printing and media, video music and television, and creative, arts and other entertainment activities. According to recent estimates on Italian CCIs (Fondazione Symbola, 2019), the sub-sectors of the CIs – design (8.9 billion) and media (4.9 billion) – produced 13.8 billion in 2018, accounting for 0.9 per cent of national value added. The sub-sectors of the cultural industries – publishing (13.7 billion) and cinema, radio and television (7.5 billion) – generated 21.2 billion, while the performing arts registered 8.2 billion with 145,000 jobs.

Sample’s distribution of CCIs according to EUROSTAT classification, 2010–2016.
Firm performance
Our dependent variable is firm performance, proxied by two different measures of labour productivity. 8 The first one is the ratio of revenue per employee, the second one is the ratio of value added per employee, which can also be interpreted as the level of product’s sophistication of each firm (Chaston and Sadler-Smith, 2012; Gala et al., 2018). Labour productivity is a common measure of firm performance, which has been recently adopted to examine the economic outcome of CCIs (Brighton et al., 2016; Mateos-Garcia and Bakhshi, 2016; Tether, 2019). It denotes how a firm effectively and efficiently uses the labour force to provide quality products and services. Due to their peculiar nature, the performance of CCIs is rather volatile, and both the application and interpretation of productivity measures need caution. Indeed, the growth of CCIs does not always follow a linear trajectory, with frequent income fluctuations related to specific projects (e.g. film, festival). Moreover, these industries rely on intangible assets and have mixed income models (Creative Industries Federation, 2018). We attempted to partially overcome these limitations by combining the two different measures of firm productivity/performance.
The economic complexity of provinces
The ECI, our main regressor, was computed using the method of reflections at 4-digit NACE sector level, as in Balland and Rigby (2017). We used a revised version of Balland’s knowledge complexity index based on local business units data at province level (Bishop and Mateos-Garcia, 2019; Mealy and Coyle, 2019).
We calculated the ECI with two specifications: the first one (ECI_CCI) only relates to local business units belonging to the cultural and creative sector and measures the level of complexity among these industries in each province; the second one (ECI_TOT) is based on local business units in all the other sectors for each province but excluding the CCIs to control for inter-sectoral cross-fertilisation activities.
The revealed comparative advantage (RCA) was computed to build both indices. The following equation underlies which sector in each province has an advantage in producing a particular good
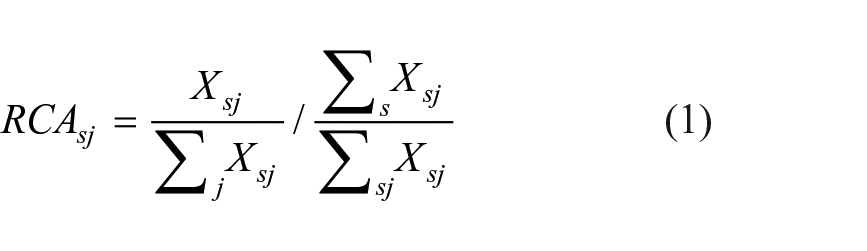
where

where K is the average of the vector Kj. Thus, the ECI represents the average knowledge intensity of the products (sectors) produced in a province, which can be interpreted as the level of a province’s sophistication and diversification in terms of productive knowledge (Hidalgo, 2021). The Italian geographical distribution of overall economic complexity (i.e. for the rest of the economy) and of economic complexity, the CCIs, both in 2010 and 2016, are shown in Section A1 in the Supplemental Appendix.
Control variables
We introduced other firm- and province-level variables which might influence the relationship between economic complexity and firm performance. On the firm side, we included in the model the number of employees which is commonly used in the literature to control for firm size (Hansen and Wernerfelt, 1989; Harrigan et al., 2017). On the province side, we added a set of controls which account for both agglomeration forces and other and territorial characteristics.
We included GDP – in million euros – to proxy for geographical size as well as GDP per capita, which represents the wealth and number of economic activities in a province (Bellini et al., 2013; Sterlacchini, 2008). We also included population density – computed as the population per square kilometres – to proxy for geographical agglomerations (Combes et al., 2011; Piergiovanni et al., 2012). A dummy variable district relates to whether a firm belongs to a province with at least an industrial district (0 otherwise). We relied upon the Sforzi-ISTAT methodology (Cainelli et al., 2006; ISTAT, 1997), where Local Labour Systems (LLS) are used to identify the presence of industrial districts. More specifically, the presence of a district within a given province was detected by combining a province with its LLS. In our model, the dummy district has a dual purpose: on one hand, it controls for the presence of agglomeration forces represented by industrial districts (Cainelli, 2008); on the other hand, districts and clusters can be seen as a vehicle for social interactions due to spillover mechanisms and knowledge exchanges (Hervás-Oliver and Albors-Garrigós, 2007; Li and Geng, 2012).
Among the province-level characteristics, we included the share of employees in CCIs, computed as the number of employees in CCIs on the overall number of employees in the other sectors (Share CCI) (Kemeny et al., 2020), and the Herfindahl–Hirschman Index (HHI) for the market concentration in all sectors (Cerisola, 2018; Stam et al., 2008).
Finally, we added two other variables to control for the level of R&D performance, which accounts for innovation and human capital in each province. The former (R&D) is proxied by the number of patent applications submitted in a year by each NUTS-3 region (based on the applicant’s address) (Bakhshi et al., 2008). These data were extracted from the OECD-REGPAT database. The level of human capital (HK) is based on data retrieved by the INAPP-ISTAT survey on occupations (ICP) and the ISTAT’s Labour Force Survey (LFS). Since ICP only releases information at country level, we computed a weighted measure of task per type of occupation: each task was weighted according to the distribution of occupation at one-digit ISCO code across each NUTS3 province. Thus, our final measure expresses the average number of capabilities owned by the total workforce for each province, which proxies for the level of human capital (Antonietti and Burlina, 2022; Jeffcutt and Pratt, 2002; Ochoa and Ramírez, 2018).
The adoption of controls at both firm and province levels will help mitigate for possible endogeneity biases in the econometric analysis.
Before proceeding with the econometric analysis, all the variables were transformed into natural logarithms. 9 Tables 1 and 2 show the descriptive statistics (without logarithmic scale) and correlation matrix.
Variables’ description and summary statistics.

Correlation matrix.
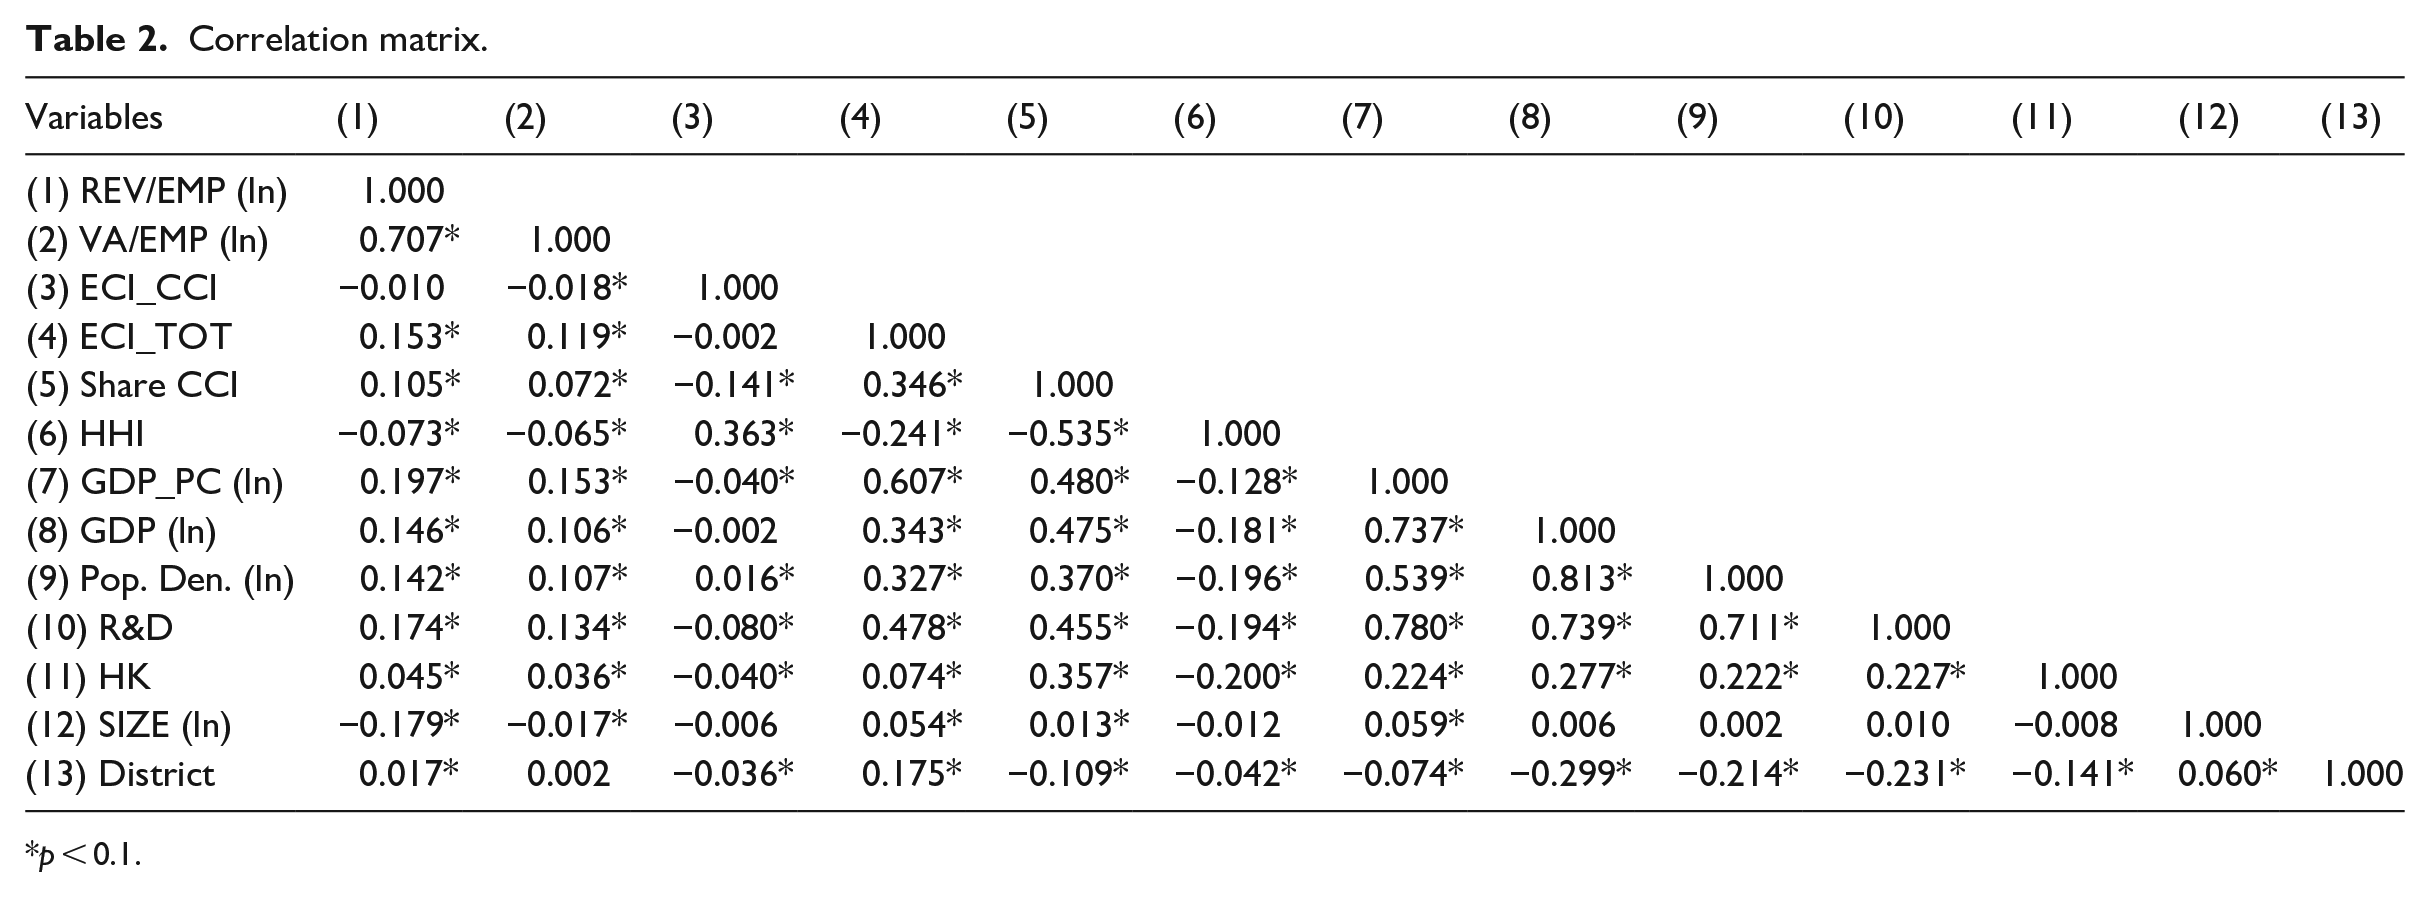
p < 0.1.
The empirical model
Due to the panel structure of our data, we employed a panel regression model with fixed effects (Baltagi, 2008) and then computed a panel multilevel model to deal with both the firm- and province-level analysis (Bell et al., 2019; Goldstein, 2011; Verbeke and Molenberghs, 2013).
The econometric equation for the fixed-effects models can be written as follows

for t = 2010, . . ., 2016, i = 1, . . ., 4223, and j = 1, . . .,103, where
Panel fixed-effects models are normally used to test correlation among variables at the same level of analysis. Given the characteristics of our data, multilevel models are more appropriate as these allow to study the effects of the covariates on the dependent variable, which vary between groups (in our case by province and firms, nested within years) (Goldszmidt et al., 2011). This analysis provides correct standard errors by taking into account the clustering among the variables (Goldstein, 2011). Moreover, multilevel mixed effects models account for both the random part of the model specification – where outcomes are identified by the model that is predicting them – and the fixed effects that do not vary by group (Gelman and Hill, 2007).
Our three-level multilevel model is described by the following equations
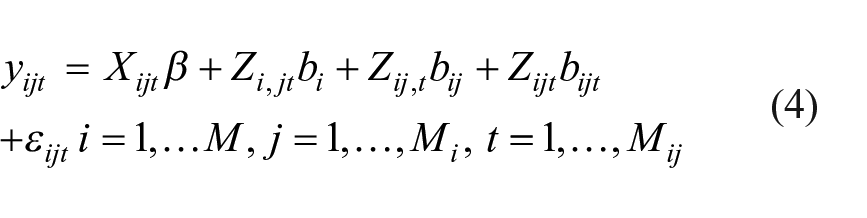
where i is the firm-level group, j is the province-level group, and t are the year-level group. Level-1 random effects bi are assumed to be independent for different i, the level-2 random effects
Findings: economic complexity and CCI firm performance
Table 3 presents the results of the baseline models. The first three columns show the results for the dependent variable revenue per employee and the last three columns for the variable value added per employee. Columns (1), (2), (4) and (5) present the results for the panel fixed-effects model. The results, without the control variables, show a positive and significant effect of the ECI_CCI on both measures of firm performance: provinces with higher economic complexity in CCIs show a 0.7 per cent increase in revenue per employee and a 0.5 per cent increase in value added per employee. However, all the coefficients are small in magnitude. Moreover, with the inclusion of firm- and province-level control variables, the effect of the ECI_CCI on both measures of firm performance becomes insignificant. In the panel fixed-effects model, the ECI_TOT is never significantly correlated with firm performance.
Results baseline models: Columns (1) and (4) report the results without the control variables, Columns (2) and (5) with the controls for the panel fixed-effects model. Column (3) and (6) for the multilevel model. Dep var. natural logarithm of revenue per employee (lnREV/EMP) and value added per employee (lnVA/EMP). Focal regressors: economic complexity CCIs and overall, at NACE Rev.2 (4-digit level).

Column (1), (2), (4), and (5) clustered standard errors at firm level in parentheses. Column (3) and (6) clustered standard errors at province level in parentheses.
p < 0.01; **p < 0.05; *p < 0.10.
Columns (3) and (6) display the results of the multilevel analysis, which allows us to treat the firm and province levels as separate components. Here, we find again a positive and significant effect of the ECI_CCI on the two measures of firm performance: provinces with higher economic complexity in CCIs show a 1.5 per cent increase in both revenue and value added per employee. Conversely, a unitary increase in the ECI_TOT results in a 22.1 per cent decrease in value added per employee. Overall, it seems that economic complexity of CCIs but not economic complexity of the rest of the economy matters for CCI firm performance. Indeed, in all the specifications, the ECI_TOT is never significantly positively correlated with firm performance.
Among the province-level controls, unsurprisingly, we find a significant positive relationship between GDP per capita – a proxy for wealth within a province – and firm performance. We can indeed assume that consumers with increased wealth consume more CCI products. However, GDP (not per capita) and population density are significantly negatively correlated with the variables value added per employee and revenue per employee (Combes, 2000; Einiö, 2014). In line with our results, Issah and Antwi (2017) – in a study investigating the impact of macroeconomic factors on the performance of UK listed companies across all industries – found a negative relationship of GDP with firm performance. Also, Jennen and Verwijmeren (2010) examined the trade-off between costs and benefits of agglomeration for a large sample of Dutch firms and showed that population density of an area has a negative effect on firm performance by increasing real estate and labour costs for companies located in the area.
In the panel fixed-effects model (with the controls), a high concentration of CCI employees is significantly positively correlated with revenue per employee. However, this variable is significantly negatively correlated with measures of firm performance in the multilevel analysis. The concentration of creative workers within an area may indeed drive up the cost of housing, leading to gentrification and thus influencing firm performance (Gutierrez-Posada et al., 2022). In the multilevel analysis, we found a significant negative relationship between market concentration for the overall industries and firm performance. Similarly, Morgan and Rego (2009), by looking at the impact of brand portfolios on the marketing and financial performance of large publicly traded firms, highlighted a significant negative relationship between market concentration (HHI) and firm performance, proxied by cash flows and consumer loyalty. Indeed, higher HHI levels indicate a small number of companies with large market shares and weaker competition, which might influence the performance of overall CCI firms.
In line with previous scholarly research (e.g. Belderbos et al., 2004), the variable R&D has a positive significant effect on firm performance, although the coefficients are very small in magnitude. Both the variables related to the level of human capital and the presence of an industrial district within the province under investigation are never significantly correlated with firm performance. Overall, it seems that variables accounting for agglomeration forces and social interactive mechanism dot not significantly influence firm performance. Moreover, the size coefficient is always negative and statistically significant. This could be explained by the typical micro dimension of cultural and creative firms (Müller et al., 2009).
After running the baseline model in Table 3, where all the cultural and creative firms are included, the second analysis is carried out by looking at distinct CCI sectors. We compute a series of multilevel mixed regressions using the ‘concentric circle model’ proposed by Throsby (2001) and measured at European level in the KEA report (KEA European Affairs, 2006). The sectors under investigation (from the centre outwards) are core creative arts sectors, cultural industries, CIs and related industries (see Table A1 in the Supplemental Appendix). The results of this second set of regressions are presented in Table 4. In this new model, the ECI_CCI has a positive and significant effect on both measures of performance for all CCI firms except those in related sectors. The ECI_TOT only shows a negative significant effect on the variable value added per employee in the cultural sector. As concerns the control variables, a high concentration of CCI employees is significantly negatively correlated with the performance of firms in all sectors (except those in the cultural one), while the level of market concentration for the overall industries has a significant negative relationship with the performance of firms in all sectors. As discussed above, these two variables can respectively lead to increased cost of housing and weaker competition, which can both negatively influence firm performance. We find that GDP per capita has a positive effect on firm in the creative and cultural sectors (which are expected to have the highest level of product sophistication), while GDP (not per capita) shows a negative correlation with the performance of firms in these two sectors. Population density has a positive effect on the variable revenue per employee for firms in the creative sectors (with more functional outputs and higher commercial content) and a negative effect for the variable value added per employee for firms in the core sector. The variables R&D and size are always significant and have the same signs as in the baseline models: positive for R&D and negative for size.
Results multilevel model for each KEA classification. Dep var. natural logarithm of revenue per employee (lnREV/EMP) and value added per employee (lnVA/EMP). Focal regressors: economic complexity CCIs and overall, at NACE Rev.2 (4-digit level).

Clustered standard errors at province level in parentheses.
p < 0.01; **p < 0.05; *p < 0.10.
Conclusion
This article draws upon the ECI to capture and investigate whether the complexity of locations, in terms of diversification and sophistication of productive knowledge and capabilities, affects the performance of firms in the cultural and creative sector. More specifically, in this work, we explore the relationship between two different ECIs – one for the CCIs and one for the rest of the economy – and the performance of cultural and creative firms at province level.
Our findings show that more complex cultural and creative locations are positively correlated with the performance of cultural and creative firms. Thus, firms seem to benefit from the concentration of diverse and more sophisticated knowledge in the CCIs. Instead, we do not find significant evidence of a relationship between economic complexity for the rest of the economy and CCI performance. Only results from the multilevel model show that an increase in overall complexity results in a decrease in value added per employee. This might be even interpreted as a detrimental effect of overall economic complexity on CCI firm performance, highlighting potential difficulties in establishing positive interconnections between creative and non-creative firms (Bakhshi and McVittie, 2009). However, more evidence is needed to test this relationship. When looking at different CCI industries, the ECI_CCI continues to matter for the performance of core, creative and cultural firms, but not of related companies (e.g. retail of books, newspapers, and music), which include activities with higher commercial content, lower cultural value and potentially fewer opportunities for social interactions among CCI agents. As in the baseline models, the complexity of the rest of the economy is never positively correlated with the performance of firms, irrespective of the sector under investigation.
To conclude, it seems that economic complexity of CCIs but not economic complexity of the rest of the economy matters for CCI performance. However, we cannot disregard that CCI economic complexity only explains a small proportion of variation of firm performance. The weak relationship between CCI complexity and firm performance suggests that the concentration and opportunities for sharing more complex (diverse and rare) knowledge among CCIs matter but do not currently represent a key driver of growth. These findings are reinforced by the little significance of agglomeration-related variables in explaining the performance of firms included in all the sectors under investigation. Moreover, they are in line with a recent study (Lee, 2020) that shows how relatedness seems to have a positive and significant but weak relationship with employment growth (Lee, 2020). In other words, according to this research, CCI relatedness matters but it is far from being the only determinant of local growth.
In policy terms, our findings lead to a rethinking of the support mechanisms favouring social interactions and cross-fertilisation processes among CCIs. Indeed, a relationship between CCI complexity and firm performance does exist, but this is currently weak. This could be explained by the lack of a clear-cut policy setting focused on stimulating knowledge spillovers, learning processes as well as cross-fertilisation of ideas and innovation among CCI firms, which would help them to effectively exploit the benefits arising from the concentration of diverse and more sophisticated knowledge within a location. Human capital development could be promoted to increase the absorptive capacity of CCI firms, for example, by encouraging relationships with other individuals outside the firm as well as collaborative and networking activities aimed at increasing creativity and innovativeness and thereby enhancing the competitiveness and performance of firms (Santoro et al., 2020). Support measures for the connection of creative people and businesses could include actions aimed at creating physical or virtual infrastructures aimed at attracting creative talent and entrepreneurs as well as at fostering synergies and collaboration with key stakeholders. Institutions, universities and event organisers could play a key role in the creation of such collaborative networks.
We also argue that the economic structure of a province and the relative weight of CCIs matter for the promotion of policies supporting CCIs and their social interactions. Therefore, policy measures should take into account sub-national characteristics and be tailored to the specific geographical context to be targeted. It is important to sustain not only provinces with high levels of CCI complexity, but also those places with a less diversified and sophisticated knowledge to encourage the emergence of new specialisations (Menger, 2013). Extant CCI specialisation at province level should be also considered for the development of ad hoc policies facilitating knowledge spillovers and cross-fertilisation processes among different industries sharing similar competences. This view is in line with the current hype on culture-led development policies and the fact that beneficial effects of culture and creativity depend on the structural pattern of local economies (Cicerone et al., 2021). Moreover, this is also aligned to a recent debate on the function of provinces in the promotion and coordination of local economic and social development in response to the needs of sub-geographical areas that are smaller than regions (Cerisola, 2019). In this regard, an increased role of provinces in this area would help the identification and development of ad hoc CCI policies able to effectively promote the growth and competitiveness of CCIs in Italy.
To the best of our knowledge, this is the first work that applies the concept of economic complexity to CCIs. Further research is needed to provide additional evidence on the relationship between economic complexity and firm performance in other geographical contexts (particularly peripheral places) and using different performance indicators. Future studies could also look at a macro- or meso-level of analysis to examine the effect of complexity on the performance of places or specific industries in the cultural and creative sector. In this regard, survey research could help collect original data for a more in-depth study of the social interactive nature of CCIs.
Supplemental Material
sj-docx-1-eur-10.1177_09697764221125336 – Supplemental material for Economic complexity and firm performance in the cultural and creative sector: Evidence from Italian provinces
Supplemental material, sj-docx-1-eur-10.1177_09697764221125336 for Economic complexity and firm performance in the cultural and creative sector: Evidence from Italian provinces by Chiara Burlina, Patrizia Casadei and Alessandro Crociata in European Urban and Regional Studies
Footnotes
Declaration of conflicting interests
The author(s) declared no potential conflicts of interest with respect to the research, authorship and/or publication of this article.
Funding
The author(s) received no financial support for the research, authorship and/or publication of this article.
Supplemental material
Supplemental material for this article is available online.
Notes
References
Supplementary Material
Please find the following supplemental material available below.
For Open Access articles published under a Creative Commons License, all supplemental material carries the same license as the article it is associated with.
For non-Open Access articles published, all supplemental material carries a non-exclusive license, and permission requests for re-use of supplemental material or any part of supplemental material shall be sent directly to the copyright owner as specified in the copyright notice associated with the article.