



Abstract
The urban unorganised sector has been a dominant characteristic feature of the developing countries providing livelihood to a disproportionately large number of households for prolonged period. However, enterprises in this sector are often stunted by myriads of problems among which meagre access to formal financial services is a crucial constraint, as access to other enabling conditions often hinges upon access to finance. This article is based on a study of such enterprises in the Northeast Indian state of Assam, where access to finance is relatively limited in general. Using inputs from a customised survey, the article explores the extent to which the accessibility of financial services influences the growth and financial performance of the unorganised sector enterprises in Assam. Tools employed include a customised financial access index, a generalised linear model and an ordered LOGIT regression. The results show that the financial performance of the enterprises is not significantly associated with the extent of their financial access, but their growth is critically dependent on it.
When Harris and Todaro (1970) formalised the idea of the informal sector, it was viewed as a transitory component of the urban economy in the process of transformation of a predominantly rural underdeveloped economy to a developed modern urbanised economy. However, this sector, which is now more popularly known as the urban unorganised sector, is no longer regarded as a mere transitory phenomenon (Mukherjee, 2009). This sector absorbs a large part of the labour force and provides livelihood to a substantial segment of the population. Though its contribution to gross domestic product (GDP) is less than the proportion of its employment share, it is not negligible (National Commission for Enterprises in the Unorganised Sector [NCEUS], 2008). The obvious lower productivity in this sector is ascribed to a number of typical problems that are endemic among the urban unorganised sector enterprises. The problems commonly cited are the deficit in entrepreneurial capacity and skill, absence of technological advancement, insufficient access to credit and other financial services, market, etc. Among these problems, the insufficient access to finance has been singled out by some studies as the most critical problem for the enterprises in this sector (Farazi, 2014; NCEUS, 2007). It has been argued that the access to credit can ease most of the other constraints faced by the entrepreneurs. The National Commission for Enterprises in the Unorganised Sector (NCEUS) observes that skill formation and technological improvement in the enterprise are often conditional upon the availability of credit to it (NCEUS, 2007). Bhavani (2006) even observed that the lack of access to financial services is the main obstacle for technological progress of the small-scale industries in India. The study that formed the base of this article was taken up with the view to have a closer examination of the nature of the centrality of financial access in the performance of the urban unorganised sector enterprises. The extent to which the financial and growth performances of the enterprises in the urban unorganised sector depend on their financial access is the prime research question pursued in the study.
Since the customised unit level data are not available for pursuing the issue, a field investigation had to be carried out. The state of Assam in the Northeast region of India was selected as the broad location of field investigation. The choice of the location is warranted on the ground that the organised manufacturing sector in the state had undergone a severe setback in the post-independence years (Goswami, 1981; Sarma, 1966) from which it could not recover till date. Consequently, the unorganised sector has been of greater economic importance in this state than in the industrially developed states of India. 1
The specific objectives of this article are:
To examine the extent of financial access for enterprises of urban unorganised sector in Assam To identify the factors inhibiting the financial access of these enterprises To examine the impact of financial access on the performance of the enterprises in terms of profitability and growth
Given these broad objectives, the null hypothesis tested is that financial access has no significant impact on the profitability and growth of the unorganised sector enterprises against the alternative hypothesis that financial access has significant impact.
This article consists of six sections. The second section presents the conceptual framework and a review of literature. The third section describes the data source and outlines the methodology applied. The fourth section presents and discusses the results. The fifth section draws policy implications from the exercise. The concluding section deals with the limitations of the study and areas for future research.
Conceptual Background and Review of Literature
A discussion leading to delineation of the key concepts used in the article forms the first part of this section. The second part is a review of relevant empirical studies, which nests the presentation and interpretations of the results reported in the subsequent section.
Unorganised Sector Enterprises: The Definitional Issues
With considerable diversity in terms of products, size and organisational structure among the enterprises within the sector, a standard notion of an unorganised sector enterprise has not emerged readily. Policy makers and researchers display a tendency to formulate a definition of the unorganised sector enterprises based on the specific aspects of their interest (Mukherjee, 2009). International Labour Organisation (ILO) uses the term informal sector to indicate those activities that lie outside the purview of the organised sector (Bhalla, 2009). The 15th International Conference of Labour Statisticians (ICLS), held in January 1993, comes up with a more concrete description of the informal sector to be comprised of all private unincorporated non-agricultural enterprises, which are owned by individuals or households and do not constitute separate legal entities independent of their owner (Bhalla, 2009). Hence, there are no complete accounts of those enterprises, which would enable the financial separation of such enterprises from other activities of their owner.
In India, the National Sample Survey Office (NSSO) is the principal source of data on the unorganised sector enterprises. However, the NSSO uses the two terms ‘unorganised’ and ‘informal’ enterprises in somewhat different senses. All the private enterprises that are not registered under sections 2m(i) and 2m(ii) of Factories Act, 1948, and Bidi and Cigar Workers (Condition of Employment) Act, 1966, are put in the category of unorganised sector enterprises (National Sample Survey Office [NSSO], 2008). Informal enterprises include all private unincorporated proprietary and partnership enterprises (NSSO, 2001). This effectively means that the informal sector enterprises form a subset of the unorganised sector enterprises. However, the NCEUS uses the two terms ‘informal sector enterprises’ and ‘unorganised sector enterprises’ in the same sense, thus including all those unincorporated private enterprises owned by individual or households engaged in the sale and production of goods and services and are operated on a proprietary or partnership basis with less than ten workers (NCEUS, 2007). The definition provided by the NCEUS is more precise and an inclusive one compared to others, which is the basis of this article.
Financial Access
Financial inclusion (access) is one of the widely discussed issues in literature. The accessibility to finance is not the objective that needs to be achieved; rather it is one of the means to fulfil the objective of poverty alleviation and economic wellbeing of the people. Financial access includes geographic access (proximity of financial service provider) as well as socio-economic access (absence of documentation requirement, etc.). It also talks about the appropriate cost of financial services. The World Bank (2008) considers financial access as the availability of financial services to all without any barrier. In the Indian context, the Committee on Financial Inclusion defines financial inclusion as “the process of ensuring access to financial services, and timely and adequate credit where needed by vulnerable groups such as weaker sections and low income groups at an affordable cost” (Government of India, 2008). Thus, financial access is a broader concept that includes those who have access to financial services as well as those who are voluntarily excluded (Bhavani & Bhanumurthy, 2012). In fact, it is a supply side concept. Furthermore, financial inclusion indicates the availability of financial services both from the institutional (formal) and non-institutional (informal) sources. But it is difficult to differentiate between the voluntary and non-voluntary exclusion from the financial services. Moreover, due to exploitative characteristics of the non-institutional sources, a segment of the existing literature has measured financial access as the actual availability and adequacy of credit from institutional sources (Bhavani & Bhanumurthy, 2012). Meanwhile, micro-finance has emerged as an alternative source of credit with more flexible mode of functioning than banks and offers small loans at rates affordable compared to the typically high rates of money lenders. Therefore, some scholars considered credit from the formal as well as semi-formal sources, such as micro-finance institutions, to capture financial access (Goyal, 2013).
Financial services typically include savings, credit and insurance services. The credit components find more space in the available literature. However, the first step to financial access is to have a bank account because accessibility to credit from banks depends on it. Sometimes, insurance service is also linked to the bank account. Furthermore, the ability to save in the banks enables the entrepreneurs to make cashless payment, that is, payments through the banking system. So, the Universal Financial Access Goal as formulated by the World Bank Group 2013 aims to provide an account in formal financial institutions (FFIs) for every adult who are currently not a part of formal financial system (Shumba, 2016).
Although extensive literature establishes a positive relationship between the depth of financial access and economic growth, the evidence on positive relationship between financial access and aggregate welfare has been much less conclusive. Ferguson (2008) argued that poverty is the result of the absence of FFIs rather than the exploitation of poor by the non-institutional financiers because poor would not go to the non-institutional sources in the presence of FFIs. The development and efficiency of financial system can not only affect aggregate growth but also affect equitable income distribution, thus helping people to overcome poverty, even without providing them direct access to credit services. Financial access increases efficient allocation of resources and reduces the cost of capital (Sarma & Pais, 2011).
Financial Access of the Unorganised Enterprises
The access to financial services is one of the important determinants of the growth and performance of any enterprise (Blattman, Green, Jamison, Lehmann, & Annan, 2016). The lack of alternative wage employment forces people, especially the poor, to seek self-employment by setting up their own business (Sethuraman, 1992). The small businesses have capital constraint. A large section of the existing literature states that the unorganised sector enterprises rarely obtain any credit from FFIs (Farazi, 2014). It reduces investment due to failure of the investors to borrow at a reasonable rate of interest (Kim, 2016). Virtually the financial needs of the unorganised sector enterprises are met through personal savings, which are supplemented by borrowing from the non-institutional sources (Banerjee & Duflo, 2011). Moreover, they often turn to their family, friends and ethnic networks for accessing the physical and financial capital (Getahun, 2015; Haftu, Tseahye, Teklu, & Tassew, 2009; Kebede, 2018). Reinvested profit is a common source of meeting working capital requirements (Morewagae, Seemule, & Rempel, 1995). Compared to small-scale organised sector enterprises, the enterprises in the unorganised sector have lesser percentage of their borrowings from the banks (Farazi, 2014), and this problem is more serious for women entrepreneurs (Agarwal & Dhakal, 2010).
The unorganised sector enterprises are often found to be reluctant to apply for bank loans owing to complex application procedures, high rate of interest, and high collateral requirements (Farazi, 2014). These enterprises are found to pay even higher rates of interest for fulfilling their credit requirement from the non-institutional sources. However, exclusion from formal financial services including bank credit is not universal among all the unorganised sector enterprise. Bhavani and Bhanumurthy (2012) report that the volume of sale, proportion of owned assets, account records and registration with any government agency favourably impact the access to institutional credit of an unorganised sector enterprise. Farazi (2014) further observes that the possession of landed property, educational attainment and social networking also have positive impact on the financial inclusion of those entrepreneurs. Morewagae et al. (1995) suggest that the unorganised sector entrepreneurs should learn about the importance of savings and should also be informed about the different loan packages offered by credit institutions. Further, Finscope Consumer Survey (2015) observes that often people do not have much idea about the benefits of having a savings bank account. However, Shumba (2016) points that as the people engaged in the unorganised sector make their payments in cash, they do not feel the need of a bank account. Customised banking services along with low level of income causes financial exclusion of such enterprises.
While the above-mentioned factors are cited in the literature as the possible explanations for low level of financial access of the unorganised sector enterprises, it is probably necessary to verify if these factors have been consequential for low financial access of such enterprises in Assam too. Hence, before proceeding to examine the extent to which financial access or lack of it determines profitability and growth performance of the enterprises, an exercise has been taken up to identify the factors that significantly influence the financial access of sample entrepreneurs.
Methodology
Sampling Process
This article is based on the primary data collected during June–September, 2015, by conducting a sample survey in Guwahati and Silchar—the two largest urban locations in Assam. The sample selection process consists of the three stages outlined below.
Activity selection. Based on the NSSO data of the sectoral composition of urban unorganised sector enterprises in Assam and a preliminary field observation of Guwahati, the four sub-sectors of the unorganised manufacturing and the five sub-sectors of services were selected for detailed survey. The manufacturing sub-sectors selected are (a) wooden furniture, (b) textile and apparels, (c) food and beverages and (d) fabricated metal products. The service sub-sectors selected are (a) retail trading, (b) trade and repairing of the motor vehicles, (c) land transport activity, (d) food service activity (restaurants) and (e) internet cafes. These selected sub-sectors have a relatively larger share in the total number of urban unorganised sector enterprises in Assam (NSSO, 2012).
Cluster selection. In the first stage, Guwahati and Silchar were divided into 20 and six clusters, respectively, on the basis of geographical location. Subsequently, 10 clusters from Guwahati and three from Silchar were selected randomly for the next stage.
Ultimate sample unit selection. The sampling frame could not be constructed due to insufficient records; hence, random sampling of the enterprises was not feasible. So, sample enterprises were selected from the clusters using the non-random method akin to accidental sampling. Utmost care was taken to minimise the limitations of non-random sampling. A sample of 205 units was selected, out of which 159 units were from Guwahati and the rest 46 units were from Silchar. Furthermore, the sample consisted of 71 manufacturing units and 134 service sector units. The number of different categories of enterprises was based on their percentage share in the total number of urban unorganised sector enterprises, which were subjected to a minimum of 15 units from each sub-sector.
Outline of the Analytical Framework
The framework for analysis of the inputs from the field survey has three basic components: (a) the designing of a measure of financial access of the enterprises; (b) the formulation of a regression model for the determinants of financial access; and (c) the formulation of regression models for examining the impacts of the financial access on the financial and growth performance of the enterprises. These components have been outlined in detail in the relevant subsections.
Results and Discussion
A Brief Profile of the Sample Enterprises
Before getting into the extent of financial access, and the growth and financial performance of the sample enterprises, a summary of the sample is first presented in this section for the sake of contextualising the core analytical results of the study.
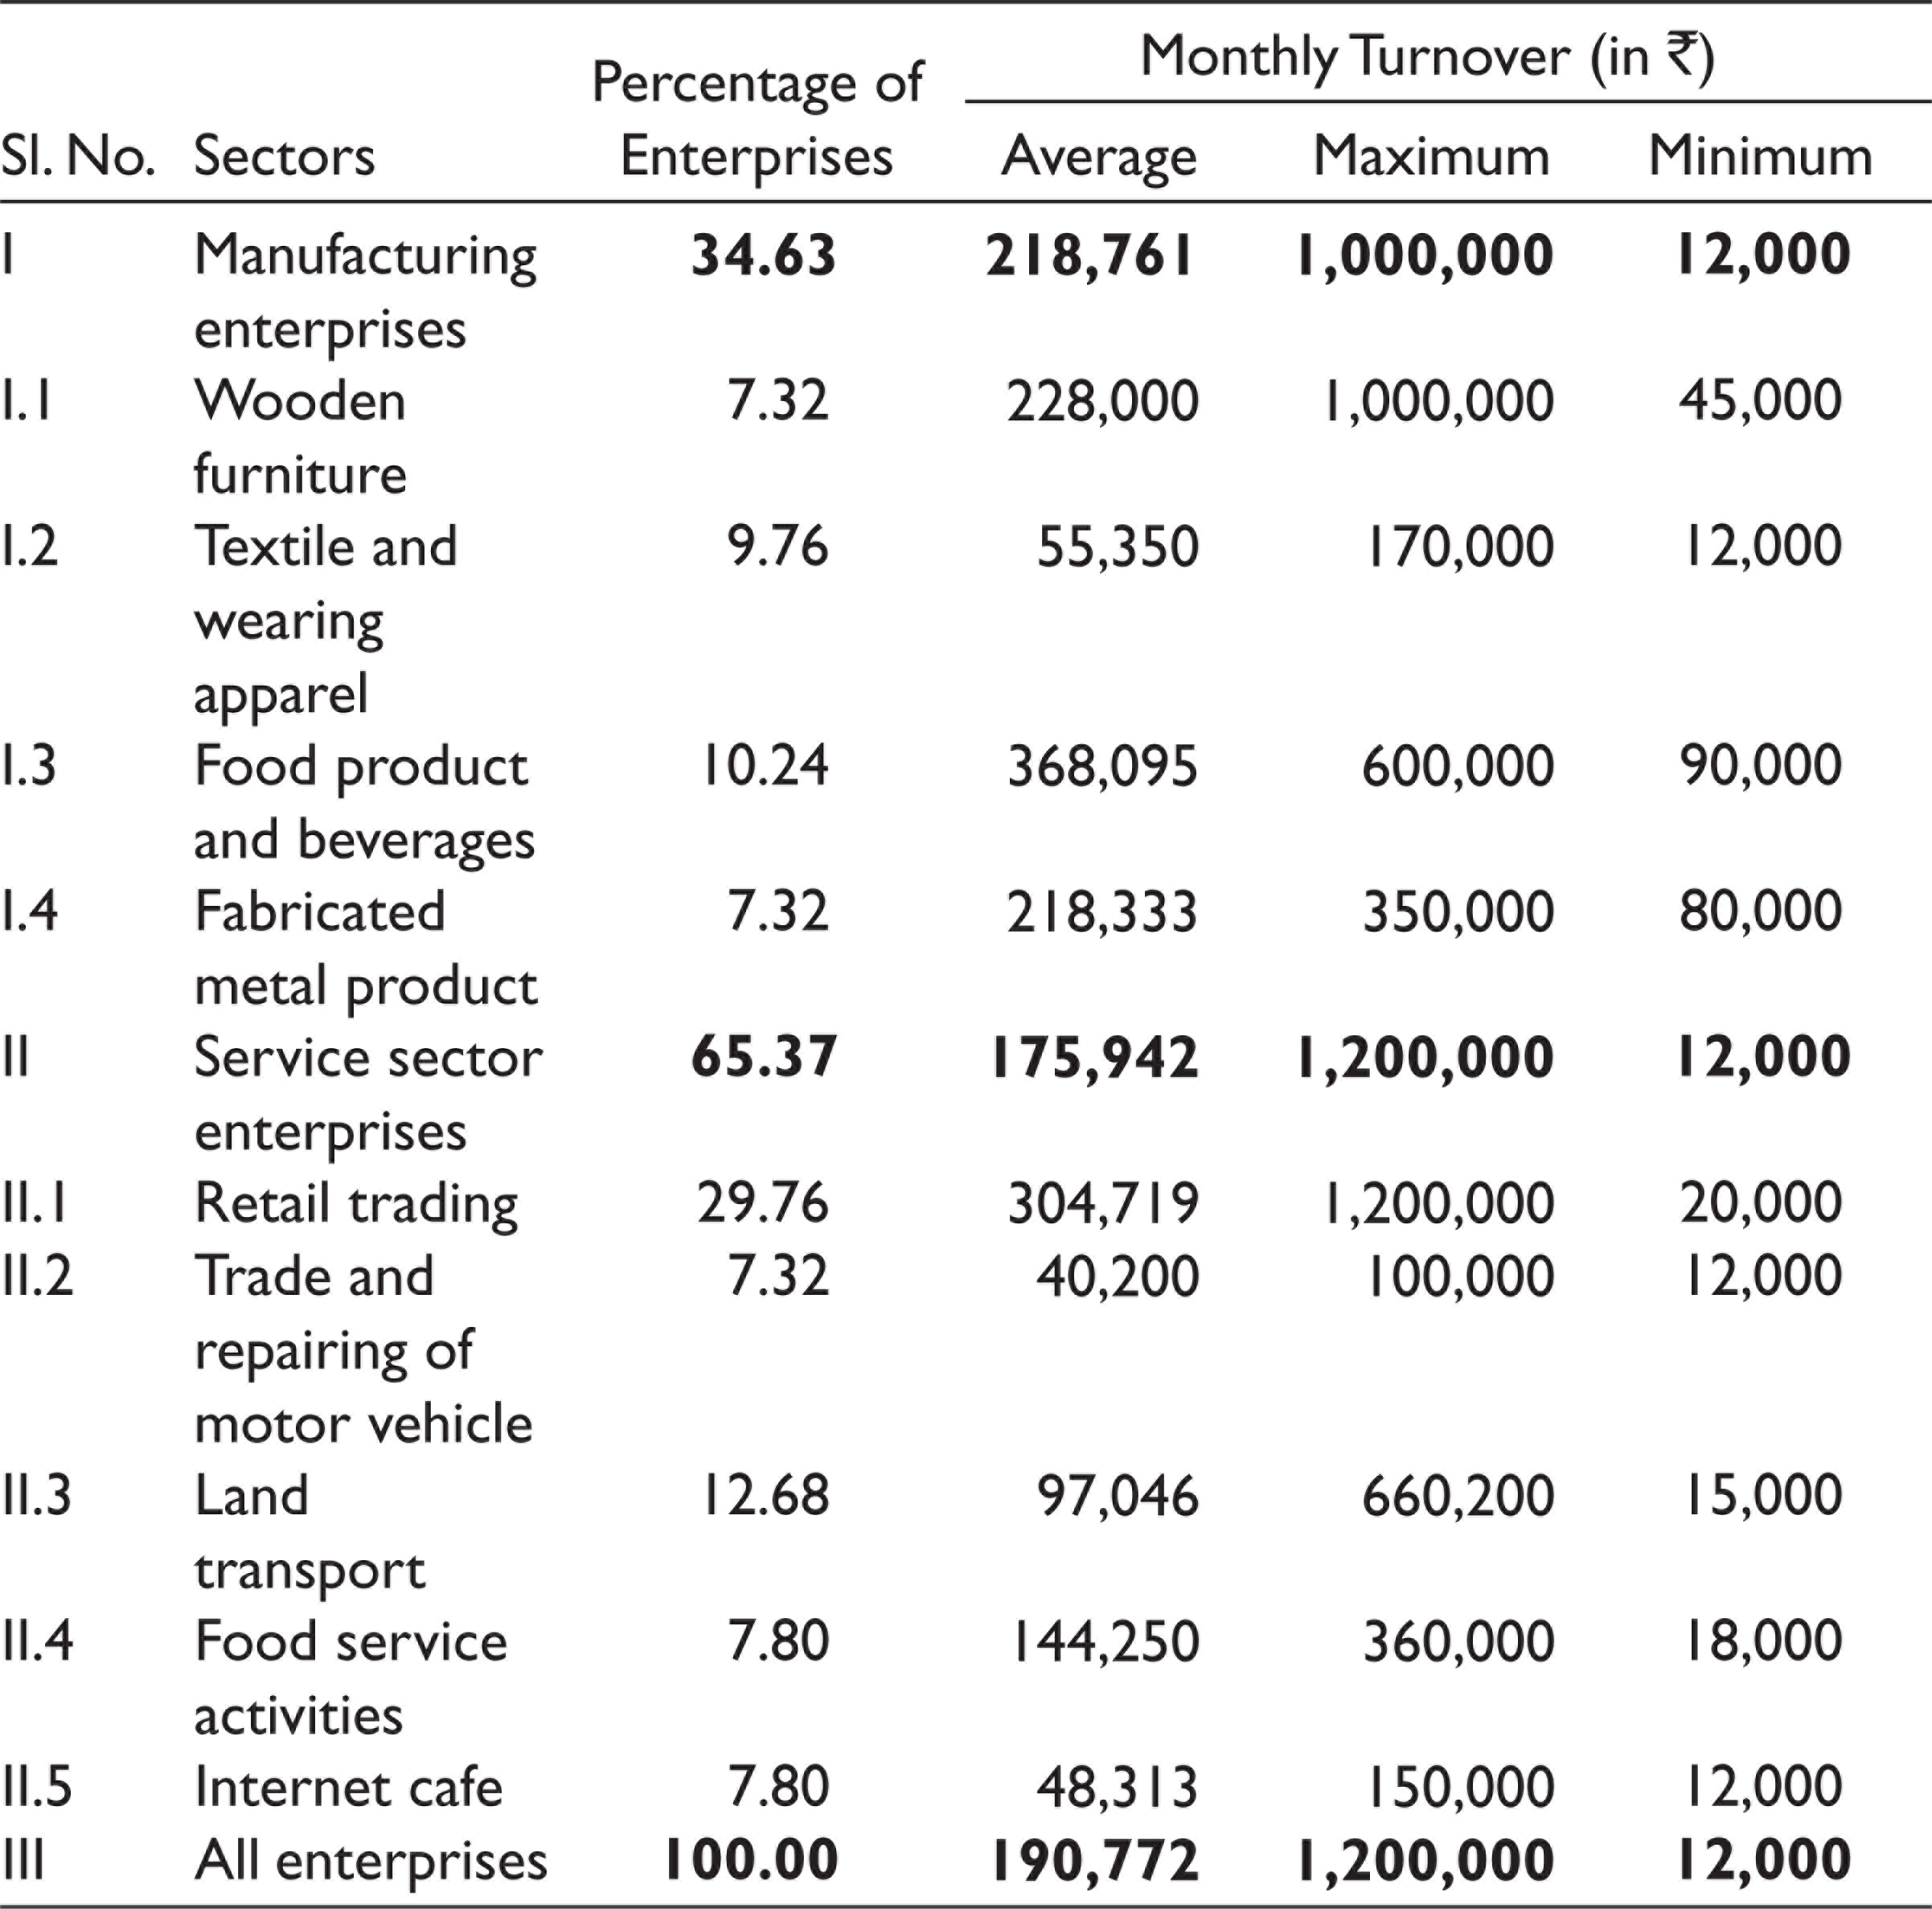
The sample consists of own account enterprises (OAE) as well as establishments. An OAE runs on a fairly regular basis without employing any hired workers; while the establishment enterprises employ at least one hired worker on a regular basis. Around 40 per cent of the sample enterprises were OAEs. The range of monthly turnover of sample enterprises given in Table 1 shows that the sample included enterprises of varied size starting from a tiny one with monthly turnover of mere ₹ 12,000 to the biggest turnover of ₹ 1,200,000. On an average, the manufacturing enterprises have higher turnover than the services sector enterprises.
Distribution of the Sample Enterprises and Their Monthly Turnover
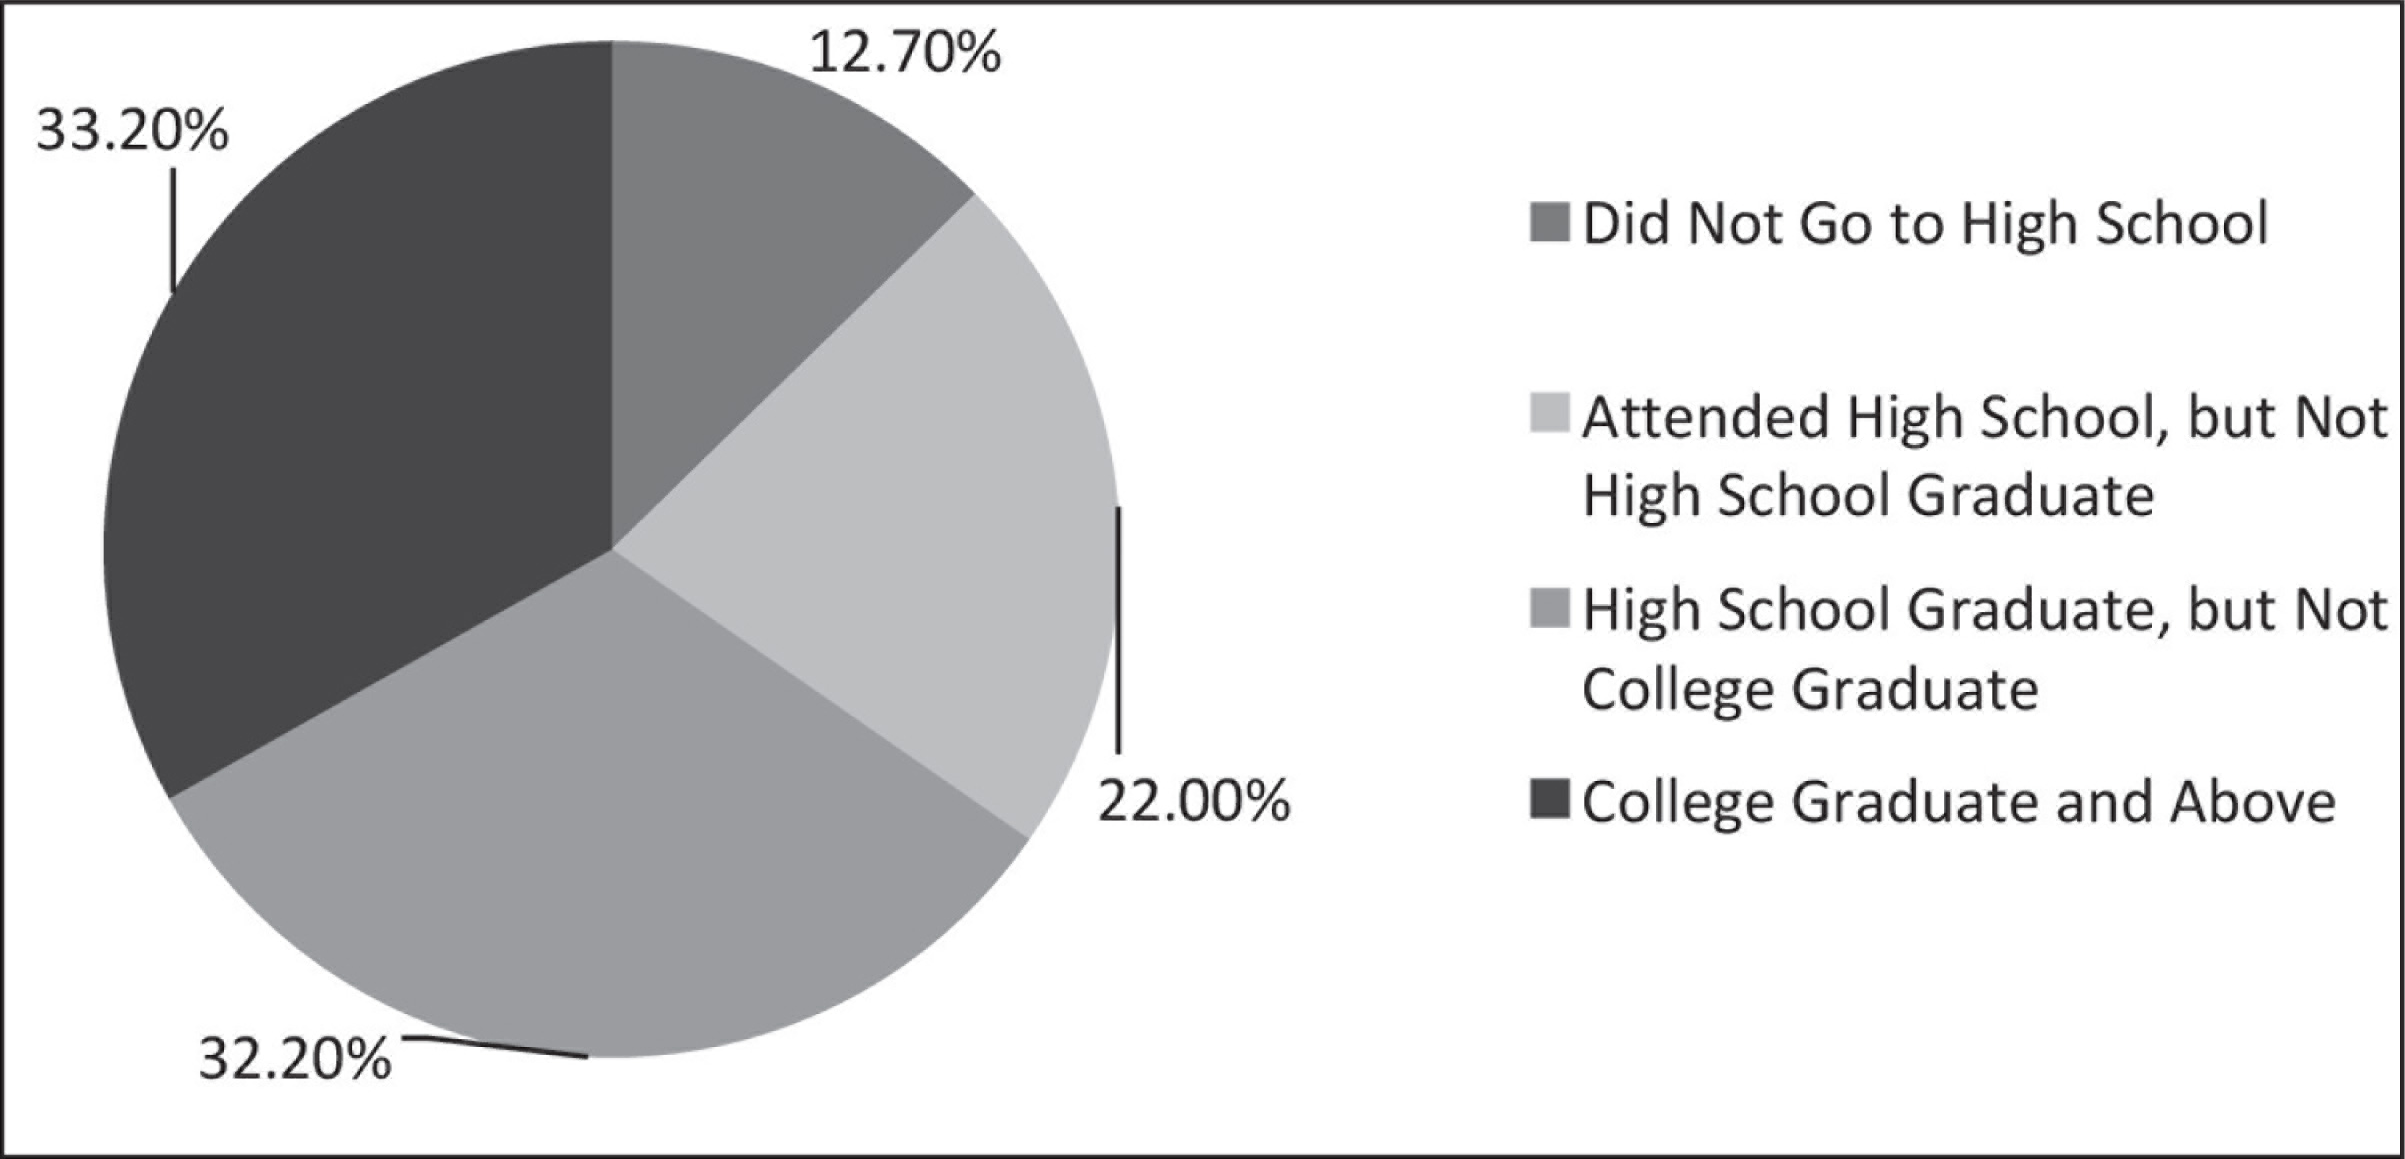
All the sample enterprises were at least 1 year old (please refer to Figure 1). Around 13 per cent of the sample entrepreneurs have never gone to high school, while 31.2 per cent are college graduates (refer to Figure 2).

Contrary to the general impression of the unorganised sector enterprises, the sample enterprises in general are not totally out of any registration process. Indeed, 83 per cent of the sample enterprises are registered with one or more government agency. In most cases, registration is with the municipal authority. Almost 64.40 per cent of the surveyed entrepreneurs have reported the shortage of capital and/or lack of access to financial services, including bank credit, as a constraint.
Financial Access of the Sample Entrepreneurs
An unorganised enterprise cannot be separated from the entrepreneur. Similarly, the financial access of the unorganised entrepreneurs and that of the enterprises cannot be separated. Therefore, these two terms have been used interchangeably. The financial access of sample entrepreneurs has been assessed depending on the four financial services, namely, saving, credit, insurance and payment made through the banking system. Almost all the sample entrepreneurs (98%) have savings bank accounts, but only 32.7 per cent have current accounts. It is to be noted that only a businessman is entitled to have a current account. Similarly, though 80 per cent of the sample entrepreneurs have life insurance coverage, only 39 per cent have business insurance coverage too. The three quarters of sample enterprises do not use the banking system for payment purposes. The remaining 25 per cent makes some of their payments through banks. In fact, a large majority of the surveyed entrepreneurs has no awareness about business insurance and payment practice through the banking system.
With regard to credit, entrepreneurs have been found to borrow from formal, semi-formal and informal sources. FFIs include banks and other term lending institutions. Semi-formal financial institutions (SFFIs) include self-help groups (SHGs) and micro-finance institutions and the informal sources include indigenous moneylenders, traders, friends and relatives. The percentage distribution of sample entrepreneurs according to their access to credit from different sources is given in Table 2. Around 74 per cent of the sample entrepreneurs had access to credit irrespective of sources. However, only 41 per cent had taken a loan from FFIs, and the rest borrowed either from SFFIs or from informal sources. There is a perception among a large section of the sample entrepreneurs (41%) that getting a bank loan is a time consuming and cumbersome process. Hence, many of these entrepreneurs do not approach banks even in need of credit. Furthermore, entrepreneurs often lack awareness about the different loan products offered by the banking system.
Percentage of Entrepreneurs Accessing Credit from Different Sources

Measuring Depth of Financial Access of the Sample Entrepreneurs
To measure the depth of financial access, an index is designed incorporating the four basic components, namely, saving, credit, insurance and payment made through the banking system. Initially, these four indices are designed and incorporated to develop the Financial Access Index (FAI) for measuring the depth of financial access. To calculate the individual indices, scores are given to each aspect of financial access.
For saving, entrepreneurs having a current account are given score 2. Entrepreneurs with no current account, but savings bank accounts are given score 1. Entrepreneurs with no bank accounts were given score 0. Entrepreneurs with both the savings account and current account are given higher score. Thus, the maximum possible saving score is 2. To derive the saving index (SI), the saving score of the particular entrepreneur is divided by the maximum saving score 2. Thus,
Saving Index (SI) = Saving Score / 2 where 0 ≤ SI ≤ 1
Entrepreneurs with access to business loan from FFIs are given score 5. Entrepreneurs with access to credit from FFIs, but no business loan are given score 4. Entrepreneurs having access to credit from SFFIs are given score 3. Entrepreneurs having access to credit from friends and relatives are given score 2. Entrepreneurs having access to credit from money lenders are given score 1, and those who have not taken any loan are given score 0. Entrepreneurs having access to credit from more than one source are given higher score. Thus, the maximum possible credit score of an entrepreneur is 5. Thereafter, the credit index (CI) of the entrepreneur is derived dividing the actual credit score by the maximum possible credit score, that is,
Credit Index (CI) = Credit Score / 5 where 0 ≤ CI ≤ 1
Entrepreneurs having business insurance coverage are given score 2. Entrepreneurs with no business insurance but life insurance are given score 1. And entrepreneurs with no insurance coverage are given score 0. Entrepreneurs having access to both business insurance and life insurance are given score 2. Finally, to derive the insurance index of an entrepreneur, the actual insurance score of that entrepreneur is divided by the maximum possible insurance score 2; that is,
Insurance Index (II) = Insurance Score / 2 where 0 ≤ II ≤ 1
Entrepreneurs making all transactions of their business through the banks are given score 2. Entrepreneurs making their transactions partially through the banks are given score 1, and entrepreneurs making no payment through the banking system are given score 0. To derive the payment index, the actual payment score of the entrepreneur is divided by the maximum possible payment score 2.
Payment Index (PI) = Payment Score / 2 where 0 ≤ PI ≤1
Finally, the Financial Access Index (FAI) is designed as an arithmetic mean of the above mentioned four indices giving equal weightage
2
to all. Hence,
FAI = (Saving Index + Credit Index +Insurance Index + Payment Index) / 4 where 0 ≤ FAI ≤ 1
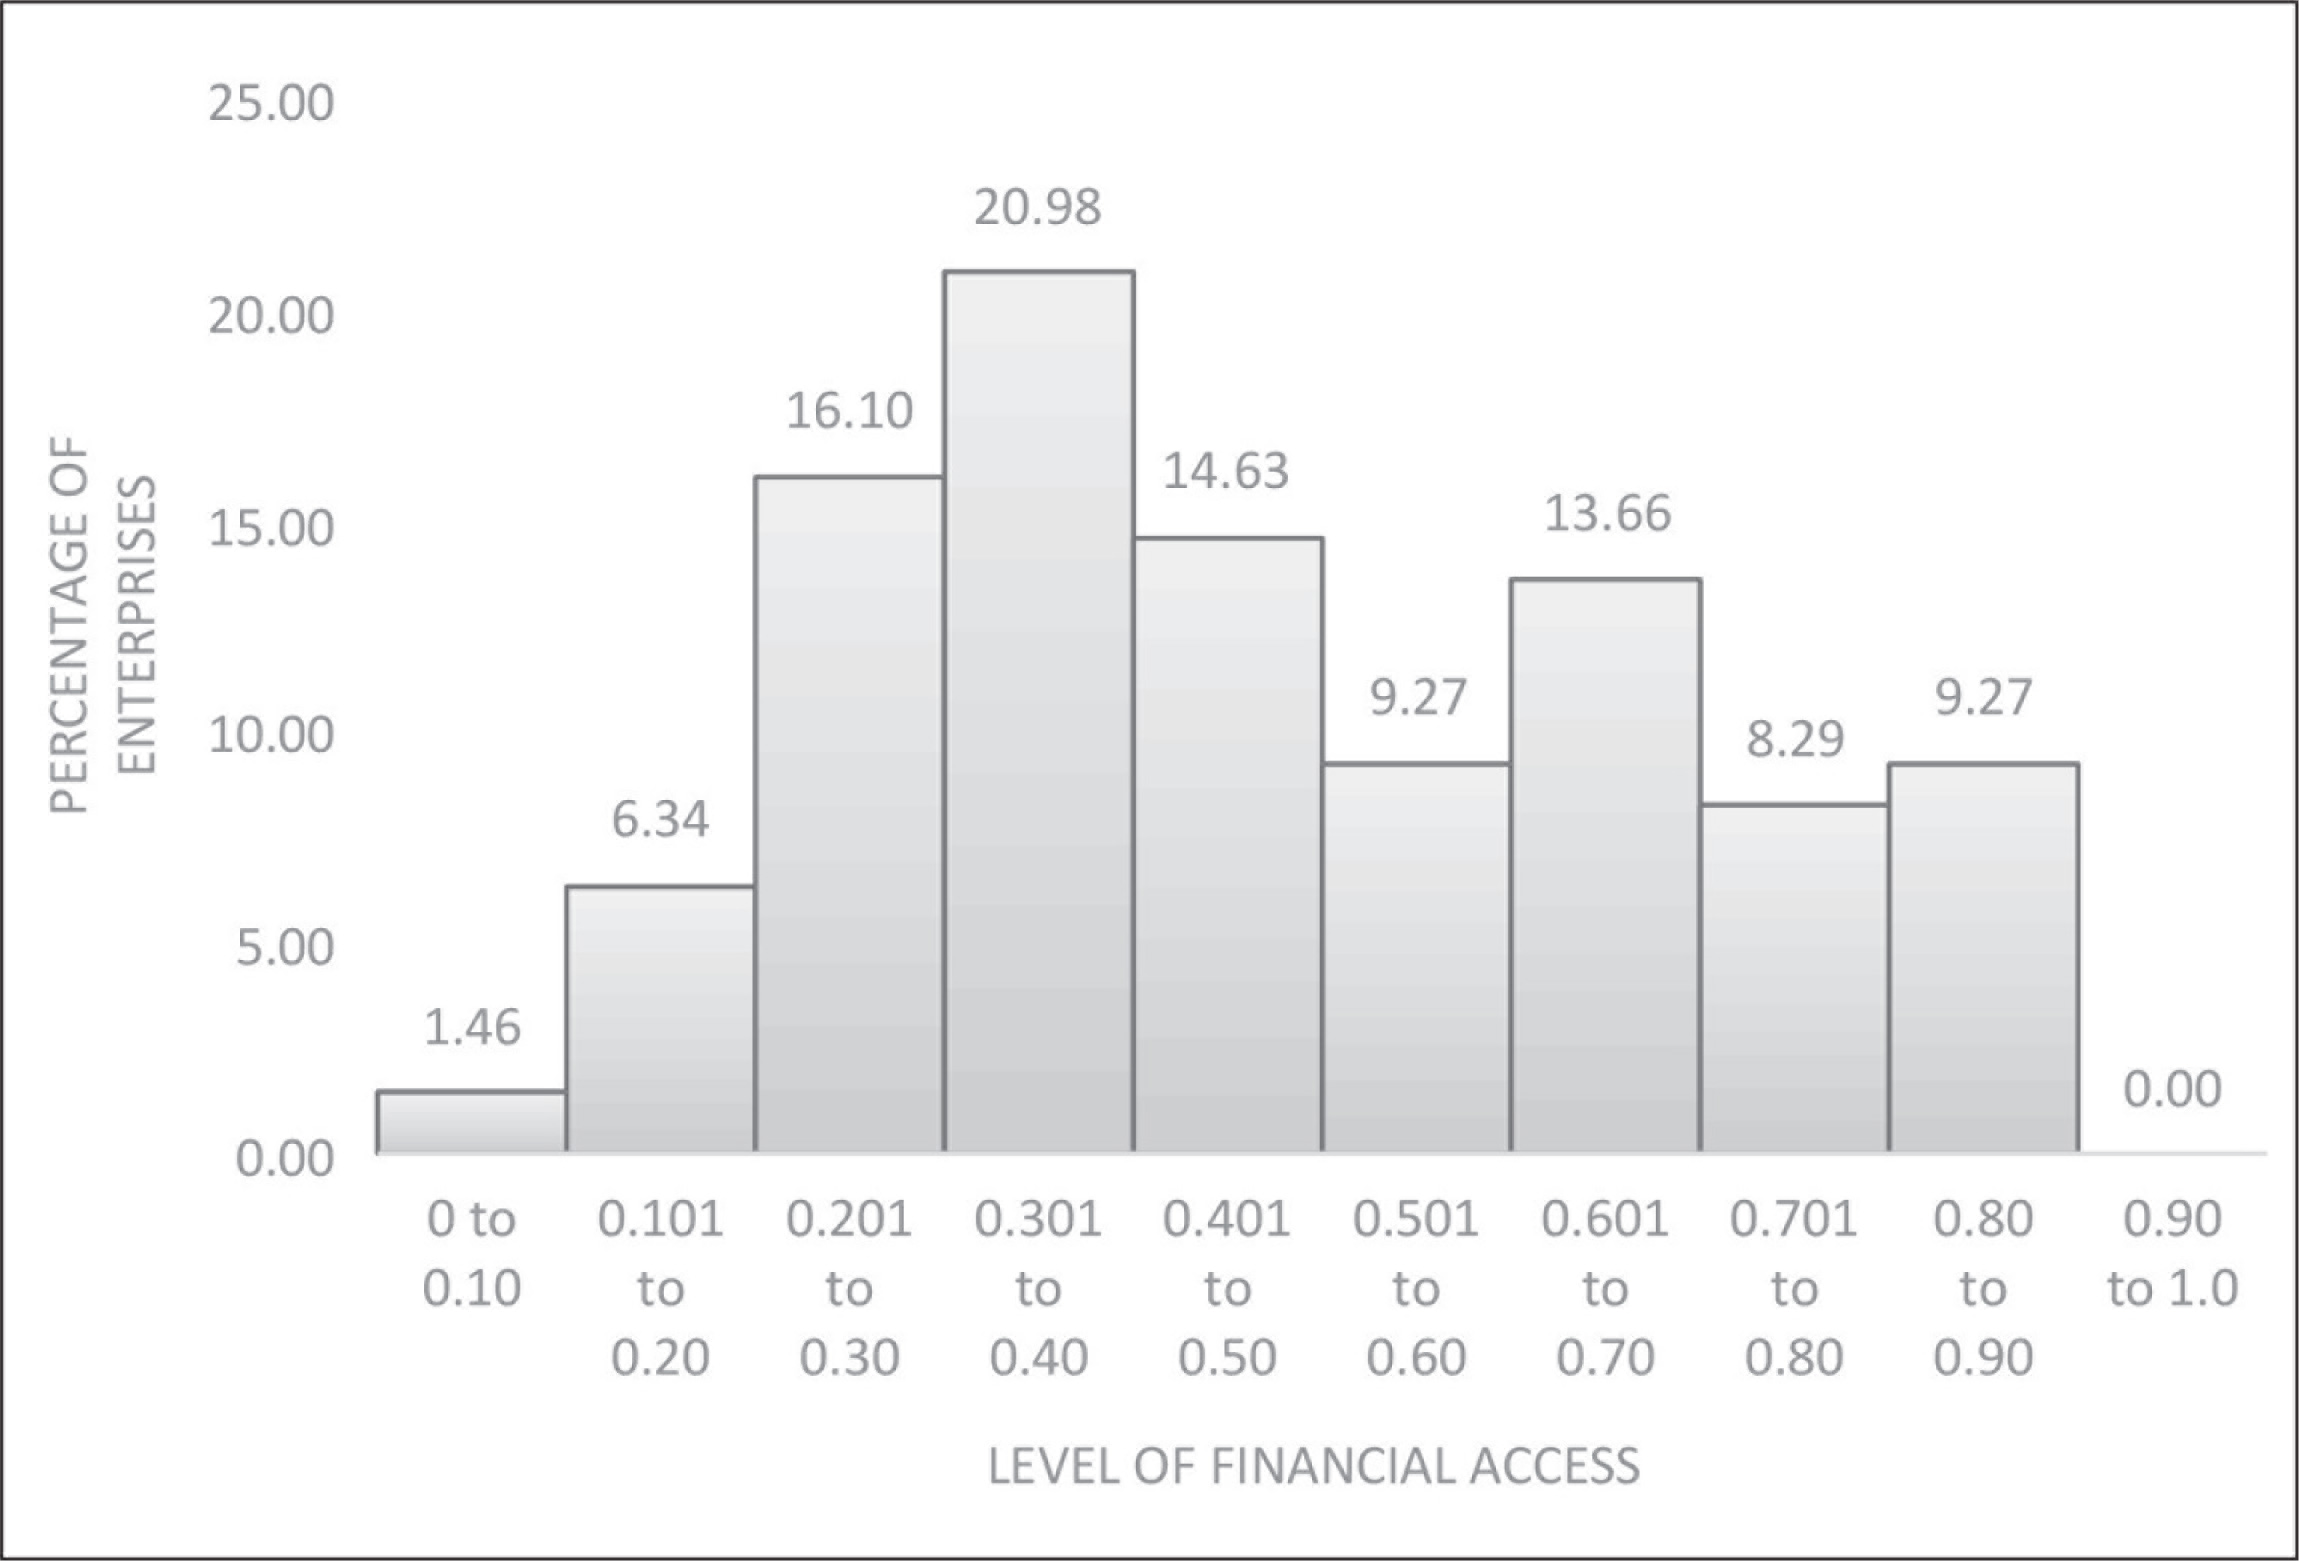
The distribution of enterprises according to their depth of financial access is given in Figure 3. Only two entrepreneurs have no financial access (FAI = 0), but the larger percentage of enterprises have thin financial access. Thus, financial coverage is not a problem; rather the thin financial access is the problem.
Model for Identification of Determinants of Financial Access
The variables involved in the regression analysis for identification of factors influencing the extent of financial inclusion are outlined below.
The dependent variable for the analysis is the Financial Access Index (FAI) of sample units as defined above.
The explanatory variables included are the turnover of the enterprise, status of registration, age of the enterprise, type of enterprise and education level of the entrepreneur. Bhavani and Bhanumurthy (2012) and Farazi (2014) find that the turnover of the enterprise, status of registration, and level of education of the entrepreneur have positive impact on the financial access of the enterprise. The age of the enterprise is included as an explanatory variable because it is conceivable that longer an enterprise has been established, it would be easier for the enterprise to access formal financial services.
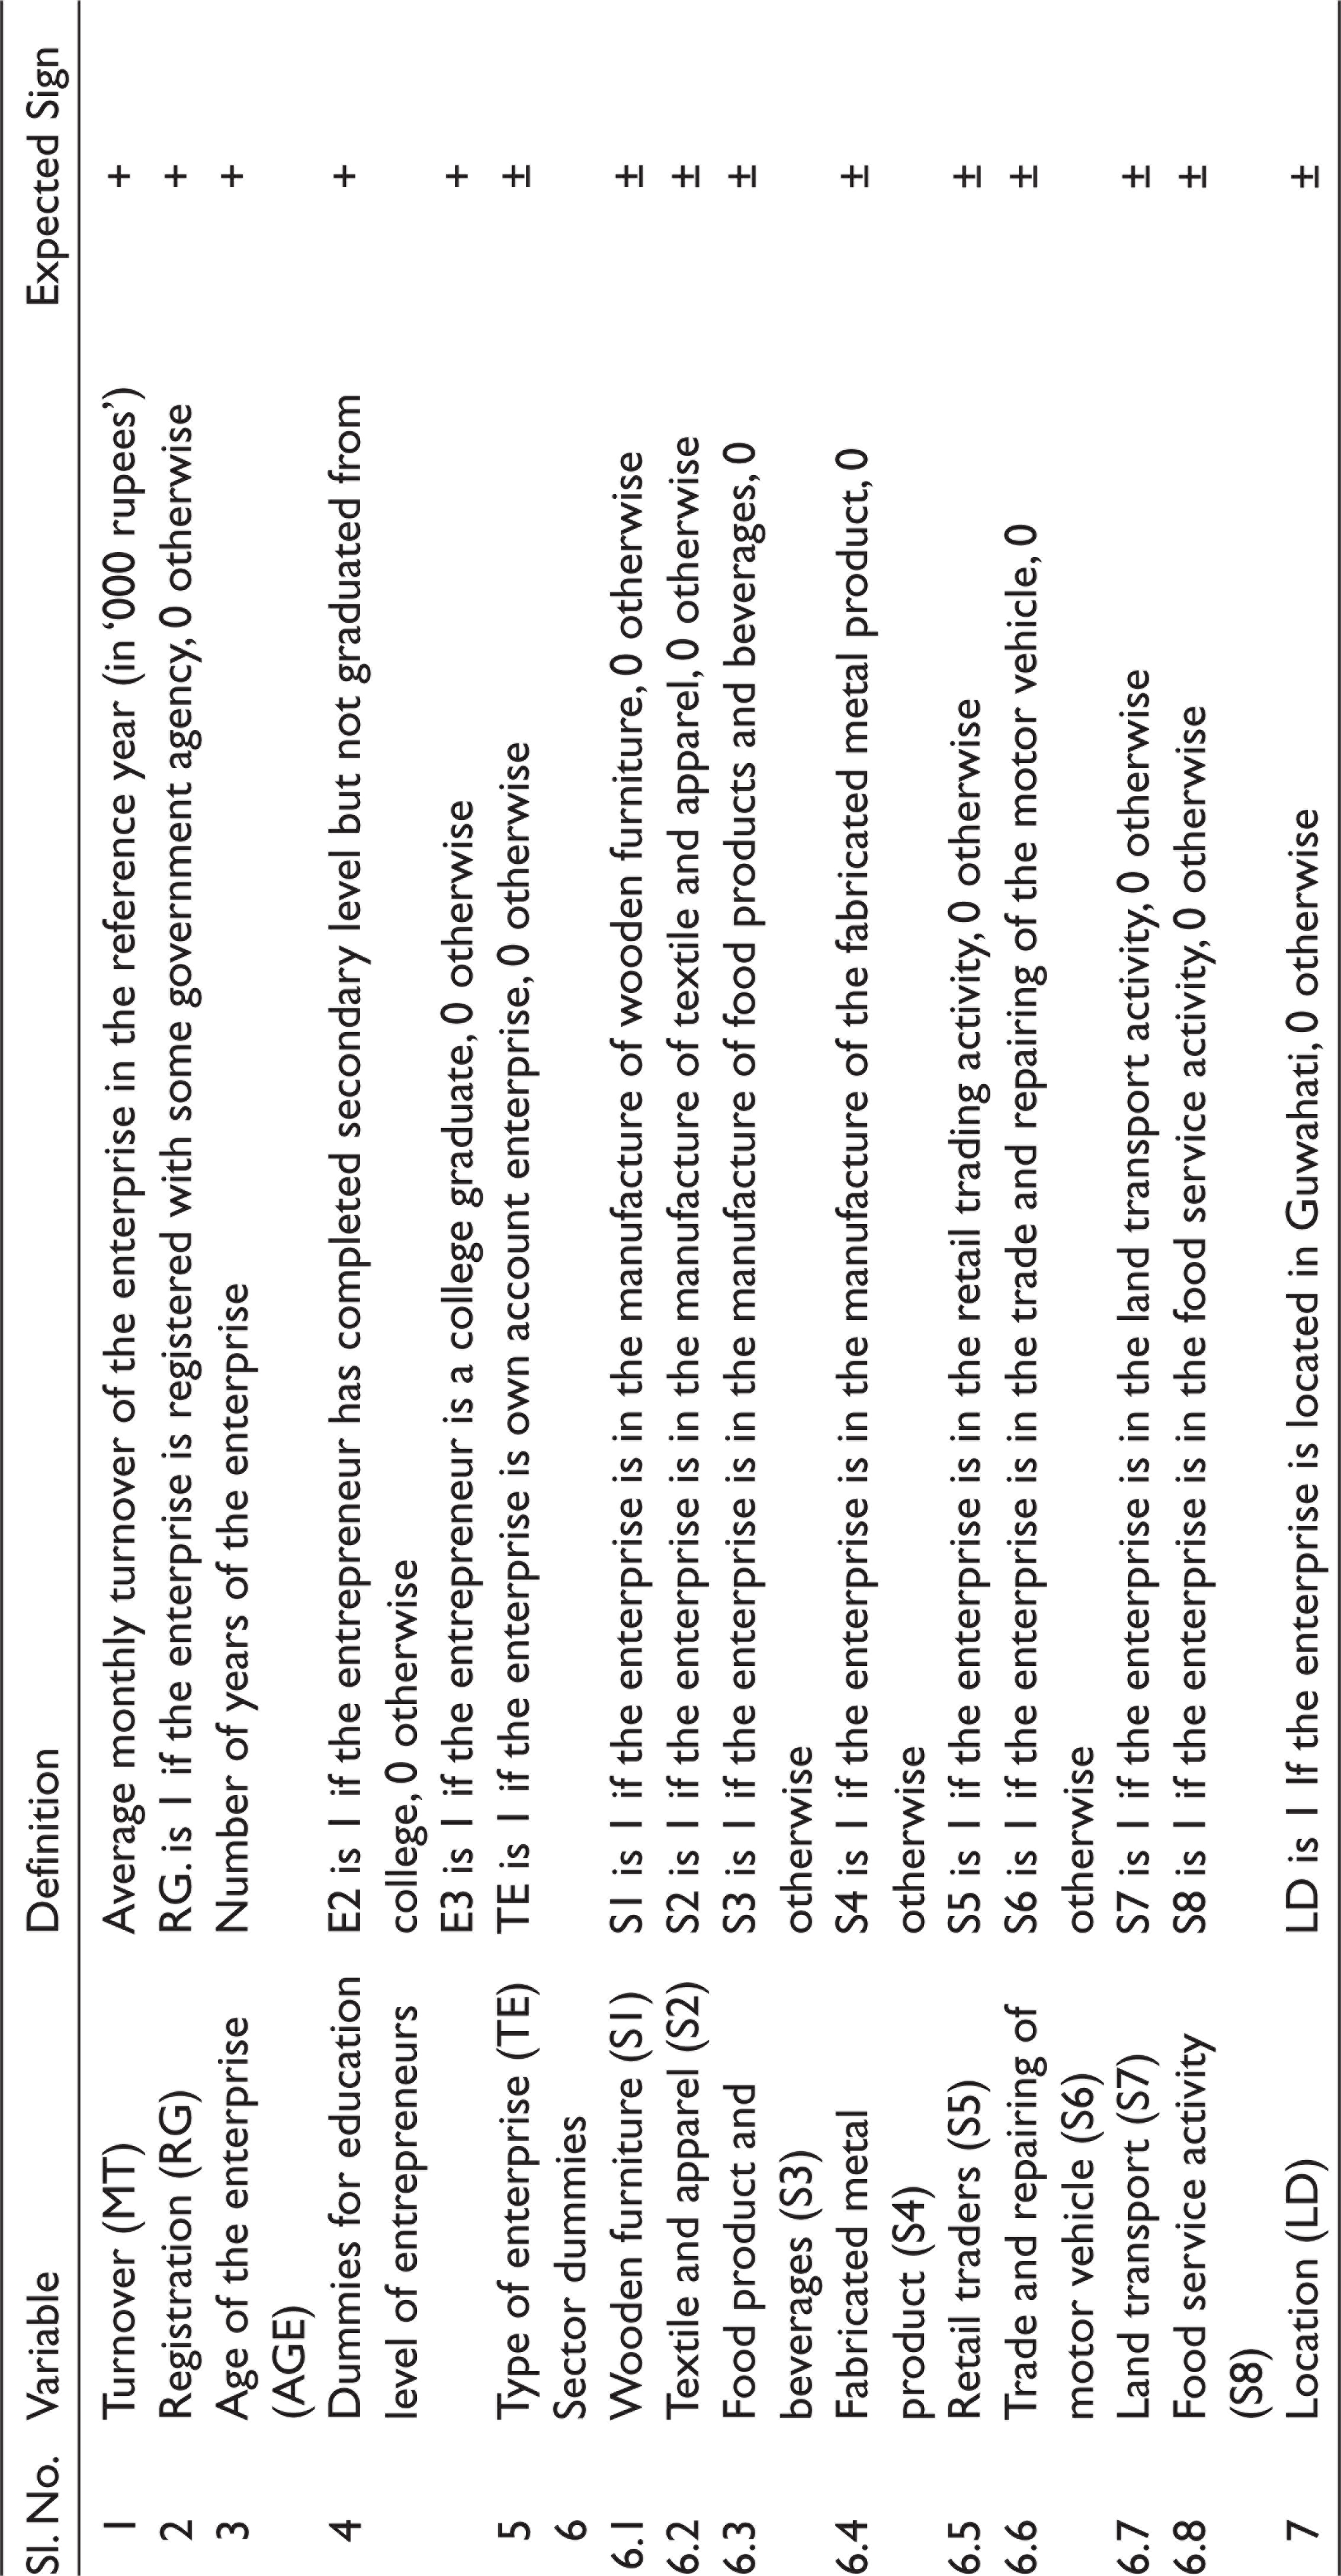
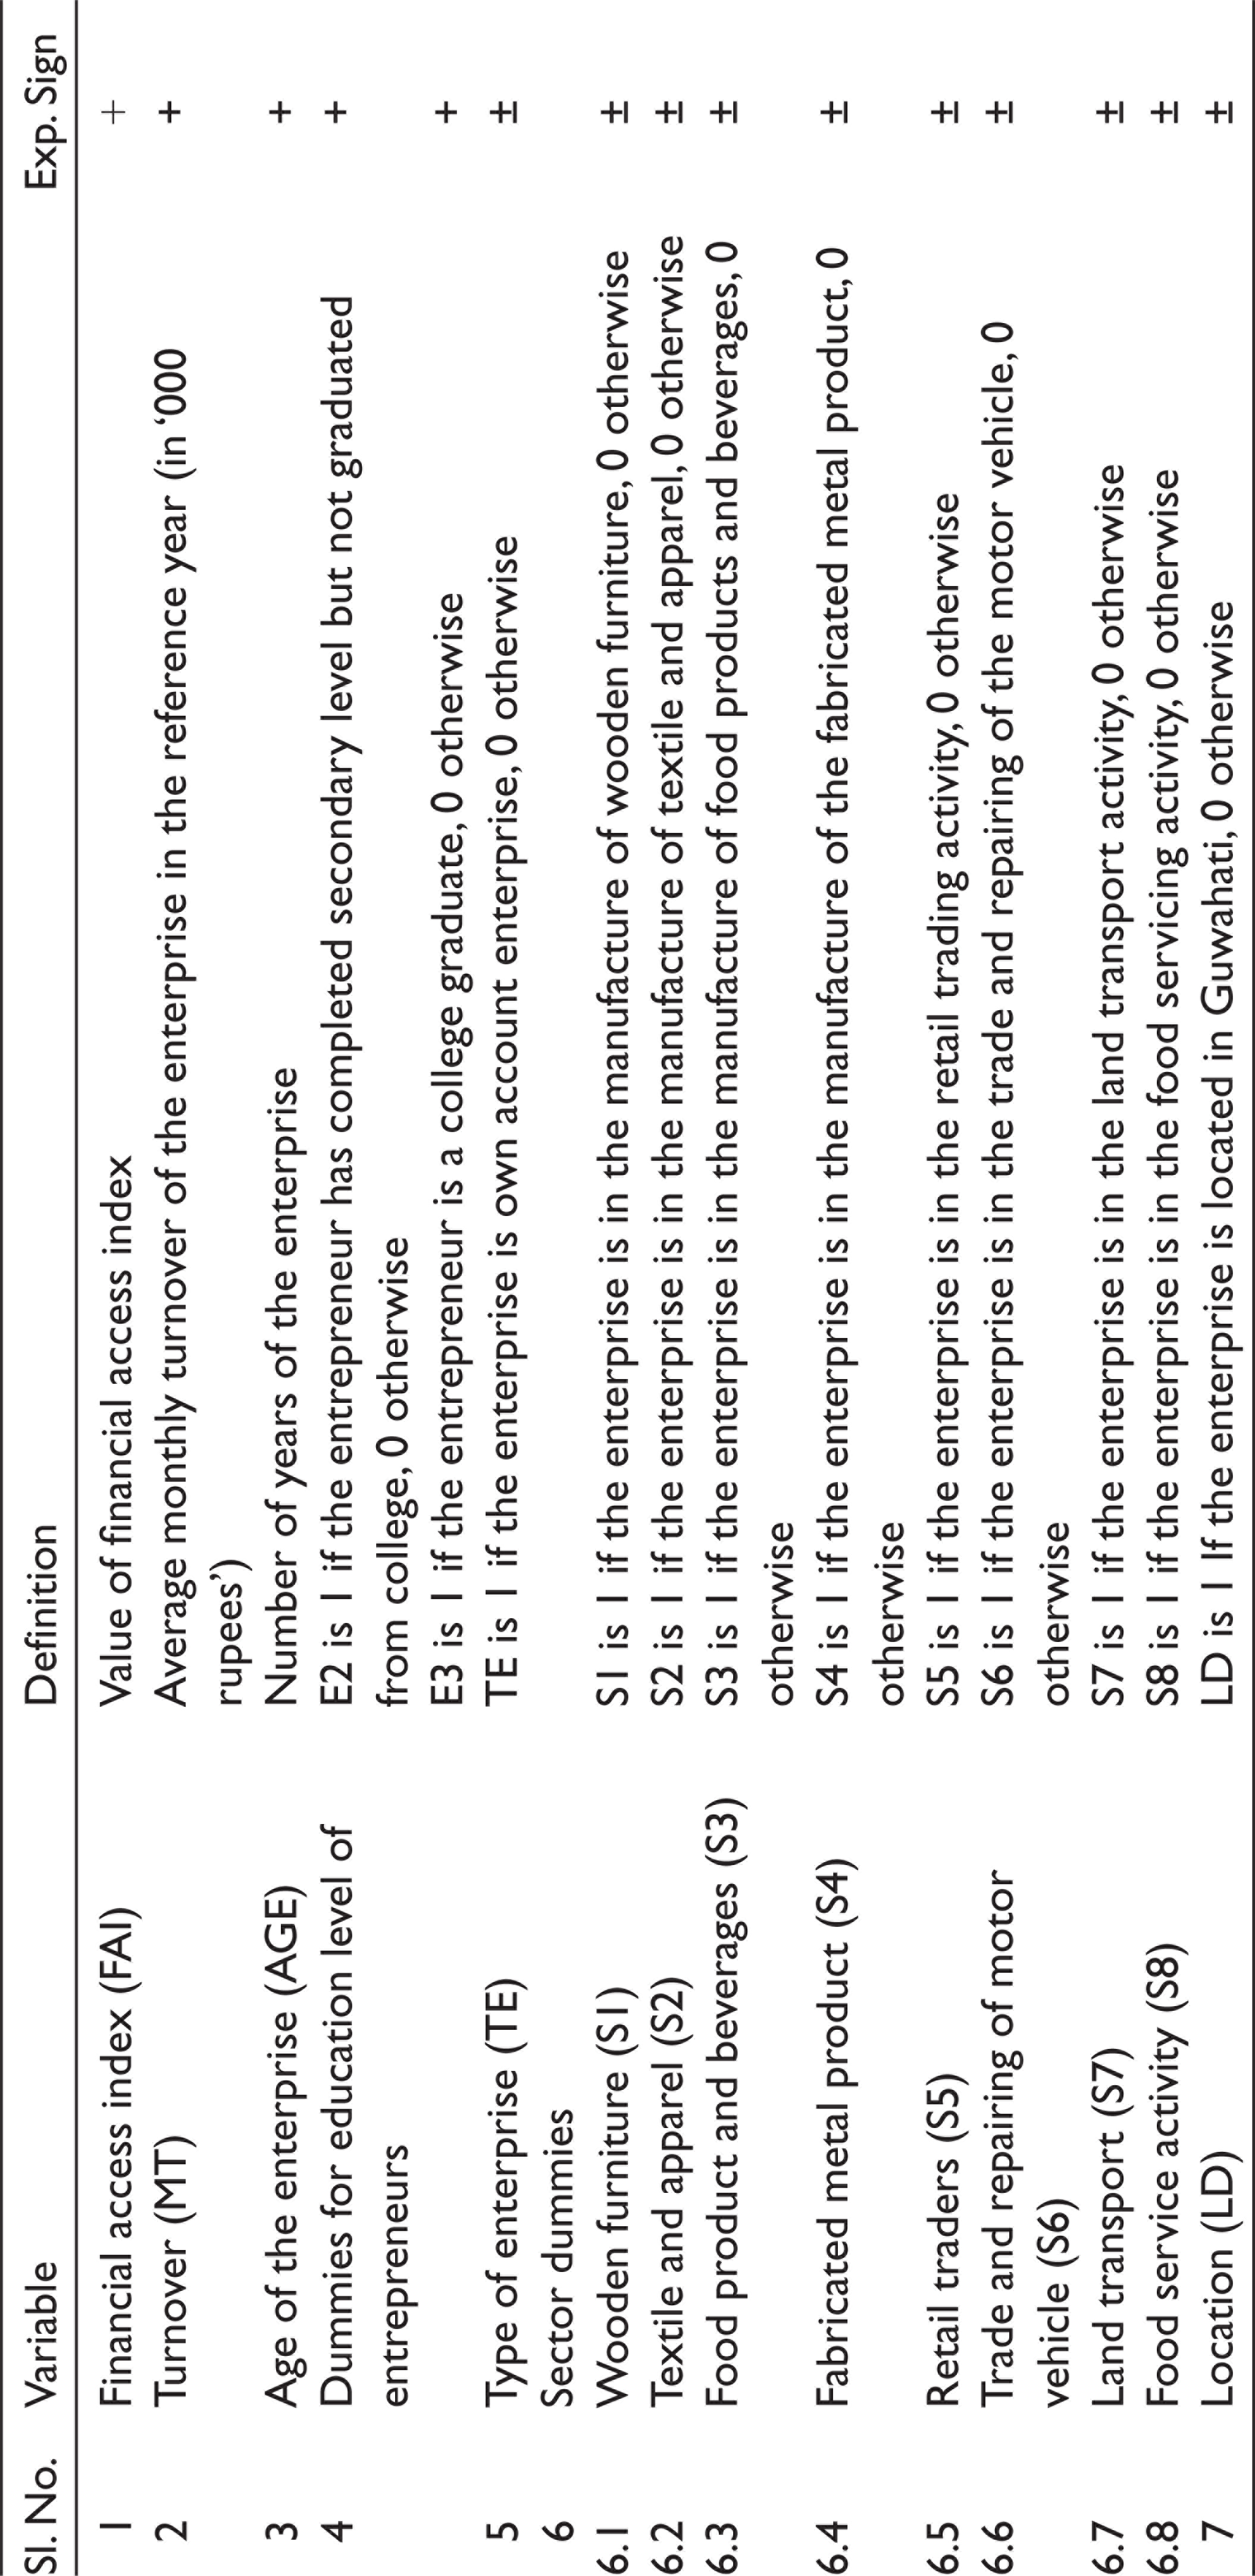
With regard to the education level, the surveyed enterprises have been classified into three ordered categories. The lowest category includes those who have not completed secondary level of education. The middle category includes those who have completed secondary education but have not graduated from colleges and universities. The highest category comprises the graduates and above. To represent the three categories, two dummies E2 and E3 have been used; with the lowest category being the base. E2 = 1 for the middle category and 0 for otherwise, and E3 = 1 for the highest category and 0 for otherwise. Further, for two locations, one location dummy, and for nine sub-sectors, eight sector dummies are included. The definition of the explanatory variables and the expected sign of their coefficients are given in Table 3.
Definition of the Explanatory Variables Regressed on Financial Access of the Unorganised Sector Enterprises and Expected Signs of Their Coefficients
The formulation of the model for the dependent variable financial access index and the above-mentioned explanatory variables is conducted as follows:

FAI
i
, is the value of the response/dependent variable for the i-th sample unit. Given the set of explanatory variables, the linear predictor η for the i-th observation can be written as:

The next step is to relate this linear predictor to the predicted mean of the response variable E(FAI
i
). For this purpose, a smooth and invertible linearising link function g is adopted, which transforms E(FAI
i
) = μi to the linear predictor. Thus:

Because the link function is invertible, we can also write

In the present case, g has been taken as the identity link of the Gamma Distribution.
The results of the GLM estimation are presented in Table 4. The turnover of the enterprises is positively significant, that is, enterprises having a larger volume of business have better access to financial services. Enterprises that are registered in some government agency have better access to financial services. Education dummy E3 is found to be positively significant; however, E2 is insignificant. In other words, entrepreneurs who have completed graduation or have higher degree are better capable of accessing finance. Location dummy is positively significant; that is, enterprises in Guwahati (bigger urban location) have better access to financial services. Among the different sub-sectors, enterprises in the land transport activity have significantly higher financial access. Indeed, most of the enterprises in this sector have access to vehicle loans in the FFIs. Further, their vehicles also have vehicle insurance.
Results of GLM Regression for the Determinants of Financial Access

Financial Performance of the Sample Enterprises
Two indicators of the financial performance of the enterprises have been taken for this analysis, namely, gross value added (GVA) and profit. While GVA indicates the contribution of the enterprise to GDP, profit indicates the commercial viability of such business.
The GVA of an enterprise is the excess of its total value of output over the cost of intermediate inputs that have gone into the production of the output. The intermediate inputs are raw materials, electricity, indirect taxes, travel allowances, debenture allowances, telephone bills, etc. Profit is calculated by deducting the value of the paid allowances, depreciation, imputed rent, salary of the self-employed, salary of family labour, and interest on own capital from GVA.
Profit = Gross Value Added – Depreciation – Factor Payments – Taxes and Fees to the Government (if any) – (Value of Imputed Rent + Salary of the Self Employed + Salary of Family Labour + Interest on Own Capital)
The paid allowances (factor payments) include rent on land and building, compensation to the hired labourer, and interest on the loan. It is not easy to calculate the depreciation value of an enterprise. A segment of the existing literature (Government of India, 2007) has calculated the depreciation cost at 10 per cent of the cost of capital, and this formula has also been applied in this study. The imputed rent of the land and building owned by the entrepreneur’s household is calculated at the actual rate prevailing in the particular locality. The salary of the self-employed and family workers is also calculated at the actual wage rate prevailing in that locality for that work. Furthermore, the involvement of the entrepreneur in the managerial work is also considered. The interest on own fund invested in the capital asset is calculated at 10 per cent per annum and the interest on owned fund spend for working capital expenditure is calculated at 12.5 per cent per annum (Government of India, 2007).
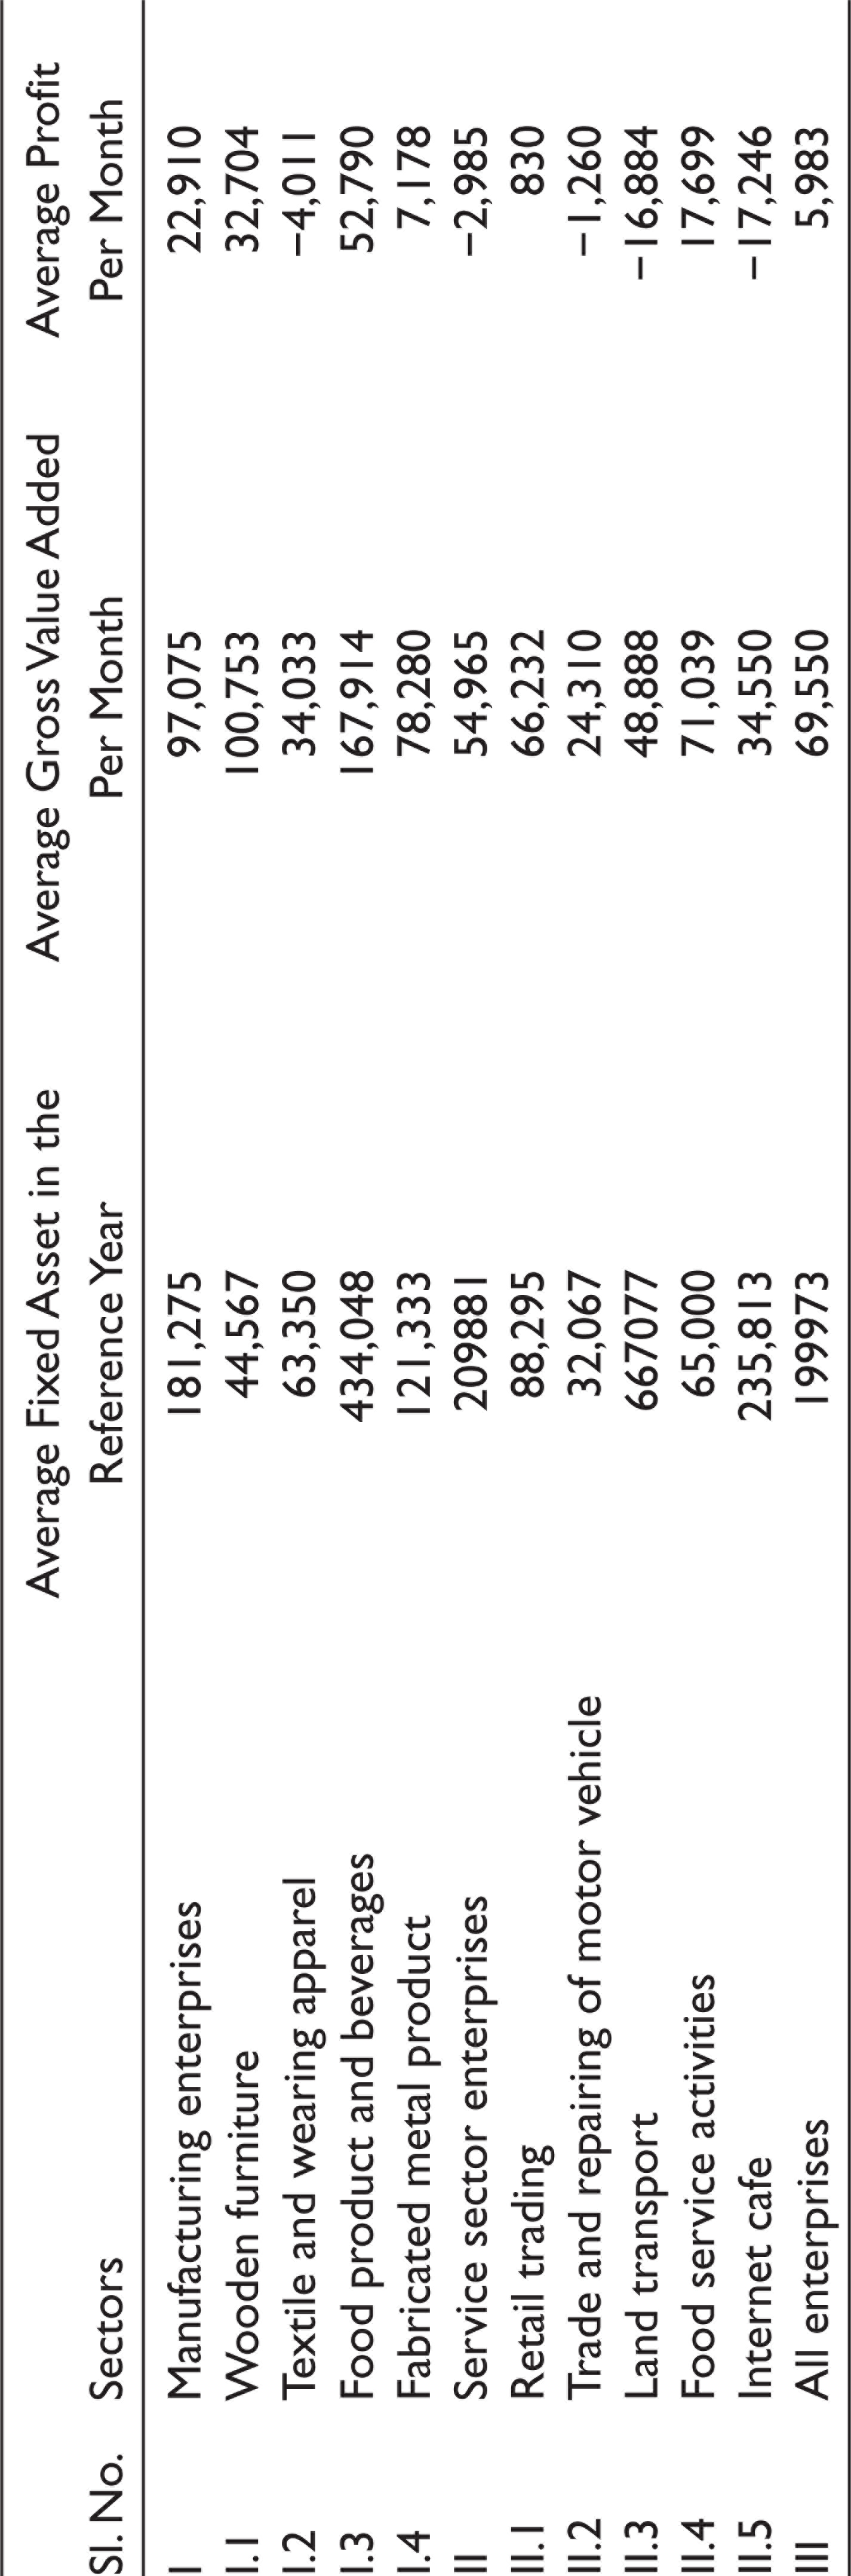
The value of the fixed asset and financial performances per unorganised enterprises of the sample across different sub-sectors is shown in Table 5. The financial performance of the enterprises in the manufacturing sectors is better than those in the services sector. Among the different sub-sectors, the enterprises working in the manufacturing of food product and beverages are the best performers. The average profit (net return) is found to be negative for the enterprises in some sub-sectors.
Value of Fixed Asset and Indicators of Financial Performances of the Sample Enterprises (in Rupees in the Reference Year)
Models for Examining the Impact of Financial Access on Performance of the Sample Enterprises
To examine the impact of financial access on the financial performance of the enterprises, we estimated two econometric models.
Dependent variables. The enterprises in the unorganised sector range from petty traders with limited investment to small-scale industries with a significantly higher level of investment. It is natural that larger firms are likely to have higher levels of GVA in absolute terms. However, the GVAs cannot be compared. To make the numbers comparable across firms, GVAs have been scaled to the value of the fixed asset of the respective enterprises. Similar scaling has been applied to the profits of the enterprises. Thus, the dependent variables in the following two regression models are GVA of an enterprise divided by the value of its fixed asset (Y1), and the profit-fixed asset ratio of the enterprise (Y2).
Explanatory variables. The prime independent variable of interest is the index of financial access. To control interferences of other factors, the turnover of the enterprise, age of the enterprise, type of the enterprise, and education of the entrepreneur are considered as explanatory variables. The definitions of the explanatory variables and the expected signs of their coefficients are given in Table 6.
Definition of the Explanatory Variables Regressed on Financial Performance of the Unorganised Sector Enterprises and Expected Signs of Their Coefficients
Functional specification of the models. The models specified for analysis of the financial performance of the sample enterprises have been detailed below

where, i = 1 or 2.
Y1 = GVA divided by the value of the fixed asset
Y2 = Profit-fixed asset ratio
Theoretically, the dependent variable Y
i
may take any positive or negative values. Hence, a linear specification is admissible. The model is specified as
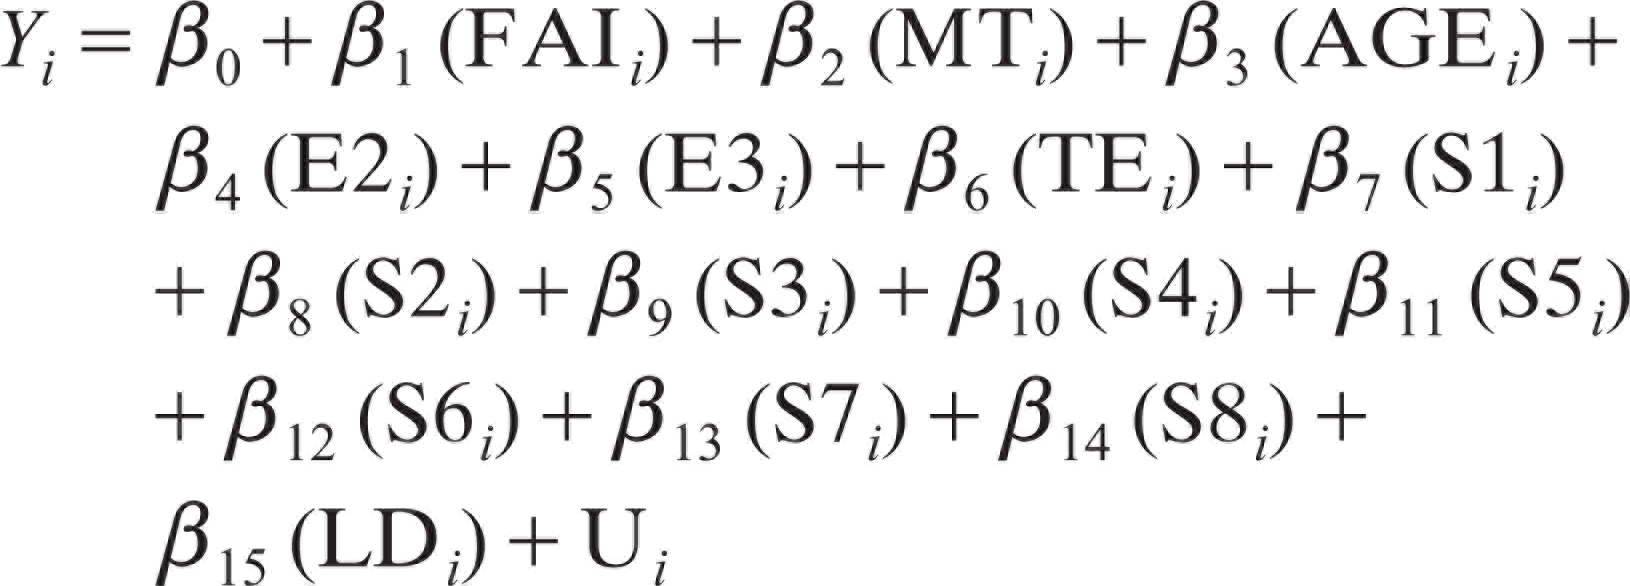
U i in Equation (6) is the random disturbance term that is assumed to be normally distributed.
The results summarised in Table 7 show that financial access has no significant impact on the financial performance of the sample enterprises. One of the probable reasons is that many well-established enterprises (enterprises with better financial performance) have not borrowed any fund from external sources. Their own fund is the only source of investment in the business. However, they have balances to be paid to the suppliers of raw materials, which can be considered as one form of borrowing (which is not included in the analysis). The educational level of the entrepreneurs has no significant impact on the financial performance of the sample enterprises. The coefficient of location dummy and the sector dummy S1 are found to be positive and highly significant, that is, enterprises in Guwahati and enterprises engaged in the manufacture of wooden furniture have shown better performance.
Results of Linear Regression for the Determinants of Financial Performance
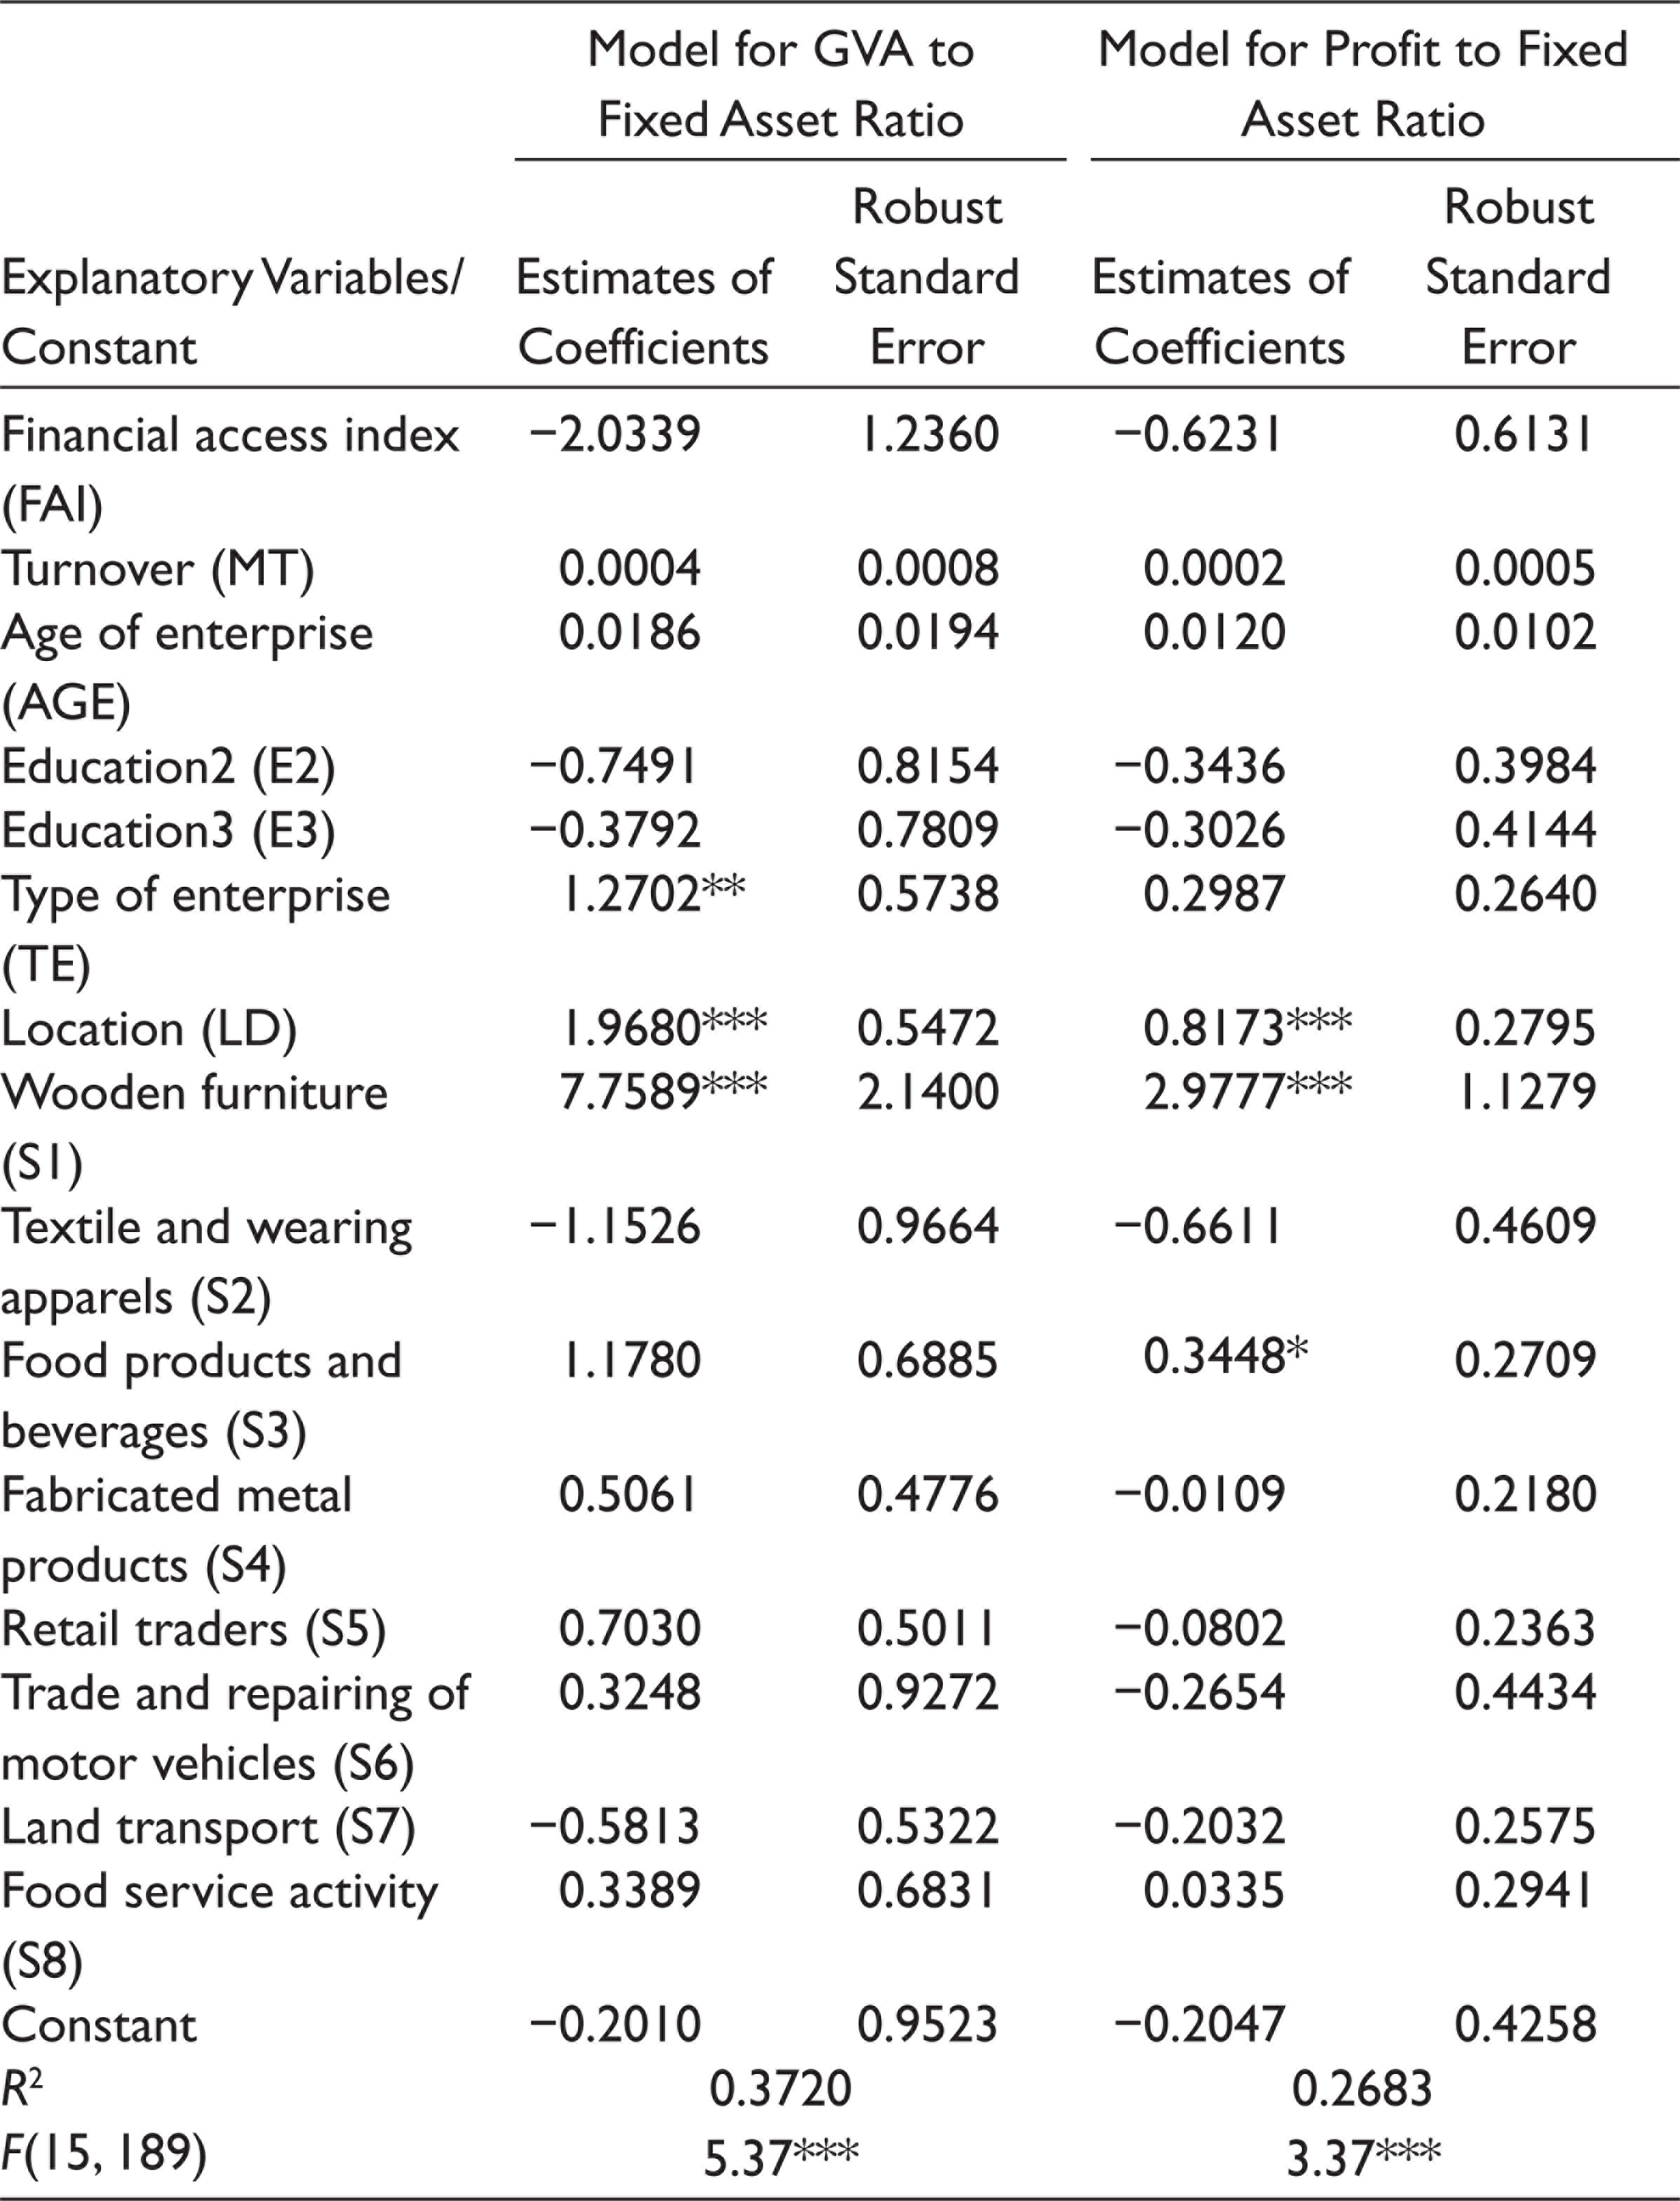
*** Represents 1% level of significance, ** indicates 5% level of significance and * represents 10% level of significance.
Growth Experiences of the Sample Enterprises
In a dynamic context, it is pertinent to find the factors determining an enterprise’s growth performance. For finding the factors, each sample enterprise has been first assigned to one of the four ordinal categories as par its growth experience over 5 years preceding the survey. Enterprises that had expanded their turnover and diversified their products were placed in the highest category of ‘expanded and diversified’. Enterprises that had expanded their turnover, but had not diversified their products, were put in the next highest category of ‘expanded’. Enterprises that had made no notable change in their revenue over 5 years preceding the survey were classified as ‘stagnant’. The enterprises that experienced a contraction of their turnover were placed in the lowest category of ‘contracted’. Figure 4 shows that over the 5 years preceding the survey, 10.7 per cent of the sample enterprises had expanded and diversified their business; while 52.2 per cent had expanded their business without diversification.

Since the sample enterprises have been grouped into ordered categories as per their growth performance, the analysis was carried forward by estimating an Ordered Logit model. The prime independent variable of interest is the index of financial access. However, to control interferences of other factors, the turnover of the enterprise, age of the enterprise, registration of the enterprise, type of enterprise, and education level of the entrepreneur are considered as the explanatory variables. The definition of the explanatory variables (excluding registration) and the expected signs of their coefficients are similar to that of financial performance (as given in Table 6). Registration (RG) was included as a dummy variable in this model; which was assumed to be 1 if the enterprise had registration with some government agency, and 0 otherwise. It is expected that registration had positive impact on the growth performance of the sample enterprises.
The results summarised in Table 8 show that financial access has positive and significant impact on the growth performance of the sample enterprises. Larger enterprises (with higher monthly turnover) have relatively better growth performance. Again, establishments have better growth performance compared to the OAE. Enterprises manufacturing wooden furniture show poor growth, despite having a good financial performance. A possible explanation is the ban imposed by the Supreme Court of India on felling of trees in the Northeast India. 3 The shortage of timber may have had an adverse effect on the growth of this sector.
Results of the Ordered Logit Regression for the Determinants of Growth Performance
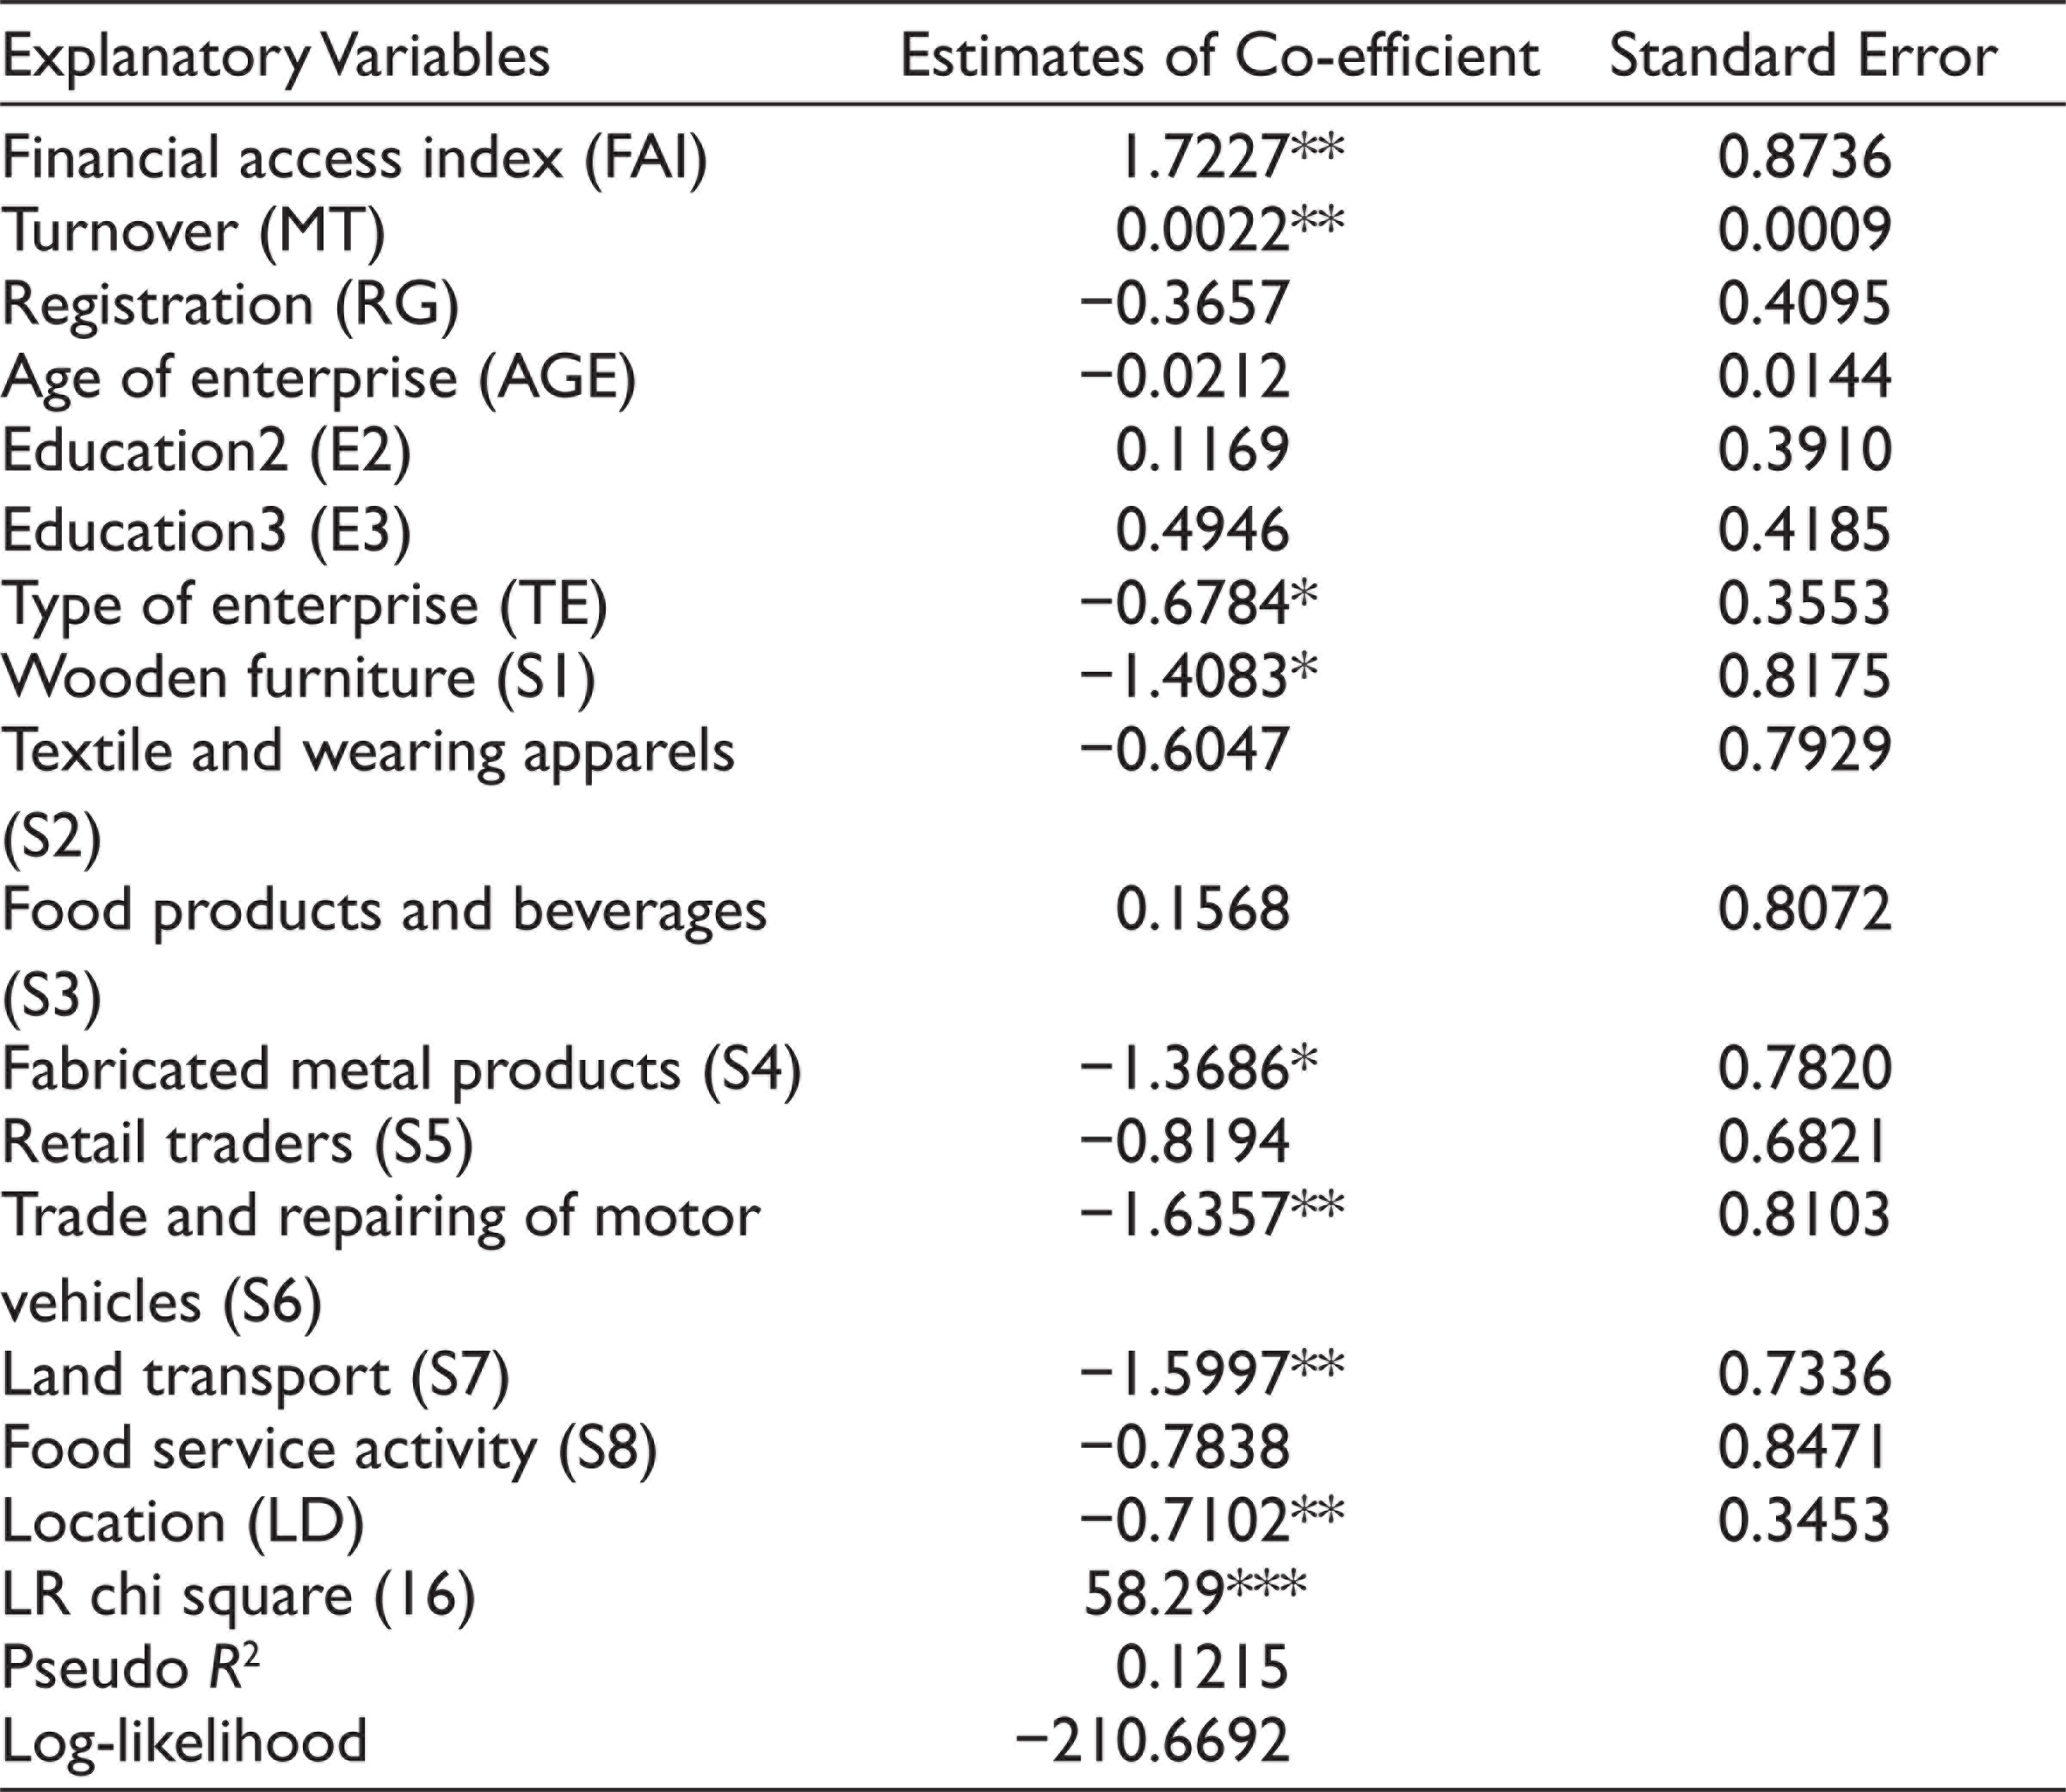
***Represents 1% level of significance; **represents 5% level of significance and *indicates 10% level of significance.
Conclusion
Considering the linkage with FFIs, at least in the form of having a bank account, the sample entrepreneurs are mostly financially included. However, the depth of financial access is very thin in most cases. The access to credit from FFIs and business insurance is limited. Most of the sample entrepreneurs depend on their own funds and/or credit from informal sources for financing their business. Clearly, there are credit needs that FFIs cannot meet.
The study finds that the usual supply-side issues obstructing formal credit flow to these entrepreneurs still persist. Many entrepreneurs are hesitant to approach banks, even if a bank branch is in the vicinity. Entrepreneurs’ perceive that getting a bank loan is a lengthy and cumbersome process. With regard to business insurance, awareness about the facility and its usefulness is generally lacking.
The regression analyses reported above show that the entrepreneurs usually manage to run their day-to-day business activities even without access to credit from formal sources. But for scaling up their business, the access to formal credit is crucial. Hence, if the unorganised sector enterprises are to be up-scaled and eventually integrated into the organised sector, the extension of financial access of the entrepreneurs has to receive greater and urgent attention. On the one hand, the outreach of FFIs to these grassroots level entrepreneurs has to be extended and deepened. On the other hand, the entrepreneurs’ awareness about the usefulness of different financial services and the way of accessing the services has to be enhanced.
Limitations of the Study and Area of Future Research
The investigation into financial inclusion can comprehensively be done only after considering both the demand and supply side of it. An obvious limitation of this study is that it examines primarily only the demand side factors of entrepreneurs’ financial access. Future researchers may make a comprehensive study including both the demand and supply side factors.
Footnotes
Declaration of Conflicting Interests
The authors declared no potential conflicts of interest with respect to the research, authorship and/or publication of this article.
Funding
The authors received no financial support for the research, authorship and/or publication of this article.