
Abstract
In this article, an attempt is made to study the trends and patterns of female work participation in Tamil Nadu across districts and examine the effect of structural transformation in the economy on women’s employment in the decade 2001–2011. There is a wide variation in the female work participation rate in the state. It is higher in agro-based, poor and most backward districts and is low in urbanized and industrialized districts as well as in districts with higher levels of per capita income, female literacy and unemployment. The analysis here shows that structural changes in the economy have not resulted in any dramatic change in the quality and quantity of women’s employment. Further, the casual labour segment has been expanding in rural Tamil Nadu with reductions in self-employment.
Introduction
Women’s participation in the labour market is an important indicator of women’s contribution to the economic growth of a country and is also an index of women’s overall status in the society (Mammen & Paxson, 2008). The proportion of women who work for pay varies widely from country to country. According to the Human Development Report by UNDP (2017), over 86 per cent of women of the age 15+ are in the paid labour force in Rwanda—highest among the countries of the world—followed by Uganda (82%). In Canada, Sweden, the USA, the UK and Germany, the work participation rate (WPR) of women is above 55 per cent. Among the South Asian countries, Nepal stands first with a female WPR of 80 per cent followed by China (64%) and Singapore (58%). The WPR of women in India at 27 per cent is below that of its neighbouring countries: Bangladesh (43%) and Sri Lanka (30%). Variations across countries reflect the differences in economic development, education levels, fertility rates, access to childcare and other supportive services and social norms (Chaudhary & Verick, 2014).
National Sample Survey Organisation (NSSO) data shows that female work participation rate (FWPR) in India has been steadily declining over the decades. It had dropped from 28.6 per cent in 1993–1994 to 25.9 per cent in 1999–2000 and to 21.9 per cent in 2011–2012. The recent publication of the Periodic Labour Force Survey (PLFS) report (Periodic Labour Force Survey, 2017–2018) presents an alarming decline in FWP in India to 16.5 per cent. The withdrawal of women from the workforce has occurred during a period when India was experiencing high average annual GDP growth of 8 per cent (World Bank, 2012). A plethora of literature has emerged in recent years both nationally and internationally to explain the falling trends in women’s employment in India. Most studies attribute it to expansion of education; increase in the level of household income; conceptual problems in measurement of women’s work; and lack of job opportunities for women (Kannan & Raveendran, 2012; Kapsos et al., 2014; Klasen & Pieters, 2015; Lahoti & Swaminathan, 2013).
Researchers have tried to identify the determinants of female labour supply in India by region. Male WPR, sex ratio and female literacy rate are suggested as significant variables that explain female WPR in Punjab (Kaur & Kaur, 2017). Sociocultural factors such as sex ratio and caste show a positive association with female work participation in Uttar Pradesh (Kumar, 2013). Children below 15 years, marital status and number of people financially dependent on women have a positive impact, while the time spent at the workplace and in household activities, travel time to workplace, size of household income and non-availability of support systems have a negative impact on labour supply behaviour of urban women in Tripura (Saha & Kalita, 2015). Sarkhel and Mukherjee (2014) found that in general the patriarchal family structure and cultural norms negatively affect women’s labour market participation in India. Studies have also highlighted the positive impact of Mahatma Gandhi National Rural Employment Guarantee Act (MGNREGA) on female labour force participation (Dheeraja et al., 2013; Pandi & Baladhandayutham, 2016). Thus factors for and against FWP seem to vary from state to state.
Why is there a declining trend in women’s WPR in India alongside economic growth? This necessitates an in-depth analysis of the growth–employment relationship in the context of structural changes taking place within the economy. The present research article aims to look at the micro-level scenario of FWP across the districts of Tamil Nadu, in South India.
Objectives of the Study, the Setting and Data Sources
The following were the aims of the study:
To understand district-wise trends and patterns of FWPR To measure rural/urban disparity in FWPR and also the gender gap in WPRs To examine the effect of structural transformation of the state economy on patterns of women’s employment across districts To identify the factors that account for variations in FWPR across districts
The study relates to Tamil Nadu state and its 32 districts as on 2011.
1
For inter-district comparison of female work participation in Tamil Nadu, the 32 districts are geographically grouped as follows:
Central: Ariyalur, Karur, Nagapattinam, Perambalur, Pudukkottai, Thanjavur, Thiruvarur and Tiruchirappalli West: Coimbatore, Dharmapuri, Erode, Krishnagiri (formed in 2004), Namakkal, Salem, the Nilgiris and Tirupur (formed in 2009) South: Dindigul, Kanniyakumari, Madurai, Ramanathapuram, Sivagangai, Theni, Thoothukudi, Tirunelveli and Virudhunagar North: Chennai (metropolitan city), Cuddalore, Kancheepuram, Thiruvallur, Thiruvannamalai, Vellore and Villupuram
The study is mainly based on Census data of the years 2001 and 2011. Other data sources such as NSSO and other time periods are also used wherever necessary to support the arguments. Work is defined by the Census of India (Office of the Registrar General & Census Commissioner, 2011) as participation in any economically productive activity with or without compensation, wages or profit. It even includes part-time help or unpaid work on farm, family enterprise or in any other economic activity. WPR is defined as the percentage of workers to total population of a state or country (Office of the Registrar General & Census Commissioner, 2011, p. 15).
Need of the Study
Tamil Nadu is a highly urbanized and industrialized state. Over a period of time, there has been rapid structural change in the economy. The share of the primary sector in gross state domestic product (GSDP) has been declining and that of the modern sector has been increasing. Structural transformation has been accompanied by changes in the inter-sectoral mobility of labour. There is therefore a need to review the trends and patterns of the FWPR in the state. Further, it has been pointed out that in Tamil Nadu a ‘demographic dividend’ 2 is at its peak at the moment and is expected to last a decade or two (State Planning Commission, 2017).
Structural Changes in the Economy and Women’s Employment
Tamil Nadu’s economy is undergoing structural change. 3 Over time, it has moved from being an economy based on primary activities to tertiary activities. In terms of state income (GSDP 4 ), the share of the primary sector has declined to 9 per cent in 2011–2012. The secondary sector’s share has remained more or less constant at 30 per cent and the tertiary sector share has increased to 61 per cent between 1999–2000 and 2011–2012 (Table 1). The expansion of the tertiary sector implies diversification of the state economy and with it a shift of labour from the non-service sector to the service sector.
Sectoral Composition of GSDP and Women Workers in Tamil Nadu
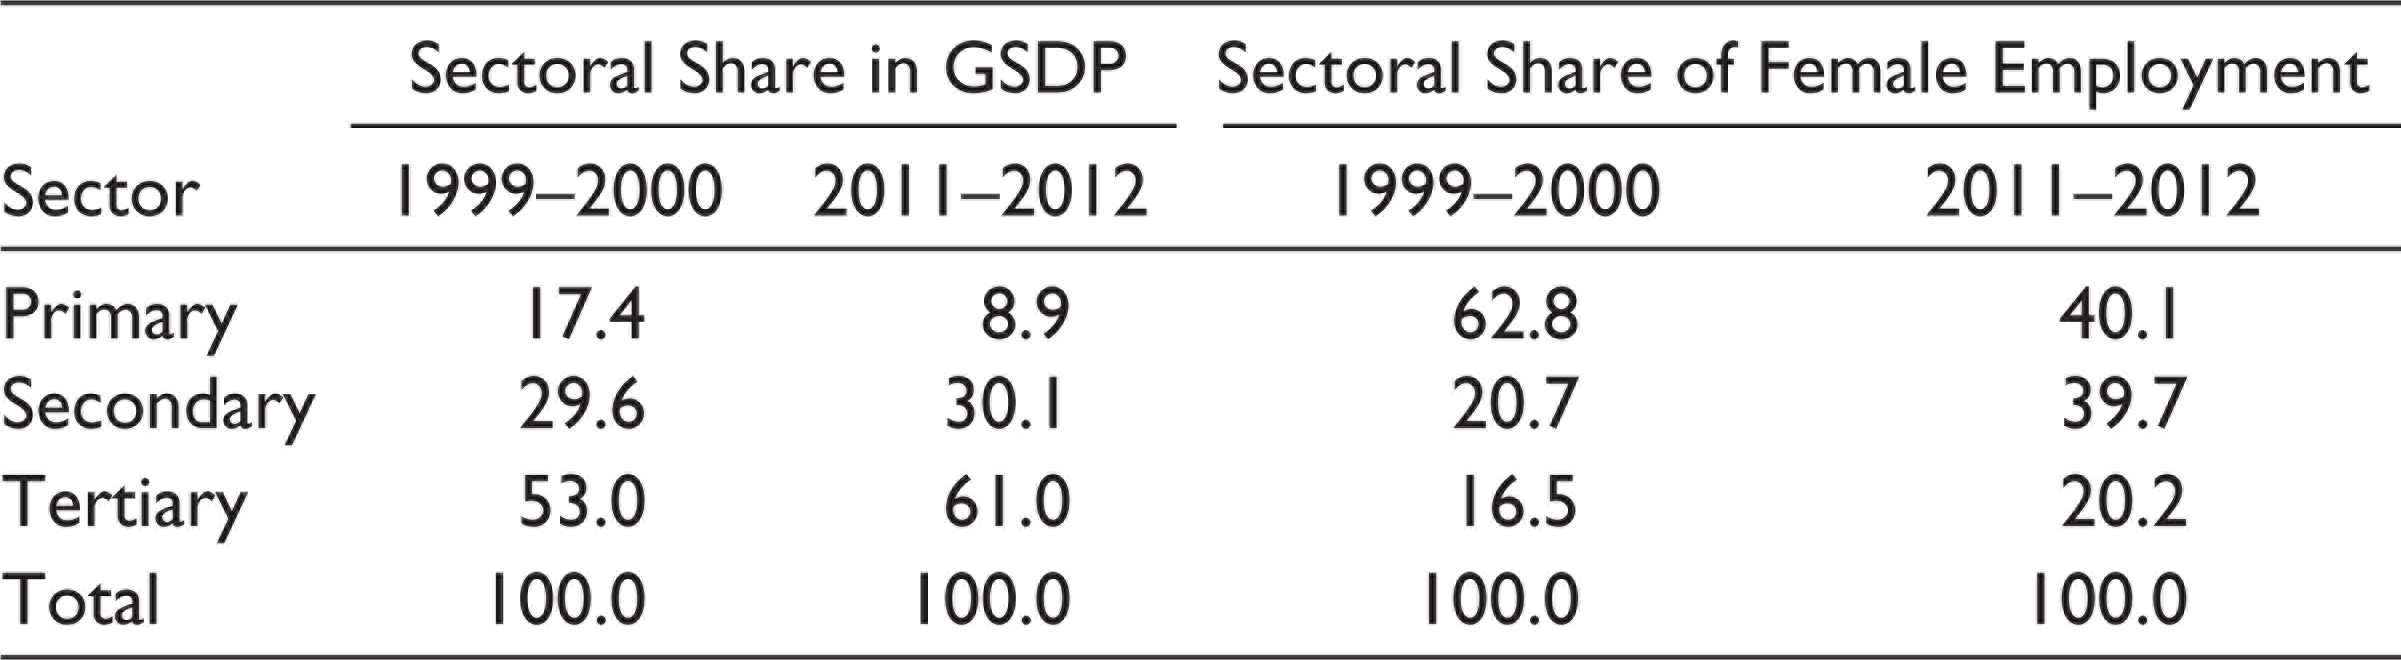
Looking at female employment across sectors, it is seen that the share of the primary sector in total female employment has dropped by 22.7 per cent and the share of the secondary and tertiary sectors have increased by 19 and 3.7 per cent in the decade between 1999–2000 and 2011–2012. Structural changes have brought about inter-sectoral mobility of female labour (Table 1). Women’s participation in agriculture is declining and their employment is increasing in the non-agricultural sectors, partly in non-manufacturing and service sectors. Although the contribution of the primary sector to state income has declined significantly, it is still the major contributor to female employment in the state.
Occupational Segregation
Occupational segregation refers to the disproportionate concentration of the workforce in particular activities. The Census of India (Office of the Registrar General & Census Commissioner, 2011) classifies workers into four groups such as cultivators, 5 agricultural labourers, 6 household industries 7 and other workers. 8 A look at the occupational structure in the state as a whole in Tamil Nadu indicates that the largest proportion of women workers are engaged in agriculture followed by their presence in the category of ‘other workers’. Discussed below is the distribution of women workers in these main sectors.
Agriculture
As Labourers
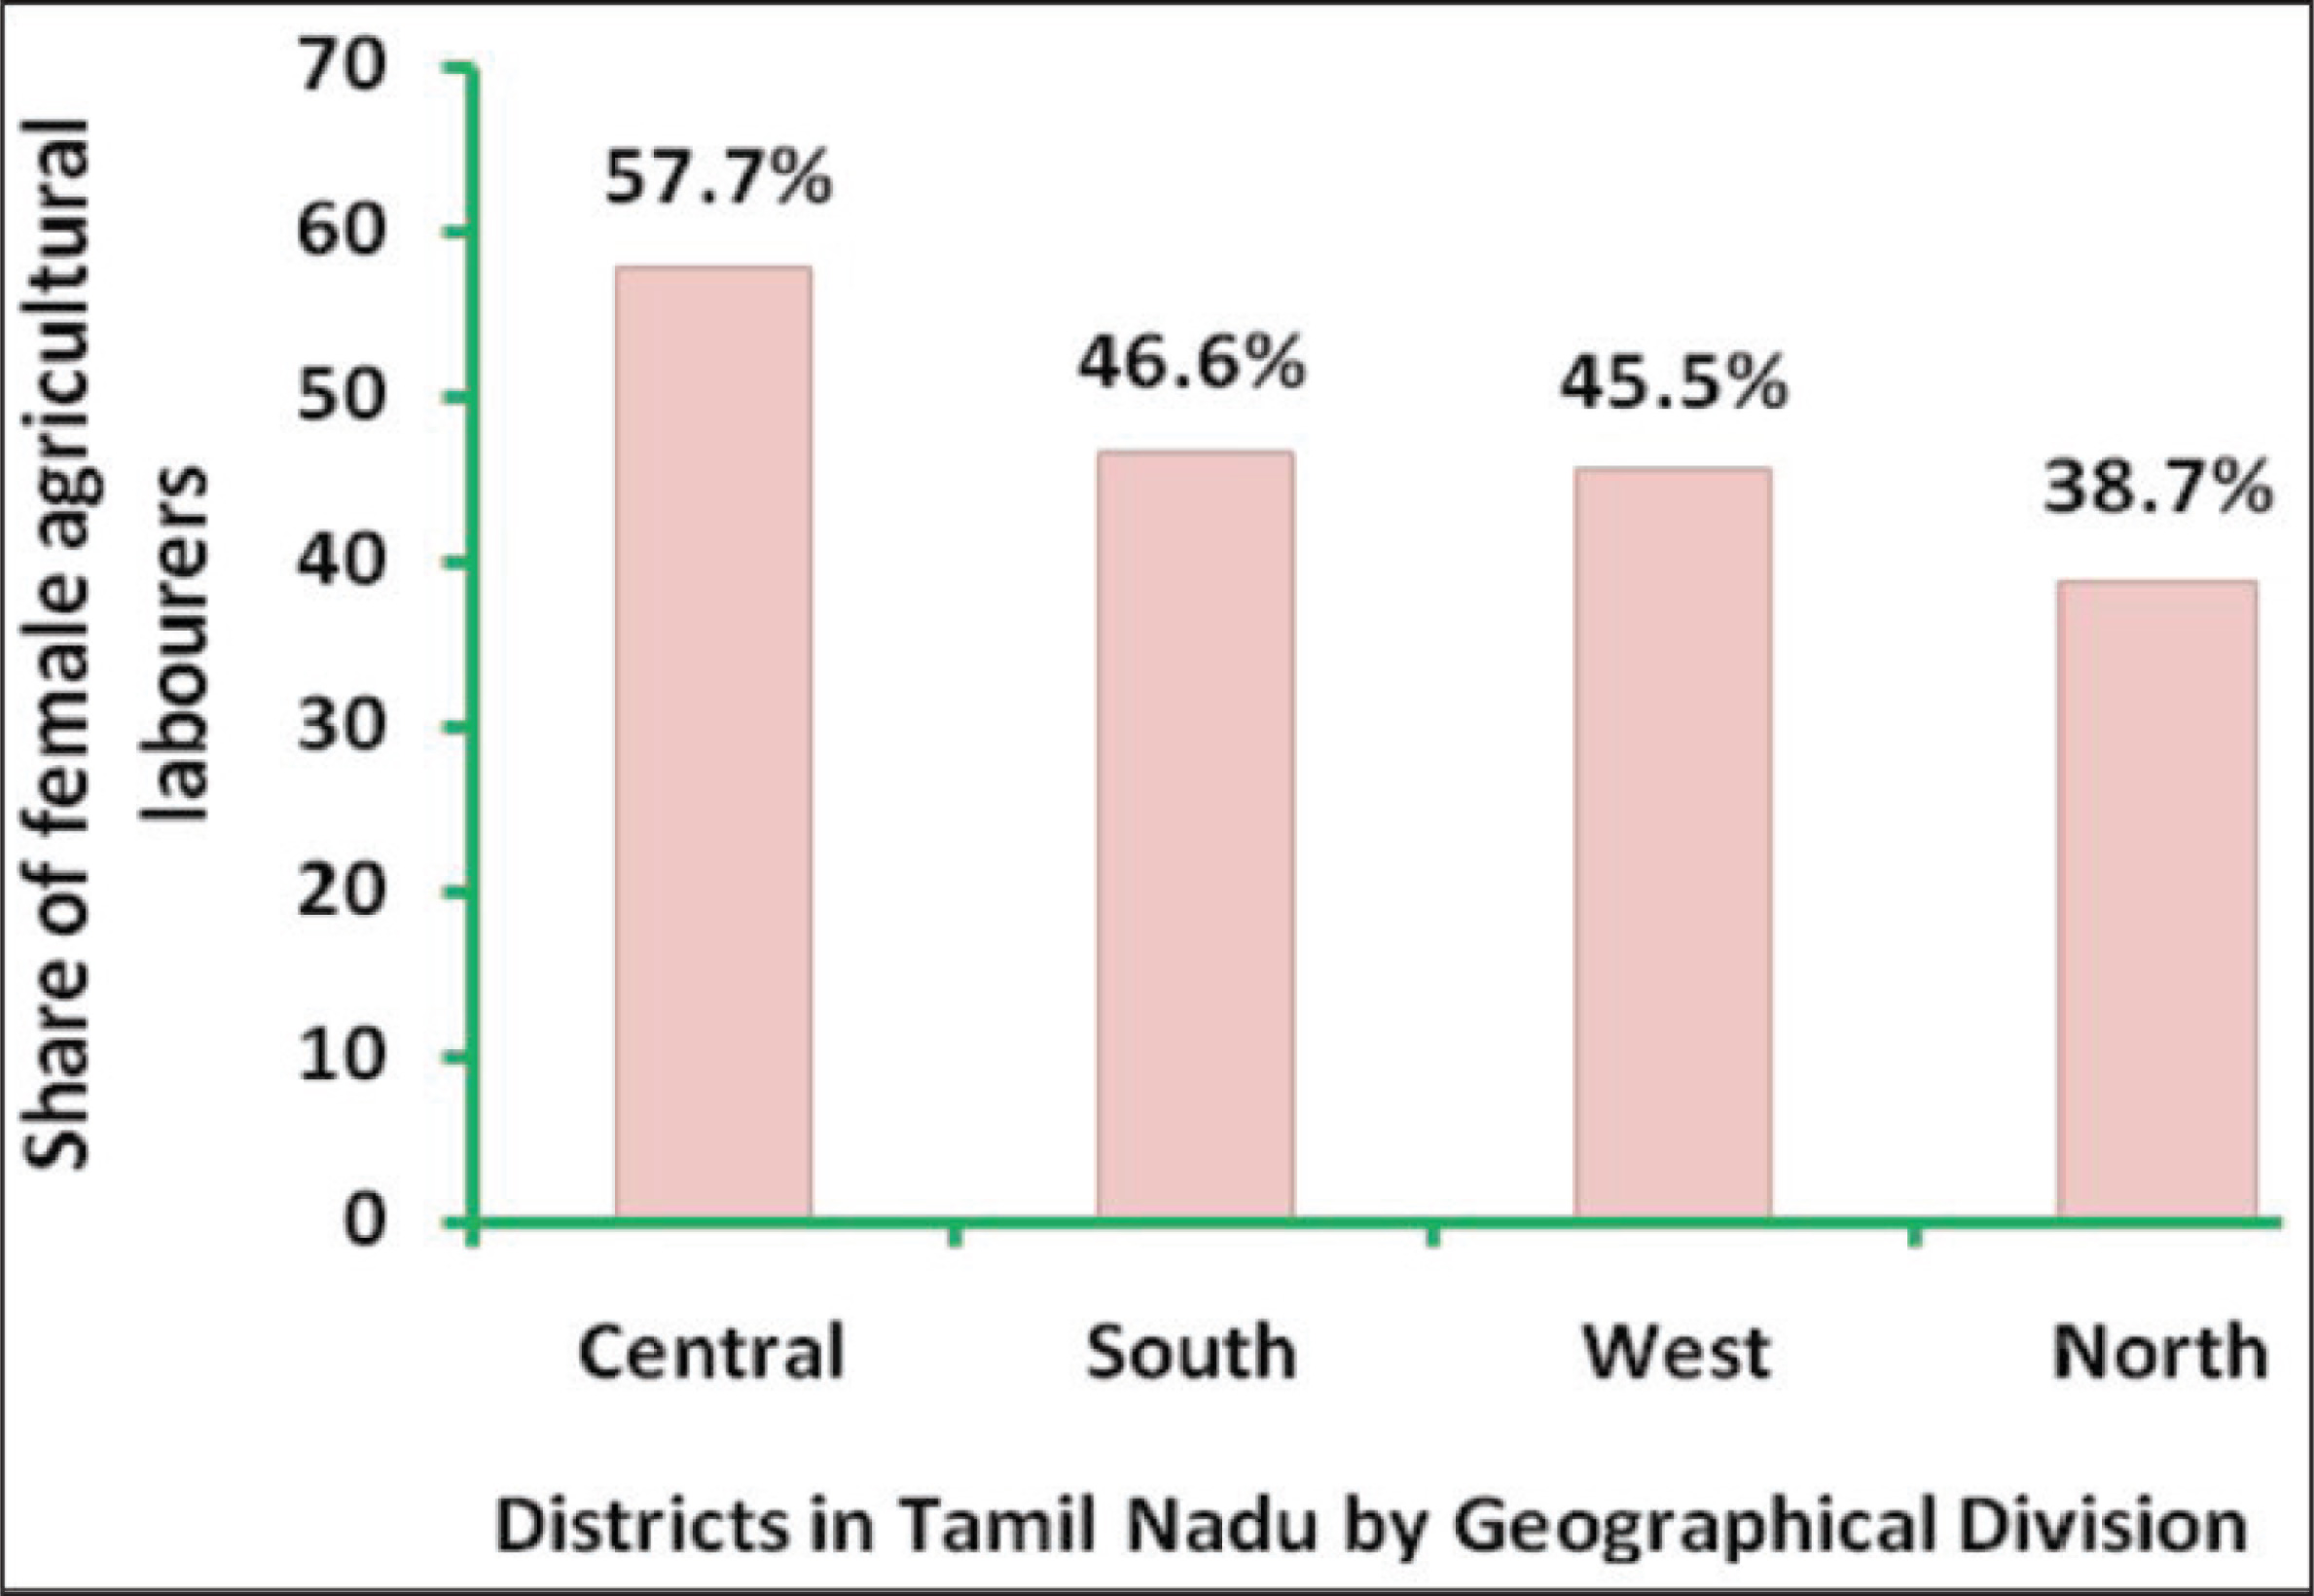
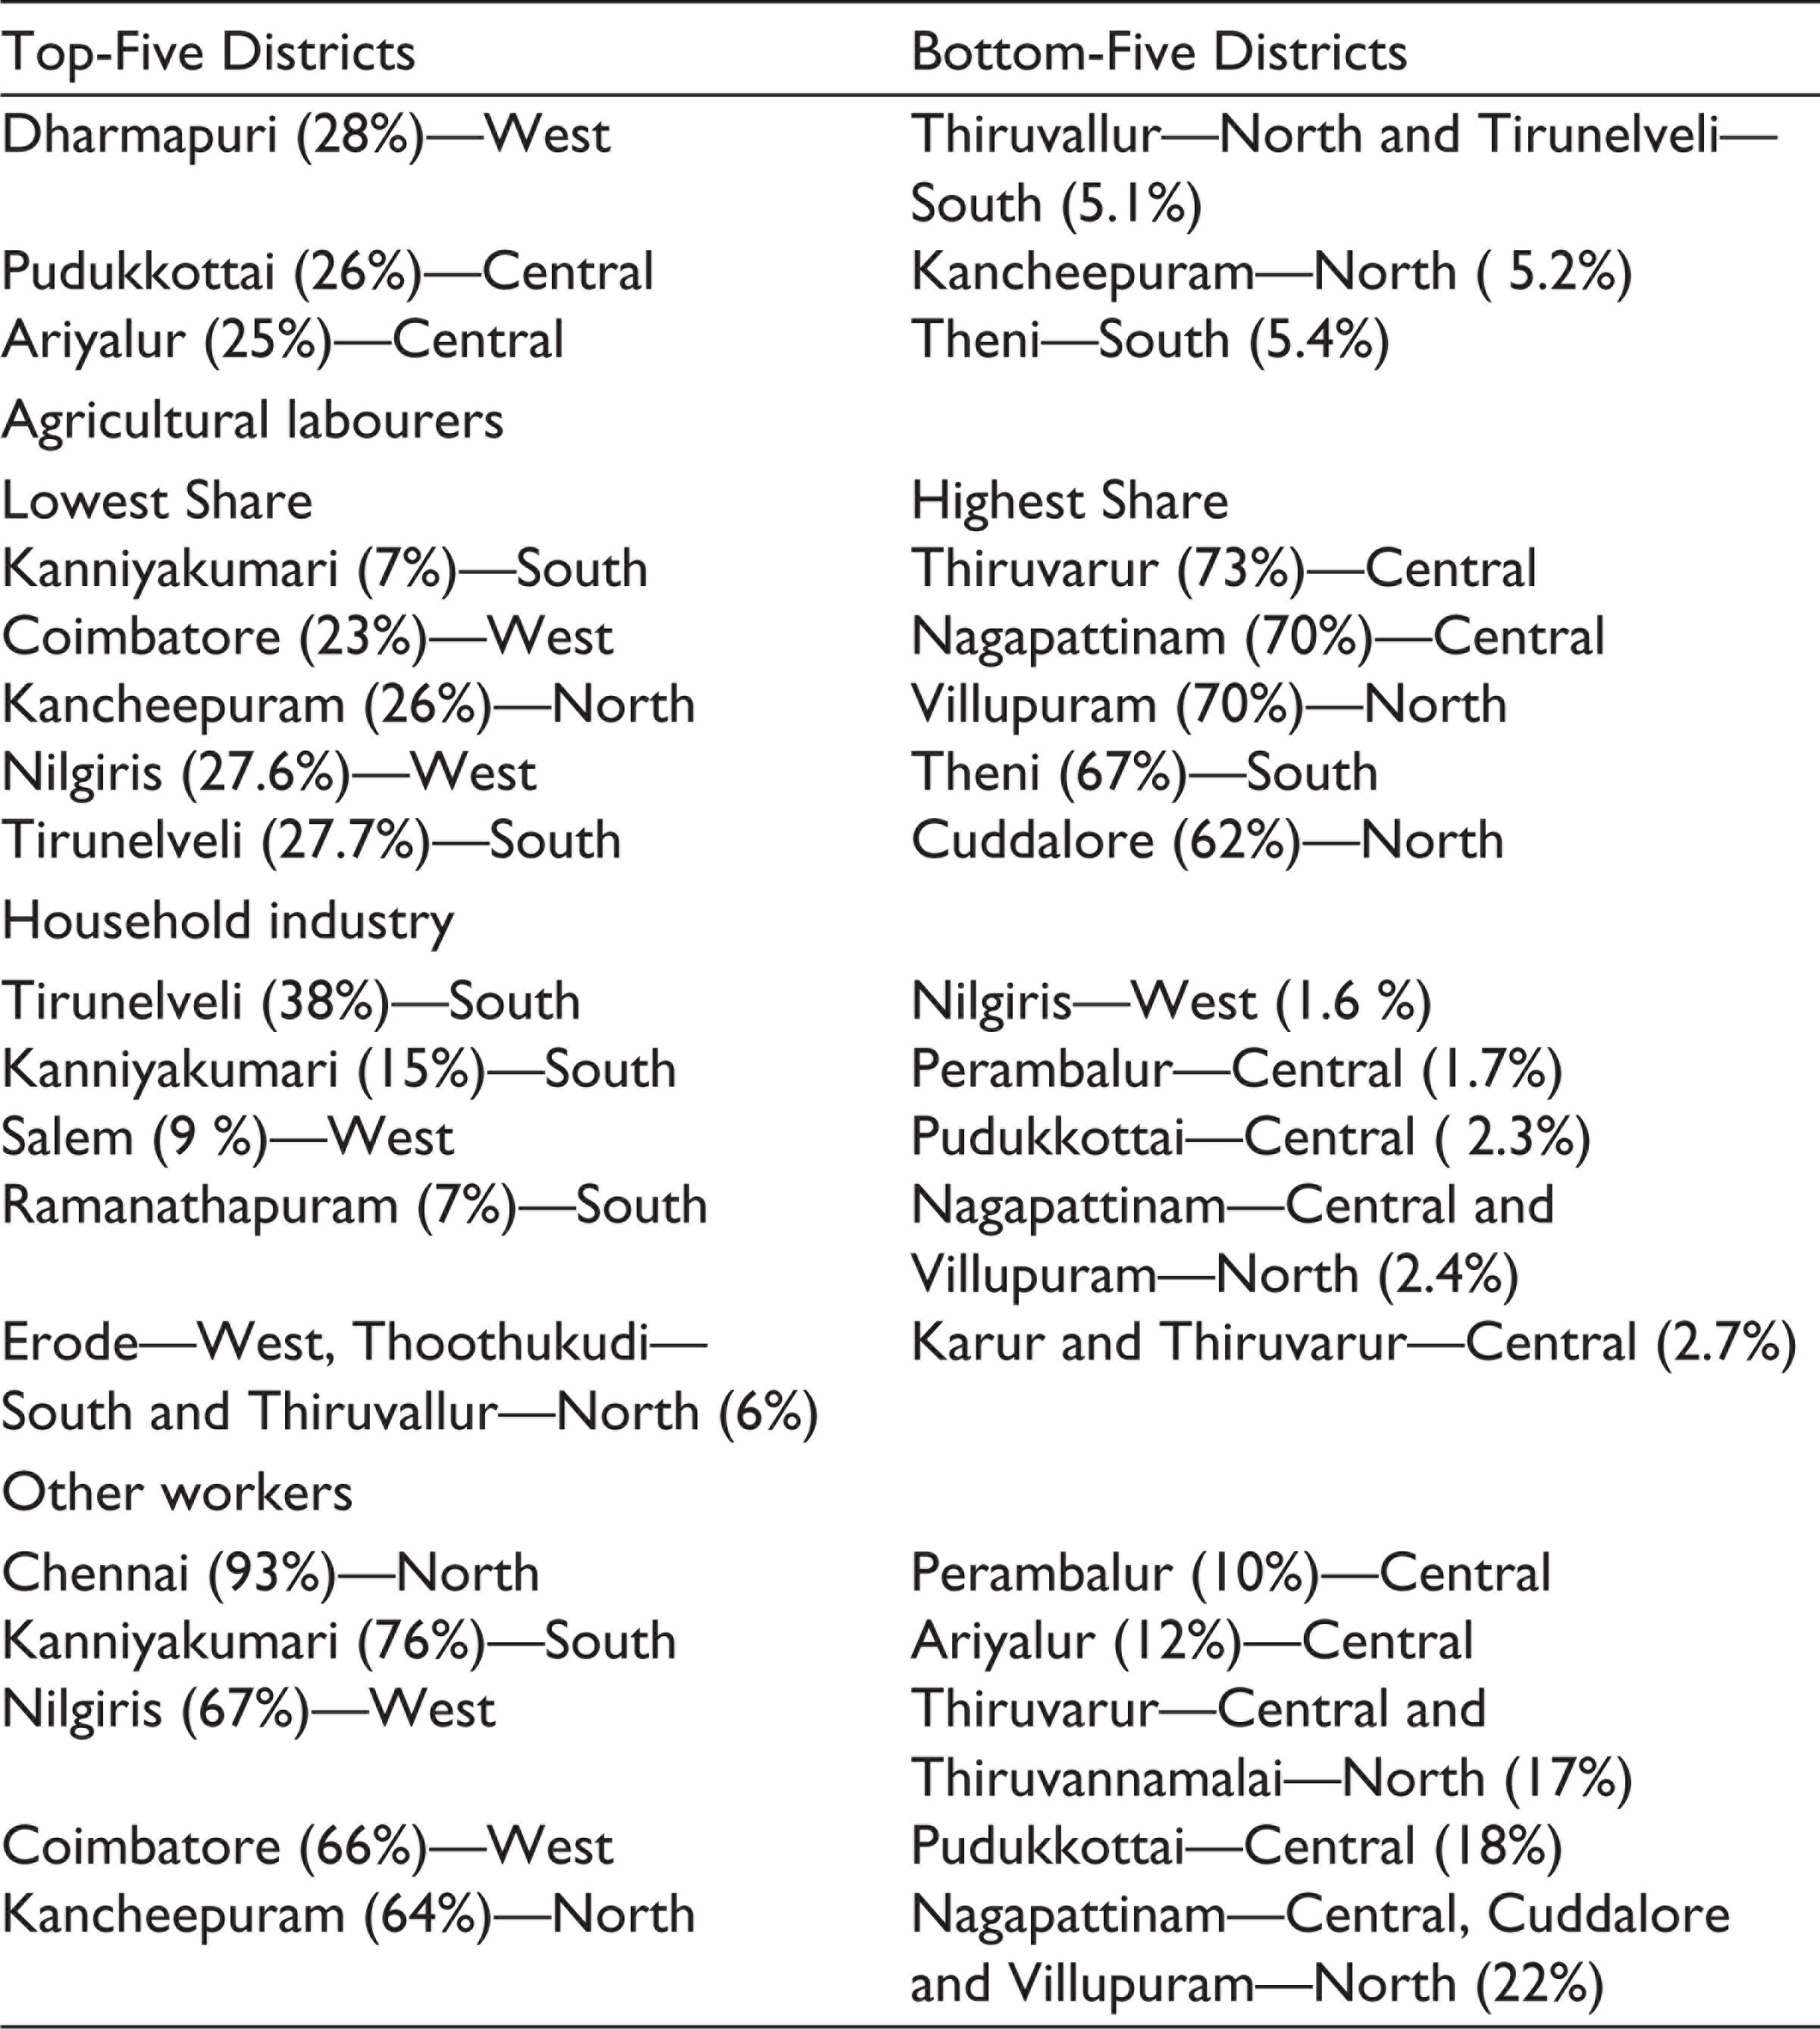
In the state as a whole, 55 per cent of women are engaged in agriculture (42% labourers and 13% cultivators) and the rest in non-agricultural activities. In agro-based districts such as Ariyalur, Perambalur, Thiruvarur, Pudukkottai, Dharmapuri, Ramanathapuram, Theni, Cuddalore, Thiruvannamalai and Villupuram more than 70 to 80 per cent of women’s employment is in agriculture. In the central districts, nearly two-thirds of women are dependent on employment in this sector and there is overcrowding of women as wage labourers (58%) compared to districts in other regions of Tamil Nadu where the percentage of women workers in agriculture as labourers varies between 39 and 47 per cent (Figure 1). Poor and backward districts like Nagapattinam, Thiruvarur and Villupuram account for a major share of women workers (more than 70%) as agricultural labourers in total female employment. Comparing the 2001 and 2011 Census data (Office of the Registrar General & Census Commissioner, 2001, 2011), we see that in 12 districts there is a rise in the number of female agricultural labourers and in other districts it has actually fallen. Industrially well-developed districts such as Coimbatore register the largest decline in female agricultural labourers by 10–18 per cent as women are now largely absorbed by the industrial and service sectors. On the whole, the share of agriculture in women’s employment declined by 9 per cent in the state during the decade studied.
As Cultivators
In the state as a whole, the share of female cultivators and agricultural labourers in total female employment has dropped by about 6 and 3 percentage points, respectively, during 2001–2011. Comparing the statistics for 2001 and 2011, it is seen that female cultivators declined by 0.33 million and female agricultural labourers have increased by 0.39 million in absolute terms. Similarly, in the case of male workers, it is noted that male cultivators declined by 0.53 million during 2001 and 2011 and male agricultural workers have simultaneously increased by 0.58 million. The changes clearly indicate that self-employment in agriculture is shrinking and wage employment is increasing in rural Tamil Nadu.
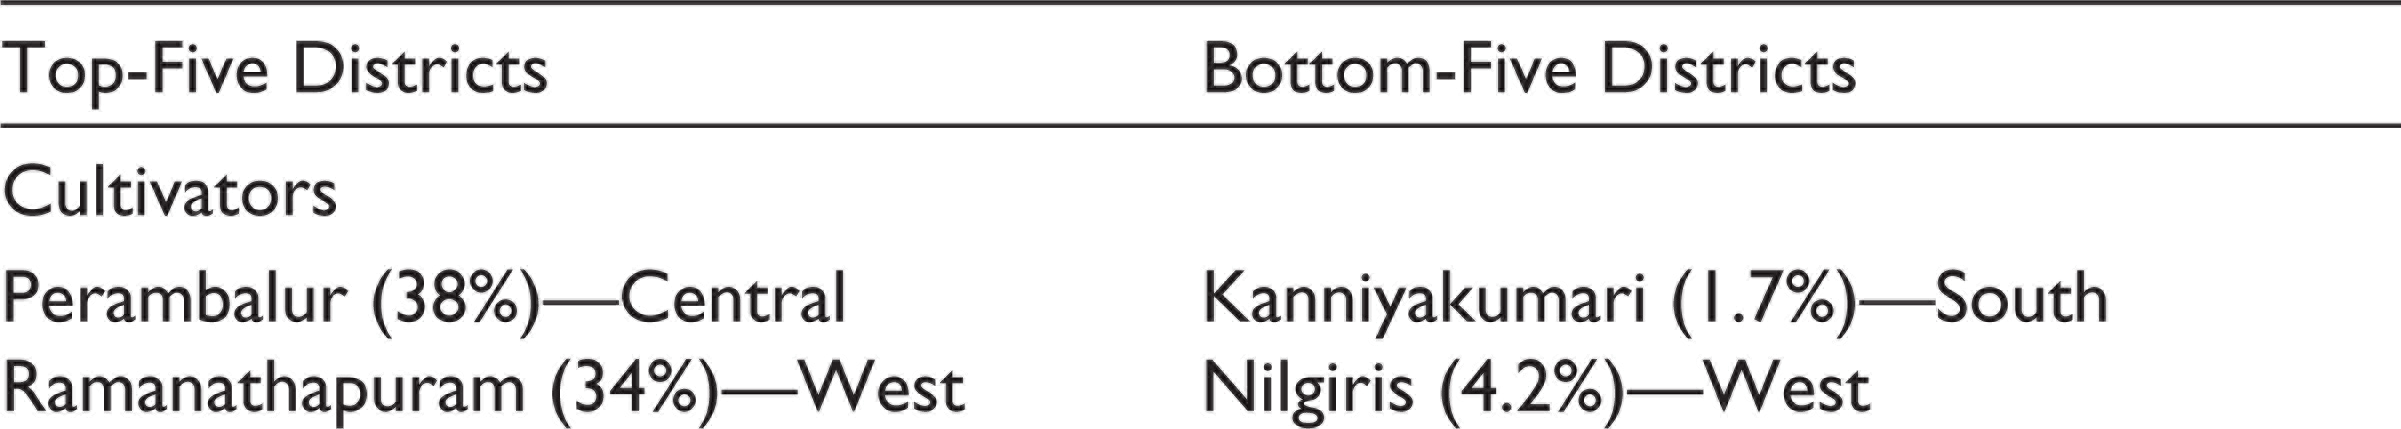
A comparison of 2001 Census data with 2011 data shows that women cultivators have declined in almost all districts of the state with the exception of Nilgiris and Ariyalur districts. The fall in the cultivator group is highest in Villupuram district (20%). A study of district data indicates that Perambalur district has the largest proportion of women cultivators (38%) and the least proportion is noticed in Kanniyakumari district (2%).
Non-agricultural Sectors
A positive noticeable trend is that all districts of the state with the exception of Nilgiris and Thoothukudi show a rising trend in women’s share of employment in the non-agricultural segment over the period 2001–2011. In the developed and moderately developed districts, more than 60 per cent of women workers do non-agricultural work.
Household Industries
There has been a decline in the share of women workers by 1.9 per cent and also in the absolute number of women workers (0.08 million) in household industry With the exception of Nilgiris district, all the districts in the state show a fall in the proportion of women workers engaged in this type of work in the decade 2001–2011. The southern districts of Tirunelveli and Thoothukudi exhibit the highest decline of more than 9 per cent. Yet, Tirunelveli district in south Tamil Nadu displays the highest proportion of women workers employed in household industries (38%).
Household industrial activity varies from district to district and is based largely on local resources. Southern districts of Tamil Nadu such as Tirunelveli and Kanniyakumari (a coastal district) account for large scale home production. The activities include beedi rolling, mat weaving, mud pot manufacture, making palmyra products, sea weed cultivation, seafood processing, pearl oyster culture, cashew nut processing, jewellery production, bamboo basket weaving, and local manufacture of coir products, toys, seat covers, room dividers made out of sea shells and corals and so on.
‘Other’ Workers
The ‘other’ worker category shows a dramatic increase in the absolute number of women workers (1.7 million), by a share of 10 per cent during the decade 2001–2011. Chennai, the metropolitan city, accounts for more than 90 per cent of women’s employment in the ‘other worker’ category. Over time, all the districts, with the exception of Nilgiris district, show an increase of women workers in this segment. If the occupational groupings in the non-agricultural segment are broken up into smaller components, one can see that despite an increase in the share of industrial employment, the share of women workers has primarily risen in the construction sector that falls under the ‘non-manufacturing’ group. About 16 per cent of women workers in Tamil Nadu are employed in the construction sector (NSSO, 2011–2012).
Table 2 presents the top-five and bottom-five districts in Tamil Nadu in terms of classification of women workers.
Percentage Share of Women Workers by Fourfold Industrial Classification: Top-Five and Bottom-Five Districts in Tamil Nadu
FWP in the Districts of Tamil Nadu
FWPR has increased very marginally from 31.5 per cent in 2001 to 31.8 per cent in 2011. Among the districts, large variations are noted in both the years. An inter-district analysis of 2011 Census data shows that Perambalur district had the highest percentage of women in the labour market (48%) and Kanniyakumari district the least (16%).
FWPR by geographical division of districts indicates that the districts in the west on average show a high participation rate of 37 per cent and the lowest in the districts of North Tamil Nadu (30%). The highest FWPR is observed in Perambalur district of the central group of districts (48%), Namakkal district in the west (43%), Dindigul district in the south (41%) and Thiruvannamalai district in the north (41%). These districts are primarily agro-based districts with low levels of per capita income. Perambalur district is the poorest district in the state and stands second among the bottom five districts ranked on the basis of per capita income. Lowest FWPR is seen in the developed districts of the state, namely, Coimbatore district in west Tamil Nadu, Kanniyakumari in the south and Chennai, Thiruvallur and Kancheepuram districts in north Tamil Nadu. These districts are well developed in terms of urbanization, industrialization and per capita income.
Rural–Urban Gap in FWPR
Invariably, and on the whole, in all the districts of the state, FWPR is relatively higher in rural than urban areas making it explicit that the pressure to take up paid work is greater in rural areas. Further, in rural areas there is scope for women to work on the family farm and allied activities and also in non-farm household enterprises. This accounts for higher participation. Yet rural FWPR has remained almost stagnant, dropping by 0.2 percentage points from 41.4 per cent in 2001 to 41.2 per cent in 2011.
Although the urban FWPR in 2011 is still low (21.8%), it has increased from 18.9 per cent in 2001. Overall employment opportunities are shrinking in rural and expanding in urban areas for women. Districts in west Tamil Nadu account for the highest rural and urban labour force participation of women followed by the southern districts. The prime reason for this trend is that most districts in west Tamil Nadu such as Coimbatore, Erode, Salem and Tiruppur have well developed female labour-oriented industries, particularly those dealing with textiles and apparel. In the southern districts of Tamil Nadu particularly in Tirunelveli and Virudhunagar, small-scale and household industries (fireworks, tobacco products, palmyra products, food processing, etc.) are larger in number and hence women’s WPR is relatively better in south Tamil Nadu. Industrial development of districts in north Tamil Nadu such as Chennai, Kancheepuram and Thiruvallur are automobile based and so the absorption capacity of female labour in these industries is much less.
Changing Trends in FWPR across Districts
A comparison of 2001 and 2011 data on FWPR in the districts of Tamil Nadu reveals the following:
FWPR declined in almost all districts of the state. However a few districts show a rising trend in FWPR, with Chennai accounting for the largest increase of 6 percentage points during the decade followed by Thiruvallur district (4 percentage points). The increase in FWPR in these two districts may be attributed to the expansion of the tertiary sector. The information-technology-enabled services (IT-ITES) sector is the major driver of job opportunities for women in services ranging from customer care, call centres, medical transcription, web sales/marketing and back-office operations such as accounting, data processing and data mining. As in 2001, in 2011 too Perambalur district of central Tamil Nadu recorded the highest rate of FWP (49.7%) and the least FWPR of 13 per cent was found in Kanniyakumari district of south Tamil Nadu. Region-wise analysis shows that in western Tamil Nadu, FWPR has increased marginally by one percentage point in Dharmapuri, Salem and Niligiris and has fallen marginally by less than one percentage point in Coimbatore and Erode districts. Namakkal is the only district in the west that shows a sharp decline in FWPR by about 5 percentage points between 2001 and 2011. Districts in the south, namely, Thoothukudi, Tirunelveli and Virudhunagar, display a fall in FWPR by about 3 percentage points. In the central region, with the exclusion of Nagapattinam and Pudukkottai districts, in all other districts there was a decline in FWPR during the decade 2001–2011 which varied between 1 and 3 percentage points. Northern districts exhibit a different pattern—in all the seven districts the FWPR has actually increased. Thus out of 30 districts, the FWPR rate has registered an increase in 14 districts resulting in an overall increase of 0.3 percentage points for the state which is a negligible increase for a decade.
Looking at rural/urban components of FWPR across districts, it can be seen that in 26 out of 30 districts, FWPR of women in urban areas has increased in the decade (2001–2011). Contrary to this trend, in 16 districts out of 30, FWPR in rural areas has actually declined. Thus the increase in women’s employment in urban areas has been offset by the simultaneous decline in women’s employment in the rural sector; this has maintained the level of overall stagnation of women’s employment in Tamil Nadu during the decade.
In 2001, in 8 out of 30 districts, the FWPR was above 40 per cent and in 7 districts it ranged between 35 and 40 per cent. Only in two districts, Kanniyakumari and Chennai, was the FWPR less than 15 per cent. In 2011, while no district was found with FWPR of less than 15 per cent, the number of districts with more than 40 per cent of FWPR had declined from eight to six. Overall, the range of FWPR across districts does not show any remarkable improvement over the decade 2001–2011 as in nearly 50 per cent of the districts, FWPR is below 35 per cent.
Male–Female Gap in WPR
The gender gap is found to be the highest in Kanniyakumari district in south Tamil Nadu (40%) and in Chennai, the state capital located in north Tamil Nadu (39%). The lowest gender gap of 9 percentage points is seen in Perambalur district of central Tamil Nadu. While the gender gap in WPR in urban areas of all districts varies between 28 and 41 per cent, in rural areas it ranges between 5 and 30 per cent with the exception of Kanniyakumari district where the rural gender gap in WPR is as high as 39 per cent. On the whole, the gender gap in Kanniyakumari district is consistently high in both urban and rural areas.
In Tamil Nadu, rural areas display a lower gender gap in WPR than the urban areas. In fact the gender gap in urban areas is almost double the size of the gender gap found in rural areas. The northern districts show a higher gender gap in WPR both in rural and urban areas due to poor FWPR especially in the districts of Thiruvallur, Kancheepuram and Chennai.
The overall trend and pattern observed is that the gender gap in WPR is lower (<20 percentage points) in the poor and backward districts such as Perambalur, Thiruvannamalai, Villupuram, Dharmapuri and Ariyalur and higher (>35 percentage points) in urbanized and industrialized districts such as Chennai, Coimbatore, Thiruvallur and Kanniyakumari. The gender gap in WPR has increased by one percentage point for the state as a whole during the decade (2001–2011), with the majority of districts displaying an increase in the male/female gap in WPR.
Factors Explaining Variations in FWPR
Inter-district variability in FWPR may be explained with the help of the following factors:
Level of development of the district Sectoral contribution to gross district domestic product (GDDP) Per capita income Standard of living Female literacy Unemployment rate
District-level Development
District-level development is measured in terms of GDDP. 9 More than one-third of the contribution to GSDP (state income) is by the northern districts (34%), followed by the districts in the west (27%) and south (25%).The well-developed industrial districts such as Coimbatore (called the Manchester of South India), Kancheepuram and Thiruvallur account for more than 6 per cent share in GSDP. Chennai (known as the Detroit of India) with its large service sector and industries contributes the maximum of 7 per cent to GSDP.
The share of all the agricultural districts in the central region to GSDP is the least (14%). Pudukkottai, Nagapattinam, Thiruvarur, Thanjavur and Tiruchirappalli in the central region are the main agricultural districts in the Cauvery delta region. Dharmapuri, Salem, Namakkal and Nilgiris districts in the west, Dindigul, Ramanathapuram, Sivagangai and Theni districts in the south and Villupuram, Thiruvannamalai and Cuddalore districts of north Tamil Nadu are also predominantly agricultural districts. Except Tiruchirappalli and Salem all the other agro-based districts including Thanjavur (granary of the South) are economically backward and the incidence of poverty is relatively higher in these districts 10 which is the chief cause of women’s entry into the agricultural labour market.
There has been significant growth in district income (GDDP) by 7.72 per cent but there is no corresponding improvement in FWPR which has increased just by 0.09 per cent during the decade (2001–2011). The correlation coefficient between FWPR and GDDP is negative (r = −0.5) and is also found to be significant at one per cent level. This calls into question whether economic development has a negative impact on women’s participation in the labour market.
Sectoral Contribution to GDDP
A study of sectoral contributions to the GDDP reveals that in agricultural districts the primary sector’s share in GDDP is significant and is over 30 per cent. Most districts are economically poor owing to dependency on the primary sector for employment and income which perpetuates the vicious circle of poverty. Women in agriculture, largely labourers, are paid the least, their employment and income are highly unstable owing to the casual nature of employment and also because of the dependence of agriculture on the monsoon. Lack of non-farm employment worsens the situation of rural women. Debt at high rates of interest adds to the poverty of rural labour households (The daily wage of female workers in Tamil Nadu: Agriculture— Rs.93.71, construction work— Rs.142.99 and other casual works—Rs.110.41). 11 In urbanized and industrialized districts such as Chennai, Kanniyakumari, Kancheepuram, Thiruvallur, Virudhunagar and Coimbatore, the manufacturing and tertiary sectors contribute a high percentage to district income, and the primary sector’s contribution is insignificant. The share of the secondary sector to GDDP ranges between 38 and 52 per cent among the developed districts and is less than 14 per cent in backward districts. The tertiary sector’s contribution to GDDP varies between 50 and 70 per cent in industrially developed districts.
A positive correlation coefficient is seen between the proportion of primary sector contribution to GDDP and FWPR (r = 0.5) and is also statistically significant at 1 per cent level. A similar trend of positive correlation coefficient is noted in the case of FWPR and the number of women employed in the agricultural sector, which means that districts which account for higher participation of women in agriculture are the ones that display higher levels of FWPR. Higher WPR of women in agro based and poor districts raises the question whether women enter the labour market only under economic distress and exit when the situation improves.
Per Capita Income
Household income is another important supply side factor determining FWPR. As data on household income is not available, per capita income is used as a proxy to explain the inter-district variability in FWPR. Kanniyakumari district ranks first in per capita income but it records the lowest FWPR in the state. Apart from this district, the lowest FWPRs of less than 25 per cent are seen in Chennai, Kancheepuram, Thiruvallur, Thanjavur, and Madurai districts. (While Kancheepuram district stands second among the top-five districts in terms of per capita income, Thiruvallur district occupies the fifth and last position). The results suggest a negative correlation between per capita income and FWPR (r = −0.39) which is significant at 5 per cent level. Why there is a negative income effect on women’s labour market participation needs to be examined.
Standard of Living
Standard of living 12 is another important factor that may explain the inter-district variability in FWPR. The results suggest a negative correlation between standard of living and FWPR (r = –0.38) which is significant at 5 per cent level.. Thus the results indicate that the higher the standard of living, the lower the participation of women in paid work. It is interesting to note here that the districts that were ranked as the top five and bottom five in terms of per capita income are the ones that come within the top five and bottom five in terms of the standard of living index. This suggests that the higher the per capita income, the higher the standard of living alongside lower FWPR.
Female Literacy
Education is also an important factor which determines the supply of female labour. The literacy rate of females in Tamil Nadu has improved remarkably from 64 per cent in 2001 to 73 per cent in 2011. Except Kanniyakumari district, in all other districts of the state, female literacy has increased by 6 percentage points during 2001–2011, and FWPR has increased by 0.3 percentage points in the state. Analysing the top five and bottom five districts in terms of female literacy, it is to be inferred that economically developed districts such as Kanniyakumari, Chennai, Kancheepuram and Thiruvallur are also socially well developed in terms of literacy. In poor and backward districts such as Ariyalur, Perambalur, Villupuram and Thiruvannamalai female literacy is much below the state’s level of 73 per cent.
Despite a rise in female literacy in the state by 9 percentage points in the decade, FWP has actually declined by more than three percentage points in districts such as Ariyalur, Karur, Erode, Namakkal and Virudhunagar. While female literacy in Kanniyakumari district increased by five percentage points, FWPR has increased by 3 percentage points, indicating a positive association between education and FWPR. On the whole, there is an invariable increase in the female literacy rate in all the districts of the state but at the same time there is also a reduction in the proportion of female workers in more than half the number of districts. The correlation coefficient between female literacy and female WPR for the state of Tamil Nadu is not only negative (r = –0.8) but is also significant at 1 per cent. Overall in rural areas there is a downward movement and in urban areas there is no significant improvement in FWPR with expansion of education. This leads to the question: Why with more education there are fewer women in the labour market?
Unemployment Rate
Lack of employment opportunities is one of the main reasons for the declining trend in rural women’s employment in the country (Ramesh & Srivastava, 2014). Rural women’s work participation has actually declined by 0.2 percentage points in Tamil Nadu during the decade 2001–2011. An examination of NSSO data on unemployment for the period 1999–2000 and 2011–2012 reveals that unemployment has increased for rural women by 3 percentage points and has declined by 0.7 percentage points among urban women. With the declining share of the primary sector in GSDP employment is also declining in the rural sector. Unemployment statistics support the argument that the drop in female employment in rural areas is primarily due to lack of non-farm jobs. The increase in rural unemployment among women workers is surprising in the context of the successful implementation of MGNREGA in Tamil Nadu since 2006 with women’s participation as high as 82 per cent in the scheme (Department of Rural Development, 2014).
District-wise analysis of female unemployment data indicates that Kanniyakumari district shows the highest rate of female unemployment (21%) followed by Chennai (16.8%). These two districts account for the least female WPR in the state. So it may be inferred that unemployment may also be one of the reasons for lower FWP in these districts. An inverse relationship is seen between FWPR and female unemployment rate (r = –0.61 ) which is significant at one per cent level. Why structural transformation of the economy has failed to generate sufficient employment opportunities for women in both developed and backward districts of the state requires serious investigation.
Main Findings from District Data on FWPR: A Summary
There is a wide range of FWPR across districts in Tamil Nadu. Districts in the west and central Tamil Nadu show higher participation rates of women than the districts in south and north Tamil Nadu. Factors such as the size of district income, the share of sectoral contribution to district income, per capita income, standard of living, female literacy and unemployment rate account for the variations in FWPR across the districts.
Rural areas display higher FWPR than the urban areas in all districts of the state. With the declining share of the primary sector in state/district income, there has been a shift in female employment out of agriculture but FWP in Tamil Nadu is still relatively higher in predominantly agricultural, poor and industrially backward districts and is low in developed districts with higher levels of per capita income, female literacy and unemployment. The gender gap in WPR is higher in urban than rural areas and the gap is rising. Rural Tamil Nadu is also experiencing a drop in female employment owing to lack of non-farm jobs.
Higher literacy rates along with an increase in per capita income are not associated with women’s employment in the state.
Conclusions
Overall, there has been no improvement in women’s employment in Tamil Nadu in the decade studied (2001–2011) despite a rise in state GDP/per capita income, increase in female literacy and decline in fertility rates. 13 Structural changes in the Tamil Nadu economy have not contributed to an increase in women’s employment, and stagnation continues.
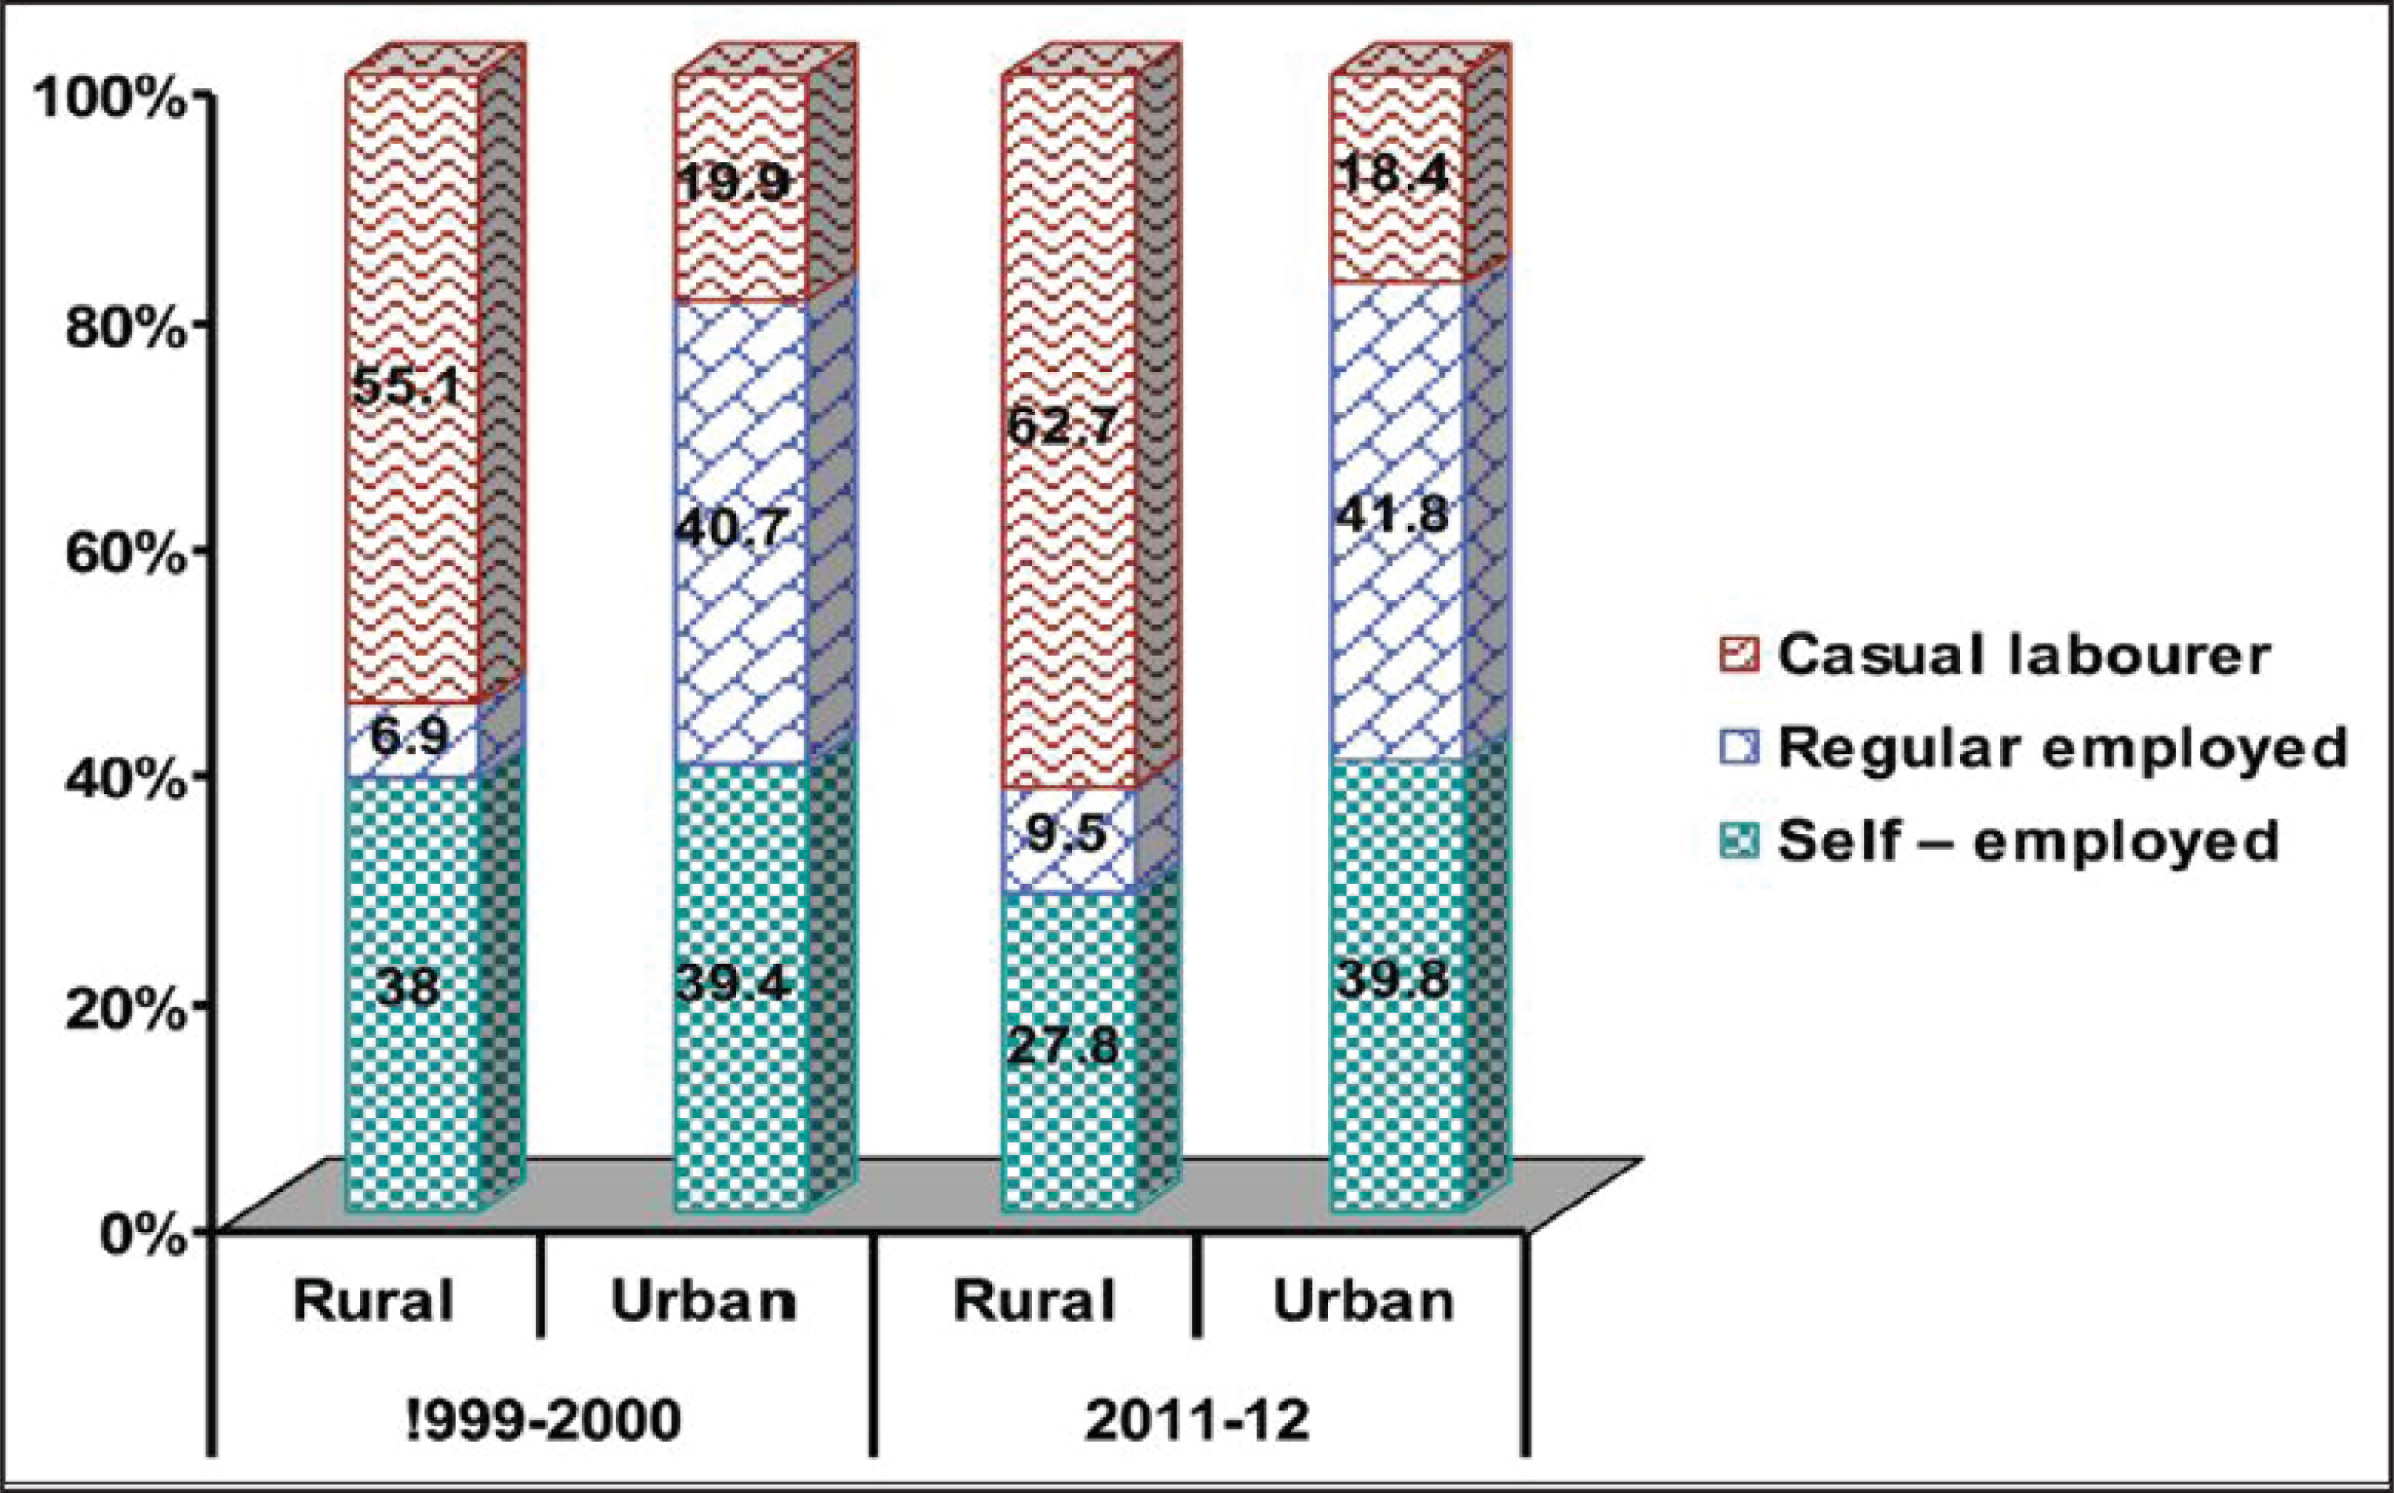
The status of women’s employment is assessed in terms of regularity of employment and income. A comparison of NSS data for 2011–2012 with NSS estimates for 1999–2000, reveals that on the one hand there is an increase in regular wage/salaried employment of women workers in urban areas and on the other, there is an increase in casual labour among women workers in rural areas from 55 to 63 per cent (Figure 2). A similar trend is noticed in the case of rural male workers. This implies that self-employment for both men and women is shrinking in rural areas. In terms of numbers, the FWPR is relatively higher in poorer districts than the developed ones. In terms of quality, the casual labour segment is expanding in rural areas at the cost of self-employment. The incidence of poverty is relatively higher among this segment of the working population compared to other segments of the workforce owing to instability in income. The statistics show that only about seven per cent of women in Tamil Nadu are employed in the formal sector implying the poor quality of women’s employment in the state.
In the changing economy, agriculture is becoming unprofitable particularly for small and marginal farmers due to rising input costs and wages, monsoon failure and periodic drought. Competition between agricultural and non-agricultural uses of land is also intensifying, resulting in a significant drop in the area under cultivation. Fall in self-employment has also precipitated large-scale out-migration of male workers. The casual labour segment is expanding, which is a cause for concern. Casualization as a whole has pushed a vast majority of workers who were formerly agricultural labourers, small and marginal farmers and the self-employed into brick-kilns, quarries and construction elsewhere. Conversely, in urban Tamil Nadu, the number of regular wage/salaried workers is rising with reductions in casual wage labour. While the contribution of the secondary sector to state income has increased, there is no corresponding rise in the regular wage/salaried employment in rural areas.
Economic growth based largely on services has resulted in jobless growth. Like the trend found in the national economy, development in Tamil Nadu is led by the service sector (61% contribution to state GDP), but this sector has not been a driver of employment creation for women workers (only 20% of women are employed in this sector). Simultaneously, the manufacturing sector has failed to create sufficient job opportunities for women due to its sluggish growth performance. A significant degree of industrialization is required in the state for job creation.
Interestingly, the data reveals that female work participation is lower in districts where female literacy/educational level is high this appears to imply that a choice is being made by women to stay at home. Job deficits among women educated up to the secondary level on the one hand and the burden of domestic duties on the other could explain this. Even the recent PLFS (Periodic Labour Force Survey, 2017–2018) shows that the number of young girls/women (15–29 years) attending to domestic duties has increased from 45.9 per cent in 2004–2005 to 52.3 per cent in 2017–2018 and the number of women in the productive age group of 30–59 years attending to domestic duties has also increased from 46 per cent in 2004–2005 to 65.4 per cent in 2017–2018. Additionally, PLFS data (2017–2018) shows that women with middle and secondary school education are largely engaged in domestic duties compared to highly educated women. Thus it can be seen that women’s disproportionate share of domestic work has a negative impact on their labour market outcomes at educational levels less than university degrees.
The study finds that negative income effect, lack of suitable jobs for educated women and women’s choice of unpaid domestic to paid work have contributed to lower FWPR. That women even with some education are staying out of the labour market in large numbers is a matter of concern for everyone because from the development perspective it implies wastage and underutilization of human resources, and from the gender standpoint greater workforce participation is crucial for the economic empowerment of women. Employment and earning an income are believed to strengthen women’s decision making power within the household. A fall in the employment of women reduces their leverage and power in the household.
Generation of employment opportunities for women in the manufacturing sector, equal wages for women on par with men and provision of support systems such as childcare are likely to encourage women’s entry into and retention in the workforce at different levels. Awareness programmes and affirmative action policies are also needed to address gender stereotypes. The media can be used as an important platform to break the traditional norms that assign the roles of ‘care giver’ and domestic slave to women and the breadwinner role to men, norms that also devalue the foundational work of women in households.
Footnotes
Declaration of Conflicting Interests
The author declared no potential conflicts of interest with respect to the research, authorship and/or publication of this article.
Funding
This article is based on the research project titled “Structural Changes in the Labour Market and Female Labour Force Participation in India: Theoretical Models, Empirical Evidence and Policy Implications”. My sincere thanks to Indian Council of Social Science Research, New Delhi for the financial support towards this project.