
Abstract
Agricultural researchers work at universities and research institutes. This paper examines how institutional context has affected Kenyan agricultural scientists’ professional lives along several dimensions: Access and use of emerging ICT technologies, professional activities, and scholarly output. It draws upon a unique longitudinal data set in which scientists were interviewed in 2001, 2005, and 2010. The data allow us to follow changes in technology adoption, professional activities, and publications over this critical period of Internet expansion. We found diminishing institutional differences with ICT expansion.
Introduction
RESEARCH AND DISCOVERY requires education, training, information, communications, collaboration and other resources to culminate in academic publications of research findings. Scientists regularly discuss theories, methodologies, findings and research implications with professional colleagues at national and international meetings, through visiting scholar programmes, by exchanging and critiquing scholarly papers, by telephone and through email and online discussion groups. Scientific collaboration predates the rapid spread of the Internet since the late 1990s, but new technologies are shaping the collaboration process. Most scientists today view uninterrupted email and Internet access as a prerequisite for serious academic work.
Global Internet expansion has been widespread but unequal, inspiring many studies on factors driving variation both across and within nations (Ragnedda & Muschert, 2013). Internet access to high quality and relevant information increases productivity and expands the relative power and influence of individuals and institutions (Castells, 1996). Private firms, government agencies, universities and non-profit institutions view the process of continuously upgrading Internet capabilities as a critical part of maintaining or expanding their relative position in society. Connectivity and technical support is expanding everywhere, but unequally. Debates surrounding the digital divide continue over whether connectivity expansion ‘flattens’ (Friedman, 2005) the world by expanding opportunities to more people and places or if information and communications technology (ICT) expansion exacerbates inequality as the core institutions both enjoy even greater access to information and greater benefits from it. Among scientists, strong Internet capabilities are perceived to enhance capabilities, while weak skills may limit future productivity. Overall Internet expansion can be thought of as a global process with national, institutional and individual level variation.
This article utilises data from a unique multi-wave survey of agricultural scientists conducted in Kenya to study changes in access to and use of ICT technologies among Kenyan scientists from 2001 to 2010, as well as professional activities and productivity during the same period. It compares and contrasts Internet expansion over this time period across two institutional settings with an agricultural focus: government research institutes and universities. The objectives are to examine (a) prevailing trends over time and (b) the relationship between institutional type, ICT access and use, professional activities and productivity. In addition, we will discuss implications for the future of agricultural research in Kenya.
Internet Expansion in Africa and Kenya
Internet expansion had reached saturation in some world regions by 2000, but diffusion proceeded more slowly in sub-Saharan Africa due to poor physical and broadband infrastructure (Henten, Falch & Anyimadu, 2004). Some scholars saw this in connection with the ‘digital divide’, an expression that connects technology expansion to the perceived reality of global capitalism that considered Africa unimportant economically, politically and culturally (Fuchs & Horak, 2008). But, the Internet did expand in Africa, slowly and unevenly. Relative to other African nations, the Internet expanded faster in Kenya. Kenyan university faculty had relatively better Internet access both in comparison to other Kenyans and in comparison to faculty at universities in many other African nations (Oyelaran-Oyeyinka & Adeya, 2004) but, overall, access and use still lagged far behind that of other world regions. There were fewer than 6,000 fixed broadband subscriptions in Kenya in 2005 (Table 1), and subscriptions only increased to nearly 7,000 by 2010, representing only 2 in 10,000 inhabitants. Since 2010, Kenyan broadband subscriptions increased ten-fold to nearly 85,000 subscribers, but this still only represents about 2 in 1,000 inhabitants. University faculty and research scientists were among those most likely to have a computer and Internet access.
Internet and Mobile-cellular Expansion in Kenya: 2000–2014

After 2005, mobile telephony expanded rapidly in Africa and quickly became the primary driver of Internet expansion in Africa and in Kenya. Mobile Internet access offered the possibility of ‘leapfrogging’, overcoming the cost and infrastructure barriers posed by broadband connections, and accelerating Internet adoption, use and innovation in Africa. Mobile-cellular subscriptions increased from about 127,000 in 2000 to nearly over 4.6 million by 2005, 25 million by 2010 and 34 million by 2014. Subscription rates ballooned from less than 1 per 200 inhabitants in 2000 to 74 per 100 inhabitants by 2014. Thus the expansion in the percentage on Internet Users, from 0.3 per cent in 2000 to 14 per cent in 2010 and 43.4 per cent by 2014 has been primarily driven by increased connectivity through smartphones beginning sometime after 2005. Although questions remain about the implications of the differences between mobile phone and PC-based Internet access (Napoli & Obar, 2013), the rapid expansion of Internet users has been remarkable. And, mobile-based Internet expansion has led to Kenya-specific innovations such as M-PESA mobile-money transfers that have the potential to revolutionise monetary transfers (Jack, Ray & Suri 2013).
ICT Expansion and Effects: Research Institutes and Universities
Globally, research organisations have varied in the effectiveness of efforts to increase ICT use (Xu, Zhu & Gibbs, 2004). Physical infrastructure, education and training all shape ICT use and its organisational benefits (Warschauer, 2004). ICT use among researchers may be shaped by whether they work in a university or a research institute. Gulbrandsen (2011) describes that research institutes as hybrid organisations that must attend to both academic standards and practical needs, face peculiar administrative challenges including policies for ICT expansion. By contrast, universities have been characterised as having incongruous bureaucratic structures where, despite formalised rules and policies, faculty report a relatively high degree of autonomy in how they go about their work (Bird, 2011). Institutional context might affect ICT adoption, collaboration and productivity among researchers in different ways. Ponds, Van Oort and Frenken (2007) argue that academic collaboration relies less on geographical proximity and, therefore, ICTs should be helpful. By contrast, ICTs may not be as useful for scientists with cross-institutional collaborative ties that demand face-to-face communications.
Overall, ICTs are thought to be critical for socio-economic development, enhanced professional productivity and higher education. ICT adoption may influence both personal and professional activities in many ways. Bollou and Ngwenyama (2008) showed West African nations’ ICT investments in the mid-1990s led to an increase in productivity, but by 2002, the productivity growth rate was declining. ICTs have also been found to enhance productivity of small and medium size enterprises in East Africa (Matambalya & Wolf, 2001) and South Africa (Wolf, 2001). Adam (2003) explores the initiatives of African nations to expand ICT use and effectiveness in their institutions of higher education despite facing many constraints. Using evidence from across African and other parts of the developing world, Obijiofor (2009) reviewed several studies and concluded that there are both perceived and real socio-economic benefits to ICT adoption to both the users and to society because access to information has health benefits, increases economic opportunity and are increasingly seen as useful by more and more members of society.
ICTs have also been considered crucial for both research productivity and dissemination. Howells (1995) found that ICT adoption improved collaborative research productivity and research management within large multinational corporations. More recently, ICTs have been conceptualised as a general-purpose technology that enables further innovation and that the impact of ICTs increases over time (Cardona, Kretschmer & Strobel, 2013). Finally, ICTs have been shown to increase scientific collaboration in Kenya and other nations (Duque, Ynalvez, Sooryamoorthy, Mbatia, Dzorgbo & Shrum, 2005; Sooryamoorthy & Shrum 2007). In Kenya, not only have ICTs shaped collaboration and productivity among researchers in different ways, they have also affected dissemination of research findings through agricultural extension. Thus, ICTs have been found to be instrumental in increasing agricultural yields (Asenso-Okyere & Mekonnen, 2012; Casaburi, Krema, Mullainathan & Ramrattan, 2014), reducing gender gap in extension services (Manfre, Rubin, Allen, Summerfield, Colverson & Akeredolu, 2013) and attracting more youth towards agriculture (Irungu, Mbuga & Muia, 2015).
We focus our discussion below on comparisons between institutional type, ICT access, professional activities and productivity of scientists. The two institutional types provide potentially unique incentive systems for agricultural researchers to adopt and utilise ICTs. Both institutions have two core functions of which one is advancing research. The other core function of universities is teaching, while for research institutes’ other core function is extension. These broad differences, we submit, shape both access to ICTs and incentives to utilise them.
Agricultural Research in Kenya
In Kenya, agricultural research is primarily coordinated through government sponsored research institutes and universities. 1 The Kenyan Agricultural Research Institute (KARI) has forty-two centres spread across the nation that have conducted agricultural research since 1979, including food crops, livestock, horticulture, land use and socio-economics (Rege, Maina, Kedemi & Mwangi, 2009). In 2008, roughly half of the total spending on agricultural research and development in Kenya was channelled through KARI; and KARI employed about half of all agricultural research scientists as well (Flaherty, Murithi, Mulinge & Njuguna, 2010). 2 KARI’s leadership role in agricultural research has diminished over time as universities, NGOs, private industry and parastatal entities research efforts have increased, but they will still hire researchers and invest resources on agricultural research in the coming decades. KARI also assumes primary responsibility for extension involving disseminating agricultural research to farmers. For example, KARI established the Kenya Agriculture Information Network (KAInet) to disseminate research through the Internet (Rege, Maina, Kedemi, Mwangi, 2009).
Kenya’s universities have expanded their research role significantly since the 1970s. By 2008, universities employed over 200 agricultural research scientists and one quarter of total spending and staffing on agricultural research was channelled through Kenya’s three largest universities (Flaherty, Murithi, Mulinge & Njuguna, 2010). Agricultural universities also have strong connections with farmers and agricultural groups but their core mission is teaching.
Data and Methods
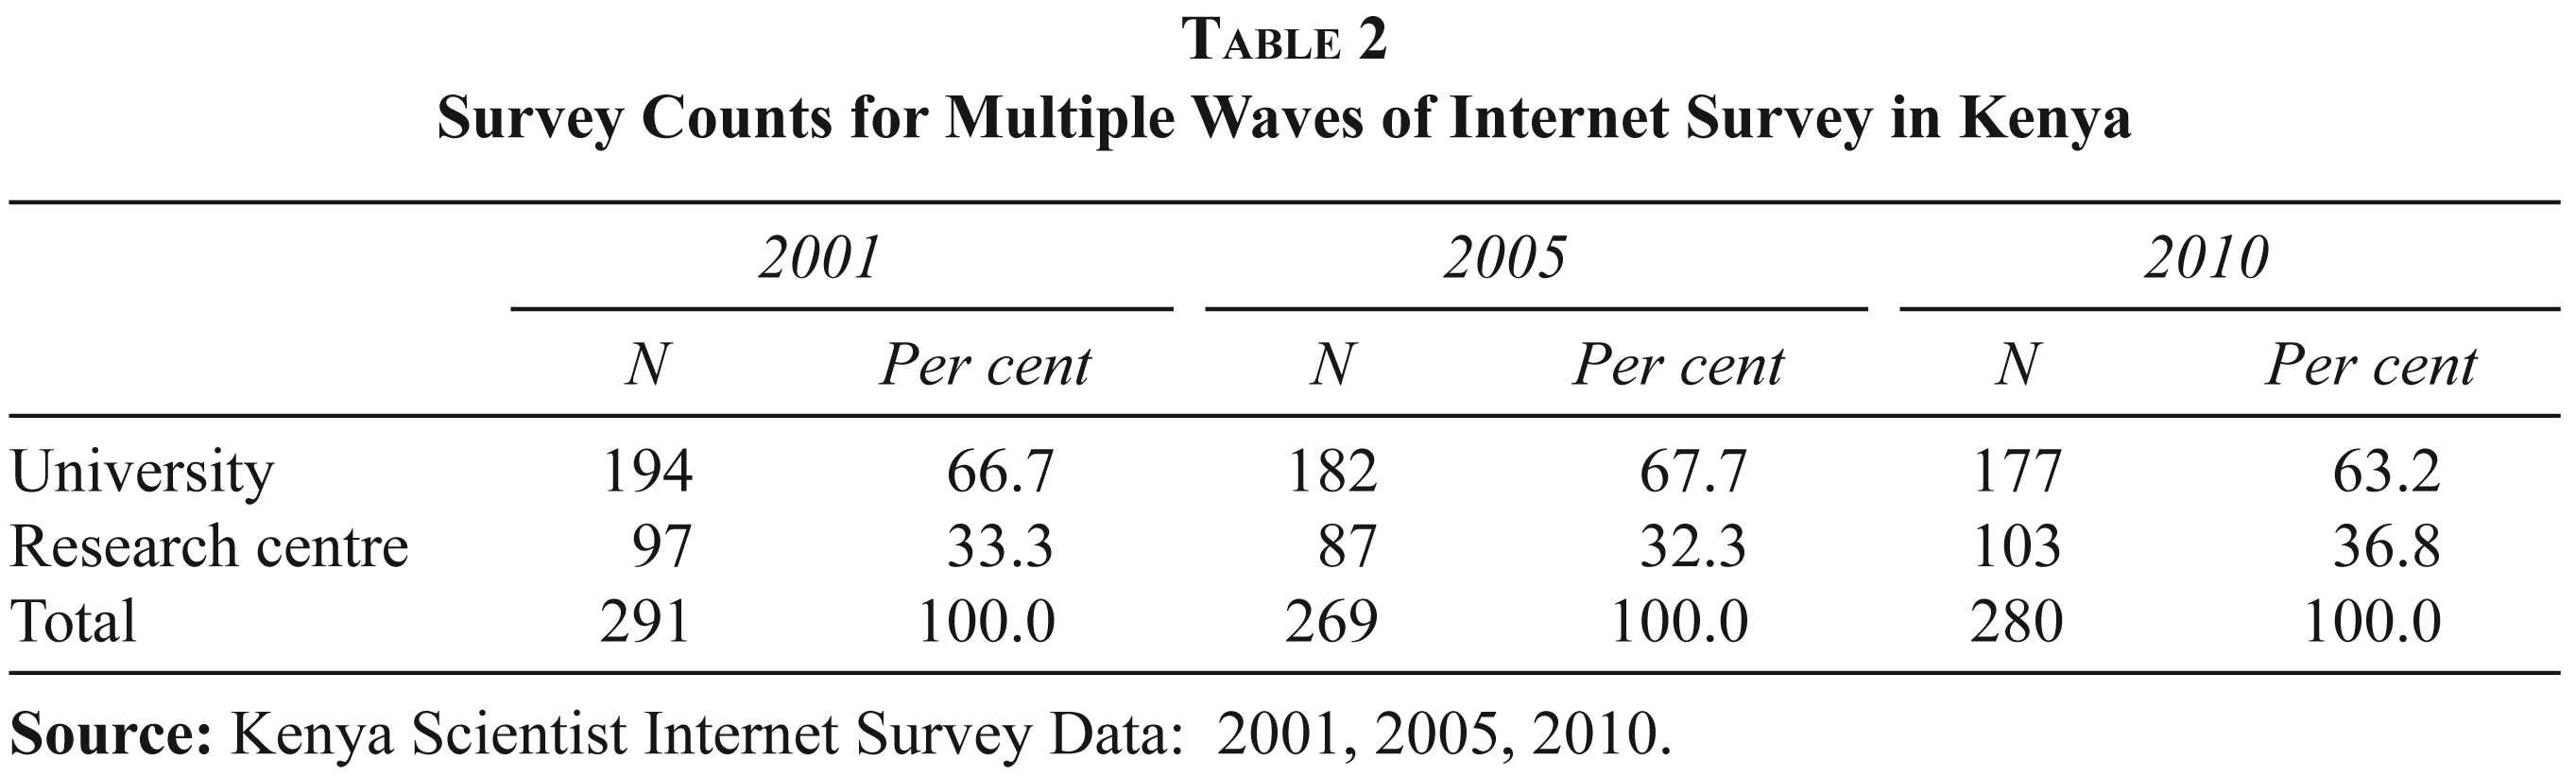
To examine trends and make comparisons across institutional settings regarding the access to and use of ICTs, we draw upon three survey waves of a longitudinal study of agricultural scientists in Kenya: Wave 1 conducted in 2001, Wave 2 to 2005 and Wave 3 in 2010. Scientists working in both KARI research centres and universities near Nairobi and the Rift Valley were surveyed in each wave of the survey. We focused only on scientists with a Masters degree or higher. More university researchers were interviewed in each wave than KARI researchers. In total, we collected 291 surveys in 2001, 269 surveys in 2005 and 280 surveys in 2010, respectively (Table 2). 3
Survey Counts for Multiple Waves of Internet Survey in Kenya
Kenyan Agricultural Scientist Survey Waves: Numbers in each Wave or Combination of Waves for Panel Members
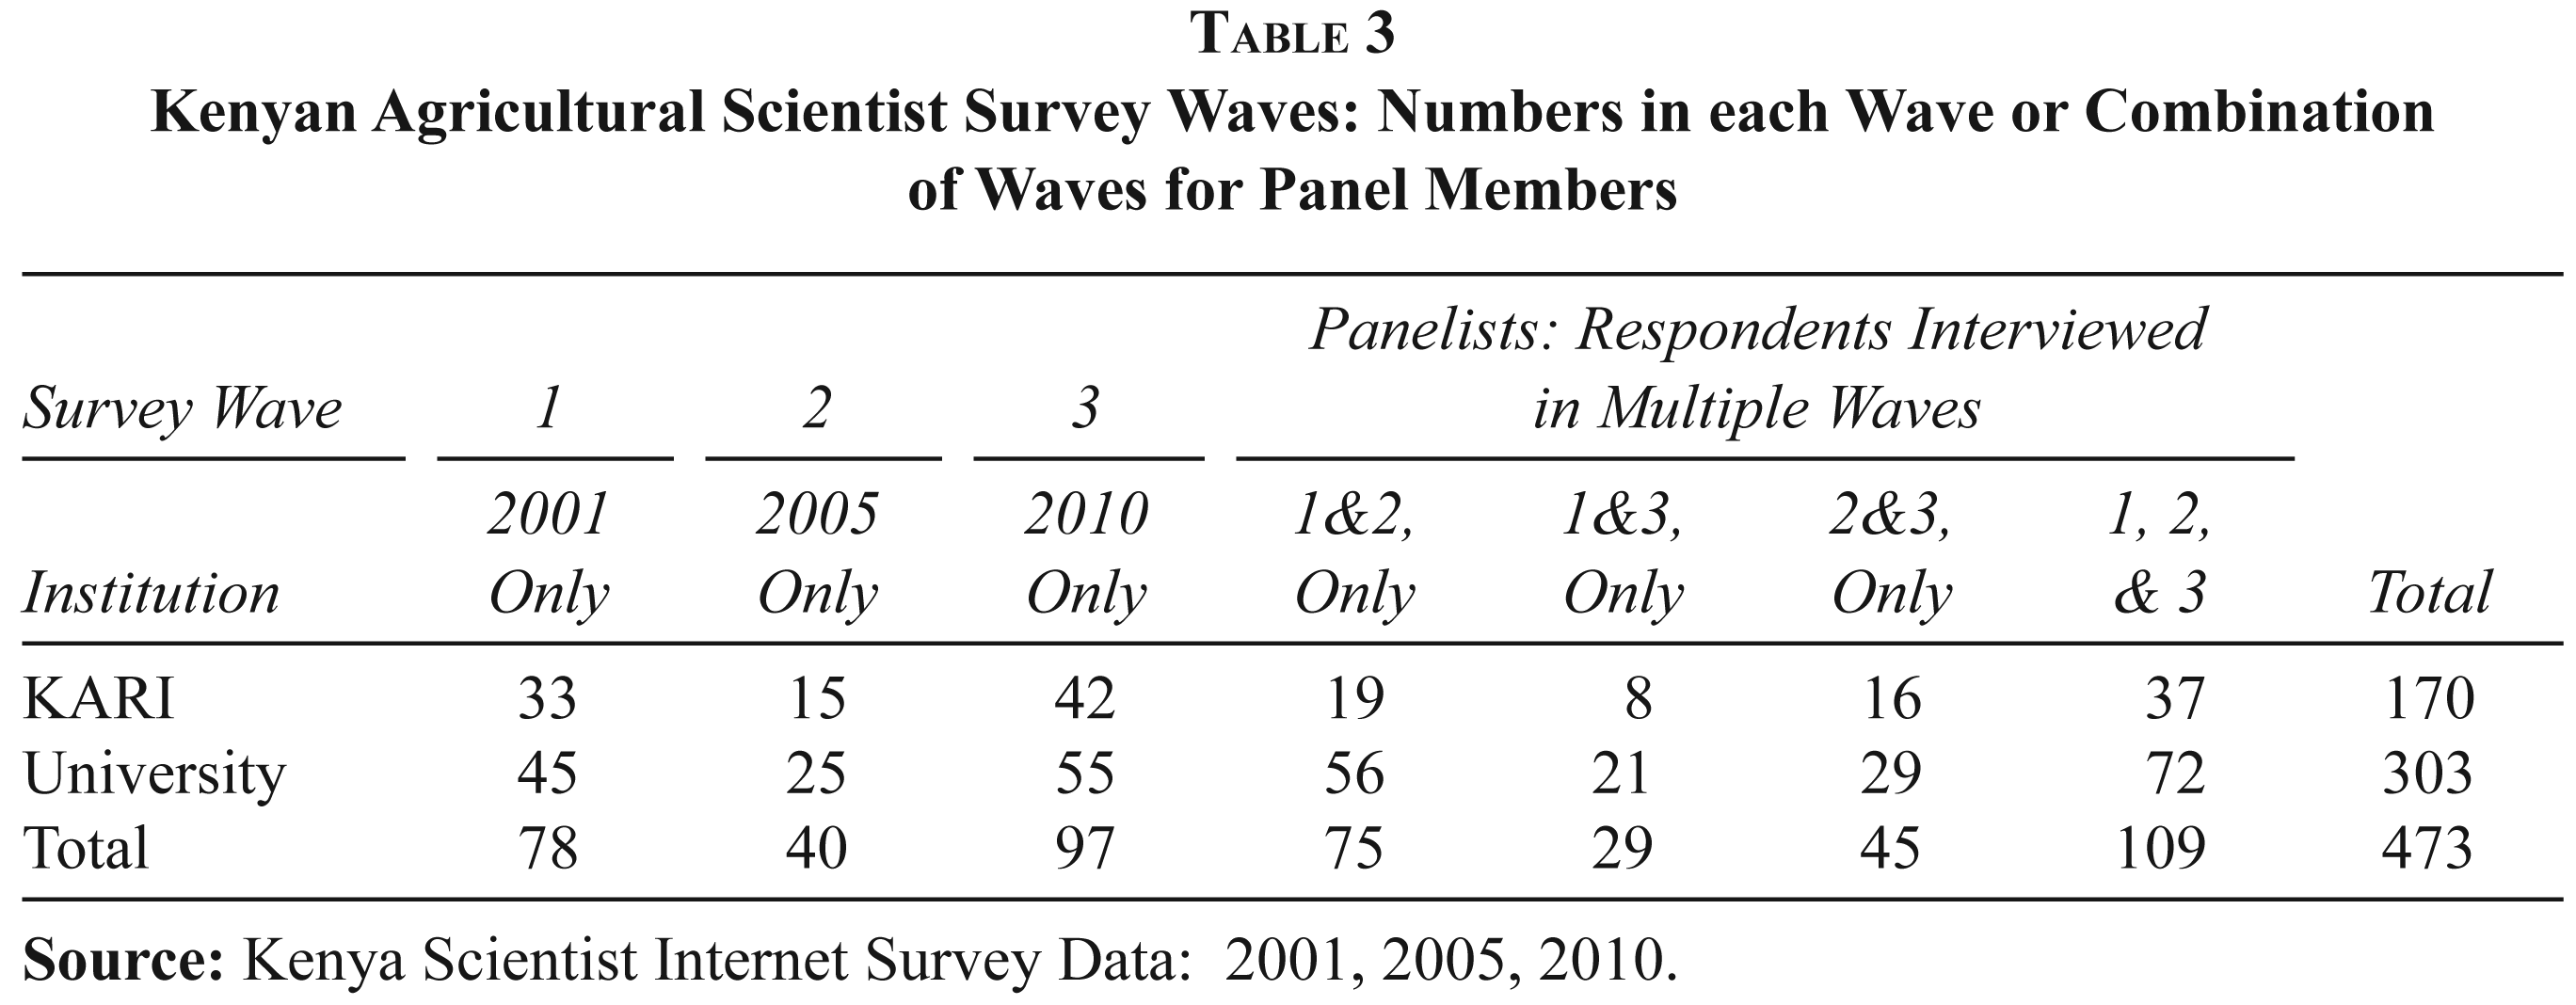
The methodological approach to sampling for Wave 1 involved attempting to interview all available scientists within randomly selected units. We returned to the same units in Waves 2 and 3. In 2005 and 2010, research assistants were instructed to first make every effort to re-interview the same respondents originally interviewed in 2001. Table 3 describes the survey waves.
In total, 473 scientists with Masters or PhD degrees were surveyed (170 at KARI institutes and 303 at Kenyan universities). Of these, 109 scholars were interviewed in all three waves, 149 scientists were interviewed twice (75 + 29 + 45) and 215 were interviewed only once (78 + 40 + 97). The multi-wave data structure allows us to explore two kinds of comparisons: (a) comparisons between scientists at universities and research institutes for the same wave (significant values denoted by *) and (b) comparisons within each institution from 2001 to 2005 to 2010 (significant values denoted by #). Below, we comment on aggregate change over time in addition to institutional comparisons. We do not examine change over time among individual respondents.
Descriptive Characteristics
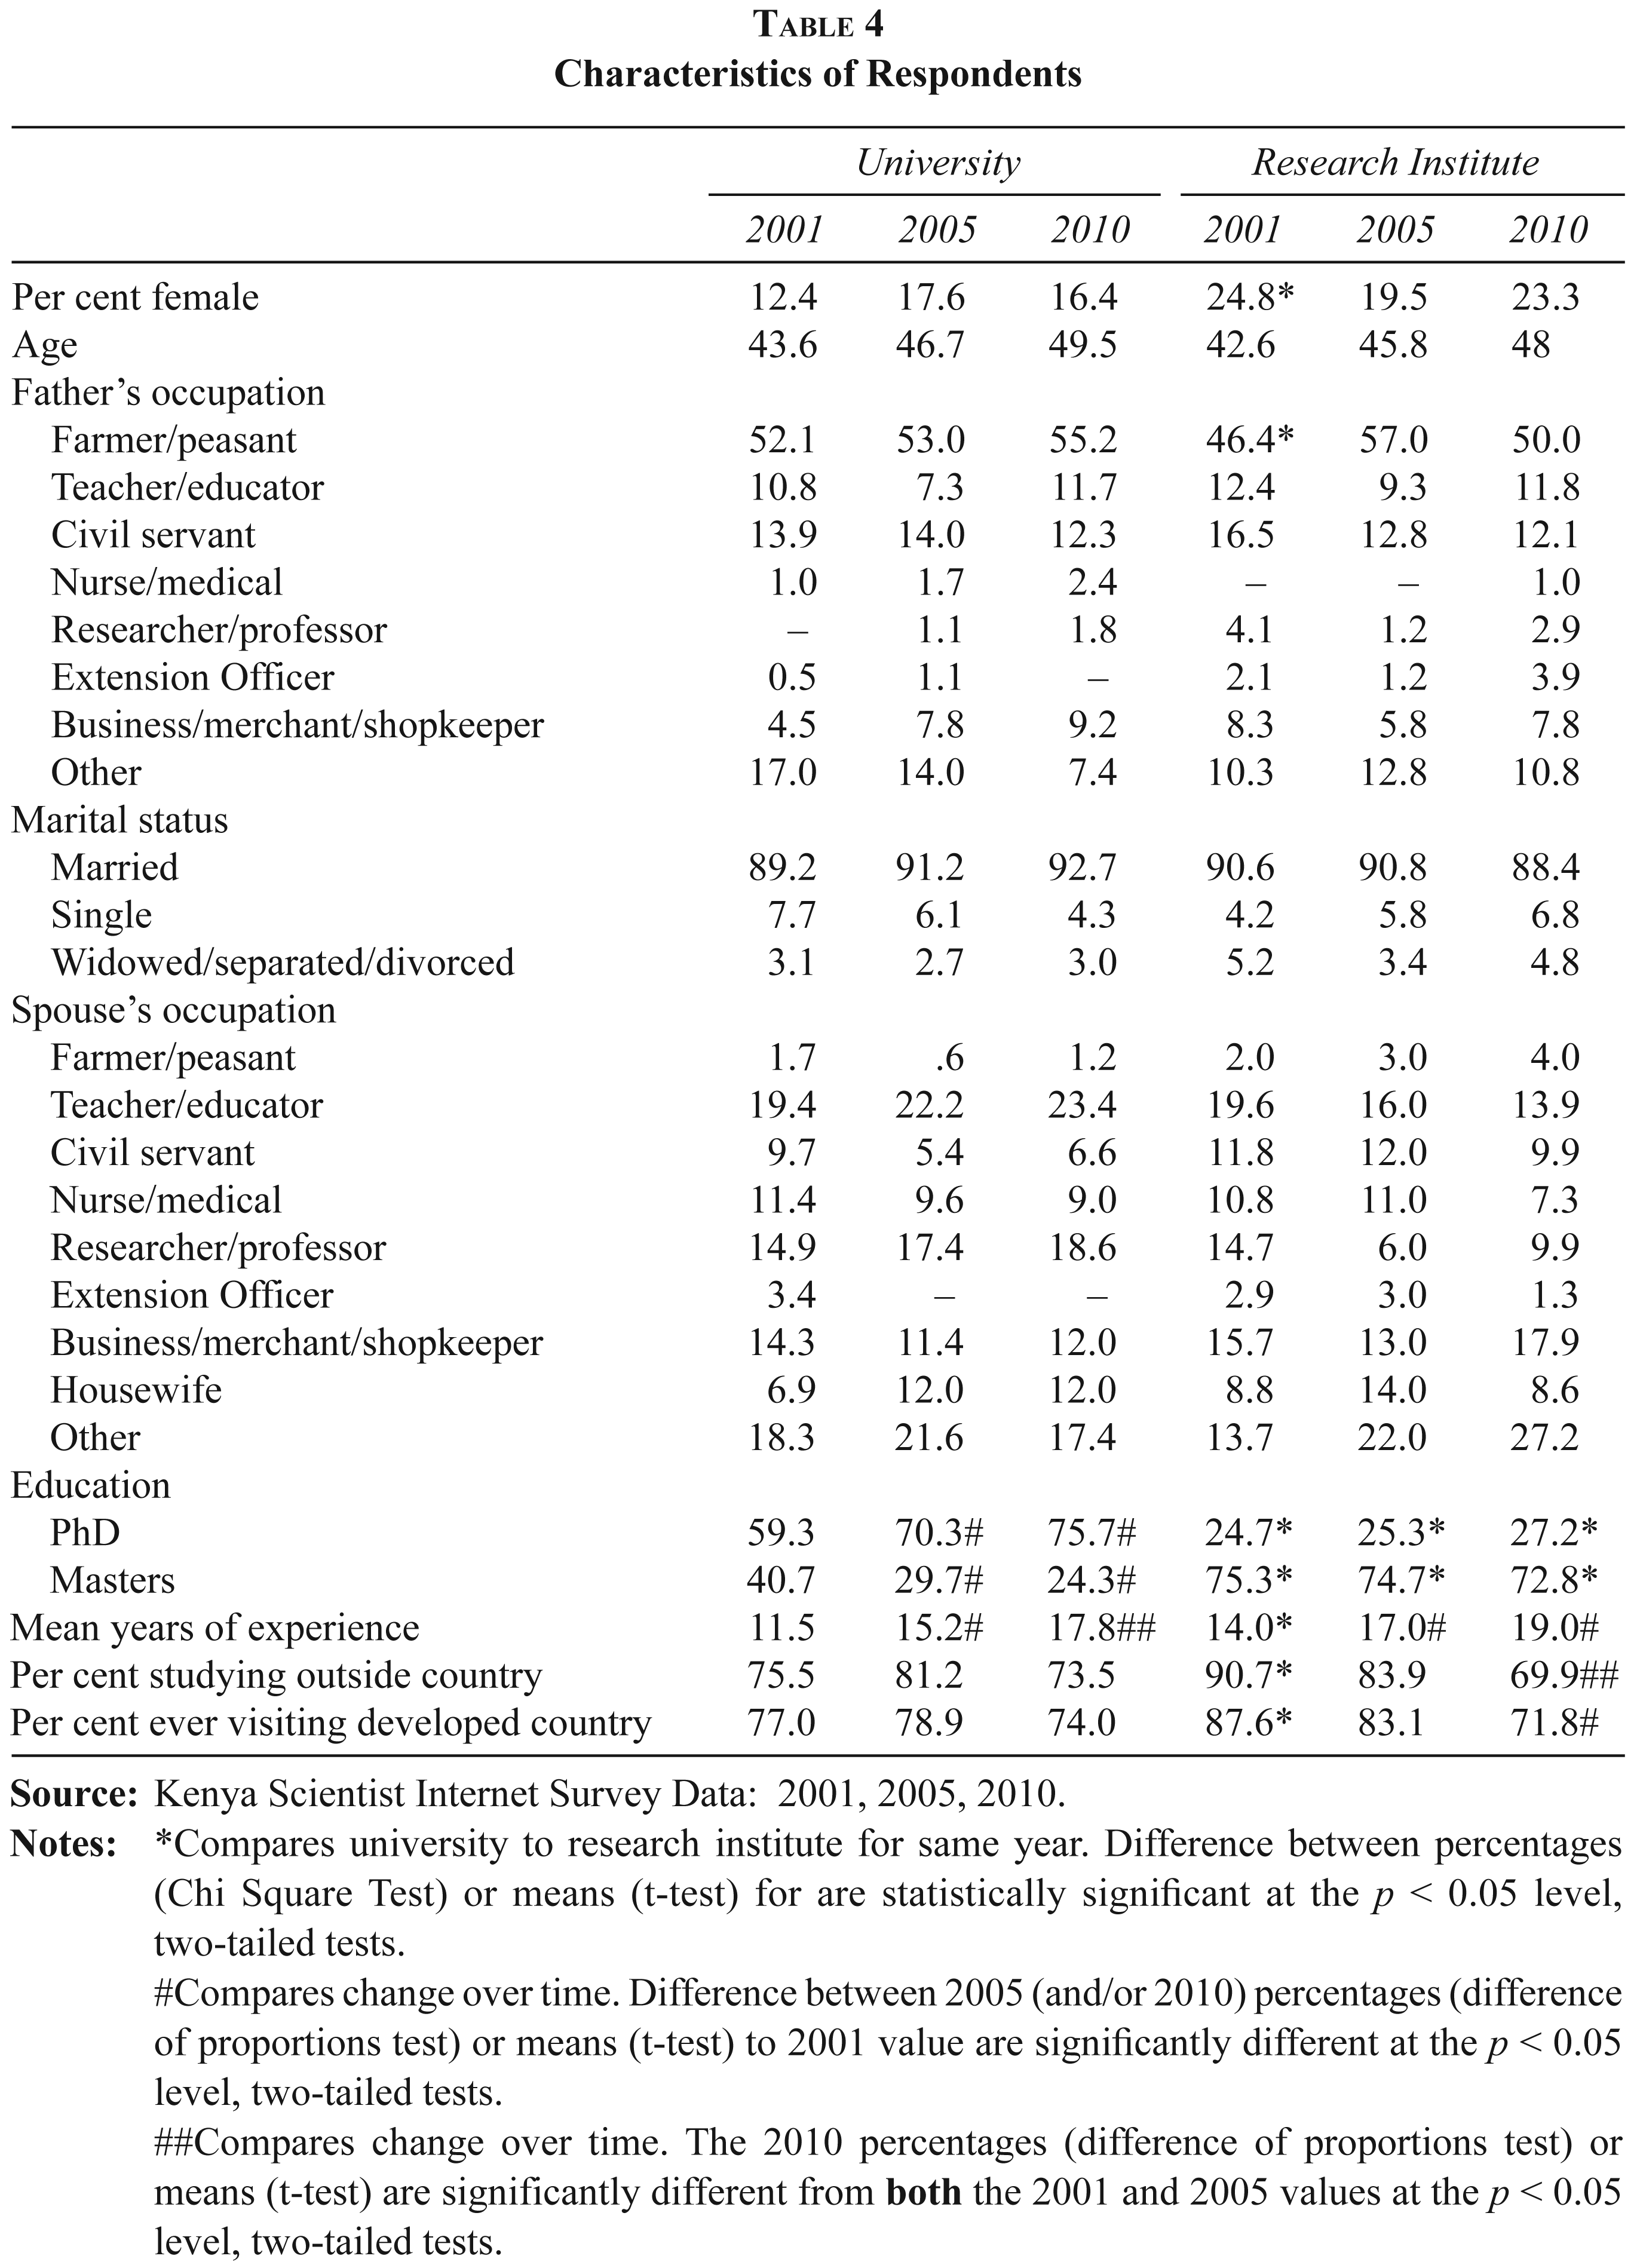
The descriptive statistics (Table 4) reveal similarities and differences across institutional settings. First, KARI centres employed more female scientists than universities in 2001, but the gender differences diminished over time. In 2001, 24.8 per cent of KARI versus only 12.4 per cent of university respondents were female, a significant 12.4 percentage-point difference. Institutional differences in the percentage of female scientists were not significant in either 2005 or 2010, nor were there significant gender differences over time. Second, the average age of respondents increased from 43.3 years in 2001, to 46.4 years in 2005, to 48.9 years in 2010, with no significant differences in mean age of scientists at universities versus research centres.
Third, about half of all scientists reported their fathers’ occupation as farmers, while others reported teachers, civil servants and other professions. Only a few had fathers who were scientists, themselves. Fourth, about 90 per cent of scientists were married, consistent over time and across institutional context. Fifth, spouses of married scientists were engaged in a wide range of employment activities, with no clear over time or institutional differences.
Characteristics of Respondents
#Compares change over time. Difference between 2005 (and/or 2010) percentages (difference of proportions test) or means (t-test) to 2001 value are significantly different at the p < 0.05 level, two-tailed tests.
##Compares change over time. The 2010 percentages (difference of proportions test) or means (t-test) are significantly different from both the 2001 and 2005 values at the p < 0.05 level, two-tailed tests.
Sixth, more university than KARI scientists had PhDs. In 2001, 2005 and 2010, the percentage of university scientists with PhDs increased significantly from 59.3 per cent to, 70.3 per cent, to 75.7 per cent, respectively. By contrast, only one-fourth of KARI scientists had PhDs, with slight, insignificant increases over time.
Seventh, in 2001, KARI researchers had more experience than their university counterparts (14 years versus only 11.5 years); but there were no experience differences in either 2005 or 2010. Eighth, three-fourths of all scientists had experience abroad but the percentage of KARI scientists with experience abroad declined relative to university scientists. In 2001, more KARI scientists than university faculty studied abroad (90.7 per cent versus 75.5 per cent, respectively). By 2005, however, the percentage of university scientists studying abroad increased to 81.2 per cent while that of research centre scientists declined to 83.9 per cent. By 2010, the percentage of all scientists with experience studying abroad declined again, but percentages were still higher for those in universities (73.5 per cent versus 69.9 per cent of KARI researchers, although these are still not statistically significant differences). Similarly, in 2001, significantly more research centres than university researchers had visited developed nations (87.6 per cent versus 76.6 per cent). This percentage declined by 2010 for all, but the decline was steeper for KARI respondents. Percentages of university scholars visiting developed nations rose to 78.9 per cent in 2005 and then fell to 74.0 per cent in 2010. This percentage for research centre scientists fell to 83.1 per cent in 2005 and further to 71.8 per cent in 2010, a significant sixteen percentage-point drop from 2001 to 2010.
Results
We next analyse trends in researchers’ access to technology, professional activities and scholarly productivity.
Access to Technology
Table 5 provides evidence of how Kenyan agricultural scientists’ access to computers, email and the Internet changed from 2001 to 2010.
Computers
We asked respondents about access to computers at work and home, Internet connectivity, general use and comfort level. Over 75 per cent of agricultural scientists had access to personal computers at work in 2001, increasing to well over 90 per cent by 2005 and 2010. University access to work computers increased from 75.9 per cent in 2001 to 89 per cent by 2005 (a significant thirteen percentage-point increase), and then declined to 86.4 per cent in 2010. KARI access to work computers increased from 80.4 per cent in 2001 to 99 per cent by 2005 and 98 per cent by 2010. Since 2005, a significantly higher percentage of KARI scientists than university scientists have had access to work computers. In 2001, a minority of all scientists had computer in their personal office, with a significantly higher percentage of KARI than university researchers having office PCs (43 per cent for KARI versus only 29 per cent for university, a fourteen percentage-point difference). By 2005, however, well over half the respondents had office PCs.
Access to and Use of Technology

#Compares change over time. Difference between 2005 (and/or 2010) percentages (difference of proportions test) or means (t-test) to 2001 value are significantly different at the p < 0.05 level, two-tailed tests.
##Compares change over time. The 2010 percentages (difference of proportions test) or means (t-test) are significantly different from
Computers are important, but Internet access increases scientists’ communications. In 2001, 33 per cent of university versus 23 per cent of KARI scientists reported having Internet access at work. From 2001 to 2005, university Internet access leapt to 65 per cent (a huge, thirty-two percentage-point increase) while KARI Internet declined to 15 per cent, resulting in a gigantic, fifty percentage-point institutional gap. That gap completely closed over the next five years, however, as 79 per cent of all scientists had Internet access at work.
Interviewer reports of computers and computer use increased over time, but institutional differences were not observed. Only 38 per cent of 2001 interviewers reported seeing computers of university scientists’ offices versus 65 per cent of 2005 and 83 per cent of 2010 interviewers. Interviewers observed computers in 47 per cent of KARI offices in 2001, 70 per cent in 2005 and 90 per cent in 2010, respectively. While interviewers reported seeing computers more often at KARI in all three waves, the differences across sector were not statistically significant. 4 Interviewer reports of seeing evidence of computer use similarly increased for both institutional sectors during the course of the decade, but the cross-sector differences were again statistically insignificant. Interviewer reports of computer use in universities increased from 27 per cent in 2002, to 59 per cent in 2005, to 73 per cent in 2010 and in KARI centres from 34 per cent in 2001, to 48 per cent in 2005, to 83 per cent in 2010, respectively.
From 2001 to 2010, respondents reported increased access to home computers. More university than KARI respondents reported home computers. In 2001, 48 per cent of university versus 39 per cent of KARI; in 2005, 76 per cent university versus 58 per cent of KARI and in 2010, 97 per cent of university versus only 85 per cent of KARI, respectively, reported having home computers. The differences were statistically significant in 2005 and 2010. Few reported home Internet access until 2010. In 2001 and 2005, only about 15 per cent of university and 9 per cent of KARI respondents reported home Internet access. By 2010, 79 per cent of university and 55 per cent of KARI researchers had home Internet access (a significant twenty-four percentage-point gap).
We also examined scientist’s hours of use and comfort level. We used the following scale to assess use: (0 = zero hours, 1 = low use or less than one hour, 2 = medium use, between five and ten hours, 3 = high use, over ten hours per week). The mean responses range from 2.3 to 2.7; all scientists could be classified as medium–high users. There were two additional significant findings: (a) KARI scientists reported more computer usage than university scientists in both 2001 and 2010 and (b) university scientists’ usage was significantly higher in 2005 and 2010 than 2001. We assessed computer use for fun with a scale where 1 = frequently, 2 = occasionally, 3 = seldom and 4 = never. Mean responses ranged from 2.9 to 3.5; Kenyan researchers rarely used computers for fun. Still, there were both over time and institutional differences. First, KARI scientists more often used computers for fun in 2005 and 2010. Second, more Kenyan scientists used computers for fun from 2005 to 2010, coinciding with smartphone expansion. Comfort level was assessed with a scale in which 1 = very comfortable, 2 = somewhat comfortable, 3 = slightly comfortable and 4 = not at all comfortable. Respondents were comfortable using computers with mean levels from 1.2 to 1.6 throughout the decade. Comfort levels increased were always high for KARI researchers but increased over time for university faculty.
Email use increased from almost all respondents in 2001 to everyone by 2010, with no institutional differences. Hours of email use—scale in which 0 = not at all, 1 = less than one hour, 2 = between one and five hours, 3 = between five and ten hours, 4 = between ten and twenty hours and 5 = over twenty hours—also increased on aggregate from about 1.4 in 2001 to about 2.2 in 2010. University faculty reported more use than KARI scientists in 2005, but mean usage rates were almost identical in 2001 and 2010. About two-thirds of all scientists interviewed in 2001 reported losing access to email for at least a week within the past year. The continuity of email access improved in 2005 and 2010, but still half of all agricultural scientists in Kenya reported losing access to email for at least a week, with no differences between university and centre-based scientists.
Scientists used email to discuss research both inside and outside Kenya. The percentages using email to discuss research with other Kenyan scientists increased steadily and significantly from about 58 per cent in 2000 to 81 per cent in 2005 to 96 per cent by 2010, with no significant institutional differences. In 2001, half the researchers emailed scientists in other African nations. For university scientists, that percentage increased significantly over the decade to 67 per cent in 2005 and to 74 per cent in 2010. For KARI researchers, the percentages emailing colleagues in other African nations also increased to 64 per cent in 2005 and 63 per cent in 2010. (The 2010 eleven percentage-point difference is significant.) Two-thirds reported emailing colleagues in developed countries in 2001. This percentage increased steadily for university faculty and, by 2010, 81.4 per cent of respondents reported emailing developed country colleagues. By contrast, KARI scientists’ developed country emailing did not increase; institutional differences were significant by 2010 (fourteen percentage-points).
Relatively, few used email to start a professional relationship in 2001, but more university than KARI reported doing so (23.9 per cent compared to 9.4 per cent). Emailing to start professional relationships increased dramatically and significantly over the decade to 35 per cent in 2005 and to 54 per cent in 2010 for universities and, for KARI, to 16.3 per cent in 2005 and to 28.2 per cent by 2010). Over time increases were significant for all, but the increase was more dramatic for universities yielding a 26.4 percentage-point gap by 2010. Many scientists used email to discuss a funding proposal. For both groups, percentages increased over time from roughly 57 per cent in 2001 to 73 per cent in 2005 to 80 per cent in 2010.
Web Use
The final section of Table 5 reports results for web use. The first four assess general web use. By 2001, most scientists were browsing, but significantly more university than research centre faculty (78 per cent versus 55 per cent, respectively, a twenty-three percentage-point gap). Browsing significantly increased for both groups by 2005 reaching 94.5 per cent of university and 86.2 per cent of KARI respondents, respectively. Browsing further increased in 2010 but not significantly. Browsing increased more among KARI scientists, so that by 2010 the gap had closed to 4.7 percentage points (98.9 per cent for university versus 94.2 per cent for KARI). The trend for university respondents reporting of recent web browsing was unexpected, a significant increase from 43.6 per cent in 2001 to 81.2 per cent in 2005, then declining significantly back to 51.8 per cent in 2010. By contrast, KARI researchers’ recent web increased steadily from 18.9 per cent in 2001 to 47.7 per cent in 2005 to 52.4 per cent in 2010.
Web browsing experience also increased over time. The percentage with less than three years’ experience declined for both groups from over 60 per cent in 2001 to less than 10 per cent by 2010. The percentage of ‘new users’ fell faster and farther in universities, but the general trends were the same and by 2010 the vast majority were experienced web browsers. Finally, in 2001, more university (38.9 per cent) than KARI (16.1 per cent) respondents reported using the web for more than an hour a week (a significant, 22.8 percentage point gap). This gap declined to only 9.7 percentage points by 2010 as, by then, more than 90.3 per cent of university and 80.6 per cent of KARI respondents spent over an hour a week on the web.
Kenyans accessed the web at home, at work and at cybercafés. In 2001 and 2005, the majority had never accessed the Internet from home, but this changed dramatically by 2010, reflecting the emergence of mobile access. By 2010, only 10.3 per cent of university and 24.5 per cent of KARI researchers had never accessed the Internet from home. Over 60 per cent reported never accessing the web from work in 2001. By 2010, fewer than 10 per cent had never accessed the Internet at work. In 2005, university respondents reporting never accessing the web from work dropped nearly forty percentage-points, from 59 per cent in 2001 to 21 per cent in 2005. The increased work access occurred earlier at universities, but later for KARI centres. Overall, cybercafé Internet access increased over time, much more so for KARI scientists. In 2001, only 56.7 per cent of university versus 78.9 per cent of KARI scientists reported never using a cybercafé, but by 2010, the percentages were reversed such that only 22.6 per cent of KARI researchers versus 36.4 per cent of university scientists never used a cybercafé (statistically significant differences for both time periods).
Work-related Internet use increased steadily over the decade with respect to (a) accessing an electronic journal, (b) conducting an information search, (c) acquiring or using data found on the web, (d) collaborating on a scientific project, (e) finding reference materials, (f) accessing research reports and papers, (g) participating in online chat or discussion groups, (h) using online job listings, (i) using an online map, (j) downloading software and (k) publishing a paper. With few exceptions, percentages increased for all scientists from 2001 to 2005, and again from 2005 to 2010. University scientist’s work-related Internet use significantly exceeded that of KARI scientists.
Finally, no significant institutional differences for social networking, twitter or online meetings were observed.
Four general observations can be made with respect to Table 5. First, Kenyan scientists in both institutional settings had high rates of web access and usage as early as 2001. Second, rates and locations of access and diversity of usage increased dramatically over the decade for both groups. Third, university scientists utilised the web more fully than KARI scientists in 2001 and 2005. Fourth, by 2010, the institutional differences had either declined to insignificance or were decreasing in magnitude.
Professional Activities
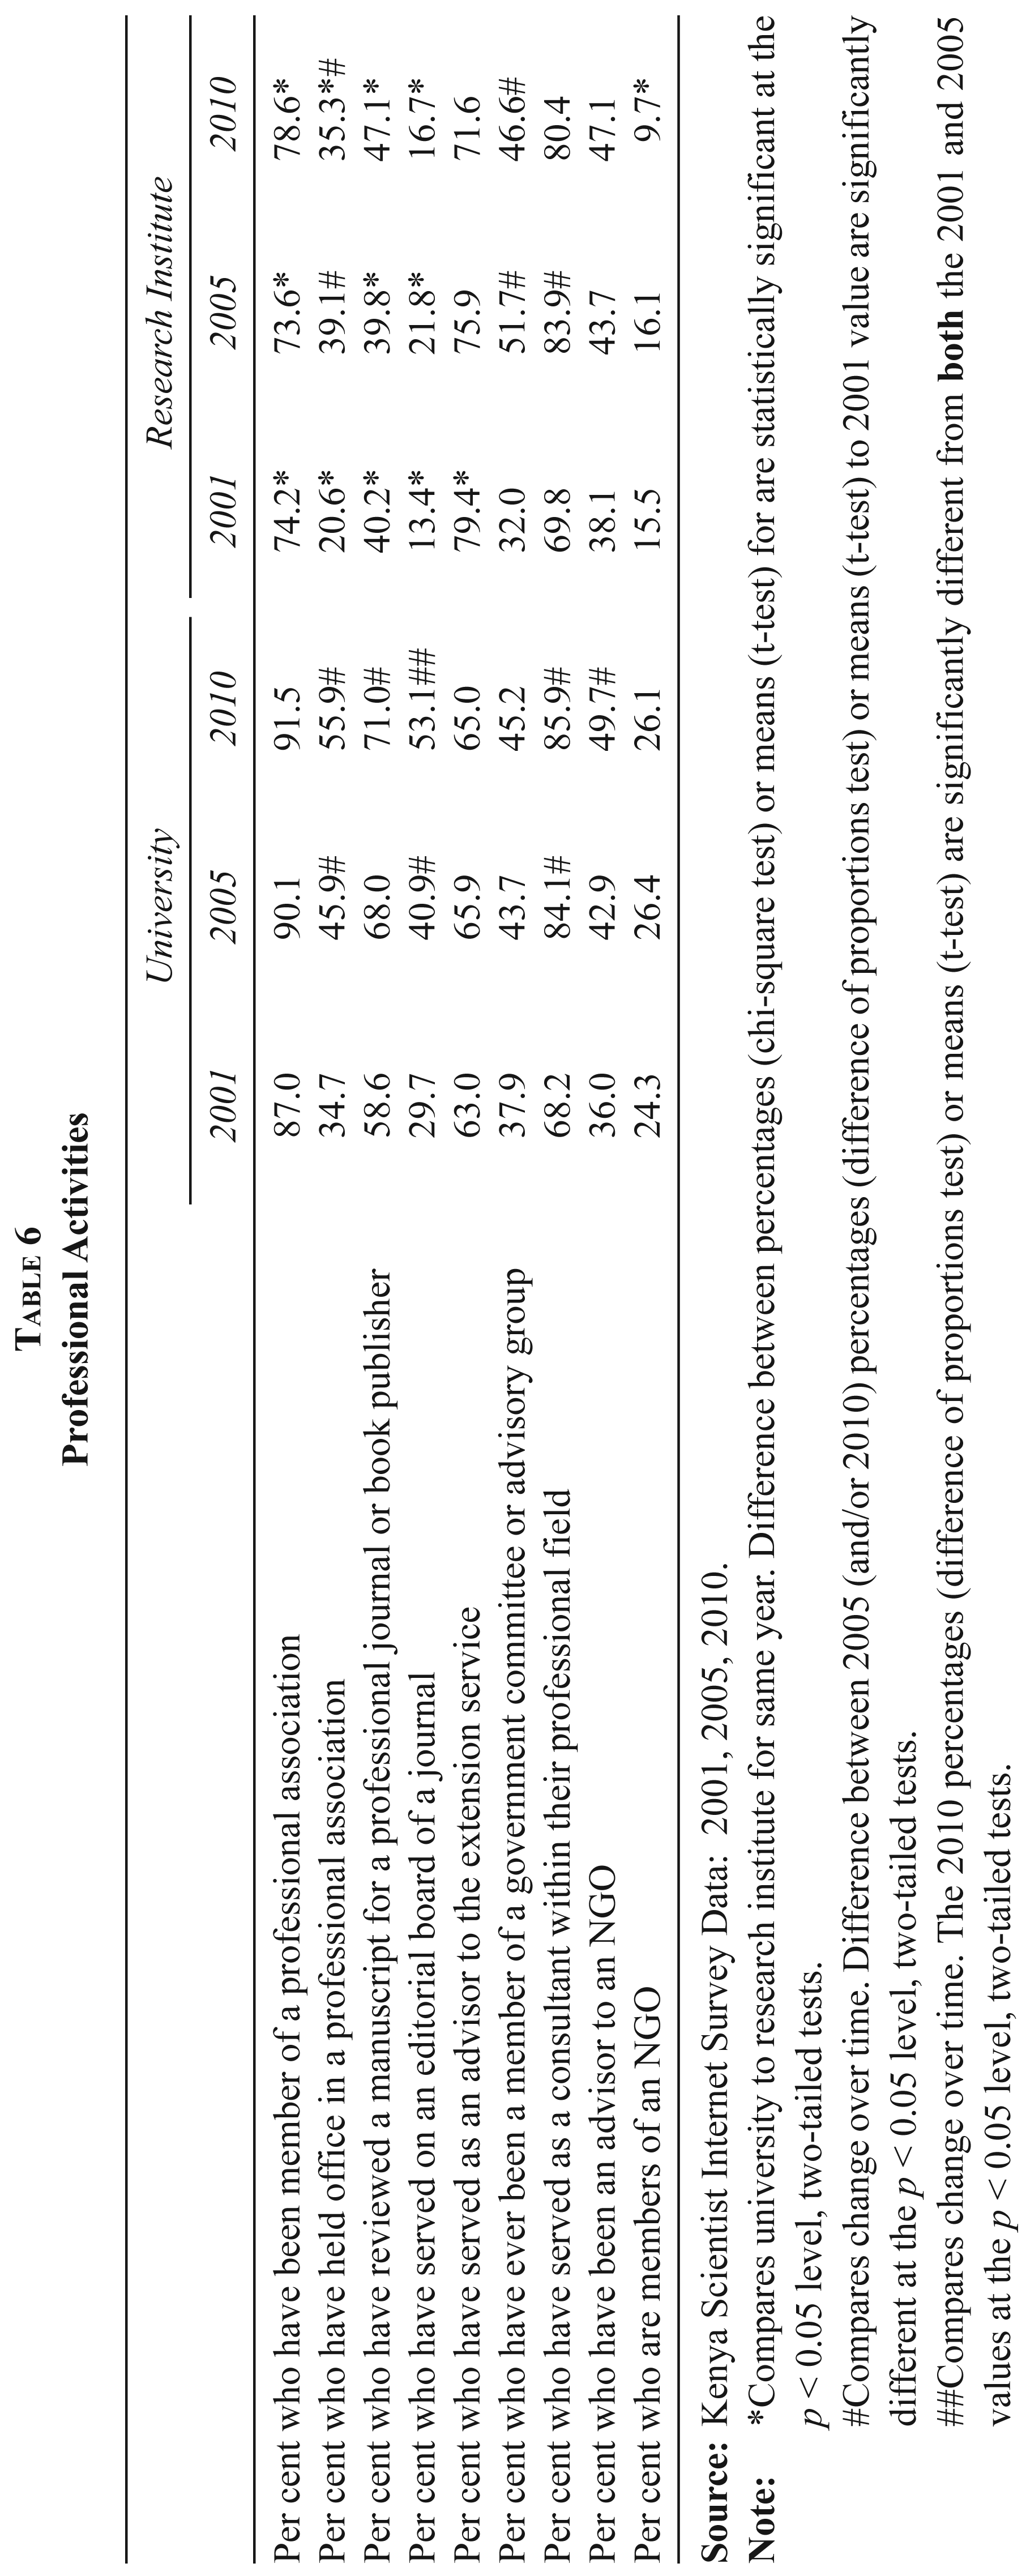
This section compares trends and differences in scientists’ professional activities (Table 6). The first two questions relate to professional associations. The majority reported membership in a professional association, but membership rates were fifteen percentage-points higher for university (90 per cent) than KARI (75 per cent) researchers. The institutional difference remained significant in all three survey waves. Similarly, university researchers held office positions more often than KARI researchers, and these rates increased for both groups over time. In 2001, 34.7 per cent of university respondents held office positions, increasing to 45.9 per cent in 2005 and 55.9 per cent by 2010. For KARI respondents, rates of holding office increased from 20.6 per cent in 2001, to 39.1 per cent in 2005, and then declined slightly to 35.3 per cent in 2010.
With respect to journal publications, more university faculty than KARI researchers reviewed manuscripts in 2001 (58.6 per cent versus 40.2 per cent, a significant, eighteen percentage-point difference). This increased to a twenty-four percentage-point gap by 2010 (71 per cent of university versus 47 per cent of KARI). The institutional gap was even wider for serving on journal editorial boards. In 2001, 29.7 per cent of university versus only 13.4 per cent of KARI respondents had served on editorial boards (a seventeen percentage-point difference). After 2001, the percentage increased for university respondents to 40.9 per cent in 2005 and 53.1 per cent in 2010, but stagnated for KARI respondents such that the gap more than doubled to thirty-six percentage-points.
In terms of professional service, more KARI than university scientists reported advising extension services in 2001 (79.4 per cent versus 63.0 per cent, respectively) but by 2005 and 2010, the institutional differences declined statistical insignificance. More university than KARI researchers reported being members of government committees or advisory groups in 2001 (37.9 per cent versus 32.0 per cent), not a statistically significant difference. Similarly, there were not significant institutional differences membership in government committees or advisory groups in 2005 or 2010, although the percentage of KARI scientists joining committees and advisory groups increased significantly from 2001 to 2005 and remained at the higher level in 2010. The majority of scientists reported consulting, but there were no significant institutional differences across any of the three survey waves. Consulting increased at similar rates for both groups from 2001 to 2005, from about 69 per cent in 2001 to about 84 per cent by 2005 and 2010. Respondents also had similar rates of NGO advising in all three survey waves. Rates of NGO advising increased from 2001 to 2010, but the increase was only significant for university scientists, from 36 per cent in 2001 to 49.7 per cent in 2010. Finally, slightly more university than KARI researchers joined NGOs (about 25 per cent for universities versus only about 13 per cent for KARI), but the difference was only statistically significant in 2010.
Professional Activities
#Compares change over time. Difference between 2005 (and/or 2010) percentages (difference of proportions test) or means (t-test) to 2001 value are significantly different at the p < 0.05 level, two-tailed tests.
##Compares change over time. The 2010 percentages (difference of proportions test) or means (t-test) are significantly different from
The findings above have several implications. First, both groups saw increases in the scope of their professional activities from 2001 to 2010. Second, university faculty engaged in more academically-oriented professional activities, as expected. Third, KARI researchers did not engage in more extension outreach activities than university faculty, contrary to expectations. Fourth, for three of the nine indicators, participation rates were stagnant over the decade; for four other indicators, participation increased only slightly professional activities and significant substantive increases occurred in only two areas: holding office in professional associations and consultancies. Taken as a whole, we cannot conclude that ICTs increased professional activity participation substantially.
Productivity
This last section of the analysis compares overall trends and differences between agricultural scientists in Kenyan university and KARI centres with respect to productivity. Table 7 reports findings for nine different productivity measures. In 2001, university researchers averaged more papers written than KARI researchers (3.0 versus 2.1 papers written within the past year) and more articles published in foreign journals (2.0 versus 1.0). On the other hand, in comparison to university researchers, KARI scientists averaged more presentations (4.1 versus 2.8); more reports (8.8 versus 2.9) and more bulletins for extension (1.8 versus 0.6). The two groups had similar mean numbers of conference presentations, articles in national journals, book chapters and percentages receiving awards. In 2005 and 2010, the university group continued to publish significantly more articles in foreign journals, and the KARI group continued to outdo university scientists in numbers of reports and bulletins, but otherwise the two groups had relatively equal productivity by 2010. Parity was nearly achieved in papers written over the decade because KARI scientists’ mean productivity increased significantly from 2005 to 2010, while university scholars mean productivity increased only slightly and also because university scholars increased their numbers of conference presentations significantly between 2001 and 2005, but KARI scientists’ mean number of conference presentations actually declined between 2001 and 2005, then increased again by 2010.
Productivity

#Compares change over time. Difference between 2005 (and/or 2010) percentages (difference of proportions test) or means (t-test) to 2001 value are significantly different at the p < 0.05 level, two-tailed tests.
##Compares change over time. The 2010 percentages (difference of proportions test) or means (t-test) are significantly different from
Results from Table 7 reflect productivity differences tied to the different aims of the two institutions. Both institutional forms employ scientists engaged in a range of scholarly activities. As a whole, KARI scientists were more productive in writing reports and bulletins to meet the needs of their clientele. By contrast, university scientists were more productive in publishing in international and national scholarly journals in connection with the research objectives of institutions of higher education. The results provide limited evidence that increased ICT access over time led to increased scientific productivity. Although productivity increased in the aggregate, the increases for most categories of productivity did not achieve levels of statistical significance except in the instances mentioned above. Increased ICT/Internet access led to a broader range of productivity for both university and research faculty. Scholars at research institutes may have realised the most important productivity benefits from increased ICT access, as by 2010 they had nearly matched university faculty in papers written and in articles in national journals. Their lack of access in the earlier periods may have been harmful to productivity.
Discussion
As agricultural scientists carry out their work under different institutional contexts, it is important to assess how those contexts shape their access to resources, activities and productivity. This article utilised a uniquely structured, longitudinal data set to compare Kenyan agricultural scientists located at universities to their counterparts in research institutes in connection with their access and use of technological resources, professional activities and productivity. All respondents in this study are actively engaged in scientific research, but it should be noted that the majority of university scientists had earned PhDs while the majority of KARI scientists had Masters degrees, a difference that only increased over the decade. Educational credentials relate not only to job positions and concomitant expectations with respect to scholarship, but also to opportunities for further education, training and advancement. In addition to education level, the two groups of scientists also began to differ over the course of the decade with respect to experiences abroad. Overall, three of four scientists in the study had experiences abroad, but the percentage of research centre scientists with experience abroad declined significantly over the decade in comparison to university scientists. There are several implications here. On the one hand, the change could reflect an increasing capacity of Kenyan universities to train their own researchers. On the other hand, opportunities for researchers to pursue advanced degrees abroad may be declining. Experience abroad has long been associated with valued exposure to new and varied ideas, methodological approaches, technologies and (most importantly, in the case of graduate and postgraduate studies) collaborations with scientists from across the globe. Future research should further examine whether scientists at Kenyan research institutes are shifting from externally-oriented to internally-oriented patterns of professional networks and focus.
Kenyan agricultural scientists in both universities and research centres enjoyed widespread access to computers and the Internet as early as 2001. Over the course of the decade, access increased both at work and at home, so much so that reliance on Internet cafes declined over the decade. Further, Kenyan agricultural scientists were very comfortable using email and the web, spending more and more time online for an increasingly diverse set of purposes. Our findings suggest some differences in access between scientists working universities and KARI centres, but the overall picture shows that those differences diminished by 2010 as nearly all scientists enjoyed substantial levels of access, comfort and diversity of access to computers, email and the web. More university scientists exchange emails with colleagues outside of Kenya and use the web a little bit more but such differences do not appear to be a consequence of different levels of access or comfort levels. Further, institutional differences in access and comfort levels will likely further diminish in the future. By 2010, the web and email had become a common feature in all Kenyan agricultural scientists’ work lives. However, this increasing equality of access probably had at least as much to do with advances in mobile phone and tablet access as with institutional improvements.
Still, there are differences in communications patterns among scientists in Kenya that deserve special attention. The findings with respect to email communications, for example, suggest institutional differences in patterns of scientific collaboration. Email communications with colleagues from developed countries increased steadily for university faculty so that by 2010 many more university faculty than KARI scientists were emailing back and forth with their colleagues in developed countries. Email has become the most important mode of scientific collaboration, with the potential to increase the pace and comprehensiveness of scholarly productivity as well as the range of information exchange. Email filled the communication gap within the agricultural intellectual community in many ways. Researchers used email for collaboration on papers, including sharing relevant academic papers giving Kenyan scientists more equitable access to more scholarly materials. Email and web use also facilitated information sharing critical to collaborations on grants and participation in professional meetings, both externally and internally. As connectivity expanded, scientists broadened their use of these new resources, leading to new, diverse professional opportunities. By 2010, ICT access was a requirement for collaboration and publication in many fields, and quality connectivity correlated with improved professional self-efficacy and research climate in Kenya. Most scientists paid for their own mobile access as it reduced their dependency on sometimes faulty government-run systems.
Institutional contexts influenced Kenyan scientists’ professional activities and productivity. First, institutional contexts influence both membership and official involvement in professional associations, as well as scholarly output in terms of publications. University respondents were more active, professionally, and they were more involved in the processes of publishing academic work in journals or as books. Second, institutional context had little influence on advisory, extension and consultancy activities, as all the results revealed similar levels of involvement from all agricultural scientist. Third, despite having more PhDs, institutional context also had little effect on aggregate productivity, which was similar between universities and research centres. ICT access led to modest productivity increases in both sectors. Fourth, institutional context did influence the nature of productivity, with university scholars focusing more on scholarly articles and KARI scientists focusing more on reports and bulletins.
Institutional difference in professional activities and productivity likely relate back to the different education levels between the two institutions. Universities have more scientists with PhDs, and expectations of (and funds for) associational activities are likely higher for scientists with PhDs than for scientists with Masters, explaining the institutional differences. Future research can make more effort to understand the mediating effects of education on professional activities.
We expect the proportion of scientists with PhDs to gradually increase in both institutions over time as Kenya continues to produce more and more scientists. By 2015, ICT access through mobile-cellular has reached the point of saturation for Kenyan scientists, all have connectivity and are diversifying their use of ICTs for both professional and personal communications. Both institutions should be able to use ICTs to enhance their research functions, but as long as they differ in their other core function (teaching versus extension), we expect continued differences in education levels and productivity focus in agricultural research.