




Abstract
This study investigates the effects of market concentration and diversification on firms’ performance in the case of the Indian chemical industry. The findings indicate a positive relationship between market concentration and performance measured in terms productivity and profitability. However, firm diversification shows a negative impact on a firm’s productivity and but positive impact on its profitability. The study also reveals that market concentration outperformed in comparison to the diversification strategy for the Indian chemical industry.
Introduction
The dynamic era of globalisation, privatisation and liberalisation have prompted drastic changes, making India one of the fastest growing globally competitive economies. The increase in completion and risk pushed firms to experiment with new strategies like diversification and concentration in a rapidly changing economy. These strategies are considered important for the growth strategy in most of the industrial countries. Diversification is when a firm produces an entirely different product that is not a substitute for the existing product in the market (Barthwal, 1984). Diversification is considered prospective for the firm’s growth, pushing more firms for product–market diversity (Datta et al., 1991). Diversification also plays a strategy that impacts the firm’s productivity and performance (Eckel & Neary, 2010; Maksimovic & Phillips, 2003; Schoar, 2002). Besides diversification, market concentration can also impact the performance of the firm. The market concentration plays a vital role in determining the behaviour of the firm in the market. Both these strategies show positive and adverse impacts on the firm’s performance (Berger & Ofek, 1995; George & Kabir, 2005; Kendrick, 1961; Montgomery & Wernerfelt, 1988; Pandya & Rao, 1998; Singh, 1985; Ward, 1987).
The present study examines the impact of market concentration and diversification on the firms’ performances in the Indian chemical industry. The chemical industry is important in shaping the Indian economy. It is one of the oldest industries and contributes remarkably to India’s growth story. The chemical sector is one of the pioneering areas whose product base impinges on virtually every aspect of our lives. The chemicals sector is seen as a vital enabler for other industries in developing economies because demand for chemicals is directly proportional to the level of economic activity (Ray & Miglani, 2018). The chemical industry in India has a wide range of segments such as chemicals, petrochemicals, agrochemicals, speciality chemicals, colourant chemicals, bio-pharma, bio-agricultural, bio-industrial products, and pharmaceuticals. They are highly diversified and spread across multiple segments. These segments are heterogeneous in their character and widely dispersed in nature (Adhia, 2011). The Indian chemical industry is Asia’s third biggest manufacturer and the world’s seventh largest producer of chemicals. India is also the world’s third biggest producer of agrochemicals. In 2015–2016, the sector accounted for almost 2.39% of the gross value added (at 2011–2012 prices), while the industry’s share of the manufacturing sector’s gross value added (at 2011–2012 prices) was 13.38% in the same year (Government of India, 2017). During 2015–2016, the sector’s overall output of key chemicals, including petrochemicals, was valued 23.9 million tons (MT), while polymer production was at roughly 9 MT and has increased significantly over the years. The Indian chemical industry has also shown extraordinary development in increasing exports and exploring new markets for extending its bases, although the sector still imports a large portion of chemicals to fulfil India’s needs. The chemical sector contributes to around 14% of overall exports and 9% of total imports. India’s chemical industry is immensely diversified, manufacturing about 80,000 chemical products. The Indian chemical industry’s R&D intensity was about 0.9% in 2007–2008, with the knowledge-intensive chemical sector accounting for 4.5%, the specialty sector accounting for moderate growth of 1%, and the basic chemical sector accounting for 0.5%. The segments of the Indian chemical industry have exhibited various threshold constraints for incurring R&D expenditures, with pharmaceutical businesses spending the most on R&D, while fertiliser industries spending the least. In India, chemical companies have prioritised sustainable development, resulting in significant investments in innovative technology. It is vital to meet the growing need for a technology-driven business environment. As a consequence, there is a strong incentive to develop a long-term sustainable business model. The traditional innovation process in the chemical industry has been beneficial, but in today’s more dynamic and digital world, the digital revolution has the potential to shift the chemical sector toward new business models, driven by digital ecosystems that mix goods and services made possible by technology (Dickson et al., 2020). The chemical industry is also developing new goods in response to market demand. The industry has created microbial decolourisation and degradation techniques, as well as initiated biodiversity research for natural dyes and the creation of ecologically friendly synthetic dye methodologies. As demand for environmentally friendly alternatives increased, businesses were driven to adopt more environmentally friendly options. Hindustan Petroleum Corporation Ltd (HPCL), a public sector refiner, has expressed a desire to offer green lubricants made from renewable feedstock. Many corporations, like DuPont and Tata Chemicals, are aiming to develop knowledge and innovation centres in India as part of their R&D strategy, concentrating on themes such as green refinery operations and emerging green technologies such as nanotechnology, fermentation and biofuels. Chemical businesses that redesign innovation by accelerating digital capabilities, concentrating on collaboration and engaging with ecosystem stakeholders may be effective in lowering overall costs and developing new products that consumers need rapidly and that produce long-term value (Dickson et al., 2020).
There are ample number of studies that investigate the firm-level issues related to firm diversification, concentration and firm performance in the case of the manufacturing industry (see, for instance, Geer & Rhoads, 1976; Gort, 1962; Kawakami, 2017; Kendrick, 1961; Lee, 2007). Similarly, another strand of literature examines the link between firm strategy, firm diversification and firm performance in the case of Indian manufacturing (Bhatia & Thakur, 2018; Mohindru & Chander, 2010; Purkayastha, 2013; Ravichandran & Bhaduri, 2015). These empirical studies found mixed evidences with regard to the relationship between firm diversification/concentration and firm performance.
The novelties of the present study are as follows: First, although reasonable studies in India examined the relationship between firm diversification and performance, to the best of our knowledge, except for Sahu (2017), none of the studies focuses on the Indian chemical industry. Sahu (2017) examines the effect of diversification on firm’s performance in India’s chemical Industry by focusing on Tobin’s Q. However, we examine the impact of firms’ diversification and concentration on productivity and profitability of the chemical industry. Second, the measurement of total factor productivity (TFP) is core to the firm’s performance, which the present study emphasises using the Levinsohn and Petrin (2003) (LP) approach. Third, this study not only reviews the impact of these organisational strategies on a firm’s performance, but carries out a comparative analysis of both these strategies (concentration and diversification) on firms’ performance by using recent data, which will help in policy-making decisions. Finally, the present study also examines the link between the firm diversification and market concentration on profitability (return on assets (ROA)) of the Indian chemical industry and compares both these organisational strategies on firms’ performance.
The study offers the following insights: First, firm diversification negatively affects the TFP, but it has a positive and statistically significant effect on profitability. Second, market concentration tends to have a positive impact on both TFP and profitability. Third, by comparing both the organisational strategies, this study finds that the market concentration strategy proved to be a better strategy to further enhance firms’ performance in the case of the Indian chemical industry.
The rest of the paper is organised as follows. A review of the literature is followed by a brief summary of the data and methodology. Following that, the empirical findings are presented and last section concludes.
Literature Review
The frequent change in market dynamics pushes for re-investigation of diversification and market concentration with the firm’s performance. The classical theoretical underpinning for diversification was in a frame of economies of scope (Kawakami, 2017). The economies of scope principle helps firms to cost-effectively produce different products simultaneously rather than manufacturing them separately. Hence, it makes diversification a way for achieving operational efficiency and gives the firms competitive advantages (Su & Liu, 2016). The diversification is centred on the ability to seek market for the firm’s excess productive factors by exploring beyond the firm’s current scope, which helps firms extract maximum rents (Montgomery & Wernerfelt, 1988). The company’s core competence plays a key role in planning diversification strategies. The nearer (further) a firm diversifies to its core competency, the greater (lesser) the benefits it tends to reap (Eckel & Neary, 2010; Prahalad & Hamel, 1990). Thus, diversifying away from its core competencies lowers firm productivity (Penrose, 1959). Ravichandran et al. (2009) termed diversification as an effective strategy for the firm’s growth
The inefficient labour theory and inefficient capital theory are the two most influential theories explaining the relationship between a firm’s productivity and diversification strategy (Morris et al., 2017). The inefficient labour theory states that diversification makes the organisation more complex and broader, thus creating a communication gap between the management and employees and leading to an overall reduction in labour productivity. The lack of synchronisation between segment-level management and the firm’s complex hierarchies only worsens the case (Morris et al., 2017). The inefficient capital theory states that diversification has a higher tendency of misallocation of the resources among the segments. It tries to subsidise or supports the unproductive segments by compromising the productive segments. Ravichandran (2009) and Claessens et al. (2003) attempt to raise their concern about the inefficiency of the capital allocation among the diversified segments. The market concentration plays a vital role in determining a firm’s productivity as well. The structure–conduct–performance (SCP) hypothesis can explain the relationship between the market concentration and the firm’s performance (Samad, 2008). The theory can express a link between the market structures of an industry with that of its conduct, which in turn improves the firm’s performance (Barthwal, 1984). The SCP hypothesis posits a specific causal relationship between market structure, conduct and performance. Market structure determines the market conduct, and market conduct, in turn, determines the firm’s performance (Lee, 2007). Market structure, conduct and performance is a two-way approach. Performance, measured using productivity and profitability, impacts the market structure (Greer & Rhoades, 1976; Singh, 1985). The SCP hypothesis suggests that a higher market concentration will lead to a higher degree of collisions, enhancing firms’ profit-earning capacity (Fenny & Rogers, 1999).
A significant stream of literature tried to empirically check these theoretical underpinnings of the impact of diversification and concentration on firm’s performance. There are papers examining the link between diversification and productivity (Berry, 1971; Jang et al., 2005; Kawakami, 2017; Khanna & Palepu, 2000; Mitton, 2012; Montgomery & Wernerfelt, 1988). These studies provide mixed evidence. For example, Berry (1971) and Jang et al. (2005) found a positive relationship, whereas Montgomery and Wernerfelt (1988), Mitton (2012) and Kawakami (2017) found a negative relationship. Khanna and Palepu (2000) found that a firm’s performance initially declines but subsequently increases as diversification increases. Similarly, another group of studies for developed countries found no evidence as well (Fenny & Rogers, 1999; Gort, 1962). Sambharya (1995) investigated the individual strategies of diversification (product and international) on performance and reported that while the individual effect was negligible, the combined effect substantially increased the firm’s performance.
Similarly, with regard to the Indian manufacturing sector, Lal (1979) and Bhatia and Thakur (2018) also empirically examined the link between diversification and productivity and they found a positive association. However, a few studies by Mohindru and Chander (2010) and Sahu (2017) found a negative relation. Another strand of literature also examines the effect of market strategy/market concentration on firm’s profitability (Greer & Rhoads, 1976; Kendrick, 1961; Round, 1980; Singh, 1985; Weiss, 1963). Greer and Rhoads (1976) and Singh (1985) found a positive relationship between market concentration and productivity, while an insignificant relationship was recorded by Weiss (1963) and Kendrick (1961). Round (1980) found a positive and significant relationship between concentration and profitability at three- and four-digit aggregation, while Dixon (1987) discovered an insignificant relationship between market concentration and profits.
Methodology and Data
Methodology for Estimating TFP
To examine the link between a firm’s diversification and market concentration on performance, one needs to estimate the firm’s performance primarily. The performance in our study is measured by two different variables, TFP and ROA. The ROA is measured as the ratio of earnings before interest and taxes to total assets, and this variable is treated as the profitability, while for computing TFP, the LP methodology is used. In the measurement of productivity literature, the TFP estimated through the Cobb–Douglas (C-D) production function and using ordinary least squares (OLS) has many shortcomings. The production function estimations using OLS result in biased and inconsistent estimates of independent variables because of the possible correlation between input variables and the unobserved firm-specific productivity shocks in estimating production function parameters (Levinsohn & Petrin, 2003). The OLS also fails to address this problem of endogeneity between the independent variable and the error term, as it assumes that independent variables are uncorrelated with the unobserved omitted variable. Thus, to overcome this issue, LP methodology is used (Sharma & Mishra, 2015; Thomas & Narayanan, 2016). The LP methodology uses a proxy variable to overcome the simultaneity bias. Levinsohn and Petrin (2003) used energy as the proxy variable in their study. The production function under LP methodology is of the form:

where y, l, k, m and e represent output, labour input, capital stock, material, and energy consumption of the firm, respectively. Energy is taken as a proxy, and ωt denotes the unobservable part of the productivity shock correlated with firm-level inputs. ηt is a measurement error, which is uncorrelated with input choices. A slight modification of the production function () is done to avoid endogeneity bias, and it is written as:

where Ф is non-linear in capital and energy inputs and linear with variable inputs. The firm’s energy demand function is denoted as et = et (ωt, k). Given its capital stock, the demand function is monotonically increasing in productivity. The inversion of the energy demand function gives the function of the unobservable productivity term (ωt) as ωt = ωt (et, kt).
Rewriting Equation (2) yields:

The error term (ηt) is not correlated with the inputs. After following LP derivation step by step, we obtain the required coefficients of inputs used in the production function. Using the estimated coefficients of the production function, TFP is calculated as

where TFP is the total factor productivity of the ith firm in industry j and time t.
Dynamic Panel GMM Model
After estimating TFP using the LP methodology, in the second stage, we examine the impact of diversification and market concentration on TFP and ROA using the dynamic system-generalised method of moments (S-GMM). In this study, we apply panel data analysis, as it is widely used to establish the dynamic relations among the variables. The study uses a dynamic panel model because it has several advantages over OLS estimation, which is more unlikely to control for unobserved heterogeneity and simultaneity bias. Hence, OLS yields less satisfactory parameter estimates (Blundell & Bond, 1998; Bond, 2002). The difference-generalised method of moments (D-GMM) is said to remove the unobserved effects, but its sample bias (for small and large) and low accuracy still exists (Alonso-Borrego & Arellano, 1999) while S-GMM estimates avoid the finite sample bias and suggest the inclusion of momentum conditions. In D-GMM, further use of lags only generates weak instruments (Staiger & Stock, 1997).
The present study first examines the impact of diversification on TFP and then its impact on profitability (ROA). The dynamic panel data (S-GMM) model can be written as follows:

where TFP
it
is total factor productivity, δ and βs are the unknown parameters that need to be estimated, and xit represents a vector of explanatory variables like diversification (Div), Export Intensity (EXPINT), R&D Intensity (RDINT), AGE, Firm Size (SIZE), Leverage (Lev) and Policy. ni is an unobserved firm-specific effect, fit is the error term, and the subscripts i and t represent firm and time period, respectively. The study uses the entropy index for measuring diversification, while other variables like Export Intensity, R&D Intensity, AGE, Firm Size, Leverage and Policy are treated as control variables. Similarly, the model for the profitability equation can be written as follows:

where ROA is a profitability measure used in Equation (6). All other variables remain the same as explained in Equation (5). In the next step, to examine the impact of market concentration on firm’s performance (TFP and profitability), we write the following equations:

where the Herfindahl–Hirschman Index (HHI) is the measure for market concentration, and all other variables are already defined in Equations (5) and (6). Finally, we replaced TFP with profitability (ROA) and examined the effect of market concentration (HHI) on profitability by Equation (8).

Data and Measurement of Variables
The present study uses the annual data for the period 2000–2016. The study is based on data extracted from the Prowess database published by the Centre for Monitoring Indian Economy (CMIE) Pvt Ltd, EPW Research Foundation, and Annual Survey of Industries (ASI) database published by the Ministry of Statistics and Programme Implementation (MoSPI), Government of India. A detailed analysis based on 303 firms is carried out after filtering out firms with unavailable data points. The real gross sales are used as a measure for output. Similarly, expenditure on raw material, labour, capital and expenditure on power and fuel is used for measuring TFP. The wholesale price index (WPI) with the base year as 2004−2005 have been deflated to obtain the real values. The PROWESS database does not directly provide firm-level data on the number of its employees. Hence, we use the information on the wages and salaries of the firm and divide them by the average wage rate of the industry to which the firm (NIC two-digit level) belongs (see, for instance, Rath, 2018; Sharma & Mishra, 2015). The average wage rate can be obtained by dividing total emoluments by total persons engaged for the relevant industry using the ASI data extracted from the EPW Research Foundation database.
Number of workers engaged per firm = Salaries and Wages/Average Wage Rate Average Wage Rate = Total Emoluments in an industry/Total persons engaged in the same industry
We in the next step measure the capital stock series by employing the perpetual inventory method (PIM). The measurement of a capital variable using the PIM is a standard practice in the review of the literature. The formula for PIM can be written as:

where Kt is the capital stock at year t, It is a gross investment at year t, and δ is the rate of depreciation, which is taken at 7%, as consistent with other studies for India (see, for instance, Sharma & Mishra, 2015). The initial capital stock equals the net book value of the capital stock for 2000. The following expression measures the gross investment:

where Bt = book value of fixed capital in the year t, Dt = depreciation in the year t, and Pt = price index of machinery and machine tools (Base 2004−2005 = 100), which has been extracted from National Account Statistics. EXINT is measured by dividing the total export by gross sales, while the ratio of R&D expenses to gross sales gives us the RDINT of the firm. Firm age (AGE) is constructed by taking the difference between the year of the study and the year of incorporation of the firm, and Leverage (Lev) is measured as the ratio of total debt to total assets. The firm size (SIZE) is taken as the three-year average of a company’s total income and total assets. The value obtained then deflated, and a log of the deflated term is taken as the size of the firm. The value of sales is deflated using the appropriate WPI (2004−2005 base). For measuring policy, dummy ‘0’ for the year 2000–2004 and ‘1’ from 2005 were used. The year 2005 is significant as a major regime change in India related to intellectual property was adopted. The ROA is measured as the return (earnings before interest and tax) on total assets and commonly used for measuring profitability. The Herfindahl-Hirschman Index (HHI) is the measure of market concentration. HHI is the sum of the squares of the relative sizes of the firms in the market, where the relative size of the firm is a proportion of the total size of the market. The HHI is defined with the following formula in Equation (11).

where Pi = si/S, si is the firm’s sales of the ith firm, and S is the total sale of all the firms in the industry. Similarly, the diversification is measured by the Entropy Index (Div), which was developed by Jacquemin and Berry (1979). The equation for measuring diversification using the Entropy Index can be written as:
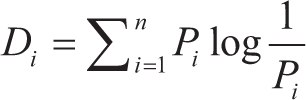
where Pi is the ratio of the firm’s sales in the ith industry to the firm’s total sales in n industries.
Results and Discussion
The descriptive statistics are summarised in Table 1. TFP and ROA are used for measuring firm performance in this study. The average TFP is 0.63, and the standard deviation recorded is 0.71. ROA shows an average of 2.29, and the standard deviation accounts for 3.77. Table 1 also shows that the mean age of the firms is 41 years, and the standard deviation is 16. The oldest firm is 117 years old, and the youngest firm is 13 years old. Table 1 even highlights the market concentration of the chemical industry, which exhibits a mean value of 0.21, which implies that the industry is moderately concentrated (Naldi & Flamini, 2014). The export intensity shows that the average value of the sample is 17.70. The mean value of R&D intensity is around 0.68, with a standard deviation of 3.67. Similarly, the average of firm size is around 7.11. The mean value of the diversification is 0.05, and the standard deviation is 0.10.
After presenting the summary statistics in Table 1, the study presents the main empirical results in the next step.
Descriptive Statistics.

Table 2 presents the effect of firm diversification on TFP. The significant negative coefficient between entropy and productivity indicates that the higher the diversification, the lower the firm’s productivity. The reason can be attributed to the ‘new toy’ effect (Schoar, 2002). The ‘new toy’ effect explains that a firm’s new venture may attract a greater allotment of resources and attention, increasing the productivity of the new firms at the cost of the incumbent firms. The ‘new toy’ effect attracts that a firm's new venture may attract a greater allocation of resources and attention, improving the productivity of the new enterprises at the expense of the incumbent firms thereby reducing the overall productivity of the company. The other reasons can be neglect of core competency of the firms or expansion away from their specialisation (Prahalad & Hamel, 1990). Table 2 also shows a positive relationship between firm size and TFP, implying that the increase in the size of the firm will see a rise in the firm’s productivity. The size increases improve productivity due to the economies of scale and cheaper and easier availability of capital stock (Bhatia & Thakur, 2018; Sahu, 2017). The larger firms may adversely impact productivity due to the larger firms’ inherent managerial inefficiencies (Jang et al., 2005; Shyu & Chen, 2009). For Leverage, the results show a negative association with productivity, implying that an increase in debt can increase borrowing costs, reducing the firm’s investments in productivity-enhancing activities (Bhatia & Thakur, 2018).
Table 2 also shows a positive and significant impact of Patent regime change (Policy) on the firm’s productivity. Some of the control variables like AGE, Export Intensity and R&D Intensity are found to have an insignificant impact on a firm’s productivity. Moreover, the Wald test is significant, which infers the overall significance of the model. The insignificant AR(2) test shows that there exists no second-order autocorrelation. The test implies that the model is specified correctly, and the transformed error term does not exhibit second-order autocorrelation.
Impact of Diversification on Total Factor Productivity.
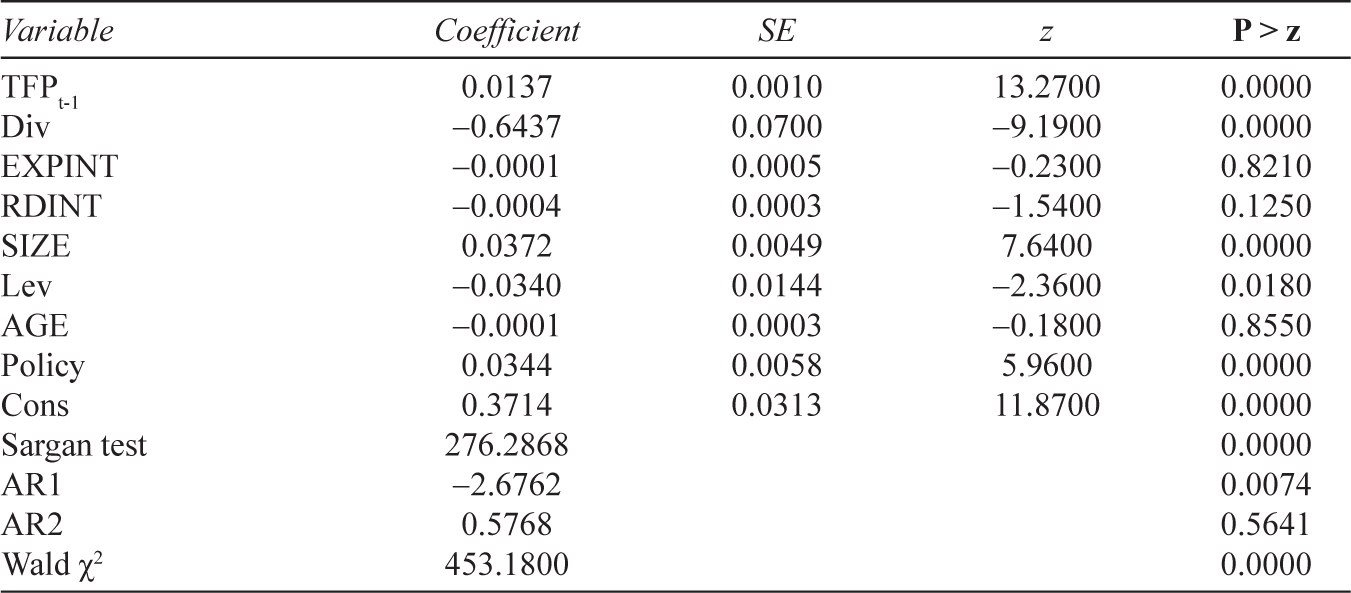
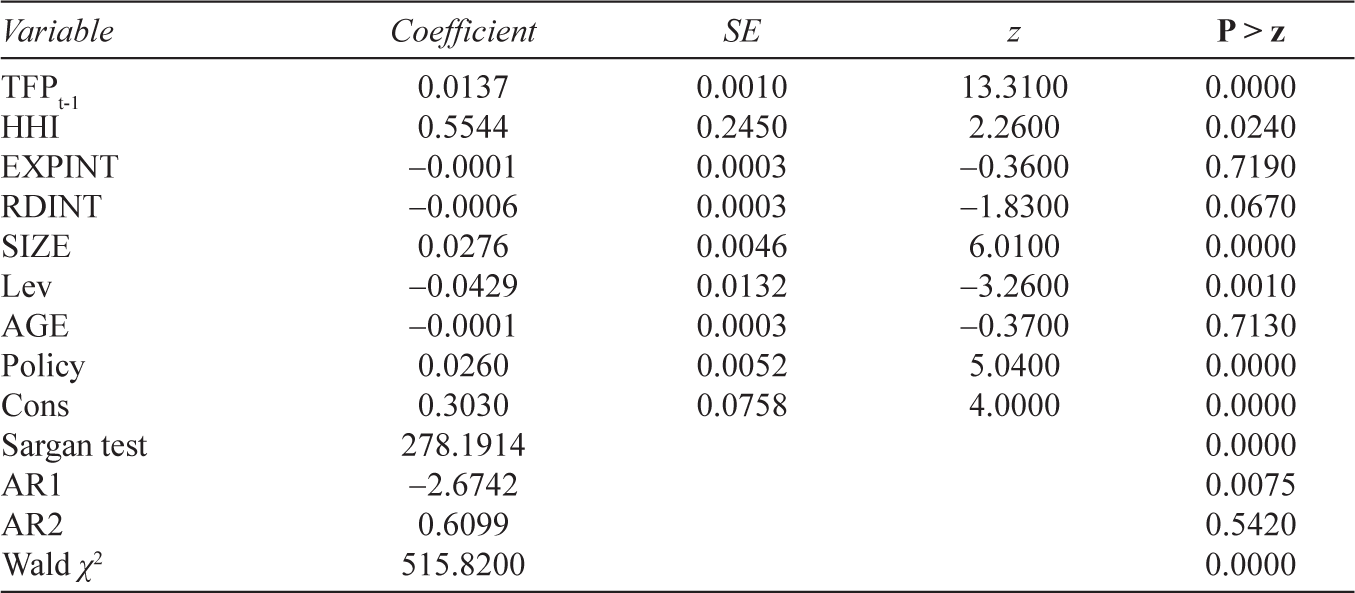
Table 3 shows that the market concentration (HHI) is positively related to the TFP. The HHI coefficient is 0.81. The positive relationship is attributed to the firm’s efficiency (Fenny & Roger, 1999). A firm can capture a higher market share only to improve a firm’s efficiency. The more efficient the firm is, the more productive it tends to be. The higher concentration will induce firms to earn higher monopoly profit, which will in turn generate more increased innovation. These innovation techniques lower unit costs and increase the productivity and profit of the firm (Singh, 1985). Scherer (1984) even argued that higher concentration pushes the firms to have greater R&D intensity, which would increase the firm’s productivity. The export intensity exhibits a positive but insignificant impact on TFP. The R&D intensity has a negative but significant relationship with TFP. The negative relationship between R&D intensity and productivity is an exception to the existing theoretical literature. However, some studies have found a negative relationship between R&D intensity and productivity (Jang et al., 2005; Sahu, 2017). Firm size shows a positive and significant relationship with TFP, as large firms can carry out larger innovation activities and, in turn, improve their productive bases (Singh, 1985). Leverage negatively and significantly impacts the firms’ productivity and diversification strategy. Post policy regime change tends to be positive and considerably impacts productivity. The significant Wald test shows that the model is significant.
Impact of Market Concentration on Total Factor Productivity.
After investigating the impact of diversification and market concentration on firm-level productivity, this study further examines the effects of market concentration and diversification on firms’ profitability. The results obtained from the dynamic panel S-GMM model are presented in Tables 4 and 5.
Impact of Diversification on Profitability.
Impact of Market Concentration on Profitability.
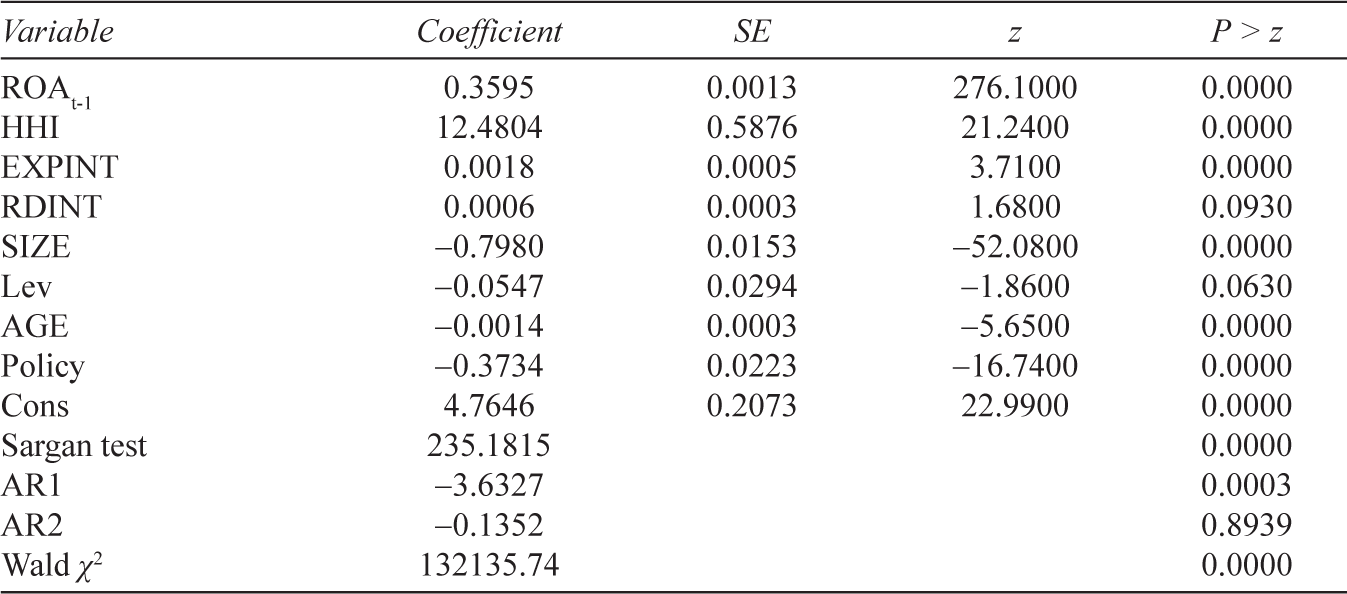
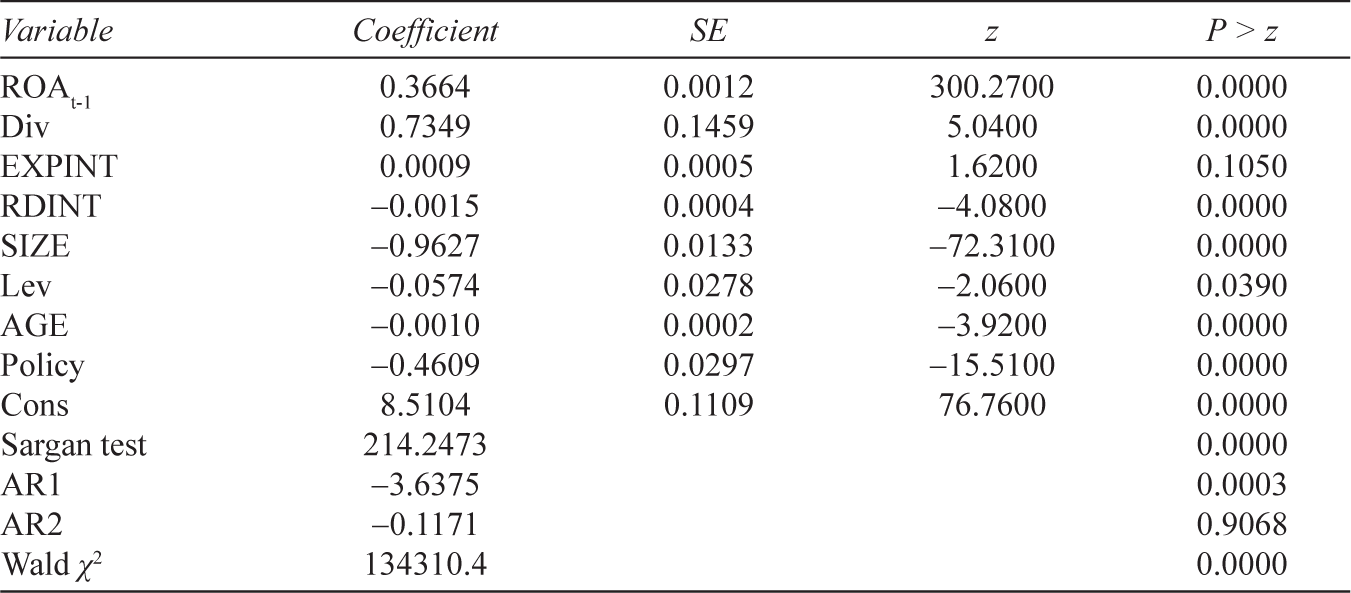
Table 4 shows a positive and significant relationship between diversification and ROA, implying a positive impact on the firm’s profitability due to the diversification strategy. This positive relationship can be due to the firm’s ability to use excess resources in more productive and profitable ventures (Booz et al., 1985; Fenny & Rogers, 1999). The ability to utilise their internal capital markets can give diversified firms more profits (Bhatia & Thakur, 2018; Fenny & Rogers, 1999). The diversification strategy also gives firms an added ability to maintain competitiveness in the market place, hence higher profit generation for the firm (Penrose, 1959). The Table 4 also shows a negative and significant relationship between R&D intensity and performance. The coefficient in the study is an exception to the existing theoretical literature.
Table 4 also shows a negative and significant relationship between R&D intensity and performance which is exceptional to the majority of the existing theoretical literature. Nonetheless some empirical studies have found a negative impact of R&D on profitability but turned out to have an insignificant impact on a firm’s profitability (Sahu, 2017). The firm size negatively impacts profitability, perhaps due to the inherent managerial inefficiencies, which increase due to the increase in the size of the firm (Jang et al., 2005; Shyu & Chen, 2009). There is an adverse impact of leverage on profitability. An increase in debt increases the cost of borrowing, reducing the firm’s investments in productivity-enhancing activities and the firm’s profitability (Bhatia & Thakur, 2018; Mohindru & Chander, 2010). The age of the firm shows a negative relationship to ROA, as machines witness ‘wear and tear’ over the years, affecting plant efficiency and, in turn, its profits (Jang et al., 2005; Mohindru & Chander, 2010). The table shows that change in the Patent regime affected a firm’s profitability adversely. The new patent regime forces firms to increase their investment in R&D. The increase in manufacturing cost can lead to a reduction in demands hurting profits. The significant Wald test shows that the overall results of Table 4 are perfectly fine. The insignificant AR(2) test indicates that there exists no second-order autocorrelation.
Table 5 shows the effect of market concentration on firm’s profitability for the chemical industry. The S-GMM panel data analysis shows a positive relationship between market concentration (HHI) and profitability. The results also reveal that export intensity and R&D intensity positively affect profitability, whereas all other control variables negatively affect it. Market concentration has a positive impact on profitability. The higher market concentration can lead to greater R&D intensity, which would increase a firm’s productivity, in turn increasing its profitability (Scherer, 1984). The export intensity, which is the ratio of the exports to total sales, has a positive impact on ROA. The exports tend to positively impact a firm’s profitability because an exporter tends to enhance its efficiency and product through cross-border experiences in modifying and standardising the product, making higher profits than domestic market-oriented firms (Purkayastha, 2013). R&D intensity also shows that an increase in R&D improves a firm’s efficiency, enhancing the firm’s profit.
Table 6 compares different organisational strategies and their impact on the firm’s performance in India’s chemical industry. The findings show that the chemical industry tends to be more productive when it is more concentrated, while the impact of diversification on productivity is negative. Thus, this study suggests that market concentration strategies can be more profitable than the diversification strategy.
Relationship between Organisational Strategies and Firm Performance.

Conclusions and Policy Implications
The study made an attempt to conduct an exploratory analysis of organisational strategies (diversification and concentration) on firms’ performances (productivity and profitability) in the case of the Indian chemical industry using annual data from 2000 to 2016. The study finds that diversification has impacted productivity negatively, whereas it has positively affected profitability. The reason can be attributed to the ‘new toy’ effect, neglect of the core competency of the firms and expanding into new ventures away from its specialisation (Prahalad & Hamel, 1990; Schoar, 2002). Similarly, market concentration tends to have a positive impact on both productivity and profitability. Finally, by comparing two organisational strategies, concentration as a strategy proved to be a better one to enhance productivity and profitability in the case of the Indian chemical industry.
Thus, it will be advisable for the chemical industry to refrain from adopting diversification as a corporate strategy to enhance their performance. Even though the diversification strategy does not show a downward spiral for the firm’s profitability, it may have an adverse impact in the future, as productivity does have a significant say in deciding the firm’s margins in the long run. However, firms can adopt market concentration as a corporate strategy to enhance their productivity and profit margins. The study emphasises that managers should make an informed decision before diversifying into areas beyond their scope to prevent them from any damaging setback.
Footnotes
Declaration of conflicting interests
The authors declared no potential conflicts of interest with respect to the research, authorship and/or publication of this article.
Funding
The authors received no financial support for the research, authorship and/or publication of this article.