



Abstract
Recently, the defense budget, which includes the cost of purchasing weapons, has continuously and significantly increased in South Korea. This increase, which is entirely financed by the government, has raised the issue of the socioeconomic impacts of spending on the defense industry in areas, such as production, added value and job creation. In this regard, it is necessary to more accurately measure the impact of spending on the defense industry on domestic industry, but the Bank of Korea’s industry inducement coefficient, which measures industrial spillovers, is quite limited in measuring the industry inducement impact caused by weapon production. Therefore, this study explores how to estimate the industry inducement coefficient of the production of a specific weapon by utilising the current Bank of Korea input–output table, which is focused on private industry, and applies this methodology to the estimation of the input–output coefficient of the production of a specific weapon. As a result of the analysis, the input–output coefficient of a specific weapon was estimated to be approximately 1.18 times higher than that of the products of similar industries in the private sector in terms of production, 1.03 times higher in terms of value-added and 1.03 times higher in terms of employment. This suggests that the effect of fostering domestic industry through weapon production is somewhat greater than that of private industry and proves the efficacy of government investment in this sector.
Keywords
Purpose and Research Question
Over the past ten years (2013–2022), South Korea’s military and defense budgets have increased significantly. The military budget increased from KRW 34.3 trillion in 2013 to KRW 54.6 trillion in 2022, and the defense budget for purchasing weapons within the military budget increased from KRW 10.1 trillion in 2013 to KRW 16.7 trillion in 2022 (Figure 1). Domestic weapons procurement is predicated on the capacity for mass production along with research and development (R&D). In other words, in order to meet the government’s demand for one unit of weaponry, the supply of intermediate and value-added goods that are inputted in order to meet this demand is necessary, and this induces production, value-added and employment in domestic industries. In other words, upstream domestic industry is fostered in the process of meeting the government’s demand for weapons. The importance of the economic aspects of the defense industry, such as production, value-added and job creation, has become a current issue, especially as the government’s defense budget increasingly accounts for a larger share of the national economy.
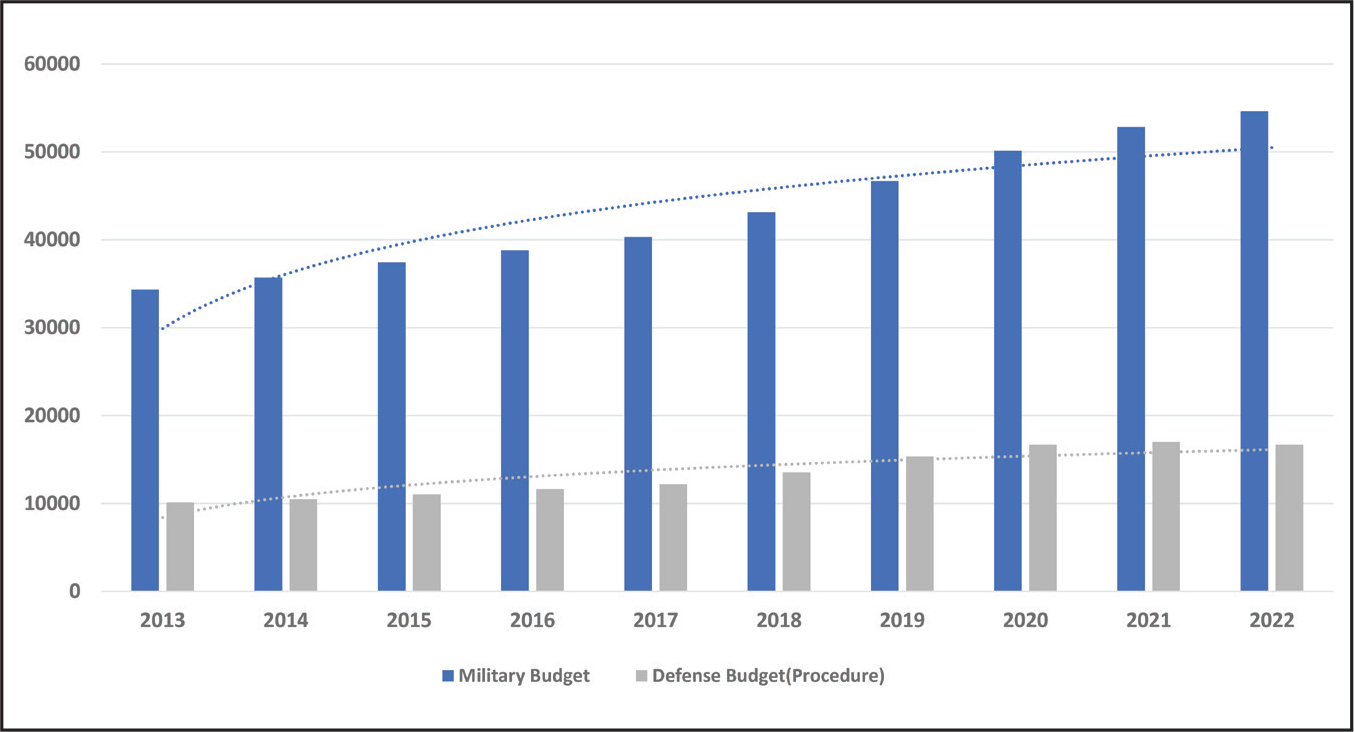
As the importance of the government’s financial investment in defense projects has been increasingly highlighted, the South Korean government has been conducting project feasibility studies on weapons acquisition projects since 2011, and these studies are required to analyse economic feasibility. In other words, the South Korean government’s weapons system acquisition projects must demonstrate the ‘economic feasibility of government fiscal investment’, establish an objective basis for their conclusions and assess the economic impact of such projects on the national economy, including industrial revitalisation and employment creation. In addition, the importance of economic aspects such as production, value-added and job creation on the part of the defense industry is becoming more important as the size of the government’s defense budget in relation to the national economy increases significantly.
To estimate the industry impact of defense projects, the South Korean government is using the coefficients of production, value-added and employment, which are contained in the input–output table provided by the Bank of Korea (BOK). The items in the input–output table are calculated by the BOK by examining the actual values of the industry inducement coefficient every five years. As the industry inducement coefficient is based on static analysis as the basic assumption and the inherent limitations of the input–output model, it does not reflect the fact of dynamic industrial development and the economies of scale due to mass production. Therefore, the BOK attempts to maintain the consistency of the industry inducement coefficient at a certain point in time on the basis of the input structure of actual production sites resulting from a dynamic technology input structure by producing an extension table every year. In other words, in order to minimise the limitations of the industry inducement coefficient, it is necessary to reflect the technology input structure in the actual production process as much as possible by updating it every year in the form of an extended table. The industry inducement coefficient is used worldwide in order to identify the downstream and upstream industrial structure and the characteristics of the supply chain because it makes it easy to identify the technology input structure of specific industries and products.
Despite the importance of technology input structure (Krishna, 2022; Yun, 2015), the industry inducement coefficient estimated by the current input–output table published by the BOK is limited in terms of quantitatively and accurately measuring the inducement impact of dimensions, such as the production and value-added generated by the demand for a single unit of weaponry. This is because the input–output coefficient is estimated by examining the input structure of the upstream industry, and this structure in relation to weapons production differs from that of general products (Meade, 2020).
This study was conducted with three research objectives. First, it was carried out in order to explore methodologies that can overcome the limitations displayed in the literature and to more accurately estimate the industry impact of governmental financial investment in the purchase of weapons on domestic industry. We will explore the methods and processes for estimating the industry inducement coefficient in the private sector and devise a methodology to estimate it in relation to defense projects or specific weapons. Second, the methodology employed in this study will be used to estimate the industry inducement coefficient for a specific weapon. The coefficients to be estimated are the production inducement, the value-added inducement and the employment inducement. Third, we want to understand the economic effect of the rapid increase in the government’s budget for defense projects compared to the effect of investment in general industry. This can be confirmed by comparing the differences of the former with the industrial-induced coefficients of similar private industries. In this way, the question of whether there are industrial benefits to the government’s financial investment in the defense industry will be addressed.
Theoretical Background and Literature Review
Theoretical Background
Input–Output Analysis
Industries in a country buy and sell goods and services from each other in order to carry out production activities, and thus they are economically interrelated. Input–output analysis is a framework for quantitatively analysing the impact of changes in economic sectors (production, consumption, investment, exports, imports, etc.) on industries by quantitatively identifying interrelationships based on the trade of raw goods between industries. Theoretically, an input–output model is a kind of general equilibrium model that delineates the output of all industries necessary to satisfy the total demand for the output of each industry that constitutes the national economy, without surpluses or shortages of products.
For example, if there is a demand for defense industry-related weapons, such as submarines, fighter jets and armoured vehicles, it not only leads to an increase in the production of the defense industry but also causes a chain reaction in the production of a number of directly or indirectly related industries that supply intermediate inputs to the defense industry. Primary production factors, such as labour and capital, and intermediate inputs for defense production lead to increased demand in related industries, such as steel and machinery parts, which in turn leads to increased demand for primary production factors and intermediate inputs to enable increased production in related industries, which itself leads to increased intermediate demand in the defense industry and increased demand in other industries.
As this chain reaction persists until the equilibrium of total demand equalling total supply is reached, input–output analysis is a kind of general equilibrium analysis that classifies and analyses how much the demand of each industry causes various industry impacts on areas, such as employment and production, by industry sector.
Basic Structure and Assumptions of the Input–Output Table
The origin of the input–output table, which is the basis of input–output analysis, is Quesnay’s economic table (Quesnay, 1758). The current table was developed by Leontief, and its theoretical basis is Walras’s general equilibrium theory. In 1936, Professor Leontief attempted to create an economic table representing the flow of goods and services in the US economy, and in 1941, he created and analysed the input–output tables of the United States in 1919 and 1929. Based on these developments, the United States published its first national input–output table in 1947, the UK published its first input–output table in 1948, Japan published its first such table as national official statistics in 1951, and South Korea has been publishing estimates for actual and interim years at five-year intervals since the BOK published its first input–output table in 1960.
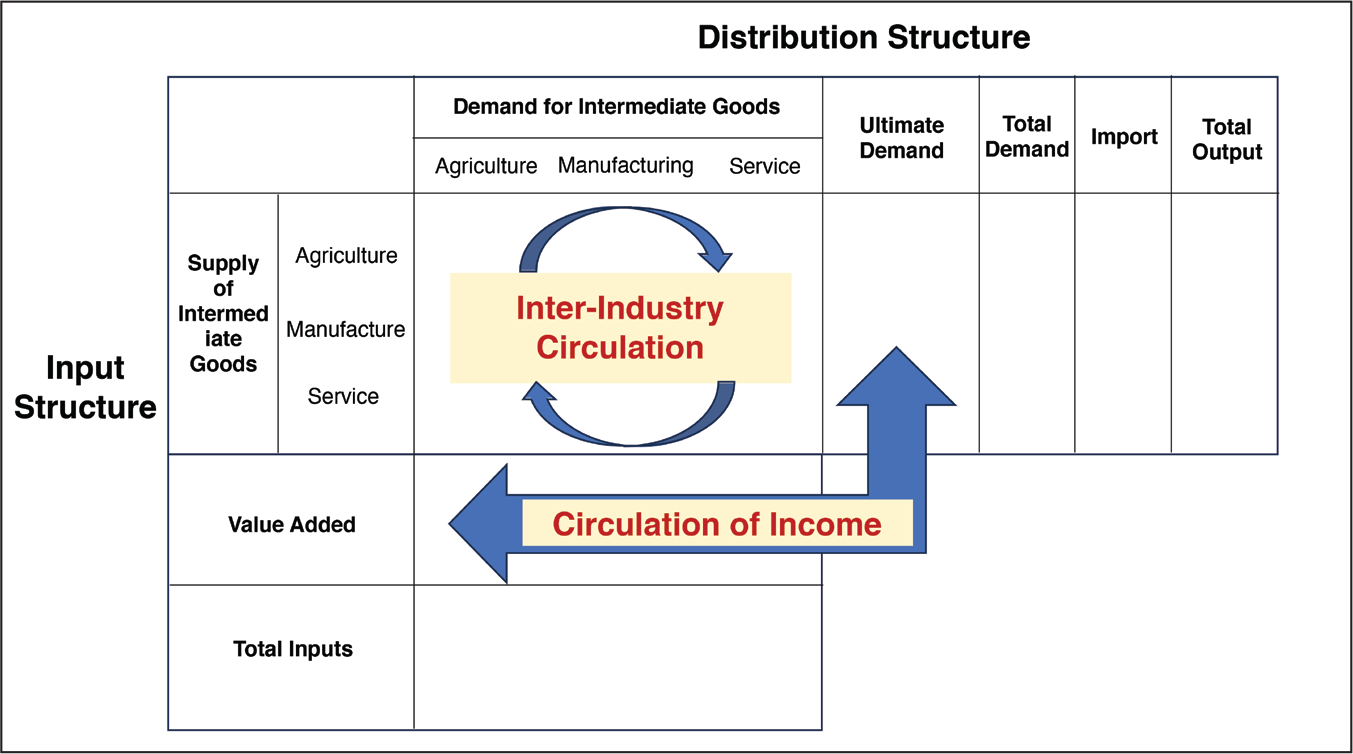
An input–output table is compiled based on the supply and demand balance of total input and total output for each industry and consists of the input structure and allocation structure of each industry (Figure 2). The input structure entails the composition of production costs incurred by each industry to produce goods and services and is divided into the ‘intermediate input sector’, representing raw goods inputs and the ‘value-added sector’ (including wages, profits, indirect taxes, etc.), which is the cost of purchasing primary production factors. The allocation structure entails the sectors that the output of each industry is sold to as a result of intermediate or final demand and is divided into the ‘intermediate demand sector’, which is the direct input for production, and the ‘final demand sector’ (including consumer goods, capital, exports, etc.), which is the final product (Almon, 2000; Bank of Korea, 2014, 2015; Hong, 2009).
This input–output table is based on the following four basic assumptions of economic theory (Miller & Blair, 2009). First is the absence of joint production, which assumes a one-to-one correspondence between output and industry, with each industry producing only one good or service. Second are the limitations of production technology, which assumes that there is only one production method for each product and that there are no technological alternatives. Third is the proportionality between inputs and outputs, which assumes that each industry has a proportional relationship between the number of inputs used in the production process and the number of outputs and that there are no economies of scale. Finally, the legalisation of production activities assumes that the sum of the effects of individual production activities in each industry is equal to the total effect of production activities in all industries and that there are no externalities or external diseconomies.
The above basic assumptions are the basis for the introduction of technical coefficients, which play a key role in input–output analysis by clarifying the relationship between industrial activities and securing linearity. The technical coefficient is the ratio of inputs to outputs (aij = xij/ Xj) given xij, which represents the flow of goods or services from industry i to industry j, and the total output of industry j. It is also called the input–output coefficient or (direct) input coefficient. If the input coefficient (aij) is fixed, the ratio between the input coefficient (aij/ akj) is also fixed, and thus the input ratio of all industries and the primary factors of production in industry j are fixed.
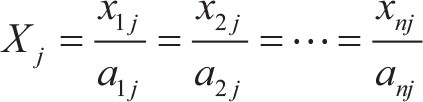
Based on the definition of input coefficients, the following ‘Léontief production function’ is derived. This function implies that a minimum quantity of intermediate inputs is required to produce a given good or service and that production is possible if the intermediate inputs amount to more than the minimum required, but impossible if one or more intermediate inputs are even slightly insufficient.

Industry Inducement Coefficient
The industry inducement coefficient used to calculate the economic impact of production in an industry is derived from the following series of equations, which represent each supply and demand equilibrium using the above input coefficients. Letting the production, input coefficients and final demand of each industry be Xi, aij and Fi, respectively, the supply and demand equations for n industries are as follows.

If the determinant of (I−A) is non-zero, then there is a unique solution, so given a specific value for final demand, the corresponding production level of each industry can be determined.
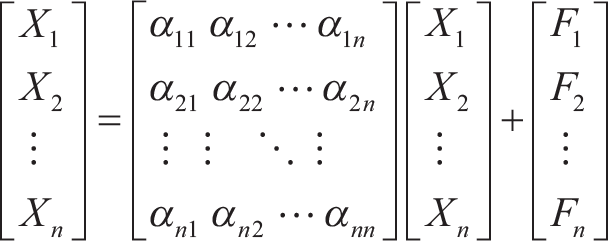
X = AX + F (However, A = [αij]: Input matrix)
X – AX = F
∴ X)–1 F =: Input–output analysis
(I – A)–1 = Leontief’s inverse or output inducement coefficient matrix
The output inducement coefficient is a multiplier that represents the industry impact of final demand. The sum of the intermediate goods required to satisfy F, the intermediate goods required to satisfy AF (A(AF) = A2F) and the required output (if the inverse matrix exists) can be expressed as follows:

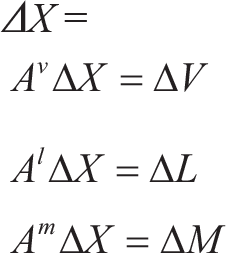
In input–output analysis, the interdependence between industries is based on technical interdependence, which means that the output of one industry (involving goods or services) is used as an intermediate input in the production process of other industries. In the real economy, these interdependencies lead to very complex cascading effects due to the existence of numerous industries, and the term ‘cascading’ has a double meaning. One is that an increase in production in one industry causes an industry impact on the production of many related industries at once, and the other is that this industry impact is not limited to the first effect observed (the direct effect), but develops sequentially and cumulatively over several iterations and includes secondary effects, tertiary effects and so on. In other words, this production-induced multiplier effect in the input–output model is due to the chains of interdependence between industries. This chain interdependence can also be specified in two directions, in terms of backward and forward linkages. The first is the backward linkage from the perspective of industry J, which demands intermediate inputs from industry I, and the second is the forward linkage from the perspective of industry I, which supplies intermediate inputs to industry J. In other words, if the final demand changes, the formula for calculating the final change in production through this chain reaction can be derived, as illustrated below. In addition, by applying the value-added coefficient and labour coefficient to this change in production, the induced effects of value-added and employment can be calculated.
Literature Review
There are survey, estimation and convergence methods for creating an input–output table, and there are previous studies based on these methods. First, the survey method has been used in the benchmark table for the BOK’s input–output table, which was developed by including sample individual industries and firms and by collecting and reflecting information on the input–output structure of industries through a survey (Bank of Korea, 2015). Although it is possible to reflect the input and output structure distinctions between industries through extensive surveys, there are weaknesses involved in terms of the practical difficulties and cost of surveys, and these issues are exponentially exacerbated as the industry classification is disaggregated. Next, the purpose of the estimation method is to identify the input–output structure of industries based on secondary statistics such as national accounts or industrial structure statistics, and it is used in the United States, China and Spain to create input–output tables for large, medium and small enterprises (Romero & Santos, 2007; Tang et al., 2016). It is the most efficient of the three possible methods because it relies on secondary statistics and mathematical techniques. However, it entails limitations in terms of reflecting changing inter-industry linkages and input–output structures because mathematical models utilising estimations are highly dependent on information from recent years. Finally, the convergence method minimises the disadvantages and maximises the advantages of both estimation and survey methods and combines a survey of firms representing individual industries with an estimation method based on secondary statistics (Lee et al., 2015, 2016). This method has advantages in terms of the time and cost required for extensive surveys, and it can produce a relatively realistic picture of the input–output structures of various industries compared to the results of the estimation method. On the contrary, the time and cost of selecting and surveying companies representing a variety of industries are relatively high compared to those of the estimation method.
However, there have been few studies that estimate the industry impact of weapons purchases using an input–output table. The most representative is Werling and Horst (2012), which analysed the economic impact of US defense budget cuts. At the time, major defense budget cuts were expected due to the US federal government’s automatic budget reduction measures (sequestration), which were designed to automatically cut the federal budget if the deficit was not reduced, and the study estimated the impact of the reduction in defense spending from 2012 to 2022 on production, employment, exports and value-added in the US economy. The study was conducted in four steps. In Step 1, procurement and R&D items were extracted from the defense budget expenditure items included in the US National Income Account. In Step 2, procurement and R&D data were used to derive the final demand of ninety-seven industries in receipt of the federal government’s defense expenditures. In Step 3, the input coefficient (A) and output (X) of a given product were derived using the US Make and Use Table. Finally, in Step 4, the economic impact was analysed through the input coefficients, output and final demand derived from Steps 1 to 3. As a result of the analysis, it was anticipated that the US federal government’s sudden defense budget cuts would have a significant negative impact on production, added value and employment in the US economy. It was estimated that the defense budget cuts would reduce the economic growth rate by 0.8% in 2014; the total amount of unemployment in the private sector would be about 1,010,000, and in the manufacturing sector, it would be about 130,000. Although the BOK’s study does not specifically address the defense industry, its input–output table separately estimated the input–output structure of large, medium and small enterprises (Korea Institute for Industrial Economics and Trade, 2014). The study utilised a total of six steps to create its input–output table. First, the total output and total input of large, medium and small enterprises were separately estimated (Step 1), and then the input, output and final demand of these sectors were adjusted (Steps 2–4). Next, the total transaction table (Step 5), the import transaction table and the employment table for each sector were developed (Step 6). The results of the analysis showed that small- and medium-sized enterprises generate more value-added and employment than large enterprises.
Design, Methodology and Approach
This study aims to derive the industry inducement coefficient for a specific weapon that the government is currently planning to purchase. (For security reasons, we cannot disclose the exact names of the weapons analysed.) In other words, we investigate the intermediate inputs that are used to meet the final demand for a specific weapon, divided into domestic and imported weapons, and further investigate the value added involved. For this study, we obtained and used the manufacturing cost statements of the top suppliers, along with those of the weapon system integrator of a particular weapon. The input–output table below was created using a convergence methodology that combines the BOK’s input–output table and the survey it is based on and was conducted by extracting the industry inducement coefficient of a specific weapon from the existing input–output table. The manufacturing of specific weapons was classified as an independent industry, and the input–output table was recapitulated in light of the results of the survey, which modified the input and distribution structure of the weapon involved (Table 1).
INPUT–Output Table (Specified Weapon).

For the purpose of constructing the table, a cost survey was conducted to accurately identify the input status of a specific weapon. The items to be investigated included annual sales, exports, domestic sales and a list of raw and subsidiary goods; purchases, including the quantity of domestic and exported goods; purchases of raw and subsidiary goods at home and abroad; purchasing sources and quantities of raw and subsidiary goods and expenses, including fuel, electricity, consumables and R&D costs. Next, based on the results of the cost survey, we created an input–output table for a specific weapon. This was accomplished through a six-step process, following the work of Werling and Horst (2012).
In Step 1, the total output and input of the sectors corresponding to the weapon analysed in the BOK’s input–output table were divided into the categories of private and military. In Step 2, industry-specific data were processed and the input section of the input–output table of the weapon to be analysed was adjusted. This was done by estimating the sector’s input coefficient using the added value of the weapon to be analysed and the information from the intermediate input sector. Step 3 involved adjusting the intermediate demand side, which is an endogenous side in the input–output table. Step 4 entailed adjusting the final demand side by rebalancing the import/export ratio and the investment sector ratio. In Step 5, the balance between each side was adjusted to create a total transaction table representing the input–output structure of the defense industry. Finally, in Step 6, the import transaction table and employment table were disaggregated by applying the import coefficient ratio by industry which was employed in the BOK’s input–output table (Table 2).
Procedure for Estimating Industry Inducement Coefficient.

Step 6 also involved estimating the direct and indirect production and employment inputs on the basis of the cost study and the process of completing the input–output table for a specific weapon. We also assessed how the estimated industry inputs for specific weapons differ from the inputs for private industry (Table 3).
Formula.

Results
In order to estimate the input rate for the analysed weapon, we identified the domestic and imported costs for intermediate goods and linked them to the subcategories of the BOK’s input–output table (Table 4). The annual goods cost of the analysed weapon was about KRW 110 billion, of which the domestic goods cost was KRW 77 billion, or 70.3% of the total, and the imported goods cost was KRW 33 billion, or 29.7%. In other words, the localisation rate of the analysed weapon was about 70.3%, which is somewhat high.
Correlation of the Cost of the Analysed Weapon with the Input–Output Table Data (Subcategories).

More specifically, the localisation rate, which is the proportion of domestic goods costs in total goods costs, varied by item, but some rubber products were the highest cost at 84.9% of total goods costs, and telecommunication and broadcasting equipment was the lowest at 61.4%. In particular, the weapon we analysed was most similar to ‘Telecommunication and broadcasting equip-ment’ (subcategory 351) in the BOK’s input–output table, followed by ‘Other fabricated metal products’ (subcategory 309) and ‘Other rubber products’ (subcategory 249).
Next, based on the domestic transaction table above, we created the domestic transaction table for a specific analysed weapon (Table 5). The input (vertical) sector was created by subtracting the domestic goods cost of an analysed weapon from the telecommunication and broadcasting equipment cost (subcategory 351) of the BOK’s domestic trade table in order to create the input structure of the analysed weapon. The output (horizontal) sector has values only in the Public Administration and Defence (subcategory 751) sector, which is the source of the only demand for the analysed weapon. The other approach is to use a new code number rather than separate it from an existing, specific industry code number. However, since there is no significant difference in the inducement coefficient value between the two, we use the method of separating the industry inducement coefficient of the analysed weapon from that of the existing private industry. The output (horizontal) sector has values only in the Public Administration and Defense (subcategory 751) sector, which is the only demand for the analysed weapon. The domestic transaction table can be deployed appropriately, considering that the only demand for weapons is from the South Korean military. In other words, due to the nature of the weapon, there is only one source of demand in South Korea. Since the government is also the supplier, the weapon is a form of bilateral monopoly where both supply and demand emanate from the same source.
Endogenous Sector Estimation Results of the Domestic Trade Table of the Analysed Weapon.

Next, we created the import transaction table in the same way (Table 6). The input (vertical) sector of an analysed weapon was created by subtracting its imported goods cost from the telecommunication and broadcasting equipment subcategory (351) of the BOK’s domestic transaction table, and the output (horizontal) sector was transcribed as 0 when there was no sector from which there was demand for the analysed weapon. In other words, in terms of imports, the table is based on the assumption that the weapon utilises the intermediate goods of the upstream industry, which has a fostering effect on the upstream industry but is not utilised in the downstream industry overseas, given that the weapon is currently utilised by the domestic military. The premise is that the import side impact of one unit of weapons production is economically equivalent to the upstream industry impact.
Estimation Results for the Endogenous Sector of the Import Balance Sheet of the Analysed Weapon.

Finally, the total transaction table was created by calculating the sum of the domestic transaction table and the import transaction table (Table 7). In the final demand sector, depending on the characteristics of the weapon analysed, the total input was assessed as intermediate demand from the Public Administration and Defence sectors, and the intermediate demand total was immediately converted into total output. If the weapons analysed are actually mass-produced in the future, there will be changes in the costs involved in consumption, investment and exports and imports in the final demand sector, but it is reasonable to assume that these costs are stable at present.
Endogenous Sector Estimation Results for the Total Transaction Table of the Analysed Weapon.

Additionally, we tabulated the figures in the value-added and employment sectors (Table 8). In the input–output table, the value-added sector consists of employee compensation, operating surplus, fixed capital consumption and production taxes (subsidy deductions). In the cost structure, employee compensation can be matched with labour costs, operating surplus with applied profit and fixed capital consumption with depreciation. However, production taxes cannot be calculated, so the assumption was made that they are equivalent to the production taxes of the intermediate input systems of similar industries.
Since the number of employees is published at the subcategory level in the BOK’s employment table Ji (2018), the number of employees in the ‘telecommunication and broadcasting equipment’ subcategory (351) was divided by the total output of the analysed weapon industry. Since the analysed weapons are not currently being produced, it is not possible to know with precision how much labour is required to produce them. Therefore, we calculated the number of employed persons necessary based on the assumption that the employment coefficient (employed persons/gross output) is similar to that of telecommunication and broadcasting equipment and goods which are most similar to the analysed weapon. The employment coefficient of the subcategory of ‘Telecommunication and Broadcasting Equipment’ in the BOK’s employment table is 1.27 people/10 billion won, so we calculated the number of employed people in this sector by the total output of the analysed weapon to 206 people (Table 9).
Estimated Value-added Sector Results for Analysed Weapon.

Results of the Employment Table for the Analysed Weapon.

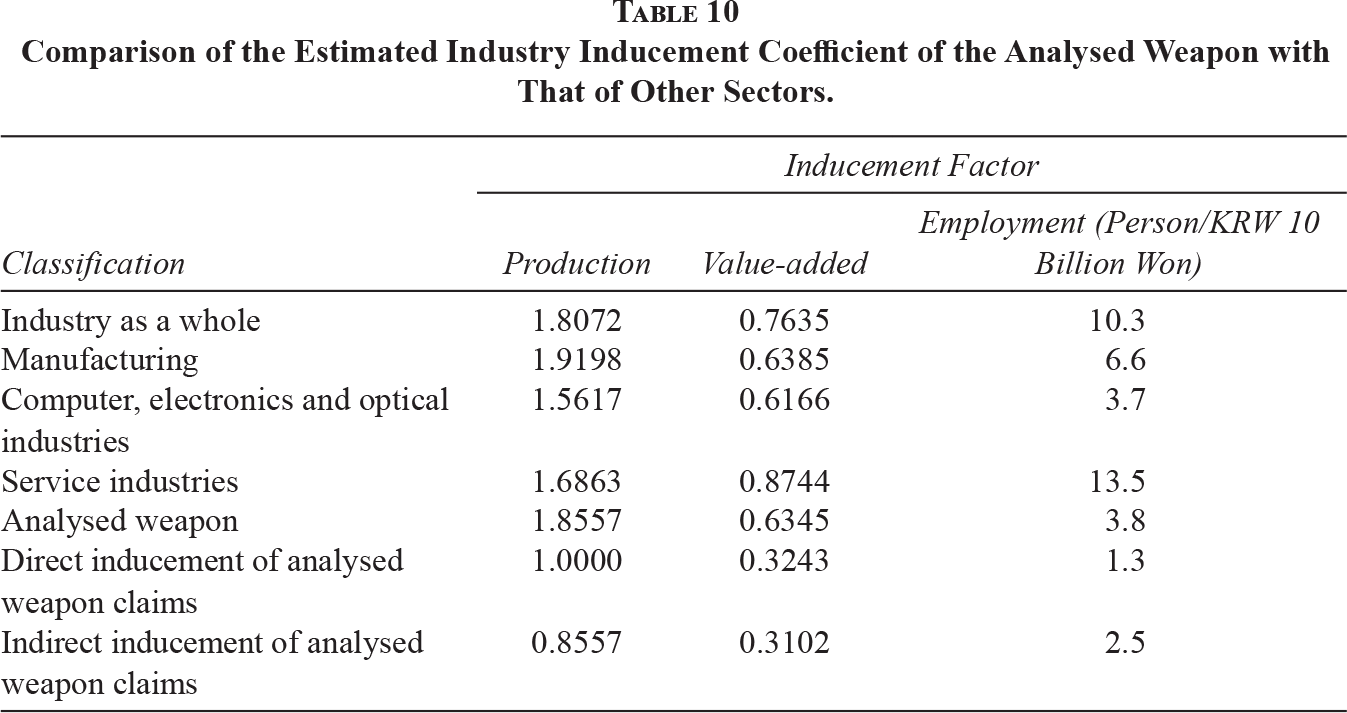
The above estimates were used to calculate the industry inducement coefficient of the analysed weapon. It was estimated to be 1.8557 for production, 0.6345 for value-added and 3.8 for employment. These figures are all higher than the industry inducement coefficient of the BOK’s subcategory ‘Computer, electronic and optical equipment’ (C09), the industry most similar to that of the analysed weapon in the BOK’s input–output table. In other words, the values for the analysed weapon are approximately 118.8% higher in terms of production induction, 102.9% higher in value-added induction and 102.7% higher in employment induction than those of similar products in the private sector. This is because the localisation rate of the analysed weapon is somewhat higher than that of similar civilian goods. In other words, the production of defense goods has a greater impact on industry than the production of similar civilian goods. In relation to industry, it can be seen that the localisation rate, which is the technology input structure of the upstream industry, determines the industry inducement coefficient. In other words, the production of defense goods has a higher industry impact on industry than the production of civilian similar goods. This can be an important basis for demonstrating the economic impact caused by the government’s rapid increase in defense budget investment.
However, the industry inducement coefficient of the analysed weapon is somewhat lower than the average of the manufacturing sector (Table 10). The production inducement coefficient of the analysed weapon is 1.8557, which is lower than the coefficient of the manufacturing sector of 1.9198, which is 96.7% of the manufacturing sector average. Meanwhile, the value-added inducement coefficient of the analysed weapon is 0.6345, which is similar to the manufacturing sector’s value of 0.6385 and is in fact 99.4% of the manufacturing sector’s average. Finally, the employment inducement coefficient of the analysed weapon, which indicates how many people are employed per billion won, is 3.8 people/billion won, which is 57.6% of the manufacturing sector’s average (6.6). In other words, the overall impact of the analysed weapon on domestic industry is rather low. This suggests that it is necessary to seek changes in the technology input structure of the domestic weapon industry. It also suggests that, economically, the impact of the government’s defense budget investment should be raised to the level present in private manufacturing. This requires global supply chain management, including open innovation (Patra & Krishna, 2015; Yun et al., 2015, 2016).
Comparison of the Estimated Industry Inducement Coefficient of the Analysed Weapon with That of Other Sectors.
Implications and Limitations
This study has examined the accuracy and reliability of industry impact analysis results, which are used as one of the decision-making tools in relation to the economic aspects of weapon system acquisition, by conducting a case study on a specific weapon currently being purchased by the government. As a result, it was found that there is a significant difference between the industry inducement coefficient of the production of those specific weapons and the industry inducement coefficient data on the private sector provided by the BOK. The reason is that the final localisation ratio of a specific weapon was around 75%, which is significantly higher than that of similar industries in the private sector. This suggests that it can be an error to apply the results of the industry impact of production projects in most private industries to weapon acquisition projects because of the high degree of specificity of the acquisition method (involving the convergence of development, production, operation and maintenance, facility costs, etc.) of weapon acquisition projects compared to general projects in private industry. In response to these issues, this study schematises the research process step by step through a case study that derives the industry inducement coefficient for a specific weapon and achieves a high degree of reliability by deriving impact coefficients that are consistent with specific industry characteristics. In this process, it suggests that the analysis method employed should vary depending on the nature of the project. This may entail approaching a product’s characteristics and components through decomposition, identifying imported intermediate goods through its manufacturing cost statement and identifying whether imported intermediate goods are used by suppliers, which is important for the purpose of making a more accurate estimation of the industry inducement coefficient.
However, this study has the limitation that it is necessary to examine weapons with somewhat different characteristics from the specific weapon analysed in this study in subsequent studies. The weapons analysed in this study have the characteristics of relatively uncomplicated products with simple components and high localisation rates, particularly weapons that are amenable to mass production without reliance on R&D. The results of this study show that the production and value-added inducement coefficients of such weapons are relatively high, and the employment inducement coefficient is low. In order to determine whether these results are due to factors specific to a particular weapon, it is necessary to further verify them by analysing different weapons. In other words, in order to take a standardised position on the industry impact of weapon production, analysis of various weapons is necessary (Tinbergen, 1966). For example, follow-up studies on weapon acquisition projects that include R&D and convergence weapons are needed. By estimating the industry inducement coefficient for weapon systems with more complex technology input structures, it will be possible to stabilise and standardise research methodologies and improve the accuracy and reliability of research results.
Footnotes
Declaration of Conflicting Interests
The authors declared no potential conflicts of interest with respect to the research, authorship and/or publication of this article.
Funding
The authors received no financial support for the research, authorship and/or publication of this article.