



Abstract
Understanding the effect of domestic macroeconomic forces on equity market is essential since macroeconomic forces have a systematic effect on the equity market returns. The present study uses monthly observations from India for the period from January 2012 to December 2019 to investigate the long-run and short-run relationship between the domestic macroeconomic forces and equity market. The study employed the autoregressive distributed lag (ARDL) bounds testing approach and pair-wise granger causality test to attain the objective. The long-run empirical results indicated that the Indian equity market and the domestic macroeconomic forces are cointegrated. The long-run coefficients of foreign exchange rate and money supply are found to be significant. The short-run coefficients suggest that money supply, inflation and foreign exchange rate significantly influence the Indian equity market. The study also observed the presence of feedback mechanism between foreign exchange rate and Indian equity market. The study provides the policy and managerial implications.
Keywords
Introduction
It is a widely held belief that stock markets are a barometer of economic development, and thus, stock market index is the appropriate indicator of the concurrent changes in an economy. Search through the existing literature reveals that industrial production, money supply, inflation, gross domestic product, foreign currency exchange rate, short-term and long-term interest rate and prices of precious metals are important macroeconomic forces that influence the movements of the stock market index. Naik and Padhi (2012), Patel (2012), Naik (2013), Tripathi and Seth (2014), Giri and Joshi (2017) and Bhattacharjee and Das (2020) documented the importance of macroeconomic forces in influencing Indian stock prices at various time frames, while Chen et al. (1986), Mukherjee and Naka (1995), Kwon and Shin (1999), Ibrahim (2003) and Ratanapakorn and Sharma (2007) provided empirical evidence from international stock markets. The aforementioned studies supported that the expectations of the portfolio holder about the future values of macroeconomic variables can influence the stock prices and macroeconomic variables become risk factors in their portfolio substitution. Thus, it is important to study the extent to which the macroeconomic variables influence the stock markets. Keeping this in mind, the objective of this study is to add to the existing empirical literature by investigating both the long-run and short-run relationship between a sub-set of macroeconomic forces and Indian stock market index over a period of eight years (from January 2012 to December 2019). The time frame of the study is such that it highlights the period after the recovery of the Indian economy from the sub-prime crisis. The period is also significant because, first, the period has no asset bubble and, second, the period has witnessed a number of policy measures undertaken by the government to strengthen the macroeconomic fundamentals. Some of the measures and economic achievements during the selected period include introduction of Merchandise Exports from India Scheme under the Foreign Trade policy, introduction of Make in India scheme and resultant improvement in the rankings of ease of doing business and India becoming the three-trillion dollar economy. Thus, studying the relationship between domestic macroeconomic forces and Indian stock market during the aforementioned time period is important and will be a valuable addition to our understanding of the dynamic relationship between domestic macroeconomic variables and Indian stock market.
Relationship Between Macroeconomic Forces and Stock Prices
Money Supply
According to economic theories, an increase in money supply increases the overall purchasing power in the economy. As the securities prices are determined by the free play of market forces, an increase in liquidity in the hands of investors creates more demand for securities and causes an upward movement in their prices. In other words, money supply and stock prices are positively related. The positive linkage between the two variables is documented by Mukherjee and Naka (1995), Al-Sharkas (2004), Menike (2006), Ratanapakorn and Sharma (2007) and Brahmasrene (2007).
Inflation
The long-run relationship between inflation and stock prices is ambiguous. According to the Fisher hypothesis, equity shares are claims against a business’ real assets and, thus, serve as a hedge against inflation. Fisher (1930) theorized a positive relationship between inflation and stock prices. On the other hand, Fama (1981) theorized a negative relationship between inflation and stock prices. Fama (1981) argued that inflation negatively affects the real activity, while real activity has a positive association with stock prices. Thus, with the rise in inflation, real activity falls; this depresses the stock prices. Thus, we can expect a positive relationship between money supply and Indian stock market, while inflation can either have a positive or a negative influence on Indian stock market.
Foreign Exchange Rate
The effect of exchange rate and stock prices is widely studied. Literature suggests that export firms benefit from weakening of the host currency, while the impact of such devaluation on the importers is negative (Fraser Pantzalis, 2004). In addition, the traditional approach, proposed by Dornbusch and Fischer (1980), theorizes that foreign exchange rate influences the stock prices, while the portfolio balance approach advocates that the direction of influence runs from stock prices to foreign exchange rate. Thus, from the above discussion, we expect either a positive or a negative relationship between foreign exchange rate and Indian stock market.
Interest Rate
Classical economic theory suggests that the interest rate is negatively related to stock prices. When the central bank of a country increases the bank rate, borrowing money from the central bank becomes costly for financial institutions. As a result, the financial institutions charge higher interest rates on the loan they lend to the firms. As a result, the firms cannot borrow as much they want, and overall capital investment in the economy dwindles. Reduction in business spending leads to lower profits, which, in turn, reflect in the firm’s security prices. Thus, changes in interest rate do not directly cause stock prices to depress; rather, it reduces the firms’ profits and the dividend expectations of investors. The negative relationship between interest rate and stock prices is documented by Maghayereh (2003), Menike (2006), Uddin and Alam (2010), Sirucek (2012), Aurangzeb (2012) and Bhattacherjee and Das (2020) for Jordan, Sri Lanka, Bangladesh, the USA, Pakistan and India, respectively. Based on the theory and empirical evidence, we expect a negative relationship between interest rate and Indian stock market.
Industrial Production
Producers respond to the reduction in consumer spending by decreasing their production. Thus, lower industrial production leads to lower profits and lower dividend expectations. As a result, demand for the securities decreases and the prices fall. On the other hand, increase in consumer spending means increase in production. People spend more and the earnings of the firms go higher. Higher profits will lead to higher dividend expectations, which, in turn, make the securities attractive. Thus, industrial production and stock market are positively related. On the basis of the above theory, we expect a positive linkage between domestic industrial production and Indian stock market.
Gold Price
The findings of Mishra et al. (2013) and Patel (2013) support the theory that when there is a sharp correction in stock prices, investors divert their funds from securities to gold. Thus, an inverse relationship is expected between gold price and Indian stock market.
The remainder of this study is divided into four sections. The section ‘Literature Review’ discusses the findings of the prior research, the section ‘Method’ provides operational definitions of the variables and the methodology involved in the analysis, the section ‘Results and Discussion’ reports the findings of the study and the section ‘Conclusion’ provides the concluding remarks.
Literature Review
This section discusses the major findings of the studies that investigated the relationship between macroeconomic variables and stock market performance. The selected studies provide a global as well as regional perspective regarding the relationship between domestic macroeconomic forces and stock market.
One of the initial studies that employed a multivariable framework to study the relationship between macroeconomic forces and stock market is that of Chen et al. (1986). They provided evidence that inflation, industrial production, term structure and change in risk premium have a significant bearing on the stock returns in the New York Stock Exchange. Aggarwal (1981) employed regression analysis to study the relationship between exchange rate and USA stock prices under the floating exchange rate regime and found a positive linkage between the variables. Mukherjee and Naka (1995) studied the dynamic long-run relationship between macroeconomic forces and Japanese equity market using the vector error correction model (VECM). The study revealed that the variables are co-integrated. It is further revealed that money supply, exchange rate, interest rate and industrial production positively affect the Japanese equity market. Kwon and Shin (1999) and Mookerjee and Yu (1997) studied the relationship between macroeconomic variables and equity markets in Korea and Singapore respectively. Both the study found evidence of co-integration between macroeconomic forces and equity markets. Soenen and Johnson (2001) used five-year data and ordinary least squares regression to study the impact of real output and inflation on Chinese stock prices and reported that inflation had no significant influence on the Chinese stock prices, while real output positively influences the stock prices. Ibrahim (2003) studied the long-run relationship between macroeconomic forces and Malaysian equity market in an environment of capital market integration. The findings of the study showed that the Malaysian equity market is co-integrated with the macroeconomic forces as well as equity markets of the USA and Japan. The co-integrating equation suggested that money supply, inflation and Japanese equity market have a significant positive impact on Malaysian equity market in the long run, while the USA equity market negatively affects the Malaysian equity market. Erdem et al. (2005) applied exponential generalized autoregressive conditional heteroscedasticity model to examine the volatility spillover from domestic macroeconomic variables to Istanbul equity market. The study found volatility spillover from interest rate, inflation, money supply and exchange rate to Istanbul equity market. Patra and Poshakwale (2006) investigated the relationship of inflation, money supply, trading volume and foreign currency exchange rate with the stock market of Greece. The study applied Johansen co-integration test, VECM and granger causality test and observed that the macroeconomic variables were co-integrated with the stock market. Ratanapakorn and Sharma (2007) found that Stock prices in the USA were positively linked with short-term interest rate, narrow money supply, inflation, industrial production and exchange rate while a negative relationship is observed between long-term interest rate and stock prices. Hussainey and Ngoc (2009) concluded that domestic industrial production positively affects the equity returns in Vietnam, further; USA industrial production and money market significantly influence the equity market of Vietnam. Ning et al. (2018) studied the relationship between the macroeconomic variables and stock market in mainland China and Hong Kong and found evidence of a long-run relationship between the variables. The granger causality test revealed that stock market in Hong Kong is influenced by foreign currency exchange rate only while in mainland China the foreign currency exchange rate and money supply are the key driving force.
The studies that are focussed on Indian equity market have also found significant impact of domestic macroeconomic variables on Indian equity market. Mishra et al. (2010) and Patel (2013) applied Johansen co-integration test and granger causality test to study the dynamic relationship between gold prices and Indian stock market and found the variables to be co-integrated. However, the former found the existence of bidirectional causality between the variables, while the latter found only a unidirectional causality from gold prices to Indian stock market. Pal and Mittal (2011) used 24-year observation to study the dynamic relationship of interest rate, exchange rate, gross domestic savings and inflation with the Indian equity market. The study revealed that a long-run equilibrium relationship exists between the variables. Naik and Padhi (2012) used unit root test, Johansen co-integration test, VECM and granger causality test to study the long-run effect of macroeconomic variables on Indian stock market. They observed that foreign currency exchange rate and interest rate have no significant effect on Indian stock market in the long run, while industrial production and money supply positively affect the Indian equity market. Tripathi and Seth (2014) employed investigated the impact of macroeconomic forces on Indian stock market performance. The result of multiple regression analysis indicated that interest rate and inflation negatively affect the Indian stock market performance, while the Johansen co-integration test concluded that the variables are co-integrated. Sahu and Pandey (2018) studied the relationship between money supply and Indian equity market during the liberalized period. The study applied Johansen’s co-integration and VECM and concluded that the variables are co-integrated. The significant negative value of error correction term suggested that the direction of causality in the long run flows from money supply to Indian equity market. In a recent article, Bhattacharjee and Das (2020) have documented the interaction between Indian stock market and macroeconomic forces and concluded that the variables are co-integrated. The study found that foreign exchange rate, interest rate, gold price and index of industrial production are negatively related to Indian stock market, while the influence of money supply and inflation is positive.
Method
Data
The study uses monthly data from January 2012 to December 2019 and covers 96 observations for each variable. We choose BSE500, which is a broad market index, as a proxy for Indian stock market index. SP BSE 500 is a broad representation of the Indian market covering top 500 companies listed in Bombay Stock Exchange. It covers all major industries of the Indian economy. To represent foreign currency exchange rate, the study uses INR/USD exchange rate. Broad money supply (M3) and wholesale price index have been considered as proxy of money supply and inflation respectively. We have used gold prices per troy ounce expressed in terms of INR, while monthly average call money rate has been considered to represent short-term interest rate. The index of industrial production is used as a proxy of industrial production. The data relating to macroeconomic variables are sourced from the website of the Reserve Bank of India while data relating to SP BSE 500 index is sourced from the website of yahoo finance. All the calculations are done using EViews software, while the compilation of the data is done using Microsoft excel.
Methodology
On the basis of the prior literature and theoretical underpinnings, the present study formulated the following basic model of the study:

where BSE500 is the SP BSE 500 index, EXR is the INR/USD exchange rate, WPI is wholesale price index, MS is M3 or broad money supply, INT is the monthly weighted average call money rate, GP is gold prices per troy ounce expressed in terms of INR and IIP is the index of industrial production.
The analysis will begin with the computation of the summary statistics of variables. The computation of summary statistics will involve mean, median, maximum value, minimum value, standard deviation, coefficient of variation, value of skewness, kurtosis and Jarque–Bera statistics. In the next step, the study employs the Phillips–Perron (PP) test, proposed by Phillips and Perron (1988), to determine the stationarity status of the variables. Depending on the results of the unit root tests, the co-integration between the variables will be examined by applying either the Johansen co-integration test or the autoregressive distributed lag (ARDL) bounds testing approach proposed by Shin and Pesaran (1999) and further developed by Pesaran et al. (2001). The theory suggests that if all the variables are integrated of the same order or I(1), Johansen co-integration test, proposed by Johansen (1991), is the appropriate test for examining the long-run equilibrium relationship between the variables. However, if the variables are integrated of mixed order, that is, I(0) and I(1), then ARDL bounds testing approach is the appropriate method for determining the presence of a long-run relationship between the variables.
To apply the ARDL bounds testing approach, the very first step is to use appropriate lag length to formulate an unrestricted error correction model (ECM). The existence of co-integration between the variables is determined on the basis of upper and lower bound critical values (Srinivasan Kalaivani 2015). If the computed F-statistic is more than the upper bound critical value, then we can say that the variables are co-integrated, that is, there is a long-run relationship between the variables. However, if the computed F-statistic is less than the upper bound critical value but more than the lower bound critical value, the test is said to be inconclusive. If the value of computed F-statistic is less than the lower bound critical value, then it can be concluded that the variables are not co-integrated. If the ARDL bounds test found the variables to be co-integrated, then the long-run coefficients and short-run parameters along with the error correction term are computed (Shrestha Bhatta, 2018; Srinivasan Kalaivani 2015). These computations mark the second step in the ARDL bounds testing approach. In the third and final step, the reliability of the short-run coefficients in the short-run ARDL-VECM model is examined by a number of diagnostic tests. The Jarque–Bera test is applied to check the normality of the residuals. The serial correlation between the residuals is tested by employing Breusch–Godfrey serial correlation LM test. The Breusch–Pagan–Godfrey test and the Ramsey RESET test, proposed by Breussch and Pagan (1979) and Ramsey (1969), respectively, are used to detect the problem of heteroscedasticity and model specification error, respectively. Finally, to check the stability of the parameters, CUSUM and CUSUM of Squares are reported and analyzed. Furthermore, the direction of short-run causality will be investigated by applying the pairwise Granger causality test proposed by Granger (1969).
The process of selecting the appropriate methodology for time series analysis is given in Figure 1.

Results and Discussion
Summary Statistics and Unit Root Test
Summary Statistics.
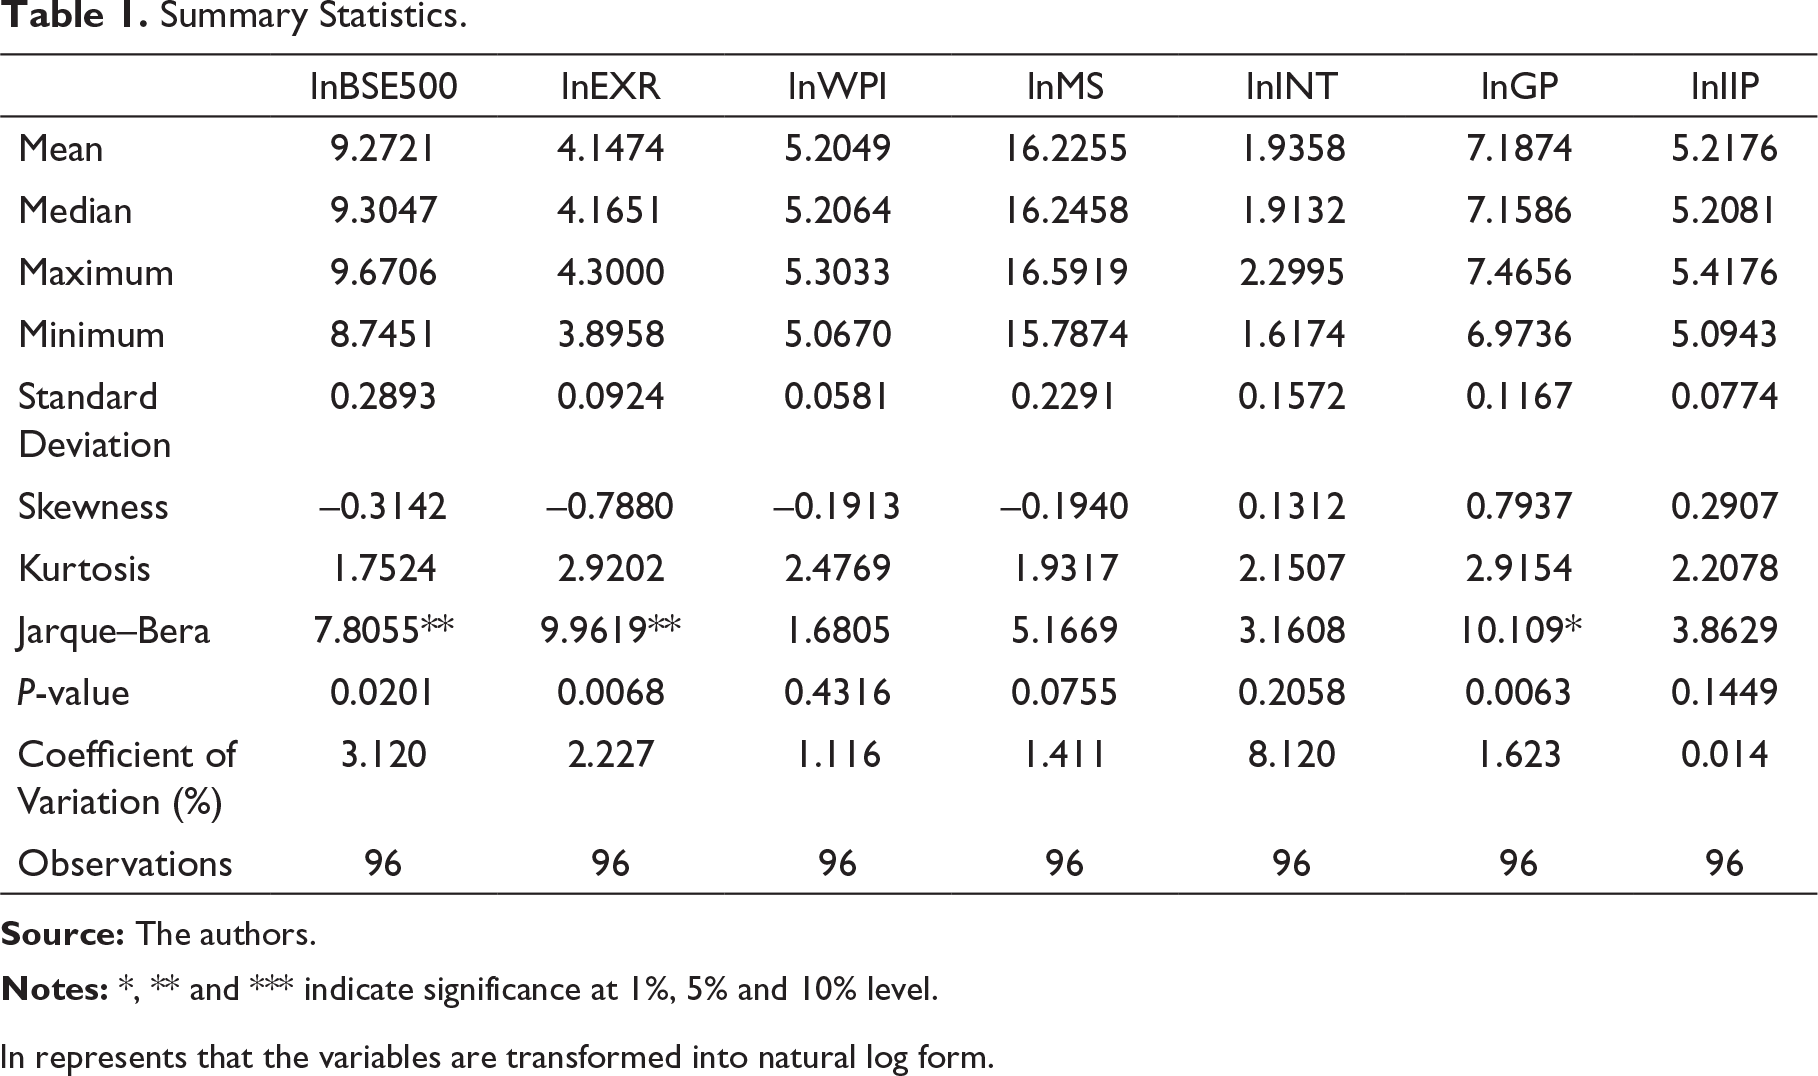
ln represents that the variables are transformed into natural log form.
Results of Unit Root Test.

Table 1 reports the summary statistics of the log-transformed variables. The most variation can be noticed in lnINT series (COV = 8.120%), while the least variation can be seen in lnIIP series (COV = 0.014%). Scanning through the value of skewness, it can be said that lnBSE500, lnEXR, lnWPI and lnMS are negatively skewed, while lnINT series, lnGP series and lnIIP series are positively skewed. The observation of the kurtosis values suggests that all the values fall within the acceptable range of –3–3; furthermore, all the values are less than 3, indicating that the variables have platykurtic distribution. The Jarque–Bera test suggests that lnWPI, lnMS, lnINT and lnIIP follow a normal distribution, while lnBSE500 series, lnEXR series and lnGP series do not follow a normal distribution.
Determining the stationarity status of the variables is an important step in the time-series analysis. The present study applied PP test on logged data to examine whether the variables are stationary. The PP test found that lnBSE500, lnEXR, lnWPI, lnMS, lnINT and lnGP are non-stationary at the level data (p-value > 0.05), while lnIIP is stationary in level form (p-value < 0.05) (Table 2). In other words, at level data, the null hypothesis of series has a unit root cannot be rejected for lnEXR, lnWPI, lnMS, lnINT and lnGP, while the null hypothesis do not hold true for lnIIP. Furthermore, all the non-stationary series become stationary at first-order difference. Thus, lnIIP is individually integrated of order 0, while lnEXR, lnWPI, lnMS, lnINT and lnGP are individually integrated of order 1.
After establishing the stationarity status of the variables, we proceed towards examining the long-run relationship between the variables using the ARDL bounds testing approach.
F-Bound Test
ARDL Bounds Test.

I(0) indicates lower bound and I(1) indicates upper bound. H0: No long-run relationship exists between the variables.
Selection of ARDL Model (Top Five Models).

Long-Run Coefficients of the ARDL Process
Long-Run Coefficients Using the ARDL (2,1,1,0,0,0,1) Model.

Table 5 reports the long-run coefficients of the ARDL model. The long-run coefficient of lnEXR is negative and statistically significant at 5% level. The negative relationship between lnEXR and lnBSE500 implies that when domestic currency weakens against foreign currency, Indian stock market falls. The reason behind the negative relationship between foreign currency exchange rate and domestic stock market is due to the firms’ dependence on imports. As Indian currency becomes weak against USD, the imports get costlier. Costlier imports adversely affect the firm’s profit which, in turn, reduces the dividend expectations of the investors, thus making the share of the firm less attractive. The result is in line with Menike (2006) and Pal and Mittal (2011) but contradicts Mukherjee and Naka (1995) and Ratanapakorn and Sharma (2007).
The positive statistically significant long-run coefficient of MS conforms to the macroeconomic theory. The positive relationship between lnMS and lnBSE500 implies that when there is an increase in money supply and a resultant fall in lending rates, investment in the stock market becomes attractive. Low interest rates in the economy provide lower returns to those who lend their money to banks; thus, these investors shift their funds to the stock market with an expectation of earning higher returns. In addition, when the government follows an expansionary policy, the overall demand in the economy increases, thereby increasing the profits of firms. Thus, investors with higher dividend expectations divert more funds to stock markets. Mukherjee and Naka (1995), Ibrahim (2003), Ratanapakorn and Sharma (2007) and Naik and Padhi (2012) found similar results for Japanese, Malaysian, USA and Indian equity markets respectively.
The coefficients of lnWPI, lnINT, lnGP and lnIIP are found to be statistically insignificant at 5% level, which implies that inflation, interest rate, gold price and industrial production do not significant influence the Indian stock market.
Short-Run Coefficients and Residual Diagnostic Tests
Short-Run Coefficients and Error Correction Term.
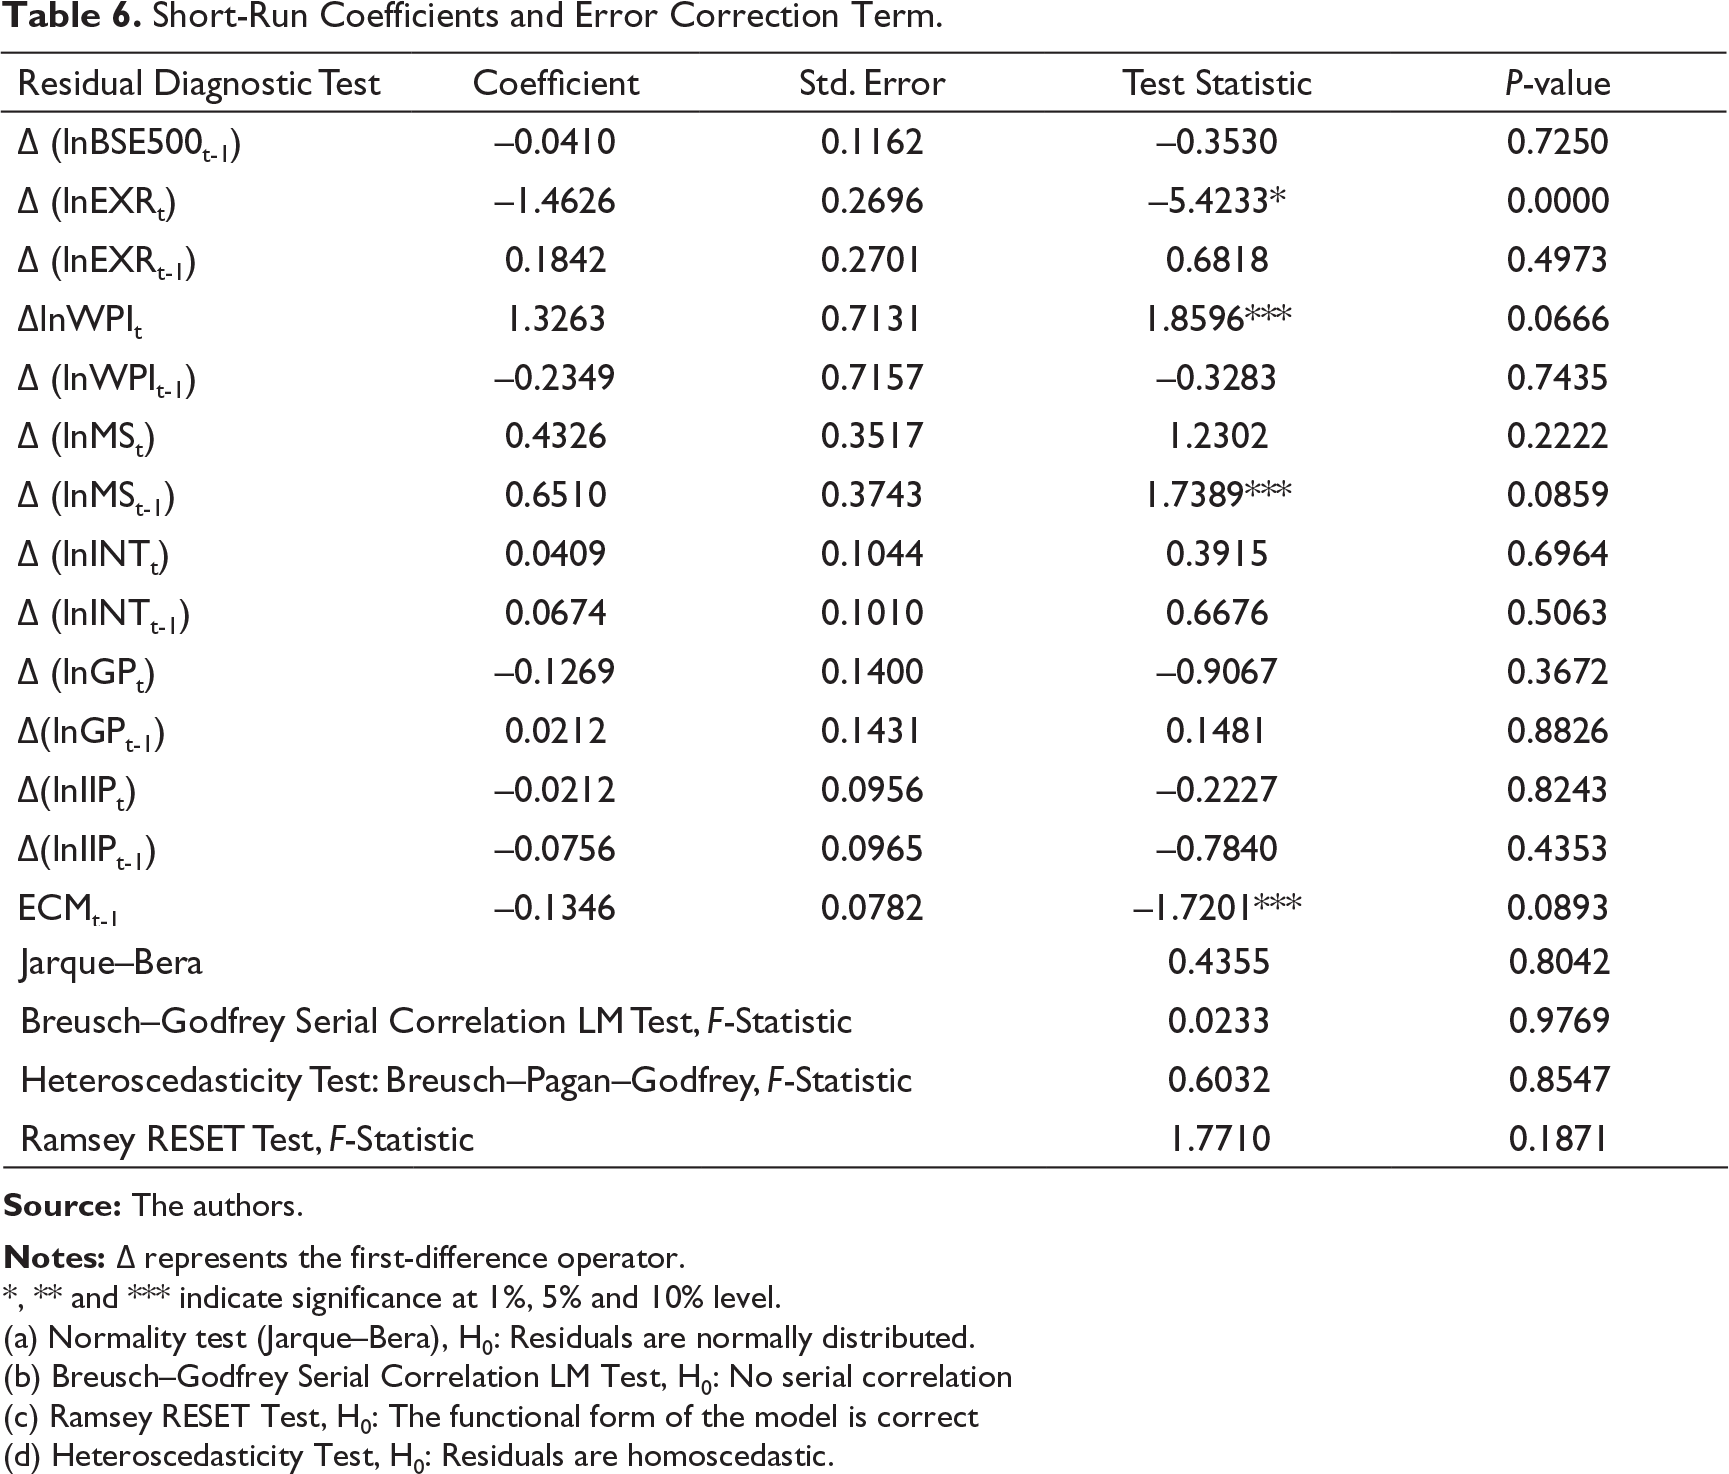
*, ** and *** indicate significance at 1%, 5% and 10% level.
(a) Normality test (Jarque–Bera), H0: Residuals are normally distributed.
(b) Breusch–Godfrey Serial Correlation LM Test, H0: No serial correlation.
(c) Ramsey RESET Test, H0: The functional form of the model is correct.
(d) Heteroscedasticity Test, H0: Residuals are homoscedastic.
Table 6 reports the short-run coefficients, error correction term and various residual diagnostic tests. From Table 6, it can be observed that lnEXRt has negative influence on lnBSE500 in the short run, while lnWPIt positively affects lnBSE500. Among the other macroeconomic variables, lag of MS is found to be significant and has a positive coefficient. The error correction term (ECMt-1) is found to be negative and significant at 10% level. The value of the error correction term is –0.1346, which implies that 13.46% of the deviation from the long-run equilibrium path is corrected within one month.
The study applied the Jarque–Bera test, the Breusch–Godfrey serial correlation test, Breusch–Pagan–Godfrey heteroskedasticity test and the Ramsey RESET test to check the reliability of the short-run estimates and CUSUM and CUSUM of Squares plot to test the overall stability of the ARDL model. The Jarque–Bera test indicates that the residuals of the short-run equation follow a normal distribution. The test statistic of the Breusch–Godfrey serial correlation test is found to be insignificant, which implies that the null hypothesis of no serial correlation cannot be rejected. The Breusch–Pagan–Godfrey test concludes that the residuals are homoscedastic, and the Ramsey RESET test indicates that there is no model specification error.
In the final step of the analysis, CUSUM and CUSUM of Squares plots are inspected to verify the stability of the ARDL model. From Figures 2 and 3, it can be observed that the CUSUM and CUSUM of Squares statistics are within the critical bounds of 5% level of significance which indicates that the model is stable.


Pairwise Granger Causality Test
Pairwise Granger Causality Test (With Two Lags).

The output of pairwise granger causality test is reported in Table 7. From the table, it can be observed that there is bidirectional causality between lnEXR and lnBSE500, which indicates the presence of feedback mechanism between the variables. The results also show the presence of unidirectional causality between lnWPI and lnBSE500, lnMS and lnBSE500, lnINT and lnBSE500 and lnIIP and lnBSE500. The study found no causality between lnGP and lnBSE500. The findings of the pairwise granger causality test suggests that INR/USD exchange rate, inflation, money supply and industrial production are helpful in predicting the stock prices in the Indian stock market.
Conclusion
This study investigates the long-run relationship between Indian stock market and domestic macroeconomic forces using the ARDL bounds testing approach. The PP test is applied to determine the stationarity status of the variables. The results of the PP test suggest that lnIIP is stationary in level, and all other variables are individually integrated of order 1 or I(1). The ARDL bounds test result showed that there is a long-run equilibrium relationship between the variables. Furthermore, the long-run coefficients of the ARDL process conclude that money supply and foreign currency exchange rate are the macroeconomic variables that significantly affect the Indian stock market in the long run. The short-run estimates showed that lnEXRt, lnWPIt and lag of MS have a significant effect on the Indian stock market. The residual diagnostic tests that checked the reliability and validity of the short-run parameters showed that the residuals have no serial correlation, heteroscedasticity and misspecification problem; thus, the diagnostic tests conclude that the errors of the short-run equation are well behaved. Furthermore, the CUSUM and CUSUM of Squares plot showed that the statistics are within the critical bounds of 5% level of significance, indicating the model to be stable. The results of the pairwise granger causality test reveal that the domestic macroeconomic variables are helpful in predicting the stock prices in Indian stock market and, hence, should be properly monitored.
Policy Implications
The findings of the study have several policy implications. First, falling INR against USD should be checked by the government through appropriate measures. In the context of restricting imports and attracting Foreign Direct Investment, the Make in India initiative and the recent Atmanirbhar Bharat Abhiyan are noteworthy measures undertaken by the Government of India. However, the positive effect of the initiatives on the foreign currency exchange rate will depend on their proper execution. Second, squeezing money supply by the government can have an adverse effect on the Indian stock market by affecting the production and borrowing capacities of firms. However, excess money supply can also have a detrimental effect on the Indian economy, as it increases the inflation rate. Nevertheless, on the basis of the findings of the study, it is recommended not to aggressively squeeze the money supply in the economy.
Managerial Implications
The findings of the study suggest that increase in money supply positively influence the stock prices. However, loose monetary policy results in high inflation, and it has a corrosive effect on business performance. Thus, managerial decisions should not fall prey to money illusion caused by inflation and should pay more attention to real efficiency improvement. The managers should also consider the condition of INR/USD exchange rate while taking business decisions relating to import and export. Furthermore, the findings of the study strongly support that equity prices are influenced by macroeconomic variables and investors should closely monitor the prevailing macroeconomic conditions in the economy.
Limitations
The study has some limitations; first, the study used eight-year observations and could have been expanded year-wise. The study did not consider macroeconomic variables like GDP and long-term interest rate. The inclusion of the variables could significantly improve the error correction speed. Furthermore, future research endeavours should employ rolling regression techniques in order to study the evolution of the relationship between Indian stock market and domestic macroeconomic variables within the framework of ARDL bounds testing.
Footnotes
Declaration of Conflicting Interests
Funding
The authors received no financial support for the research, authorship and/or publication of this article.