



Abstract
In 2015, India has faced the largest number of under 5 (U5) death than all other countries, with regional disparities. Childhood diarrhoea and pneumonia are the major cause of U5 death. Using the data from the fourth round of National Family Health Survey (NFHS-IV, 2015–2016) for the eight North Eastern state we have tried to understand the prevalence of environmental health problems like ARI and diarrhoea and their correlates. These two diseases are the major cause of U5 deaths in low- and middle-income countries including India. Apart from bivariate analysis and logistic regression analysis we have also conducted spatial association to identify the regional variation in diarrhoea and ARI among U5 children in NE states. Household’s environmental factors and socio-economic characteristics are found to have significant impact on child mortality. Among the NE states Sikkim found to be better off and Meghalaya is worse in terms of child health outcome. Policies aimed at achieving the goal of reduction of child mortality should be directed on improving the household’s environmental and or socio-economic status if this goal is to be realised. India must analyze the process achieved and contemplate the consequences for reaching the Sustainable Development Goal’s targets for child survival.
Background
Eight states namely Arunachal Pradesh, Assam, Manipur, Meghalaya, Mizoram, Nagaland, Sikkim and Tripura are considered as North-Eastern states in India. The land surface of this region is 262,230 square kilometres. According to the 2011 census, the total population of the area is around 45.8 million (3.78% of India’s population) belongs to different ethnic and cultural groups. Topographically the part is a mixture of hills and plains. 30% of the population in this region lives in hilly area which accounts for 70% of the total land of the region and the rests 70% of population lives in the plain area which constituted 30% of geographical land coverage of this region. Plains of Brahmaputra and Barak valley are the most densely populated parts of this region. Other populated areas are the Imphal plain in Manipur and the western part of Tripura. North Eastern Region shares international border with five neighbouring countries of India such as Nepal, China, Bhutan, Bangladesh and Myanmar. It is one of the most complex spots in Asia with over 200 ethnic groups, languages, dialects and their faiths and practices. The recent publication of NITI Aayog (2018) has announced 101 aspirational districts (backward districts) throughout the country, out of which 14 are from the North Eastern (NE) states. Development indicators including health indicators in NE states vary widely. This could be because of differences in basic infrastructure like water-sanitation, road connectivity, Government expenditure on health and health infrastructure varies across the states. Cultural factor may also play an important role in determining the health and nutrition status of people living in different NE states. According to NFHS 4 (2015–2016), under 5 mortality rates (U5MR) widely varies in NE states, 25.9% in Manipur to 56.5% in Assam, whereas as per the SDG target it should be less than 25.
A global commitment was made in the Millennium Development Goals (MDG) to reduce the under-five mortality (U5MR) by two-thirds during the period 1990–2015 (UNDP, 2000), which has not been achieved by many developing countries including India and it has been renewed as Sustainable Development Goals (SDG) and fixed the target of U5MR, to be less than 25 per 1000 live births by 2030 (UN, 2015). Therefore, apart from Manipur (25.9%) all other NE states are far behind to achieve this. The year 2015 stand as a yardstick, in one hand we were to achieve the MDG indicators and on the other hand new targets for the SDG indicators had been set up. Therefore, data of NFHS-4 that had been collected during the year 2015–2016 tells us whatever we have achieved in MDG and what is our baseline status for the SDG indicators. India is stepping down very rapidly in terms of child mortality from 83.1 deaths to 42.4 deaths per 1,000 livebirths between 2000 and 2017 (Kumar & Singhal, 2020). Despite of decline in the number, proportion in U5MR due to diarrhoeal diseases and acute respiratory infections (ARIs) are very common and very high in number. Environmental health problems among children are the major concern issue to be resolve for diminishing U5MR, which is affected by structural, environmental and household level factors (Baranwal et al., 2014). Diarrhoea and pneumonia are the two leading causes of death among the under-five children in developing countries including India (Bassani et al., 2010; Black et al., 2003; Liu et al., 2015; Walker et al., 2013). Children below 2 years are more susceptible to suffer from these two diseases (Bbaale et al., 2011; Budge et al., 2014; Walker et al., 2013). In Indian context, there are several evidences on various factors which are affecting the early child health deterioration. But what is available for all-over India or for EAG states (eight socioeconomically backward states of Bihar, Chhattisgarh, Jharkhand, Madhya Pradesh, Orissa, Rajasthan, Uttaranchal and Uttar Pradesh, referred to as the Empowered Action Group states), may not be applicable for North-Eastern states due to its political and social diversity (Ladusingh & Singh, 2006). To explore the status and underlying causes of environmental health problems among children we have analysed the NFHS-4 data for seven NE states. Data show that the prevalence of two leading causes of under-five mortality, diarrhoea and ARI are also varying widely across these NE states. Prevalence of diarrhoea in NE is lowest in Sikkim (1.77) and highest in Meghalaya (10.21), whereas the country level prevalence is 9.2. Again, for ARI, Sikkim (0.30) is lowest and Meghalaya (5.80) is highest in prevalence compare to national average of 2.7 (see Figure 3). Childhood diarrhoea not only has its direct impact on mortality, but also repeated diarrhoeal episodes during childhood leads to long-term nutritional deficiency (Checkley et al., 2008) which again increase the risk of morbidity and mortality (Troeger et al., 2018).
Relevance of the Study
Since the beginning of this century India has made significant improvement in terms of reduction in under-five mortality (Gupta et al., 2007), but still a substantial number of under-five children are dying due to pneumonia and diarrhoea. Africa and South Asian regions together contribute to 90% of all these deaths (Singh et al., 2014), India being a populous country tops in the list in terms of number of deaths (Black et al. 2010; UNICEF, 2018). In many studies Acute Respiratory Infections (ARI) and pneumonia have been used interchangeably, but these two are not exactly synonymous, pneumonia is a cause of lower respiratory infection, a type of ARI (Mathew et al., 2011; Simoes et al., 2006; Walke et al., 2014). These two diseases together account for nearly 30% of all under-five deaths, which is amounting to nearly 2.2 million deaths per year (Lopez et al., 2006; Parashar et al., 2003; Singh et al., 2014; UN IGME, 2012). Studies have evident that there are huge disparities across the states in terms of U5MR in India (Liu et al., 2019). Even if the targeted U5MR is achieved at the national level by 2030, it may remain unattained in many states especially in the northeastern part of the sub-continent. Therefore, it is very important to identify the backward regions and the communities those are vulnerable and treating them with effective interventions to achieve the goal for all (Bora & Saikia, 2018). So, on that path this study made an attempt to understand the progress of NE states towards the SDGs in the light of childhood morbidities. Specifically, we want to see the differences in the prevalence of diarrhoea and ARI among the NES as well as identify the background predictors of the particular diseases’ prevalence.
This study used the Mosley and Chen’s (1984) analytical framework for investigating child health. Following this framework, we have taken different household and individual level indicators those could be potential determinants of childhood diarrhoea and ARI (Mosley & Chen, 1984). Mothers’ education significantly associated with the child health status, as educated mothers are aware about possible risks of their children being exposed to unhealthy environment (Ghasemi et al., 2013; Kamal et al., 2015; Mukhtar et al., 2011). This may be the case that educated mothers are more exposed to different mass media or social media, which help them to acquire knowledge about the linkages between environment and child health and to create awareness around communicable diseases (Asakitikpi et al., 2010; Singh et al., 2014; Wakefield et al., 2010). Childhood morbidities vary widely according to the standard of living of the household (Dostal et al., 2013; Tumwine et al., 2002). These diseases have been coined as ‘disease of the poor’ (He et al., 2017), as children from the poorer families are exposed to poor living condition and lack of hygiene which make them more susceptible to be infected by pneumonia and diarrhoea (Giashuddin et al., 2005; Hatt & Waters, 2006; Nundy et al., 2011; Wardlaw et al., 2006).
Environmental factors like housing structure, access to safe drinking water and availability of improved sanitation system have direct linkages with diarrhoeal diseases among children (Calistus et al., 2009; Khan et al., 2013). For this reason, the goal six of the SDGs has laid emphasis on ensuring the availability of water and sanitation for all (UN, 2015; Dora et al., 2015). Studies have established the fact that residential crowding increases the risk of respiratory diseases among children (Colosia et al., 2012; Kandala et al., 2009). Use of solid fuel for cooking is one of the major sources of household air pollution and responsible for a variety of respiratory diseases among children (Dey & Chattopadhyay, 2016; Fatmi & White, 2002; Kilabuko & Satoshi, 2007; Lim et al., 2012). In NES, many households do not have separate kitchen for cooking, they generally live in a single room house and cook food in varanda, under stairs and sometimes in bedroom itself using smoke generating fuel like wood, straw, animal dung, etc. which create significant indoor pollution. As women are engaged in cooking activities therefore women, children and elderly are mostly exposed to such indoor pollution. Moreover, biomass fuel is one of the major sources of cooking fuel for the poorer households, which creates more environment pollution inside home. Air pollution is quite higher in the above-mentioned type of households compared to the outdoor air pollution in many congested cities (Muttunga, 2007).
Study Area and Data
The unit level data of fourth round of National Family Health Survey (NFHS 2015–2016) has been analysed for this study. The study is a cross-sectional study covering 29 states and 6 union territories across India. The NFHS IV is suitably designed to provide estimates of important indicators on the family welfare, fertility, mortality, child health and nutrition. Information on morbidity status of children under 5 years who have suffered from diarrhoea or/and ARI during two weeks preceding the survey, information of their parents and the households they live in were also covered by this survey. This study is based on eight north eastern states (Figure 1) covering 37,167 children. To make the estimates representative for the states, the data has been weighted with the sample weights in the current analysis.
Bar Graph of Diarrhoea and ARI Prevalence (as per NFHS 4, 2015-2016).

Analytical Approach
To overview the child health outcome with respect to various socio-demographic as well as environmental variable, proportion share has been calculated. While examining the occurrence of diarrhoeal diseases and ARI in NES, prevalence map has been plotted as well as to examine spatial clustering of these two diseases univariate local Moran’s I statistic was computed which measures the spatial autocorrelation and indicates the degree to which data points are similar or dissimilar to their neighbours. P value of local Moran’s I was generated using a randomisation test on a Z-score with 9,999 permutations.

where zi is the standardised variable of interest; wij is the standardised weight matrix with zeroes on the diagonal, and C is the multiplier equivalent to = N/S0. Here N is the number of spatial units indexed by i and j; S0 is the sum of all wij’s. A Moran’s I statistic tends to be larger positive (or negative) value between (−1 and 1). Positive spatial autocorrelation would indicate that regions with similar attribute values are more clustered, whereas a negative spatial autocorrelation would indicate a dissimilarity in associated regions. Furthermore, univariate Local Indicators of Spatial Association (LISA) measures the correlation of neighbourhood values around a specific spatial location and determines the extent of spatial randomness and clustering to detect spatial heterogeneity. To examine the empirical association between the selected morbidities with socio demographic and environmental factors, bivariate cross tabulation and bivariate logistic regression are used. In bivariate cross tabulation we have computed chi-square test statistics to check the significant association between the morbidities and the predictors. While, Cramer’s V is used to check how strong the associations are. If the values are close to 0.10 it is considered to be a weak association, if the value exceeds that value and is close to 0.30 then it has been considered as moderate association. If it exceeds that value and is close to 0.50 then it is considered to be a very strong association. Also, the Multivariate logistic regression model has been used so that all the independent variables and their effects can be evaluated together. All the variables were tested for multi-co-linearity before being included in the regression models. In order to proclaim the study objectives, the following hypotheses are being tested:
Access to safe drinking water reduces the likelihood of diarrhoeal diseases. The household’s main source of cooking fuel has no impact of ARI among children.
Dependent Variables
In our study, occurrence of diarrhoeal diseases and occurrence of ARI have been identified as dependent variables. The information of diarrhoea has been tracked down by asking the mother of the children, ‘whether the child has diarrhoea in the last 2 weeks?’. While for forming of occurrence of ARI, information of ‘having cough’, ‘short, rapid breaths’, ‘problems in the chest or blocked or running nose’ have been aggregated.
Independent Variables
The study has used background socio-demographic and environmental variables as covariates or as key exposure variables. Background variables included age of the child, place of residence, mother’s education, caste of the household, mass-media access, source of drinking water, type of toilet use, hand wash practices, quantile of wealth index, type of house, number of adults living in a single room, frequency of smoking inside the house, place of cooking and fuel item of cooking. NFHS collects background information of unit level data on surveyed children. For this study, we have modified the coding of covariates as per standard protocol and convenience with the help of past studies. Age of the child (in months) has been coded as 1 ‘0–11’, 2 ‘12–23’, 3 ‘24–35’, 4 ‘36–47’ and 5 ‘48–59’. Place of residence is a dichotomous variable with the specification: 1 ‘rural’ and 2 ‘urban’, respectively. Education of mother has been categorised as 1 ‘No Education’, 2 ‘primary’, 3 ‘secondary’ and 4 ‘Higher Secondary and above’. Society caste is subdivided into 1 ‘SC’, 2 ‘ST’, 3 ‘OBC’ and 4 ‘Others’. Access of Mass media in the household has been categorised into 1 ‘No Access’ 2 ‘Partial Access’ and 3 ‘Have Access’. Source of drinking water has been dichotomously coded as 1 ‘unsafe’ and 2 ‘safe’ while type of toilet use has been subdivided into 1 ‘Flush’, 2 ‘Pit’ and ‘Open deification’. Categorisation of hand-washing as 1 ‘No Wash’ 2 ‘soap-water’, 3 ‘Ash, mud and water’ and 4 ‘only water’. In order to measure the wealth/economic status of the population across the households, a wealth index variable with the quintile categories, 1 ‘poorest’; 2 ‘poor’; 3 ‘middle’; 4 ‘rich’; and 5 ‘richest’ have been used from the dataset. While it is furthermore modified as 1 ‘poor’ 2 ‘non-poor’. Types of house have been formed into three categories from the origin variable as 1 ‘Kaccha’, 2 ‘Semi Pucca’, 3 ‘Pucca’. Number of adults per room variable has been formed as 1 ‘up-to two adults’, 2 ‘More than two adults’ from the variable persons per room for sleeping. Frequency of smoking in the room has been coded as 1 ‘Never’, 2 ‘Daily’, 3 ‘Weekly’ and 4 ‘Monthly’. Cooking fuel has been dichotomously categorised as 1 ‘Non-smoke generating fuel’, 2 ‘smoke generating fuel’, while place of cooking has been formed with four categories: 1 ‘Separate room as kitchen in the house’, 2 ‘no separate room as kitchen in the house’, 3 ‘kitchen in a separate building’ and 4 ‘No separate kitchen (outdoors and others)’.
Results
Descriptive Statistics
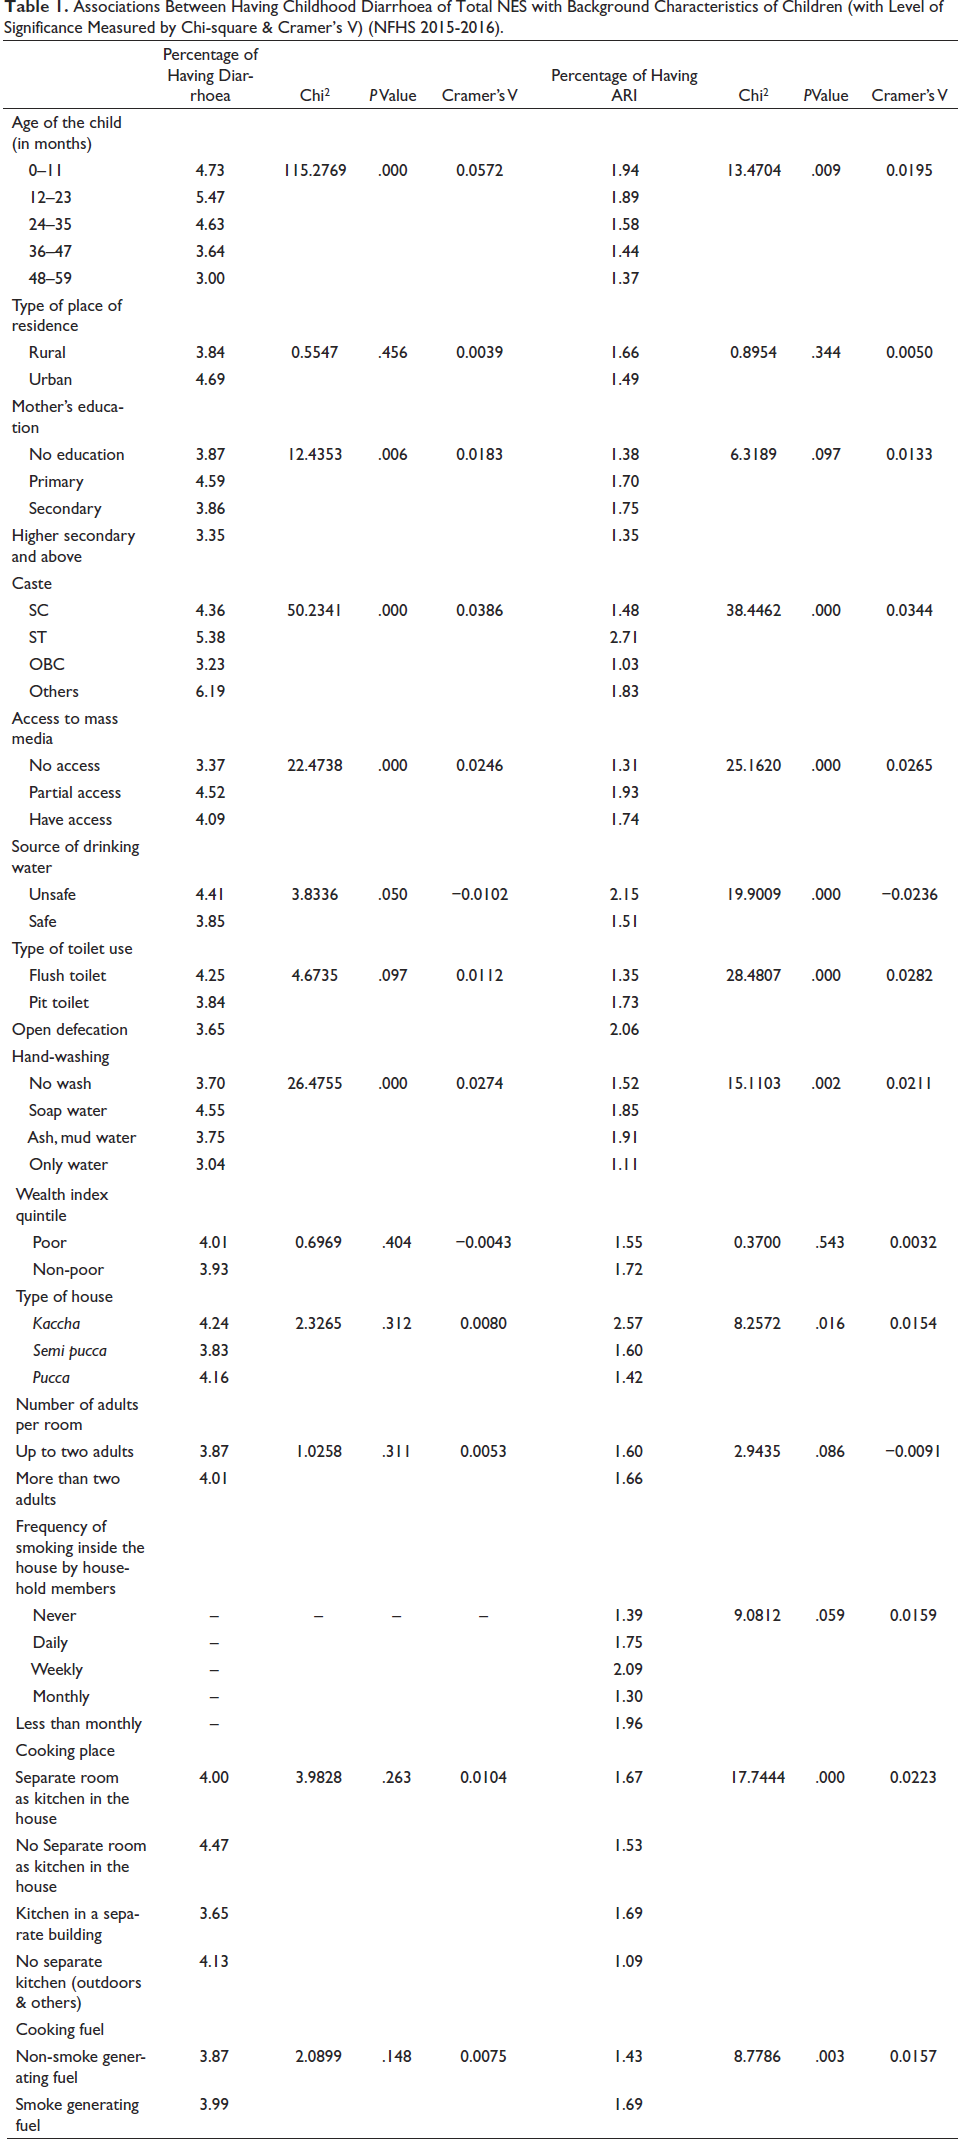
From the latest nationalised health survey, it has been found that total 37,167 NES children have been selected (Supplementary Table), among them 0–11 months aged are around 17–20%, while 12–23 months and 24–59 months aged children are around 40% each, respectively, in each NES. At the same time, above 60% children are urban residents in these states except Mizoram 48.7%. Most of the surveyed mothers have qualification of minimum secondary education but Arunachal Pradesh has maximum (34.53%) illiterate mothers. In spite of improved socialisation, education is still some kind of barrier due to its geographical structure. Again, in NES more than 120 languages are spoken (census 2011) and most of the people of NES are schedule tribe except for Assam. Assam shows highest percentage of household, who do not have access of mass-media (54.64%). While 60 % of children in the state of Manipur are drinking unsafe water. Overall, 18.75% of Manipuri children are openly defecating, which is big contributors in increasing diarrhoeal diseases. While large percentages of children from Tripura are not washing their hands before having food, so this is also an important factor for improving the cases of diarrhoea and ARI. Most of the children of NES are living under semi-pucca houses with limited resource and mixed income quantile. Reason of higher prevalence of ARI in NES is, in most of the families smoking inside the house is very frequent as well as smoke generating fuel is mostly used in the families due to its huge availability of natural fuel mainly firewood. Figure 2 shows children of Meghalaya are most vulnerable for childhood diseases due to its adverse climate as well as for geographical position among all the NES. It has also been noticed that children of Nagaland are more vulnerable for Diarrhoea compare to ARI. From the result of Univariate Local Moran’s I of childhood morbidity, it has been found that there is no clustering between the NES for both the diarrhoeal diseases and ARI due to diverse community behaviour in these regions. Table 1 shows the association among the occurrence of childhood diarrhoea with each socio-demographic and environmental factor. Overall, 12–23 months aged urban children whose mothers have only primary education, have maximum significant associations of having diarrhoea. Again, mother of the children from ST households with having partial access of mass media, have significant positive associations. Most of the covariates have significant associations with diarrhoea but the associations are weak. Chances of having diarrhoea is higher among the vulnerable groups like children from lower economic strata, living in kaccha houses, using unsafe water, more than two people residing in a single room are increasing the chance of diarrhoeal diseases due to hygiene issue. While child age, caste of the children, mass media access, drinking water source, type of toilet usage, hand-washing, place of cooking and cooking fuel are showing significant associations of occurrence of ARI but for all these covariates association is not strong that much. But for household’s source of drinking water is negatively associated with both childhood ARI and diarrhoea. Again, for number of adult people living in a single room is also negatively associated with the ARI, though the association is not significant. Households where family members are smoking inside the houses and using smoke generating fuel for cooking, their children are more prone to ARI diseases.
The Study Area of NES, India.

Associations Between Having Childhood Diarrhoea of Total NES with Background Characteristics of Children (with Level of Significance Measured by Chi-square & Cramer’s V) (NFHS 2015-2016).
Factor Affecting Diarrhoea and ARI
Table 2 shows the bivariate logistic regression between the occurrence of childhood morbidity, that is, diarrhoeal diseases or ARI with the selected socio demographic and environmental factors. Children in the age group 12–35 months have the higher odds of suffering from diarrhoea compared to other age group. Child age, education of mothers, wealth index has no significant association with ARI. While for both diarrhoeal diseases and ARI, place of residence has no significant association. Children with higher educated mother are lesser prone to diarrhoea (95% CI: 0.532, 0.914). Children drinking safe water having less change of suffering these childhood morbidities. Children who are openly defecating are having maximum chance of occurring of diarrhoea and ARI (95% CI:1.121, 1.587 and 1.883, 3.915). Children using soap water is safest against both the diseases. Rich child is safer than poor child for occurring diarrhoea (95% CI: 0.783, 1.013). Children who are living in semi-pucca and pucca houses are having less odds for occurrence of ARI. Children of the household, where smoke generating fuels are being used, are 0.363 times more prone to ARI.
Results of Logistic Regression Analysis Examining the Factor Affecting Diarrhoeal Diseases and ARI in NES (NFHS 2015–2016).

*, ** and *** imply p < .05, p < .01 and p < .001.OR: Odds ratio.
Significant error is robust in nature.
Discussions and Conclusions
Underdevelopment is a predominant characteristic of the northeastern region of India. Troubled by long history and geopolitics, the region remained one of the most backward regions of the country. After the partition in 1947, it became an isolated region due to its geographical location. The traditionally available infrastructures like Chittagong port become permanently inaccessible due to partition. The underdevelopment of the region can be defined using many indicators including a high incidence of poverty, low industrialisation, less public infrastructure and less livelihood opportunity (Singha, 2018). The reason behind low development can be attributed to many factors, some are related to an unfavourable geographical location but some are also structural. The long negligence from the Central Government along with political instability in the many parts of the region is added to the problems. In a nutshell, other than current economic factors, the long unstable socio-political history of the region is equally important.
This article is an attempt to understand the problems from the perspective of the children of the region. To understand the condition of children, the occurrence of diarrhoea and ARI are used as indicators. In terms of the prevalence of diarrhoea in the region, Assam, Nagaland and Sikkim are relatively better in comparison to other states. Meghalaya’s performances are worse in terms of diarrhoea and ARI. The picture is almost the same in the case of ARI except for the performances of Nagaland. Though there are a lot of variations within Assam, it is understandable that the better performance of Assam is linked with many favourable geographical as well as financial factors. For example, through the Ministry of Ministry of Development of North Eastern region (DoNER), Govt of India has been approved a total of 1600 crore for the North East Special Infrastructure Development Scheme (NESIDS) 1 between 2017–2018 and 2019–2020 and Assam got almost 28% of the total. According to our findings, Meghalaya is the least performing state. Bagli (2017) using Census data (2011) finds that Meghalaya is the most deprived state in the northeast and among the 20 most deprived districts four are located in Meghalaya that is, in the year 2011, four out of seven districts are most deprived districts of the region.
It is obvious from the analysis that the infrastructure related variables like proper sanitation and toilet facilities at home can reduce the chances of suffering from diarrhoea and ARI. On 2nd October 2014, the Prime Minister of India had launched the Swachh Bharat Mission which is universal sanitation coverage. According to Government data, in the year 2015–2016, the sanitation coverage of North-eastern India was under less than 50%, barring Sikkim which was one of India’s first open defecation free states. Northeastern states today collectively boast of sufficient sanitation coverage, and the rural areas of all states have been declared open defecation free (ODF). If data are to be believed then 100% ODF will have huge significant positive impacts on the children of the regions.
The other important finding of the article is children with higher educated mothers are lesser prone to diarrhoea. Different educational institutions are very important stakeholders including non-government organisations like religious institutions. To understand the context, it is important to understand the geography of the region. There is a huge disparity in public infrastructures if one compares hills and plains. The communities living in the hills are handicapped in availing basic facilities like education, health, safe drinking water, financial institutions, etc. This is also evident from our data that the income class of the household is also an important determinant of the outcome. Above mentioned factors also created a considerable inequality among the household. There is a noteworthy variation exists among the states also. According to a study done by Khan and Padhi (2017) using NSSO 68th round data (2011–2012) finds that according to headcount ration, the state of Manipur has the highest poverty level (34.3%) among NES of India. The states like Nagaland and Mizoram have less than 10% poverty level whereas all other NES have higher than 20% of the poverty level. In other words, there are many variations among the states of northeast India and those variations also visible in our analysis (see Figure 3), among all NE states Meghalaya is the worst performer.
Prevalence Map of Diarrhoea and ARI in NES (NFHS 2015–2016).

This article highlights and draws attention to urgent intervention in terms of improving basic social infrastructure. Analysis of this paper also suggests that the significance of the Government’s role in terms of protecting and promoting a better and healthier life for children of the region. For instance, the government should take necessary steps for ensuring to reduce energy poverty or promote cleaner technology to decrease in-house pollution.
Footnotes
Author Contributions
A.G. contributed to conceptualisation and design of the study, drafted the initial manuscript and was involved in overall supervision. S.D. led the analysis and interpretation of data. R.S. contributed to interpretation of findings in the context of north east and reviewed the manuscript for important intellectual content.
Declaration of Conflicting Interests
The authors declared no potential conflicts of interest with respect to the research, authorship, and/or publication of this article.
Funding
This research used the secondary data of NFHS-4 and no specific grant was required to conduct this study from any funding agency in the public, commercial, or not-for-profit sectors.
Note
Supplemental Material
References
Supplementary Material
Please find the following supplemental material available below.
For Open Access articles published under a Creative Commons License, all supplemental material carries the same license as the article it is associated with.
For non-Open Access articles published, all supplemental material carries a non-exclusive license, and permission requests for re-use of supplemental material or any part of supplemental material shall be sent directly to the copyright owner as specified in the copyright notice associated with the article.
