
Abstract
The present study made an attempt to examine the changing pattern of public healthcare expenditure across Indian states for the period 1979–1980 to 2019–2020 and tried to relate this with the spread and mortality of COVID-19 infected cases. An attempt was also made to analyse the responsiveness of per capita public healthcare expenditure (PCPHE) with the change in per capita GSDP (PCGSDP) to a much-disaggregated level. The supply side composite index (SSCI), panel regression and panel generalised method of moments (GMM) was used for analytical purpose. The study found that the greater variation in PCPHE across Indian states start exhibiting since the early years of initiation of NRHM policy and continued till recent years. Unlike the PCPHE, the public healthcare expenditure to GSDP ratio declined for all states in the subsequent time periods. The value of SSCI for both revenue and capital expenditure was low in states having larger populations and geographical areas. The study argued that the average PCPHE across Indian states exhibited irregular pattern of association with the COVID-19 confirmed cases, positivity and death rate. The panel GMM estimate of PCPHE exhibited an inelastic relationship with PCGSDP implying public healthcare is a ‘necessity’ across the Indian states.
Keywords
Introduction
It is agreed that the expansion of public expenditure on healthcare (PEH) not only helps in combating the major communicable and non-communicable diseases but also assists in eradication of the extreme poverty, attaining the target of the Millennium Development Goals (MDGs), besides economic growth and development of a country (Hooda, 2017; UN News, 2008). National Commission on Macroeconomics and Health (2005) pointed that the countries with improved health outcomes spent more on public health relative to the countries with vulnerable health outcomes. Nevertheless, as compared to developing countries, developed countries spend more public resources in the healthcare sector. As per the Health Expenditure Report of WHO (2019), in low-income countries, the average health spending was around $ 41 a person in 2017, whereas, in high-income countries, it was $ 2,937. Similarly, the share of middle-income countries in health spending increased from 13% to 19% of global spending during 2000–2017. For raising the PEH, the Government of India has taken different policies and constituted few committees from time to time over the years. In 1946, the Bhore Committee was constituted which recommends setting up a Primary Health Centre (PHC) with 75 beds for each 10,000–20,000 population. Similarly, the unanimous purpose of Indian health policies, namely India’s Community Development Programme (1951–1955), the Alma Ata Deceleration of 1978, the first National Health Policy of 1983 and India’s strategy to achieve ‘Health for all by the year 2000 AD’ was to improve the healthcare infrastructure of India by expanding the PHC, Sub-Centre and Community Health Centre across states. Likewise, the National Health Policy (2002), the National Rural Health Mission (2005) and the Universal Health Coverage Report (2012) set an ambitious goal of increasing government health spending to 2%–3% of GDP. Moreover, the National Health Policy, of 2018 emphasised to increase the government health expenditure as a percentage of GDP from the existing 1.15%–2.5% by 2025.
Accordingly, there has been a steady increase in PEH in India like other countries of the world. However, since 1940s, the PEH has been quite inadequate as the government sending continued to remain lower than the private sector outlay in India. As per the Bhore Committee Report (1946), the per capita public expenditure on health was only ₹0.36, while the per capita private expenditure was ₹2.50. The private health expenditure of India in the 1950s and 1960s was 83% and 88% of total healthcare expenditure, respectively. India spent only 3% of GDP on healthcare, whereas the average public expenditure of low-income countries was 5.1% of GDP (Global Burden of Disease Health Financing Collaborator Network, 2019). In India, out of total healthcare expenditure, only 36% was met out by government funds, which shows the highly privatised healthcare system (Global Burden of Disease Health Financing Collaborator Network, 2019). Consequently, India’s position on most of the health outcomes is still unsatisfactory. India seems to be lagging behind in fulfilling most of the targets of the MDGs. As per the World Bank (2019) data, the infant mortality rate (IMR) in India was around 28.3, while Sri Lanka’s IMR was 6.1. The life expectancy at birth of an average Indian was about 69.66 years, which was at least 15 years lower than the developed countries (World Bank, 2019). As per the NFHS5, as many as 68.4% of children and 66.4% of women suffered from anaemia in 2019. Moreover, at present, among the Asian economies, India has been the largest hub of confirmed COVID-19 cases. As per the Ministry of Health and Family Welfare, Govt. of India assessment, followed by the United States, India has the second highest tally of confirmed cases in the world with 26.7 million reported cases, and the third highest number (307,231) of reported deaths (after the United States and Brazil) as on 23 May 2021. There is several hue and cries in the national health system in the face of the prevailing situation with the severe scarcity of hospital bed and life-saving oxygen or critical medical supplies. The present pandemic has pixelised the bleak realities of prolonged negligence about the inter-state inequalities and disparities in the health system in India (Shekhar, 2020).
Healthcare financing in the Indian context has been a subject matter of interest in the works of few scholars. In an interstate analysis, Tulasidhar and Sarma (1993) outlined that the per capita real public spending grew faster than the real per capita state domestic product in Indian states. According to Duggal (2001), with high dependence on private healthcare in India, maximising public-private participation in the health sector can yield the best result. However, Bhat (2000) discussed the necessity of regulating the private players in India and how public-private partnerships can bring needed resources in the greater interest of the poor and rural populations. Nearly three-fourth of out-patients and a third of in-patients opted for private healthcare in India (Duggal & Amin, 1989; Visaria & Gumber, 1994). While examining the public health subsidies in Indian states, Mahal et al. (2001) found that public subsidies on health are distributed quite unequally across different socio-economic groups and geographical clusters in India with urban residents accrued 31%, which was even higher than health subsidy offered to the total population of the country. Hooda (2015) expressed concern over macroeconomic and health policy in India, as the fund allocation towards rural areas has been declining. Mohanty et al. (2016) reported that, in India, the per capita health expenditure was growing faster than per capita consumption expenditure during 1993–2012. Further, Mohanty and Dwivedi (2021) revealed greater inequality and steady fall in catastrophic healthcare expenditure impoverishment in India during the last 14 years.
There are several scholarly attempts to evaluate the magnitude of variation in health expenditure influenced by the income of a nation. With the pioneering attempt by Newhouse (1977), a comprehensive coverage of the issue can be found in the works of Xu and Sakesena (2011), Baltagi and Moscone (2010), and Raghupathi and Raghupathi (2020). The economic and industrial advancement of a country has been associated with increasing ratio of healthcare expenditure to GDP is an important observation of former studies. The seminal work by Abel-Smith brought out this issue in World Health Organisation studies way back in 1963 and 1967. Using data from 19 OECD countries, Gerdtham et al. (1992) identified the share of public financing to total health expenditure, per capita income, urbanisation as positive and significant determinants of health expenditure. The income elasticity of demand for healthcare being found to be less than unity implying health is a necessary good in the various empirical works (Baltagi & Moscone, 2010; Behera et al., 2020; Dianda & Sirpe, 2020; Font & Novell, 2006; Murthy & Okunade, 2009; Sen, 2005), while another group of scholars claimed health as luxury good, as its responsiveness is sensitive to income change (Gbesemete & Gerdtham, 1992; Hitris & Posnett, 1992; Kiymaz et al., 2006; Newhouse, 1977). Souliotis and Lionis (2005) stated, among the goals of social and economic development, the public health sector will be low priority area if the income elasticity of health expenditure is less than one. Lu et al. (2010) mentioned the growth of PEH has not significantly been influenced by the level of income, in low and low-middle-income countries. According to the proponent of health as a luxury good, health should be left to market forces, while greater interference of government in health care is necessary, according to the advocates of health being necessity (Baltagi & Moscone, 2010; Di Matteo, 2003; Culyer, 1989). The long run relationship of PEH with GDP has drawn attention of Dreger and Reimers (2005), Tamakoshi and Shigeyuki (2014), while Devlin and Hansen (2001), Amiri and Ventelou (2012) as they examined both short and long run relationship. Empirical work by Rahman (2008), Bhat and Jain (2006), Hooda (2015), Behera and Dash (2017) were few attempts towards evaluating the relationship of GDP and health care expenditure in Indian context. With the objective of evaluating the relationship between PEH, health status and economic growth in India for the period from 1981–1982 to 2015–2016, Kaur (2020) confirmed that the GDP of the country was having unidirectional association with government expenditure in health care. While examining the impact of GDP on healthcare expenditure in Italy during 1982–2009, Fedeli (2015 showed empirical evidence in support of Wagner’s law suggesting as income rises, people will choose relatively more healthcare expenditure.
Thus, from the above discussion, it is clear that the success or failure of public health policies towards achieving an improved health system is a contentious issue. However, less attention has been paid so far in analysing the performance of individual states on the various supply-side indicators of public health over time. Under this backdrop, the present study makes an attempt to examine the changing pattern of public healthcare expenditure across Indian states for the period 1979–1980 to 2019–2020. An effort also has been taken to examine the nature of inter-state variation in public healthcare expenditure among the states during both pre- and post-NRHM periods. Moreover, an attempt has also been made to understand the nature of the relationship between the supply-side factors of public healthcare with spread and mortality of COVID-19 infected cases across Indian states. As mentioned earlier, the list of literature reveals several scholarly attempts to examine the relationship between income and PEH so far. However, most of the studies were carried in context of developed countries and particularly based on inter-country analysis. Though there are few attempts in the Indian context, but are restricted to a limited interval of time and states. The present study also endeavours to bridge such gaps in the literature by analysing the responsiveness of public healthcare expenditure with the change in per capita GSDP (PCGSDP) to a much-disaggregated level (state and region level analysis) for the period 1979–1980 to 2019–2020. Further, an attempt is also made to estimate the state-level targeted health expenditure for the reference period.
The rest of the fragmented into three sections. The data, methodology and econometric model building are covered in the second section. The third section compiles the results and discussion and the final section of the article outlines the conclusion and policy implications.
Data, Methodology and Econometric Model Building
Data Source and Descriptive Statistics
The study is based on secondary data collected from various published sources. The public health expenditure data were collected from the State Finances: A Study of Budgets (various issues) across states. In addition, the data on PCGSDP were gathered from the Economic and Political Weekly Research Foundation database, whereas the population data were collected from the Census of India (1981, 1991, 2001 and 2011). The state-level time series data of 41 years (1979–1980 to 2019–2020) was collected for 22 Indian states. The selection of the study period and states were constrained by the non-availability of consistent and reliable data. The state-wise public health expenditure data were collected on two broad categories: revenue expenditure and capital expenditure.
1
Besides using descriptive statistics, the compound annual growth rate (CAGR)
2
of public health expenditure was estimated across states during pre- and post-NRHM period. The per capita public healthcare expenditure (PCPHE) data were arrived after aggregating the revenue and capital expenditure across states for having an understanding about the changing pattern of healthcare expenditure across states during 1979–1980 till 2019–2020. The time period was fragmented into four sub-periods, namely 1979–1980 to 1990–1991, 1991–1992 to 2004–2005, 2005–2006 to 2011–2012 and 2012–2013 to 2019–2020. The 1979–1980 to 1990–1991 represented the pre-reform period. The 1991–1992 to 2004–2005 was the early reform and pre-NRHM period. Likewise, the 2005–2006 to 2011–2012 was the early NRHM period, whereas the 2012–2013 to 2019–2020 represented the recent NRHM period. The PCPHE was obtained by randomising the absolute figures with the population data across states. Thus, the PCPHE across states was estimated using the formula:
Construction of Supply Side Composite Index
To understand the pattern of public health expenditure across states, one supply side composite index (SSCI) was constructed separately for revenue and capital expenditure. The ‘distance from average’ method was used while constructing the index. In the first step, as discussed in the previous section, the PCPHE was calculated across states, separately for the revenue and capital expenditure, for the overall study period with the following ratio:
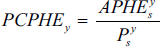
where PCPHEy denotes per capita public health expenditure for year y (y = 1979–1980 to 2019–2020, i.e. for 41 years),
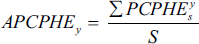
where
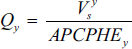
where
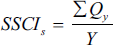
where
Building of Panel Regression Model
The association of PCGSDP with PCPHE has been examined by estimating the panel regression model. For capturing the locational/regional impact on healthcare expenditure, factor variable was included into the model. An attempt was also made to examine the impact of large-scale public health programme like NRHM on public healthcare expenditure. Thus, the panel regression model fitted for the purpose is specified in Equation (1).
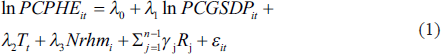
The inclusion of time (T) in the regression model helps to achieve the stationarity of the time series data on the assumption that the trend is deterministic. ε is the random errors term assumed to be independent and identically distributed with mean zero and constant variance; i indexes states (i = 1, 2, …, 22) and t indexes time period 1979–1980 till 2019–2020; j indexes the regions of the present study (j = 1, 2, …, 5). The Nrhm is a dummy variable for state i such that:
Nrhm = 1 if the period under consideration is 2005–2006 till 2019–2020.
= 0 if the period under consideration is 1979–1980 till 2004–2005.
Rj is regional dummy variable for state i such that:
R1 = 1 representing the states belonging to the Eastern region of India, = 0 otherwise.
R2 = 1 representing the states belonging to the Western region of India, = 0 otherwise.
R3 = 1 representing the states belonging to the Northern region of India, = 0 otherwise.
R4 = 1 representing the states belonging to the Southern region of India, = 0 otherwise.
For examining the interaction effect change in PCGSDP with the advent of public healthcare programme like Nrhm on PCPHE, Equation (1) is reformatted in Equation (2) as follows:
The fitted model was estimated with both random effects generalised least squares (REE) and fixed effect estimates (FEE) technique and the appropriateness of the estimation technique was judged through the Hausman test. The fitted model was also estimated using a pooled ordinary least square (PLS) technique for examining the robustness of the results. As the study used time series data of PCGSDP and PCPHE, therefore, the non-stationarity of the data may mislead the results. Thus, for testing the stationarity, the study performed two popularly used panel unit root tests—Levin–Lin–Chu (LLC) and Im–Pesaran–Shin (IPS) tests (Im et al. 2003; Levin et al., 2002).
Model Building of Panel Generalized Method of Moments
The fixed and random effect estimation technique may misinterpret the results when the lagged values of endogenous variables may be correlated with the error term (Greene, 2003). The estimation of such dynamic model is more popularly handled by instrumental variables and panel generalised method of moments (GMM) estimator. Based on the idea of Arellano and Bond (1991), the panel GMM estimation has been used in the present analysis to avoid the problem of heterogeneity and biases caused by the lagged dependent variable. Furthermore, the Arellano–Bond methodology tests for the hypothesis of the absence of serial correlation, and the standard errors of the estimates are robust to heteroscedasticity. In macroeconomic theory, expectations form important basis of economic models of the dynamic process. A useful economic theory for such purpose is the Adaptive expectations hypothesis which states that individuals form their expectations about of the future based on the recent past. Suppose, if we assume that the targeted per capita public health expenditure (PCPHE*) at period t depends upon the per capita state gross domestic product (PCGSDPt) in the form of the following equation;

where ϕ1 is the ratio of healthcare expenditure as a percent of per capita state gross domestic product. Under the assumption that states are spending less than this ratio; the objective is to achieve the target over period of time with some speed of adjustment as follows;


Replacing (3) in (4) and solving for PCPHEt

By considering δϕ0 as β0 and δϕ1 as β1 and (1 − δ) as β2 Equation (5) boils down to;

The εt is well behave error term resulting from δηt. Including the trend (T) variable the augmented log-linear formulation of Equation (6) is reported in (7);

Equation (7) is a dynamic panel model, from which we can arrive at the elasticity figures as follows;
Elasticity = β1/(1 − β2).
Here, elasticity signifies target of per capita state gross domestic product which should be spent on health expenditure. Before proceeding to the panel GMM estimation of model (7), the panel unit root tests—LLC and IPS were conducted.
Results and Discussion
Nature of Uneven Public Healthcare Expenditure Across States and Time Periods
The description of the variables used in the study and their summary statistics are presented in Table 1. It can be observed from Table 1, that the per capita mean public health expenditure is largest in Sikkim during the 41 years reference period with an average of ₹1,577.98, followed by Nagaland and Jammu and Kashmir with the mean expenditure of ₹850.37 and ₹730.54, respectively. These three states exhibit high variability in per capita mean public health expenditure for the study period with the variability is largest in Sikkim.
Descriptive Statistics of the PCPHE and PCGSDP (1979–1980 to 2019–2020) Across Indian States.

During the reference period, the per capita mean health expenditure is the smallest in Bihar with ₹124.90 with lowest variability. Such results reflect the disproportionate attention of the government towards some states with smaller states got greater attention in healthcare, relative to that of the states with larger in terms of population and geographical area. Again, Sikkim seems to be the richest state with average PCGSDP of ₹54,515.63, as against Haryana and Maharashtra with mean PCGSDP of ₹41,501.88 and ₹39,143.22, respectively, during the 41 years study period. The variability in per PCGSDP remains high in these states and the amount is highest in Sikkim. During the reference period, the average PCGSDP is lowest in Bihar with ₹8,198.6.
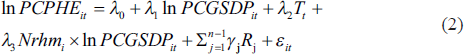
It can be observed from Figure 1 that the smaller states like Sikkim registered the highest CAGR of 11% per annum during pre-NRHM period (1979–1980 to 2004–2005), followed by 9% growth in Karnataka, Kerala and Punjab. During that period, the CAGR of PCPHE is lowest in Nagaland (4%). For the pre-NRHM period, the CAGR of India as a whole is 8%. Undoubtedly public funds in health somewhat increased after the introduction of NRHM across Indian states (Hooda, 2015) with probably greater attention for states with larger population sizes. During 2005–2006 to 2019–2020, the CAGR of PCPHE can be seen to be largest in Assam (20%), as against 19% growth in Odisha, and 16% in Gujarat, Haryana and Madhya Pradesh. Similarly, during the NRHM period, the growth rate of PCPHE is lowest in Andhra Pradesh (7%). For this period, the growth rate of India as a whole is 14% per annum. Likewise, in the overall study period (1979–1980 to 2019–2020), the growth rate of PCPHE is highest in Sikkim (11%), followed by 10% in Karnataka, Kerala, Haryana, Gujarat, Odisha and Assam. The country also registered 10% growth per annum for the overall study period. The CAGR of PCPHE is lowest in Nagaland (7%) in the overall study period. The implementation of the NRHM scheme helped in minimising the inequality in health expenditure across states and brought recovery in the allocation of public funds in health care (Choudhury & Mohanty, 2020; Hooda, 2015).
As Figure 2 shows, the average PCPHE seems to be growing for all states in the subsequent time periods. Except the period 1979–1980 to 1990–1991, in the remaining three periods, the average PCPHE is highest in Sikkim. During 2012–2013 to 2019–2020, Nagaland ranked second position, followed by Jammu and Kashmir. Similarly, during the various sub-periods, the average PCPHE is lowest in Bihar, followed by Uttar Pradesh, West Bengal and Andhra Pradesh. The larger states like Gujarat, Haryana, Madhya Pradesh and Maharashtra seem to be in vulnerable position compared with the smaller northeastern states for the reference period (refer to Figure 2). During the pre-reform period (1979–1980 to 1990–1991), the average PCPHE has not shown much variation across states. However, the sign of increasing variation in PCPHE across Indian states started exhibiting since the early years of initiation of NRHM policy and continued in the recent phase of NRHM period. A study by Das and Guha (2017) remarked per capita revenue and capital expenditure in healthcare was higher in states having smaller population sizes relative to largely populated states in North East India.

Figure 3 shows that, unlike the PCPHE, the public health expenditure to GSDP ratio is declining for all states in the subsequent time periods. In comparison with the pre-reform and pre-NRHM periods, the ratio is low in all states during both early NRHM and recent NRHM periods. In the period 1979–1980 to 1990–1991, the ratio seems to be highest in Nagaland, as against other northeastern states namely Meghalaya and Manipur. The ratio is lowest in Haryana, followed by Gujarat and West Bengal, in the subsequent sub-periods (see Figure 3). In the recent NRHM period, the ratio is highest in Manipur, followed by Jammu and Kashmir. There is no sign of any major hike on the public health expenditure to GSDP ratio in the states like Maharashtra, Punjab, West Bengal, Uttar Pradesh, Andhra Pradesh and Gujarat across sub-periods.

Table 2 indicates that, for the overall study period (1979–1980 to 2019–2020), the percentage change in the public health expenditure to GSDP ratio is negative for most of the states (except Andhra Pradesh, Assam, Bihar, Jammu and Kashmir, Madhya Pradesh, Odisha and Punjab). The percentage increase in the ratio is highest in Jammu and Kashmir, followed by Assam. Similarly, the percentage decline is highest in Nagaland, as against Sikkim. The percentage change in the ratio is negative for the larger states like Gujarat, Karnataka, Kerala, Maharashtra and Tamil Nadu in the overall study period (refer to Table 2). Likewise, during the pre-NRHM period, the percentage change in the public health expenditure to GSDP ratio is negative in all states, expect Jammu and Kashmir. For that reference period, the percentage decline is highest in Nagaland, followed by Manipur and Meghalaya. Barring Sikkim, the public health expenditure to GSDP ratio is positive for the rest of the Indian states under consideration during the NRHM period (see Table 2). For that period, the percentage increase in the ratio is highest in Assam, followed by Odisha. Similarly, the percentage increase in the ratio is lowest in Tamil Nadu, as against Himachal Pradesh.
Percentage Change in the Public Health Expenditure to GSDP Ratio.

With reference to Figure 4, it can be observed that the pattern of public healthcare expenditure among states is uneven in terms of values of the SSCI of both capital and revenue expenditure. Taking account of revenue expenditure across the selected states, it can be noticed that the SSCI of both revenue and capital expenditure is highest in Sikkim, followed by Nagaland. The value of SSCI of revenue expenditure is lowest in Bihar, followed by Uttar Pradesh. Eastern Indian states like Bihar placed at the bottom in terms of the SSCI of capital expenditure value, as against Andhra Pradesh. It is apparent that larger states like West Bengal, Uttar Pradesh, Rajasthan, Punjab, Maharashtra, Kerala and Karnataka have meagre value of SSCI for both revenue and capital expenditure (see Figure 4). Thus, the value of SSCI of public healthcare expenditure has been seen to be lowest in the state with lowest mean expenditure (revenue and capita) and low CAGR during 1979–1980 to 2019–2020. The opposite is the SSCI figure for the state hiving the largest mean expenditure and CAGR during the 41-year period under consideration. The present results are consistent with findings of Das and Guha (2017), as they found that SSCI of revenue and capital expenditure was low in states with larger population sizes in North East India.

Availability of Health Infrastructure and the Spread and Mortality of COVID-19
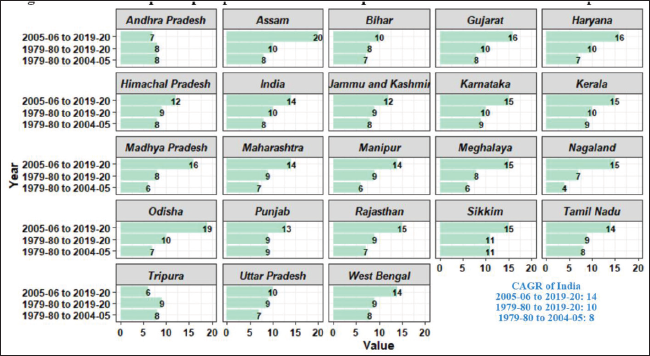
It can be observed from Figure 5 that the positivity rate and confirmed cases of COVID-19 per lakh population is highest in small state like Goa, despite higher level of average PCPHE in that state. Followed by Goa, the number of confirmed cases per lakh population is relatively higher in Delhi, Kerala and Maharashtra ranking second, third and fourth amongst the rest of the states. Though the average PCPHE is higher in Delhi relative to Kerala and Maharashtra, the national capital territory took second position in the country in terms of number of confirmed cases per lakh population. Small state like Sikkim occupied the fourth position in positivity rate of COVID-19 cases, though the average value of PCPHE is considerably higher in the state. States like Bihar, Mizoram, Uttar Pradesh, Jharkhand, Assam and Gujarat have lower levels of positivity rates and confirmed cases per lakh population. The average PCPHE considerably higher in Arunachala Pradesh and Mizoram, and these states have a low level of positivity rate and confirmed cases of COVID-19 per lakh population till 23 May 2021.
From this discussion, it can be inferred that the average PCPHE across Indian states has exhibited irregular pattern of association with positivity rate and confirmed cases of COVID-19 per lakh population. Barring Mizoram, Jammu and Kashmir, Arunachal Pradesh, Meghalaya and Odisha, in the one hand higher positivity rate and number of confirmed cases per lakh population seem to be directly associated with higher PCPHE. While on the other end, lower PCPHE is associated with a lower positivity rate and number of confirmed cases.
Figure 6 shows that the southern state Kerala is well placed in terms of health infrastructure per lakh population, followed by Karnataka, Tamil Nadu and Goa for the period under consideration. The death rate of COVID-19 infected cases seems to be very alarming in the northern state of Punjab, despite the state having relatively better health infrastructure compared to the national capital territory of Delhi. Followed by Punjab, the death rate from COVID-19 infected cases seems to be higher in Uttarakhand, Maharashtra, Sikkim, Delhi, Goa, Meghalaya, Manipur and Himachal Pradesh. The death rate from the infected cases is lower in Mizoram, Odisha, Arunachal Pradesh and Kerala.
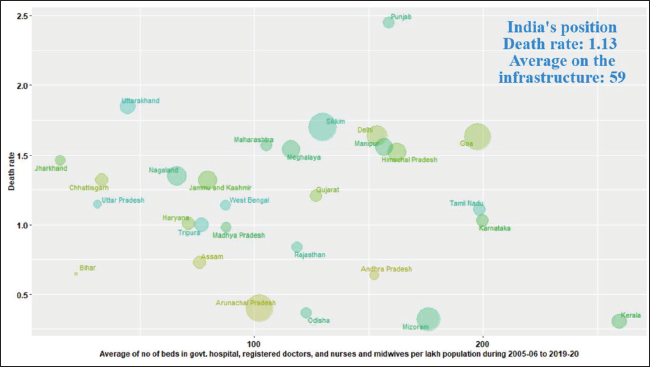
Thus, from the above discussion, it can be observed that the low death rate in Kerala, Mizoram and Arunachal Pradesh may be because of availability of better health infrastructure. Despite the higher level of average PCPHE and moderately better health infrastructure, the death rate is high in Punjab, Sikkim, Delhi and Goa. Amongst the states with poor availability of health infrastructure namely Bihar, Uttar Pradesh, Chhattisgarh, Jharkhand and Uttarakhand, the death rate from COVID-19 cases is relatively high in Uttarakhand. Interestingly, the death rate is low in Bihar, despite the fact that the state has been neglected so far in terms of allocation of public funds towards healthcare and the weak base of health infrastructure in the state.
Responsiveness of PCPHE with the Change in PCGSDP Across States and Time Periods
Estimation of Panel Regression Model
Before proceeding to the estimation of the fitted panel regression model, initially, the panel unit root test was conducted to examine if the variables are stationary or not at level. As per the test results of LLC and IPS, we reject the null hypothesis of unit root indicating that the variables are stationary and we can use them in the regression models in their levels (see Appendix 1). With reference to the PLS regression result of the model (1) as reported in Table 3, it can be observed that the coefficient of PCGSDP turned out to be positively significant with an estimated coefficient value of 0.18. Thus, for every 1% increase in the PCGSDP, the state level public health expenditure has gone up by 0.18% during the reference period. The present results are consistent with the findings of Rahman (2008), and Bhat and Jain (2006). The coefficient of time being positively significant implying with the progress of time by an additional year raised the state level health expenditure by 0.07 per cent across the selected states. The coefficient of Nrhm is positive, albeit it is insignificant. This implies that there has been an increase in state level health expenditure with the implementation of NRHM scheme across states. The statistically significant results of regional dummy reflect the discrepancy on the public health care expenditure among regions. The coefficient of Eastern, Western and Southern region is found to be negatively significant with the estimated coefficient of 1.07, 0.82 and 0.80, respectively. This implies the public health care expenditure in states belonging to the Eastern, Western and Southern region is lower by 1.07%, 0.82% and 0.80%, respectively, relative to the states in the North Eastern region. The coefficient of the reference group is positively significant with an estimated value of 2.73, which implies that the state level health expenditure is higher by 0.04%, in the states belonging to the North Eastern region. The possible explanation of such results may be because of remarkably higher real per capita state public health expenditure in Sikkim, Nagaland, Meghalaya and Manipur relative to rest of Indian states under consideration during the reference period.
Estimation of Elasticity of Public Health Expenditure (1979–1980 to 2019–2020).
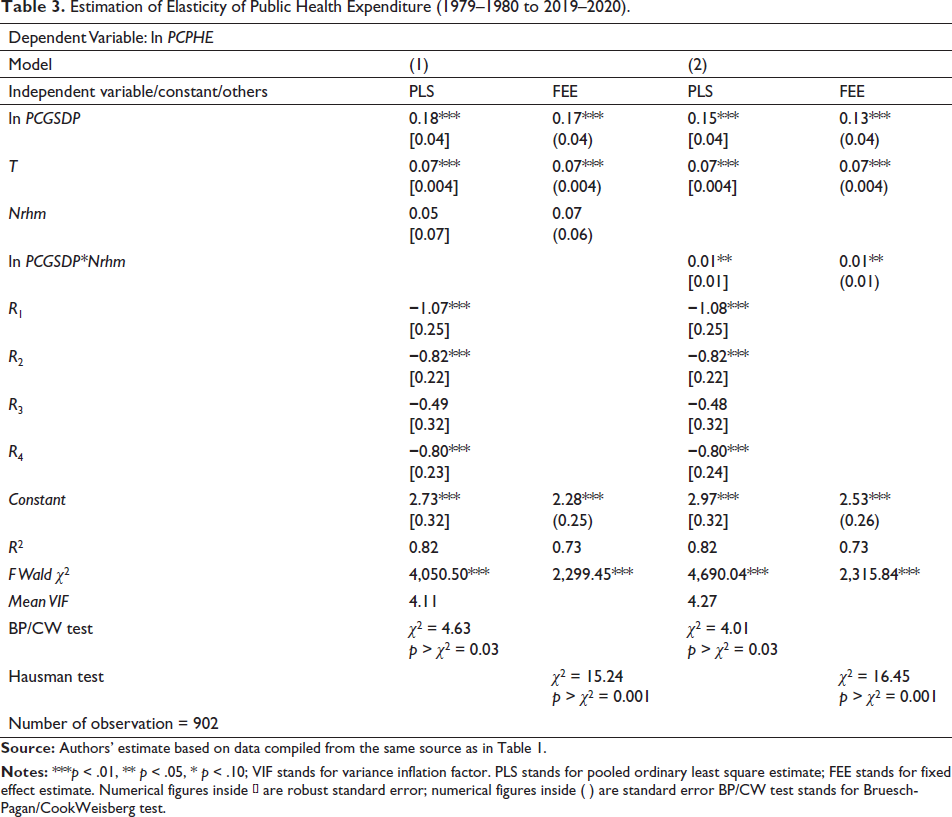
As Table 3 shows, based on Hausman test, the study accepts the FEE result as more appropriate compared with REE. So far as the FEE results of model (1) are concerned, we arrived at similar sets of results, unlike the PLS. Again, the estimated coefficient of the PLS regression model (2) provides similar sets of results for non-categorical factors like the PLS results of model (1). The estimated coefficient of interaction effect has been found to be positively significant with coefficient value of 0.01. Such result infers that, an increase in the level of real PCGSDP during the period of implementation and operation of NRHM, the real PCPHE gone up by 0.01% across selected states. Based on Hausman test for model (2), we accepted the FEE as more appropriate compared with REE. So far as the FEE results of model (2) are concerned we arrived at similar sets of results unlike the PLS.
As per the results reported in Table 3, in both models (1 and 2), with alternative estimation specifications, the high R2 value accompanied by a significant F statistic indicates that the estimated regression gives a good fit to the data. The presence of heteroscedasticity in the data set for the fitted model has been confirmed by the diagnostic results of the Bruesch–Pagan/Cook–Weisberg Test. To get rid of the heteroscedasticity issue, the study reports the robust standard error for the estimated coefficients of the PLS results of the regression model (1 and 2). As per the mean value of the VIF, it is also confirmed the absence of multicollinearity among the independent variables in the fitted regression models.
Estimation of State Level Targeted Health Expenditure Through Panel GMM
With reference to the panel GMM estimate of the fitted regression model (Equation 7), the coefficients of PCGSDP and PCPHEt−1 are found to be statistically positively significant (see Table 4). Thus, ceteris paribus, 1% change in PCGSDP across the 22 Indian states is associated with less than 1% (0.46%) increase in public health expenditure in the short run. Hence, PCGSDP and public health expenditure exhibit an inelastic relationship implying health care as a ‘necessary’ good in the Indian states. Such result is quite intuitive in a country inhabiting the second largest population of the world; health care is undeniable necessity with the seasonal and regular nature of disease. The results provide some support for the view that health care is necessary good with income elasticity of health care expenditure less than unity, as suggested by the previous findings of Di Matteo and Di Matteo (1998), McLauglin (1987), Behera and Dash (2017), Bhat and Jain (2004, 2006), Rahman (2008), Dianda and Sirpe (2020), Behera et al. (2020), Farag et al. (2012), Sen (2005), Chakroun (2010), Gerdtham et al. (1998), Baltagi and Moscone (2010), Fernandez et al. (2014).
Estimation of Targeted Spending on Public Health Through Panel Generalised Method of Moments (2005–2006 to 2019–2020).
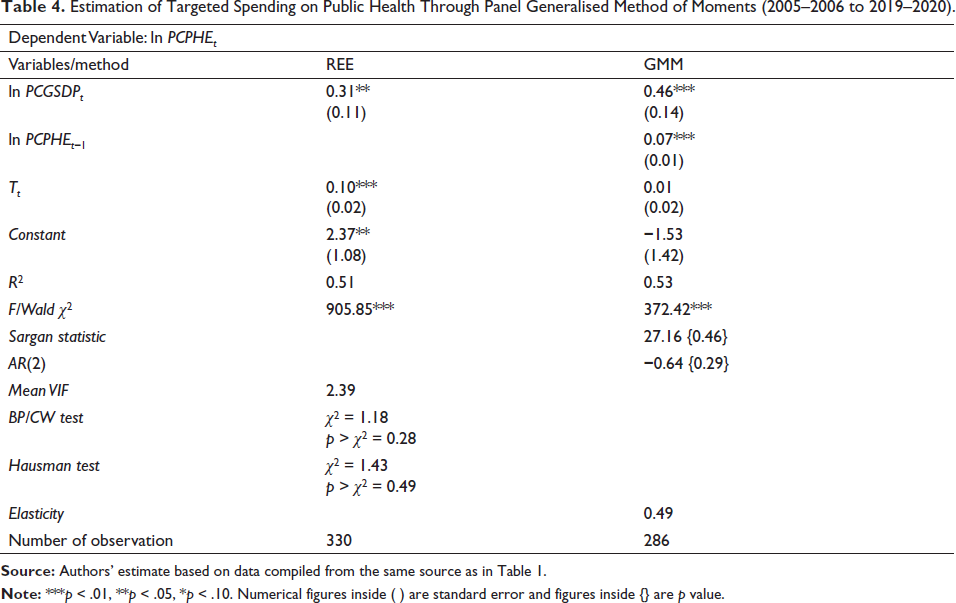
The estimated coefficient of PCPHEt−1 implies that a 1% increase in public health expenditure in the previous period is associated with less than 1% (0.07%) increase in health expenditure in short run. The present results corroborate the findings of Fernandez et al. (2014), Bhat and Jain (2006). As reported in Table 4, the estimate value of the elasticity reveals that the state governments in India have a target of spending 0.49% of GSDP on health care. In the similar course of experiment, Bhat and Jain (2004) found the elasticity value less than unity. Such value of elasticity has important policy implications so far as the National Health Policy of 2018 which emphasised on raising the government health expenditure as a percentage of GDP to 2.5% by 2025. Achieving such goal may require to increase budget allocation by the state government towards health care in India. It seems to be very ambitious given the current level of outlay, and for achieving the government need to prioritise the health care spending with structural reform. This is more important when every 1% increase in PCGSDP, the health care expenditure merely increases by 0.31%. The diagnostic test results of panel GMM estimates in Table 4 confirm the robustness of estimated result from serial correlation. The selection of instrument is appropriate in terms of Sargan statistic. The AR (2) result suggests that there is no second order serial correlation, which implies that the lags of the dependent variable used as instrument are not endogenous.
Conclusion and Policy Implications
The present study is conducted to examine the changing pattern of public healthcare expenditure and the nature of inter-state variation on this for the period 1979–1980 to 2019–2020 across Indian states. Moreover, an attempt has also been made to understand the nature of relationship between the spread and mortality of COVID-19 infected cases and the supply side factors of public healthcare across Indian states. The study also adds in the literature by analysing the responsiveness of PCPHE with the change in PCGSDP to a much-disaggregated level for the period 1979–1980 to 2019–2020. Besides using descriptive statistics and diagrammatical representation, one SSCI was constructed to understand the nature and direction of public healthcare expenditure across states and time periods. Moreover, the panel regression model and panel GMM were used for examining the responsiveness of PCPHE with the change in PCGSDP. The results of analysis show that the larger states like Gujarat, Haryana, Madhya Pradesh and Maharashtra seem to be in vulnerable position in terms of PCPHE. Greater variation in PCPHE across Indian states started exhibiting since early years of initiation of NRHM policy and continued till recent years. Unlike the PCPHE, the public healthcare expenditure to GSDP ratio is declining for all states in the subsequent time periods. The value of SSCI for both revenue and capital expenditure is low in states having larger population and geographical areas. The SSCI results reflects disproportionate attention of governments in terms of revenue and capital expenditure with smaller states got greater attention in healthcare, relative to that of the states with larger in terms of population and geographical area. It can be argued that the average PCPHE across Indian states has exhibited irregular pattern of association prevailing COVID-19 situation of confirmed cases, positivity and death rate. Higher death rate in few states were directly associated with PCPHE and moderately better health infrastructure while the most neglected state has least number of reported deaths from COVID-19.
The panel GMM estimate of PCPHE has exhibited an inelastic relationship with PCGSDP implying public healthcare is a ‘necessity’ across the Indian states. The elasticity value arrived from dynamic panel model also signifies state governments in India have a target of spending 0.49% of GSDP on health care. Undoubtedly, implementation of NRHM scheme has brought some recovery in public health expenditure across Indian states, but still there is need for greater allocation funds by the state and Union governments towards health care with the ambitious target set National Health Policy of 2018.
Unit Root Test Results.

Footnotes
Declaration of Conflicting Interests
The authors declared no potential conflicts of interest with respect to the research, authorship and/or publication of this article.
Funding
The authors received no financial support for the research, authorship and/or publication of this article.