



Abstract
Spirometry is an essential tool to effectively diagnose and manage respiratory diseases. However, population-specific predicted values are essential to interpret the results accurately. The GLI-2012 equations were formulated to be used globally and are widely endorsed. However, these equations have never been validated among the Iraqi population. Pulmonary function tests were successfully performed by 738 (345 females) healthy, non-smoker, Iraqi adults. z-scores, per cent predicted values and frequency of measures below lower limit of normal (LLN) were computed using Global Lung Function Initiative (GLI) 2012 equations for Caucasians (GLI-C) and other or mixed (GLI-O) and Al-Qerem et al. equations. The Al-Qerem et al. equation produced the closest z-scores’ means to zero in forced vital capacity (FVC) in females (0.18) and in forced expiratory volume in 1 second (FEV1)/FVC% in both sexes (0.18 for males and 0.58 for females). For FEV1, the closest z-scores’ means to zero were produced by GLI-C (–0.15 for males and –0.18 for females). All the studied equations had a frequency of participants with LLN significantly different from the expected 5 per cent in at least one spirometric parameter. The GLI 2012 equations were not a suitable fit for Iraqi adults.
Keywords
Introduction
The incidence of chronic respiratory diseases has increased in the last decade (D’Amato et al., 2016). Globally, mortality due to respiratory diseases represents more than 20 per cent of total deaths (Decramer, 2011). In Iraq, respiratory disorders are common (Korzeniewski, 2006), for example, it was reported that 15.1 per cent of Iraqi smokers in Baghdad suffer from chronic obstructive pulmonary disease (COPD) (Al Lami & Salim, 2017).
Spirometry is a dependable tool used in pulmonary examination (Al-Qerem, Hammad, AlQirem et al., 2019), and is the gold standard technique for diagnosis and screening of many respiratory diseases. Spirometry is also used for monitoring the therapeutic effects of medications on several pulmonary disorders (Moore, 2012) and differentiating between pulmonary diseases like asthma and COPD (Hyatt et al., 2014; Pierce, 2005). Spirometry can be conducted easily at home, clinics and other locations (Al-Mudheffer, 2012).
Pulmonary function tests (PFT) require dependable spirometric reference values to interpret the results correctly (Crapo, 2004). These values differ according to age, sex, height and race (Quanjer, Hall, et al., 2012). Due to genetic and environmental differences, the applicability of different spirometry equations varies between different countries (Quanjer, Hall, et al., 2012; Shaffer et al., 1993).
The Global Lung Function Initiative (GLI) equations were developed in 2012 in an attempt to produce equations that can be applied in different populations (Quanjer, Stanojevic et al., 2012). The GLI 2012 contains five equations including Caucasian and other or mixed ethnicity (Quanjer, Stanojevic et al., 2012). GLI 2012 equations are based on data collected from 33 countries. However, it did not include data from Arab countries in the Middle East. The European Respiratory Society stated that data are required from the Arabic area to evaluate the applicability of GLI 2012 equation on Arabic populations (Quanjer, Stanojevic et al., 2012). Recently published work that evaluated the applicability of GLI 2012 equations on the neighboring Jordanian population found that the applicability of the equations varies between different age groups (Al-Qerem, 2020; Al-Qerem et al., 2021; Al-Qerem, Hammad, AlQirem et al., 2019; Al-Qerem & Jarab, 2021). The purpose of this study is to evaluate the applicability of the GLI 2012 equations on healthy and nonsmoking Iraqi adults.
Method
This study was performed in different locations in Iraq including Baghdad, Al-Anbar, Erbil, Mosel and Saladin. Participants were invited through announcements through social media and individual approach.
The sample recruited included only healthy and nonsmoking Iraqis aged 18 years or older. The exclusion criteria included apparently obese individuals with body mass index (BMI) equal to or more than 35 kg/m² and those suffering from cardiopulmonary diseases. Some volunteers fitted the inclusion criteria but were unable to perform the spirometry test correctly; their test results have been excluded from the analysis.
Information about the study was provided to participants, and all those who agreed to participate completed a consent form prior to their enrolment. After consent, participants completed a questionnaire that included questions about health status, medication use, whether they currently or previously smoked, whether there are any smokers in their household, and if they suffer from any cardiopulmonary diseases. Ethical approval was granted by the Research Ethics Committee of Al‐Zaytoonah University of Jordan, Amman, Jordan.
Measurement of Pulmonary Function
Spirometry tests were performed according to the European Respiratory Society guidelines (Miller et al., 2005). Tests were conducted with a computer‐based spirometer, a MIR Minispir (MIR, Italy). The participants were instructed to sit upright, have their feet flat on the floor and have their legs uncrossed during testing in order to ensure consistent measurements. For the testing, a chair with arm was used.
To maximise hygiene and reduce the potential for any spread of infection, after each participant, the technician’s hands were washed, and a new disposable mouthpiece was used for each participant. Any air leakage was prevented by asking the participants to seal their lips around the mouthpiece and a closed-circuit method was used where a nasal clip was used for the test. Participants were instructed to take a few normal breaths, then a deep breath after which a quick full inspiration then a short pause for <1 second before being asked to blow out as hard and fast as possible and to keep on going until there was no air remaining, the researcher verbally encouraged the participants to perform the maneuver correctly. This was repeated until three acceptable maneuvers were obtained. In order to get acceptable maneuver, a strong start should be ensured without hesitation and with back‐extrapolation volume <150 mL.
The test had to be carried out with full inspiration and expiration, without coughs specifically in the first second of the test, no glottis closure, without any leakage and the maneuver had to follow the end-of-test requirements. The difference should not exceed 5 per cent or 150 mL between the largest two values for forced expiratory volume in 1 second (FEV1) and forced vital capacity (FVC). If the difference was more than 5 per cent between FEV1 and FVC, more maneuvers were performed, with an upper limit of eight maneuvers.
The same researcher collected all the data, using the same spirometer for all tests. A nurse with previous experience of working in a respiratory clinic was also present throughout data collection.
In the final collected data, all the data were studied and only the data of acceptable trial quality and reproducible PFT results as indicated by the spirometer were included in the analysis (Miller et al., 2005).
Measurement of Anthropometric Parameters
The same standardised electronic weighing machine, Square Personal Digital Electronic Weighing Scale manufactured by INDMART, was used throughout the study period to measure weight to the nearest 0.1 kg. Weighing was conducted after asking the participant to get rid of heavy clothes and shoes and emptying their pockets. A stadiometer, Seca 213 Portable Stadiometer Height-Rod (SECA Company), was used to measure the height of the participant without shoes to the nearest centimeter. BMI was calculated according to Quetlet’s index (body weight in kg/height in m2) (Garrow & Webster, 1985).
Statistical Analysis
Comparisons in anthropometric and spirometry parameters were conducted between the two sexes. For normally distributed parametric data, t-test was conducted and for nonparametric variables, Mann–Whitney U test was used. Normal predicted values and predicted per cent for FEV1, FVC and FEV1/FVC% were calculated by using different reference equations for each participant including GLI 2012 Caucasians (GLI-C) and other or mixed ethnicity (GLI-O) equations (Quanjer, Stanojevic et al., 2012) and Al-Qerem et al. equation which was formulated for adults from Jordan (Middle Eastern population) (Al-Qerem, Hammad, Gassar et al., 2019). As in previous research (Fasola et al., 2017), the z‐scores for FEV1, FVC and FEV1/FVC% for each participant were produced using different studied reference equations. The examination of the Q–Q plots, evaluation of skewness and kurtosis and performing Kolmogorov–Smirnov test were used to evaluate normal distribution assumption of the z‐scores for each equation in each studied spirometric parameter for each sex. Wilcoxon test was used to compare the predicted percentage produced by the studied equations to the hypothetical value of 100 per cent.
For each participant for each studied spirometry equation, lower limits of normal (LLN) for FEV1 and FVC and FEV1/FVC% were calculated and the number of records below LLN should not exceed 5 per cent for the equation to be perfectly representative of the study sample (Coates, 2011). Linear regression models were applied to evaluate the associations between age, height and sex and the z-scores produced by the studied equations. All data analyses were performed with SPSS v23.
Results
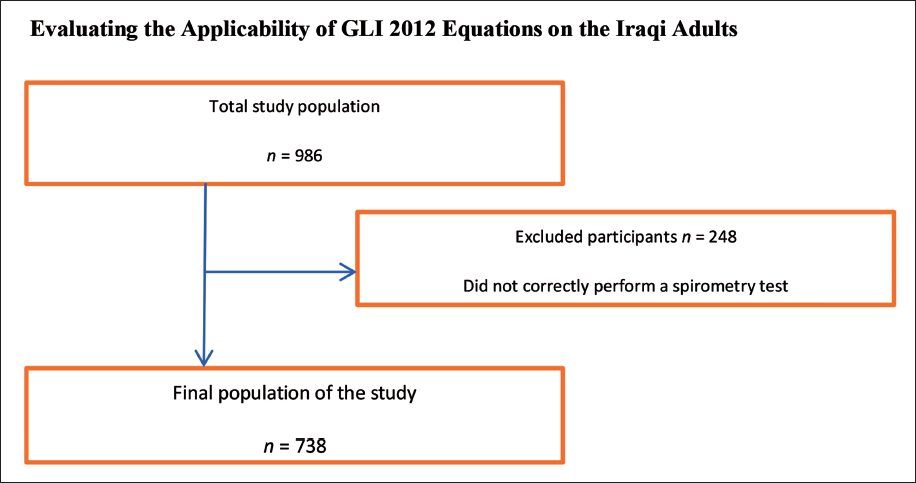
Overall, 986 volunteers performed the spirometry test. Of these, 248 were excluded due to incorrectly performing spirometry test. The present study therefore included data from 738 healthy participants who met the inclusion criteria (Figure 1).
Recruitment Flowchart.
All included participants, males 393 (53.3 per cent) and females 345 (46.7 per cent), were able to perform spirometry correctly. Ages of participants ranged from 18 to 87 years (means: 32.2 years for males and 38.5 for females). The most common age group (46.2 per cent) was between 18 and 30 years as shown in Table 1. Significant differences were found between males and females in height and weight where males appeared taller and heavier than females. BMI was significantly higher in females (29.55 vs. 26.59). The differences between males and females also appeared in PFT’s parameters where FEV1 and FVC were significantly higher in males than females while FEV1/FVC% was significantly higher in females.
Association between Sex and Sample Characteristics and Spirometry Parameters.
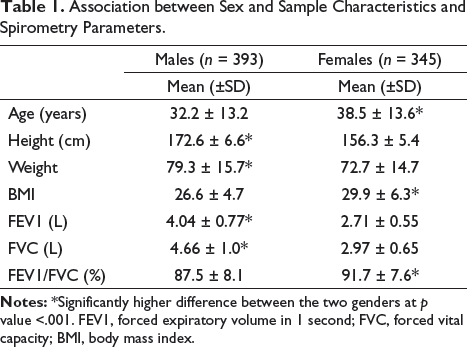
Table 2 provides information about means and variances of PFT’s z-scores created by the three studied equations. As shown in Table 2, the closest z-scores’ means to zero in FVC were produced by GLI-O equations in males and by Al-Qerem et al. equation in females. The GLI-C produced the furthest z-scores from zero in FVC when compared with the other studied equations. The GLI-C generates z-scores with the closest mean to zero in FEV1 in both males and females. Also, the furthest z-score value from zero in FEV1/FVC% was produced by GLI-C, while Al-Qerem produced the closest in both sexes.
z-Scores of Spirometry Parameters Produced by the Studied Equations.

The predicted values of FEV1/FVC% were underestimated by all studied equations (positive z-scores). The FVC and FEV1 predicted values were overestimated by GLI-C equation. All spirometry parameters predicted values were underestimated by GLI-O except for FVC in females which was overestimated. The Al-Qerem et al. equation underestimated all spirometry parameters. The standard deviations of all spirometry parameters’ z-scores produced by Al-Qerem et al. equation were the closest to one.
Information about spirometry parameters predicted values and per cent predicted values using different equations are shown in Table 3. GLI-C produced the highest predicted FVC and FEV1 values in both sexes while the highest predicted values of FEV1/FVC% were produced by Al-Qerem et al. Wilcoxon test results indicated that the predicted percentages produced by all the studied equation were significantly different from 100 per cent in all parameters in both sexes.
Parameters Predicted Values and Per cent Predicted Values Produced by Studied Equations.
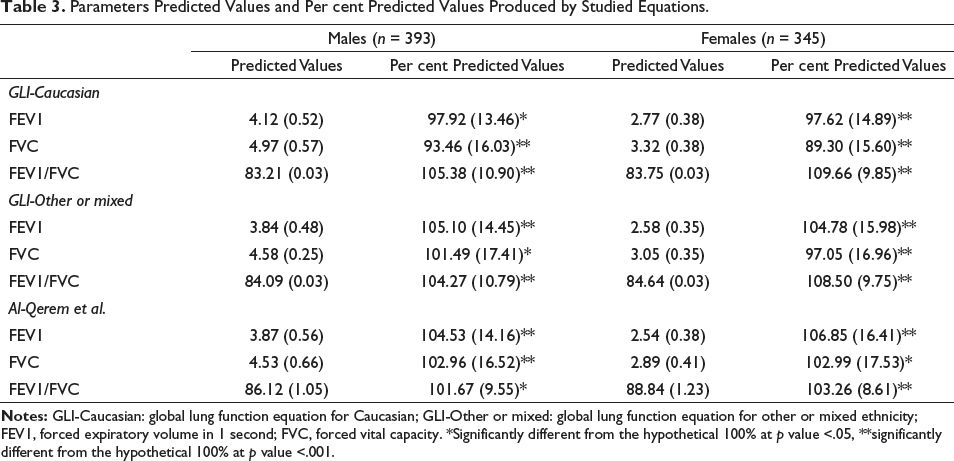
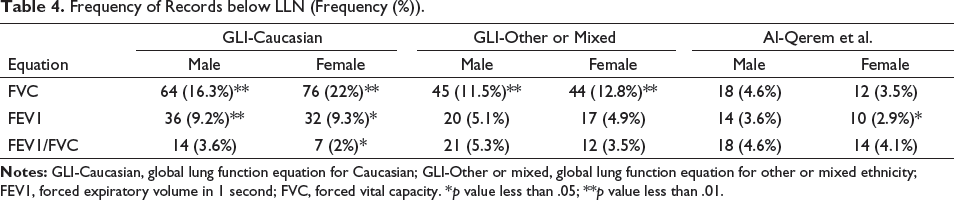
Table 4 provides information about frequency of records below LLN, none of the studied equations was a perfect fit for all parameters studied in terms of the expected 5 per cent below LLN. There were some differences between equations, as some were closer to 5 per cent than others. The numbers of participants with spirometric values below LLN produced by GLI-C were significantly different from the expected 5 per cent in all the evaluated parameters in both sexes except for FEV1/FVC% in males. For GLI-O, significant difference from the expected 5 per cent was only observed in FVC values in both sexes. For the Al-Qerem et al. equations, the only significant difference from the expected 5 per cent was observed in FEV1 in females.
Frequency of Records below LLN (Frequency (%)).
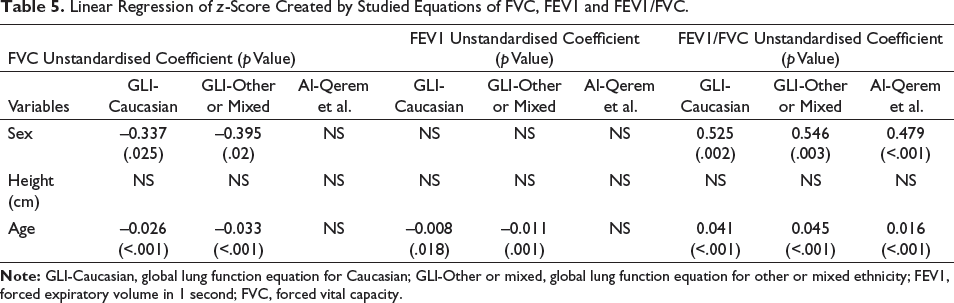
Multiple linear regressions were performed to evaluate the relationship between anthropometric parameters (age, sex and height) and z-scores of spirometry parameters produced by the studied equations.
The z-scores produced by Al-Qerem et al. equations were not significantly associated with sex, height and age in FEV1 and FVC. z-scores produced by GLI-2012 equations were significantly associated with at least one anthropometric parameter in FEV1, FVC and FEV1/FVC% (Table 5).
Linear Regression of z-Score Created by Studied Equations of FVC, FEV1 and FEV1/FVC.
Discussion
This is the first study to examine the applicability of the GLI 2012 and other regional equations to the Iraqi population. As no spirometry data were provided from Iraq or other Middle Eastern Arab countries in formulating GLI 2012 equations, the GLI requires spirometry data from Iraq and other related countries. Spirometry values differ according to many factors including age, height, weight and ethnicity, and therefore spirometry data developed in one country may not be applicable in another (Quanjer, Stanojevic et al., 2012). This study includes 738 Iraqi participants aged from 18 to 87 years. The minimum number of samples required to represent a population in a spirometry study is 300 participants, with 150 males and 150 females (Quanjer et al., 2011). The 393 males and 345 females included in this study are, therefore, an acceptable representative data set for the Iraqi population.
The mean ages of participants of 32.2 for males and 38.5 for females which are compatible with the Iraqi population as a youthful community (Desa, 2015). The present study found that males were taller and heavier than females. Spirometry parameters FEV1 and FVC are greater in males than females, while FEV1/FVC% is higher in females. These findings correlate with previous studies (Al-Rawas et al., 2009; Hankinson et al., 1999; Korotzer et al., 2000).
Suitability of GLI 2012 Equations
The GLI 2012 was developed to provide predictive equations for different populations for pulmonary function evaluation. Data have been collected from different countries and centers. Data from Oman, representing Middle East data, were omitted when formulating the GLI 2012 equations because it did not correlate with any of the formulated ethnic-specific equations, hence the need to obtain spirometry data from Arabic countries as soon as possible (Quanjer, Stanojevic et al., 2012).
In order for a studied equation to be a perfect fit to a data set, z-scores’ mean should be equal to zero (Quanjer & Stanojevic, 2016). Due to data variation between different populations, the GLI 2012 committee decided that the minimum acceptable variation in z-scores’ mean is ±0.5, which represents the cut-off point to determine the fitness of GLI 2012 equations on a selected sample data (Quanjer, Stanojevic et al., 2012). In addition, the standard deviation should be equal to one, and the frequency of records below LLN is expected to be 5 per cent (Quanjer, Stanojevic et al., 2012). z-scores are more reliable than the traditional predicted per cent calculations because they are independent of any bias to anthropometric parameters including gender, age, height and race (Quanjer et al., 2014). Therefore, the current study uses z-scores to evaluate the applicability of the GLI 2012 equations to the Iraqi population.
The results of the current study indicated that GLI-O equation was more suitable than GLI-C for the Iraqi population. The mean z-scores produced by GLI-O fell within the cut-off point (±0.5) for all spirometry parameters except FEV1/FVC% in both genders. The produced GLI 2012-C z-scores for FVC and FEV1/FVC% parameters were above cut-off point (>±0.5) in both genders.
The frequencies of records below LLN (5 per cent) for all parameters were higher in GLI-C in comparison with GLI-O; in FVC 16.3 per cent and 22 per cent measures in males and females respectively were below LLN produced GLI-C, while 11.5 per cent of males and 12.8 per cent of females were below LLN of FVC produced by GLI-O.
In FEV1 for both sexes, the numbers of the participants with spirometric values below LLN produced by GLI-O were the closest to 5 per cent when compared to the other studied equations. For FVC and FEV1/FVC%, the number of females who produced spirometric values below LLN generated by Al-Qerem et al. was the closest to 5 per cent.
Further analysis shows that the predicted value of GLI-C was significantly higher than predicted value of our population data. In contrast, the GLI-O predicted values were slightly lower than our population data. These findings correlate with previous studies that reported that the Middle Eastern Arabs have lower pulmonary function parameters compared with European Caucasians (Al Ghobain et al., 2014; Al-Qerem, Hammad, AlQirem et al., 2019; Al-Riyami et al., 2004; Hankinson et al., 1999; Korotzer et al., 2000; Yang et al., 1991). This reduction in PFT parameters in Middle Eastern Arabs when compared with European Caucasians may be due to genetics, nutrition, socioeconomic status and air pollution levels, or a combination of these (Al-Rawas et al., 2009). The findings of this study are, therefore, compatible with a study that evaluated the suitability of GLI 2012 equations on Jordanian adults (Al-Qerem, Hammad, AlQirem et al., 2019). Al-Qerem et al. conclude the GLI 2012-C population is inapplicable on Jordanian adults. Al-Qerem et al. also found that GLI-O equations were more appropriate than GLI-C for Jordanian adults.
Applicability of Regional Equations
Al-Qerem et al.’s equations were based on Jordanian adults and were developed in order to define the healthy Jordanian spirometric reference value (Al-Qerem, Hammad, Gassar et al., 2019). Al-Qerem et al. is the only study that the authors know of that formulated equations for spirometry using Generalised Additive Models for Location Scale and Shape (GAMLSS) method in the Middle East (Al-Qerem, Hammad, Gassar et al., 2019). This methodology was also used to produce GLI 2012 equations (Quanjer, Stanojevic et al., 2012). GAMLSS is superior to normal linear regression in many aspects. First, it allows for the formulation of models that are adjusted for variance, skewness and kurtosis. It also offers the ability to include splines in the equations that improve the representation of the data and provide high flexibility to the generated models. Moreover, GAMLSS is not confined by assumptions required in linear models including normality of the residuals and constant variance. These assumptions are not suitable for spirometry parameters, in particular FEV1/FVC, which usually has a skewed distribution (Cole et al., 2009).
The results of the current study indicated that Al-Qerem equations were more suitable for our population data than GLI 2012 equations. The z-scores’ mean values produced by Al-Qerem et al.’s equation were closer to zero than z-scores produced by GLI 2012. The z-score values were within the cut-off point (±0.5) for all studied parameters in both genders except for FEV1/FVC% in females. Furthermore, the frequencies of records below LLN produced by Al-Qerem et al. equations were closer to 5 per cent when compared with GLI-C for all studied parameters. Moreover, linear regression showed no significant association between anthropometric; age, sex, height and spirometry parameters except for FEV1/FVC.
Strengths and Limitations
The present study included data from 738 volunteers which is satisfactory to validate the applicability of spirometric reference value according to previous studies (Quanjer et al., 2011). The data were collected from different cities and locations including urban and rural areas of Iraq in order to represent the Iraqi population appropriately.
Modern computer-based spirometer, MIR Minispir, was used for data collection. This type of spirometer is accurate and can save all records of anthropometric parameters like age, height and weight. Importantly, the present study includes a wide age range, including data from men up to age 74 and women up to age 87.
A limitation of this study is the age distribution of participants; around 45 per cent of participants were below 30 years. This is, however, a good representation of the Iraqi population as over 58 per cent of the Iraqi population is under the age of 30 years old (Desa, 2015). Another limitation of the current study is that other variables that may affect spirometric parameters were not measured in the study. These variables include indoor and outdoor exposure to air pollution and physical activity. Finally, the participants’ healthiness was based on their own reporting and was not confirmed independently.
Future Work
Future research will evaluate the applicability of GLI 2012 equations on preschool and school-age children.
Conclusion and Recommendations
The present study was performed to evaluate the suitability of GLI 2012 equations on healthy, nonsmoking, Iraqi population. As mentioned previously, GLI-O was more applicable than GLI-C for the Iraqi population and the most suitable equations for the study data were Al-Qerem et al. equations. Continued use of the GLI 2012 equation to evaluate respiratory function of Iraqi population is therefore likely to produce incorrect interpretation of the PFT results.
Data Availability
The data sets generated and analysed during the current study are available at Mendeley repository,
Footnotes
Declaration of Conflicting Interests
The authors declared no potential conflicts of interest with respect to the research, authorship and/or publication of this article.
Funding
The authors received no financial support for the research, authorship and/or publication of this article.