Abstract
This article examines the dependence of states on central fiscal transfers. The pattern of dependence of states on central transfers is studied with respect to five groups of states, namely, high-, middle- and low-income general-category states and two groups of special-category states categorized into high- and low-income states. We make a distinction between transfers that are in the form of an entitlement like states’ share in central taxes or statutory grants vis-à-vis transfers that are discretionary and depend on centre’s decisions. In terms of groups of states, the extent of dependence is relatively quite high for the special-category states and the low-income states. The extent of dependence was lowest during the period covered under the Tenth Finance Commission period. It has since increased, for all states considered together, by about 3.5 percentage points, from 37.4 per cent to 40.9 per cent of states’ revenue receipts. This increase comes both from entitlement transfers and discretionary transfers to the extent of 2.1 and 1.3 percentage points, respectively.
Keywords
Introduction
States derive a certain portion of their revenue receipts from central transfers in the form of share in central taxes and grants from the Finance Commission, Planning Commission and other central ministries. The share of total transfers from the centre in the total revenue receipts of the states or revenue expenditures indicates the extent to which a state depends on the transfers from the centre. These shares show variations across states and over time. In this paper, we undertake an analysis of the degree of dependence of individual states (or groups of states) on central transfers for the period from 1990–1991 to 2010–2011. This covers the periods of awards of the Ninth Finance Commission [Main Award] (1990–1991 to 1994–1995), Tenth Finance Commission (1995–1996 to 1999–2000), Eleventh Finance Commission (2000–2001 to 2004–2005) and Twelfth Finance Commission (2005–2006 to 2009–2010). The first year of the Thirteenth Finance Commission award period, 2010–2011, is also included in the analysis. States are divided into five groups: for general-category states the groups pertain to high-, middle- and low-income states; the special-category states are divided into two groups based on per capita income (high-income and low-income states): Group 1 and Group 2. Group 1 contains the following states: Himachal Pradesh, Jammu and Kashmir, Uttarakhand, Sikkim and Meghalaya. Group 2 contains the following states: Arunachal Pradesh, Manipur, Mizoram, Nagaland and Tripura.
In this article, we look at the pattern of changes in states’ dependence on the share of central taxes, plan grants and non-plan grants which they get on the basis of the recommendations of the Finance Commissions. A state’s dependence on the share of central taxes has changed over time. These changes are partly due to the recommendation of the Finance Commission as to the share that should be given to the states from centre’s shareable portion of tax revenues as well as on changes in economic growth and tax-efforts of both the central and state governments. We make a distinction between transfers that are constitutionally provided for like the state’s share in central taxes and statutory grants and transfers that are based on centre’s discretion such as plan grants and other grants. Although part of plan grants is formula based, the weight that is attached to this part remains discretionary.
This article is organized into four sections. In the first section, a scheme of decomposition of transfers to state with respect to funds that are qualitatively different is suggested. The second section provides a decomposition of dependence of states on central funds when the states are considered together. In the third section we look at the pattern of dependence for individual states as divided into five groups. The general-category states are divided into three groups, namely high-income, middle-income and low-income states and the special-category states are combined into two groups called Group 1 and Group 2. The findings are summarized in the last section.
Methodology
In this section we develop a methodology to decompose the dependence of the states on total transfers from the centre. This includes the share in central taxes as well as grants from all sources. 1
An index of dependence (D) is defined as:
where, TR = Transfers Received by a State on Revenue Account and RR = State’s Total Revenue Receipts 2
TR consists of four sources of funds that are qualitatively different.
where, SCTR = Share in central taxes, STG = Statutory Grants, PT = Plan Grants, OG = Other Grants
Correspondingly D can be seen as the sum of four components:
where D1 = D * SCTR/TR; D2 = D * STG/TR; D 3= D * PT/TR and D4 = D * OG/TR
We can see the degree of dependence in two ways:
The first term indicates dependence on share in central taxes, which is affected by GDP growth and the buoyancy of central taxes. The second term shows dependence on grants that are determined in nominal terms. The two terms are qualitatively different.
Second, we can combine these components as follows:
The first term in parenthesis indicates the source of funds as entitlement transfers and the second term indicates discretionary transfers.
Decomposition of Dependence: Aggregate Analysis
In this section, we undertake an aggregate analysis of the pattern of dependence of all states taken together on central transfers from the centre, based on the methodology developed in the earlier section.
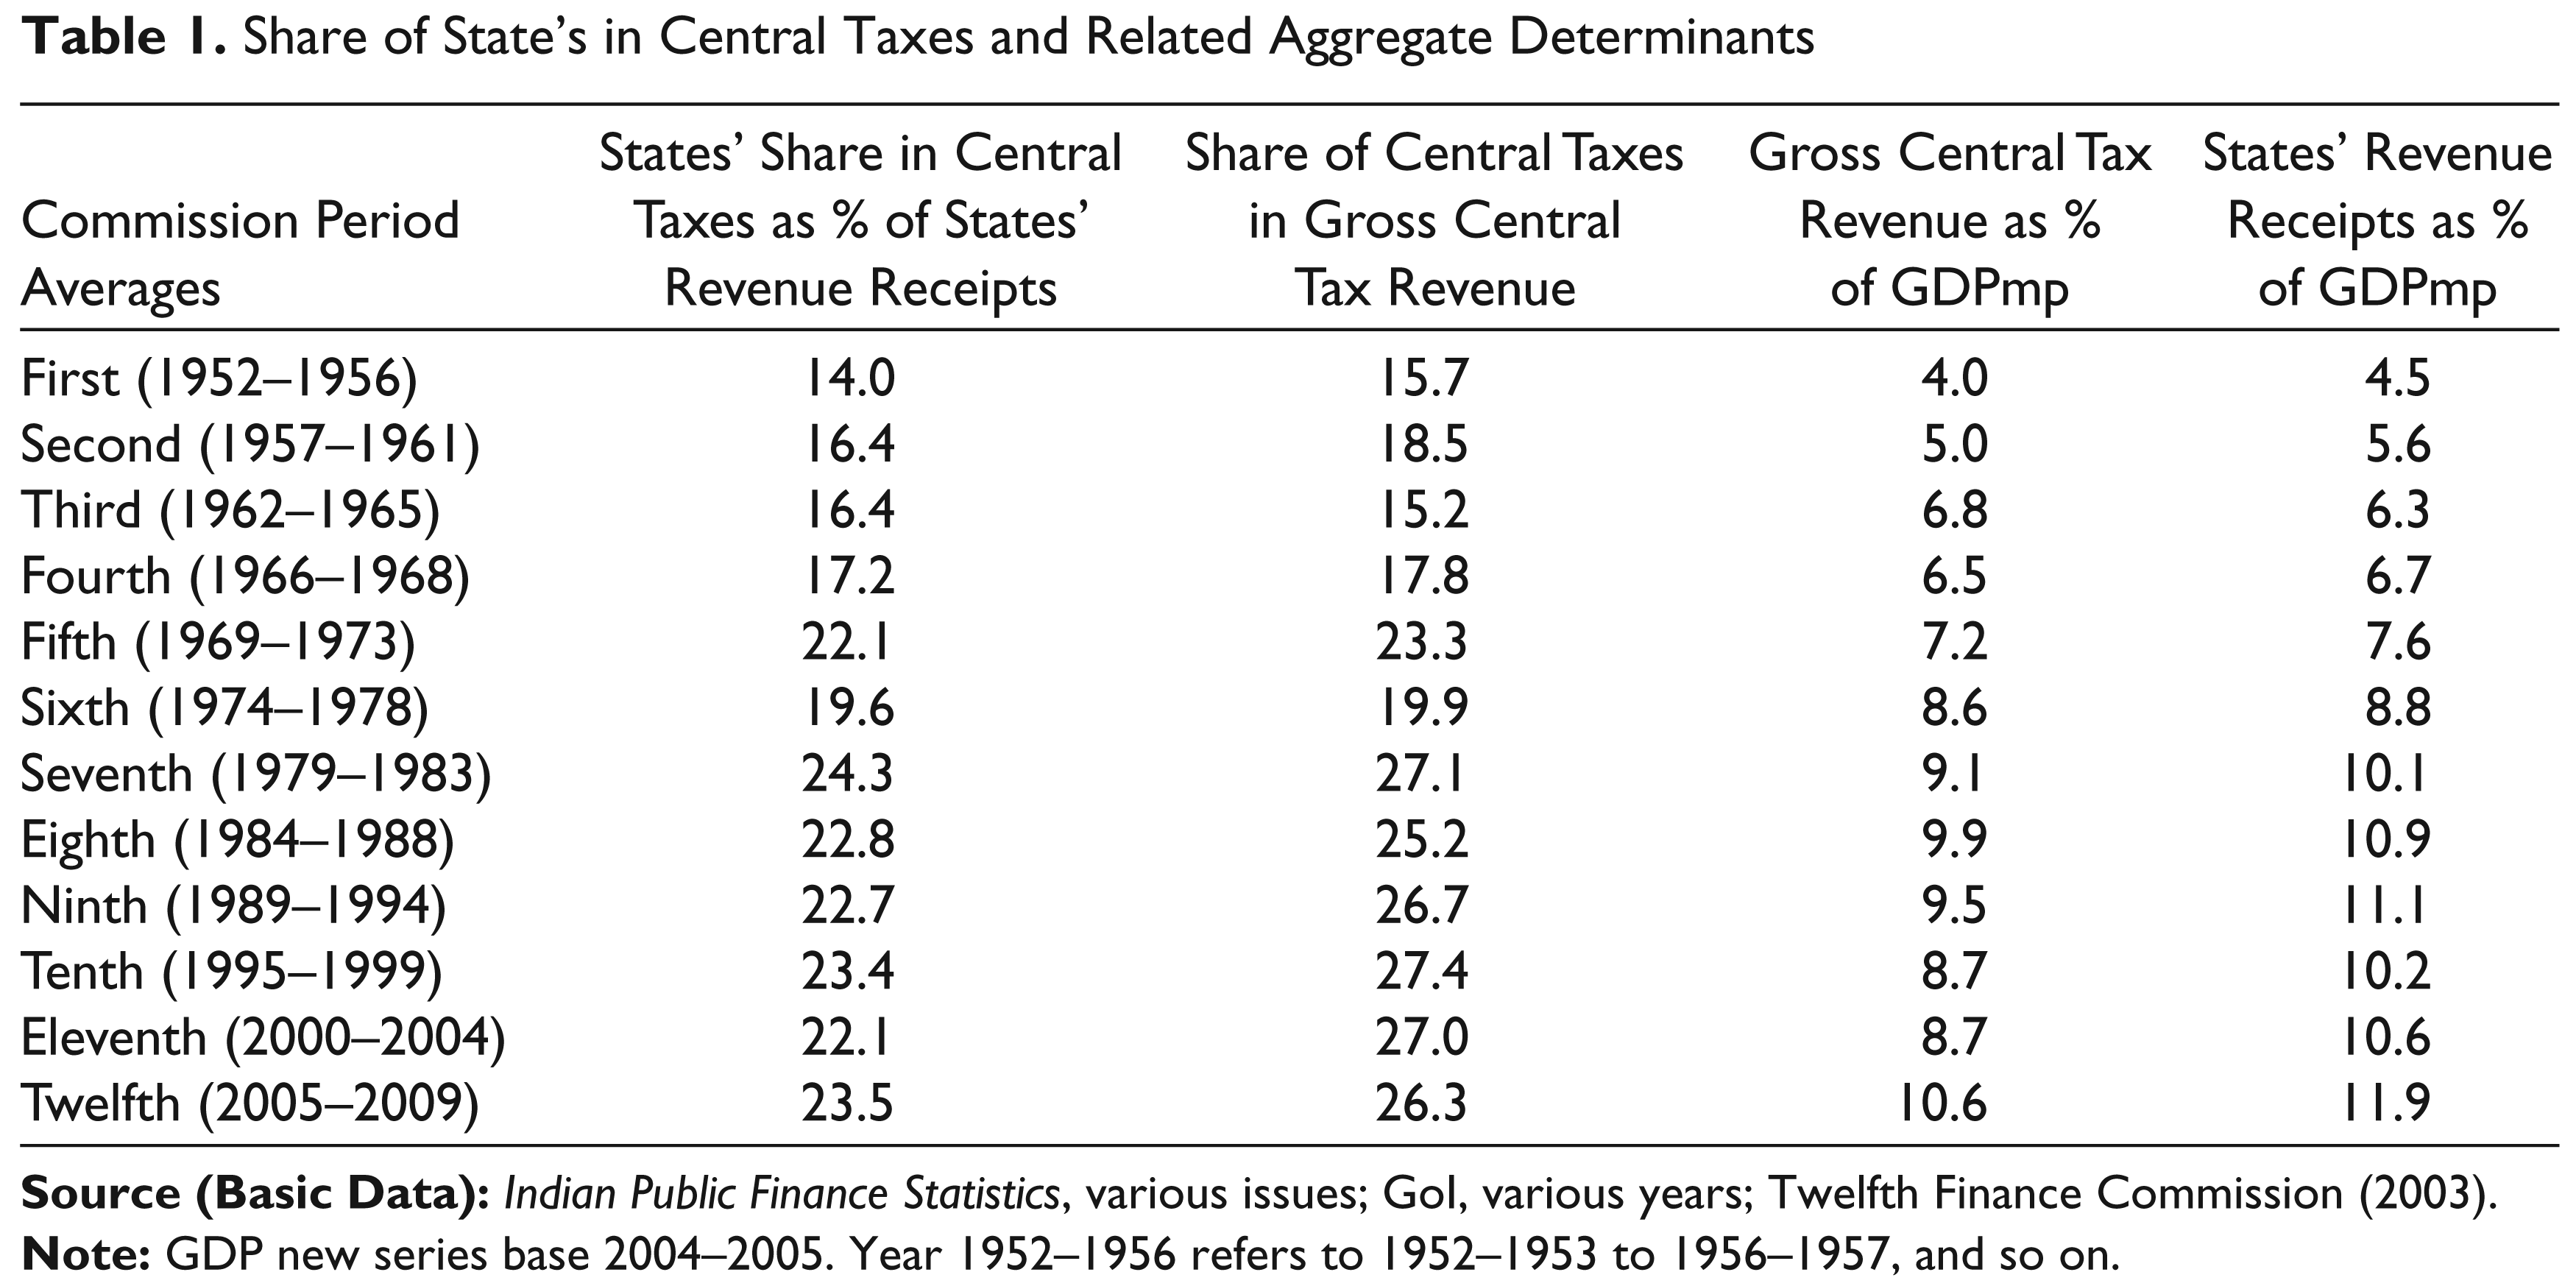
Table 1 indicates the profile of states’ share in central taxes as percentage of states’ revenue receipts indicating how the dependence of the states has increased over time in the share in central taxes. For the First Finance Commission period, the average share of central taxes in states’ revenue receipts was 14.0 per cent. It increased over successive Finance Commission (FC) period to reach a level of 22 per cent for the Fifth FC period. Thereafter it fell for the period of Sixth FC and increased again to 24.3 in the Seventh FC. During the period coved by the recommendations of the Eighth to Twelfth FCs, this ratio was in the range of 22.1 to 23.5 per cent.
From Table 1, it can be seen that the share of central taxes in gross central tax revenues also show a corresponding pattern. This share was the highest for the Tenth FC period at 27.4 per cent. It was relatively stable during the period covered by the Ninth to Twelfth FCs at around 27 per cent; however, if individual years are considered, there are considerable fluctuations. The gross central taxes revenues and the state revenue receipts as a proportion of GDP have been increasing from 4.0–10.6 per cent and 4.5–11.9 per cent, respectively over the Finance Commission periods.
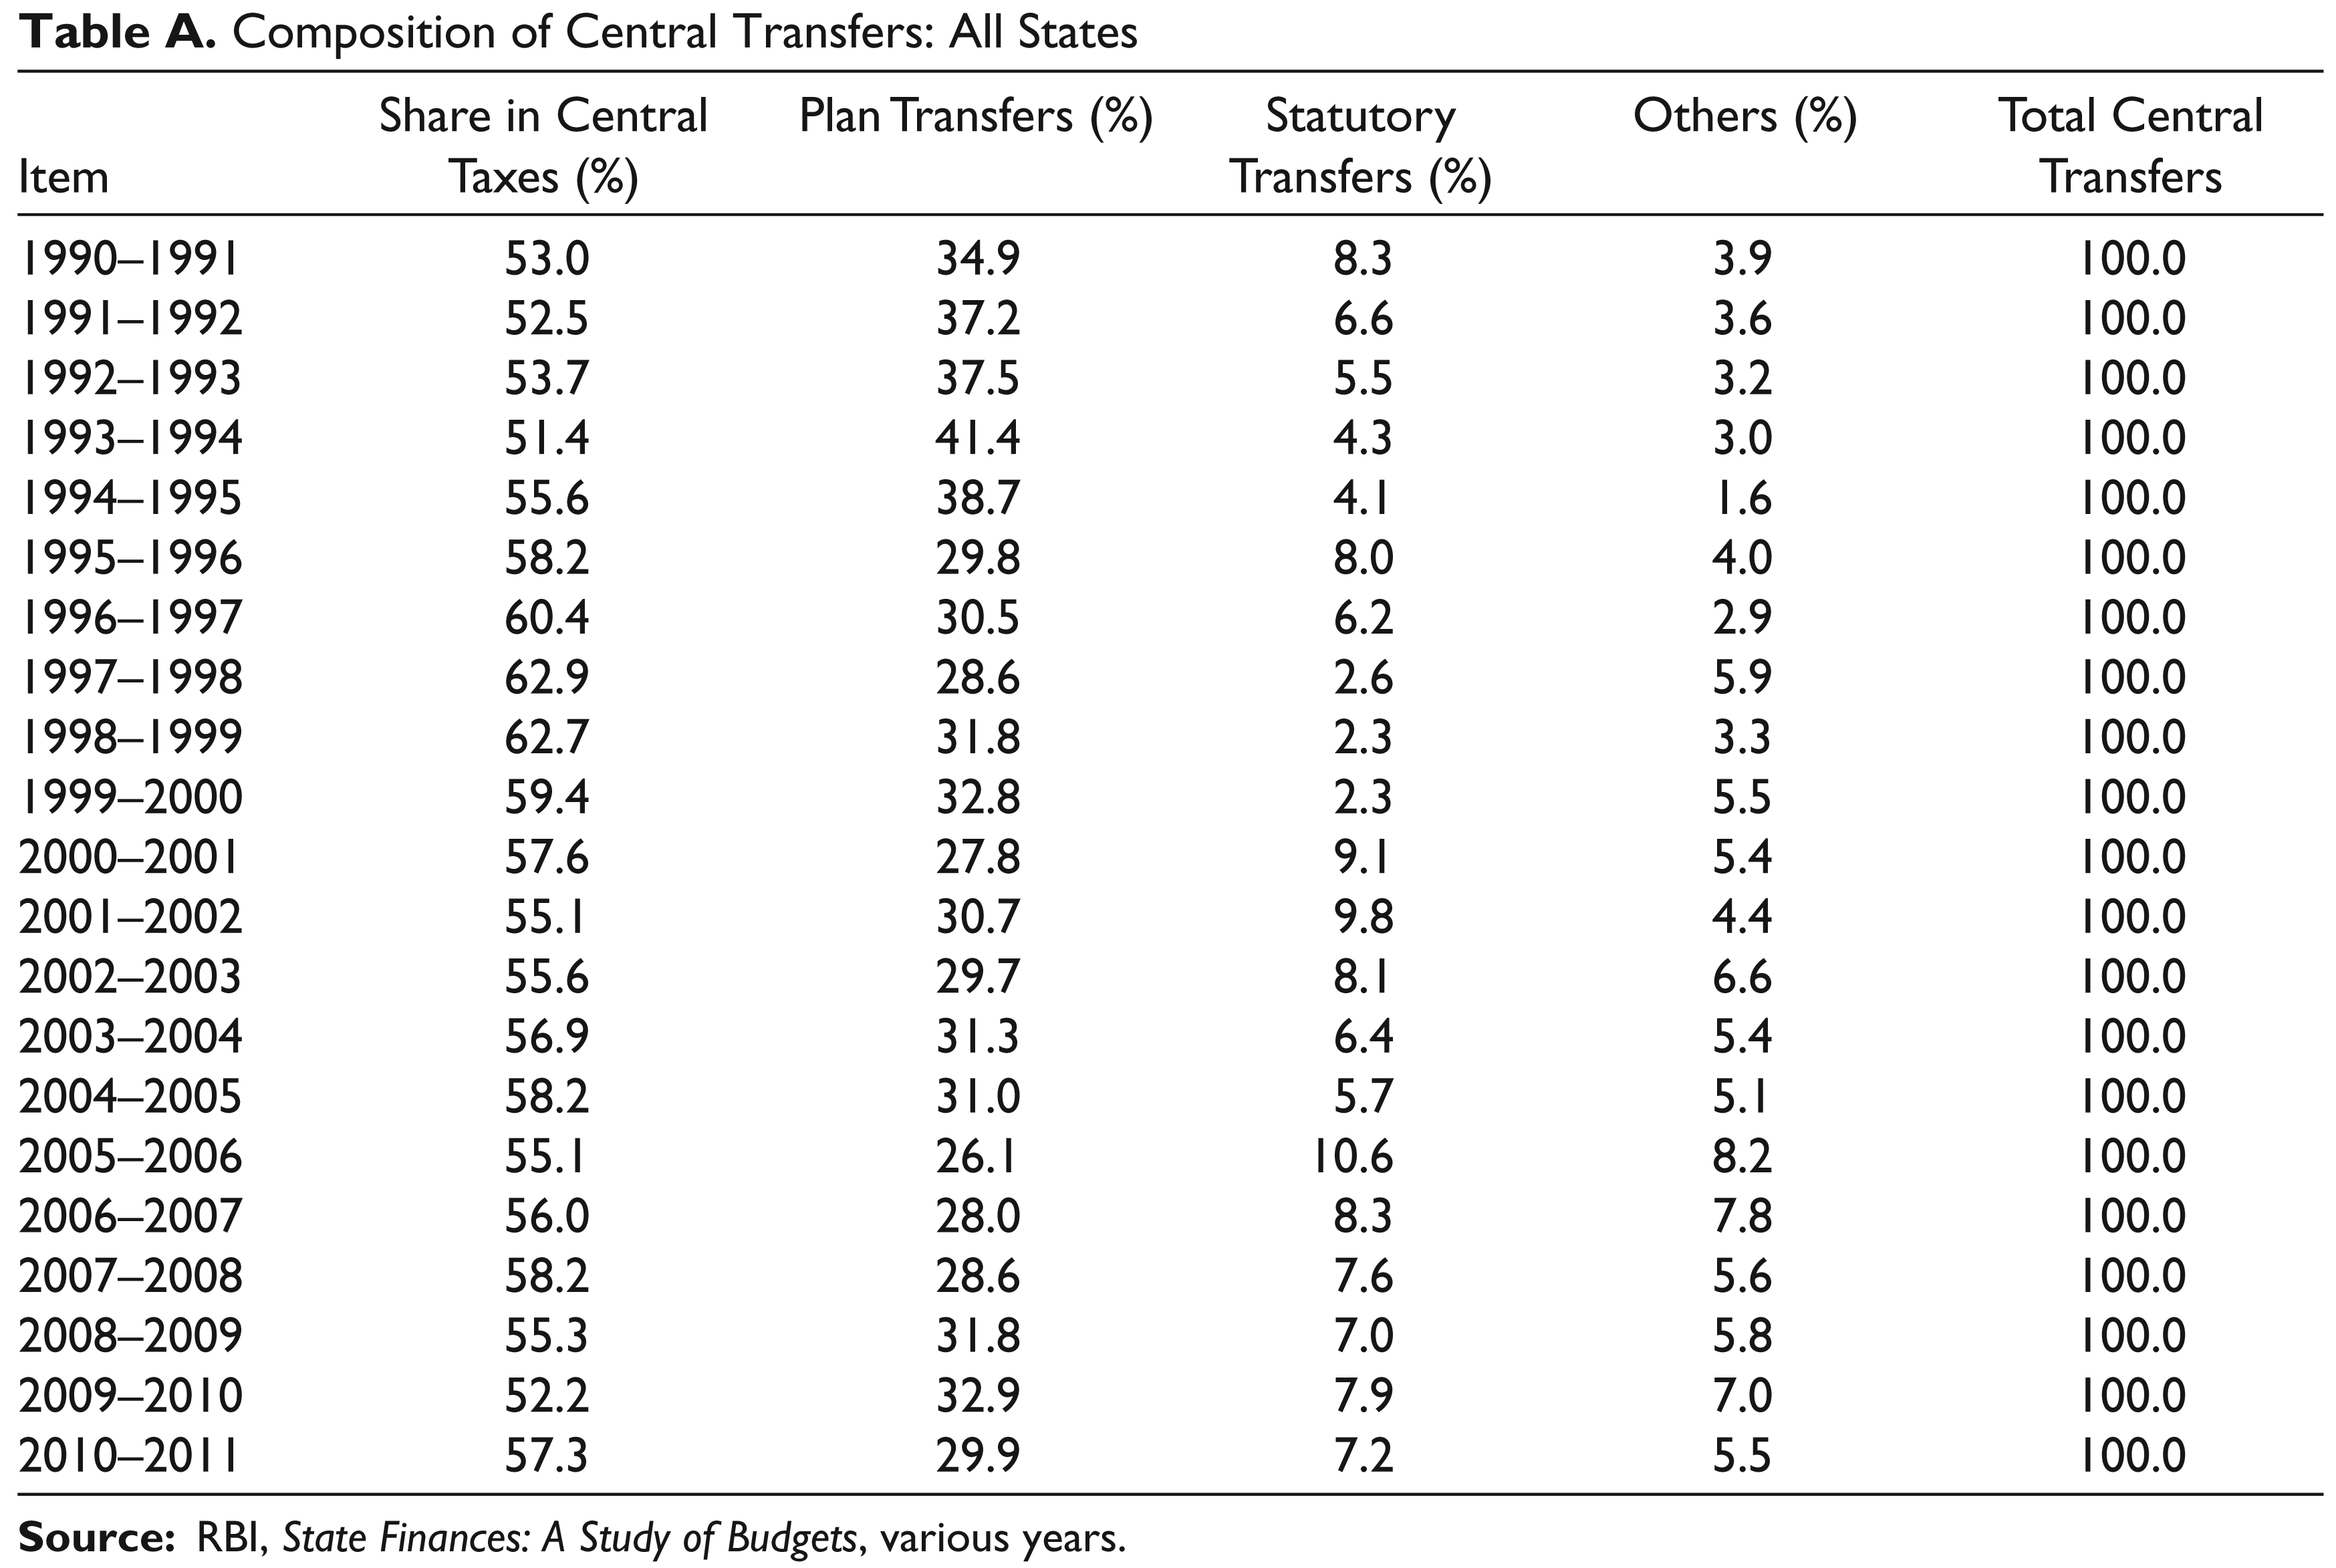
The aggregate states’ share of central taxes in total transfers from the Ninth to Twelfth Finance Commission periods has been in the range of 51–63 per cent, plan grants 27–41 per cent, statutory grants 2–10 per cent, and other grants 2–8 per cent. The details of the composition of central transfers for aggregate states are given in Appendix Table A.
Table 2 shows the degree of dependence for all states from Ninth to Thirteenth Finance Commission (first year). As discussed in the earlier section two alternative ways of decomposition are presented. Decomposition 1 refers to equation iii (a) and Decomposition 2 refers to equation iii (b).
In Decomposition 1 the share of central taxes are treated as one component and total grants are treated as the second component, wherein grants include statutory grants (D2), plan grants (D3) and other grants (D4). Column 1 indicates the dependence on the share in central taxes and column 2 shows the dependence on grants that are determined in nominal terms. In the second decomposition the first component includes the share of central transfers (D1) and the statutory grants (D2) to which the states are entitled under the constitutional provisions. The second component refers to the discretionary transfers comprising plan grants (D3) and other grants (D4). The discretionary transfers are based on the discussions of the states with the Planning Commission at the time of the Plan discussion with the states. In Decomposition 2, column 3 indicates the source of funds as entitlement transfers (D1 + D2) and column 4 shows discretionary transfers (D3 + D4). Column 5 shows the dependence of all states on central transfers.
Share of State’s in Central Taxes and Related Aggregate Determinants
Dependence of States on Central Transfers
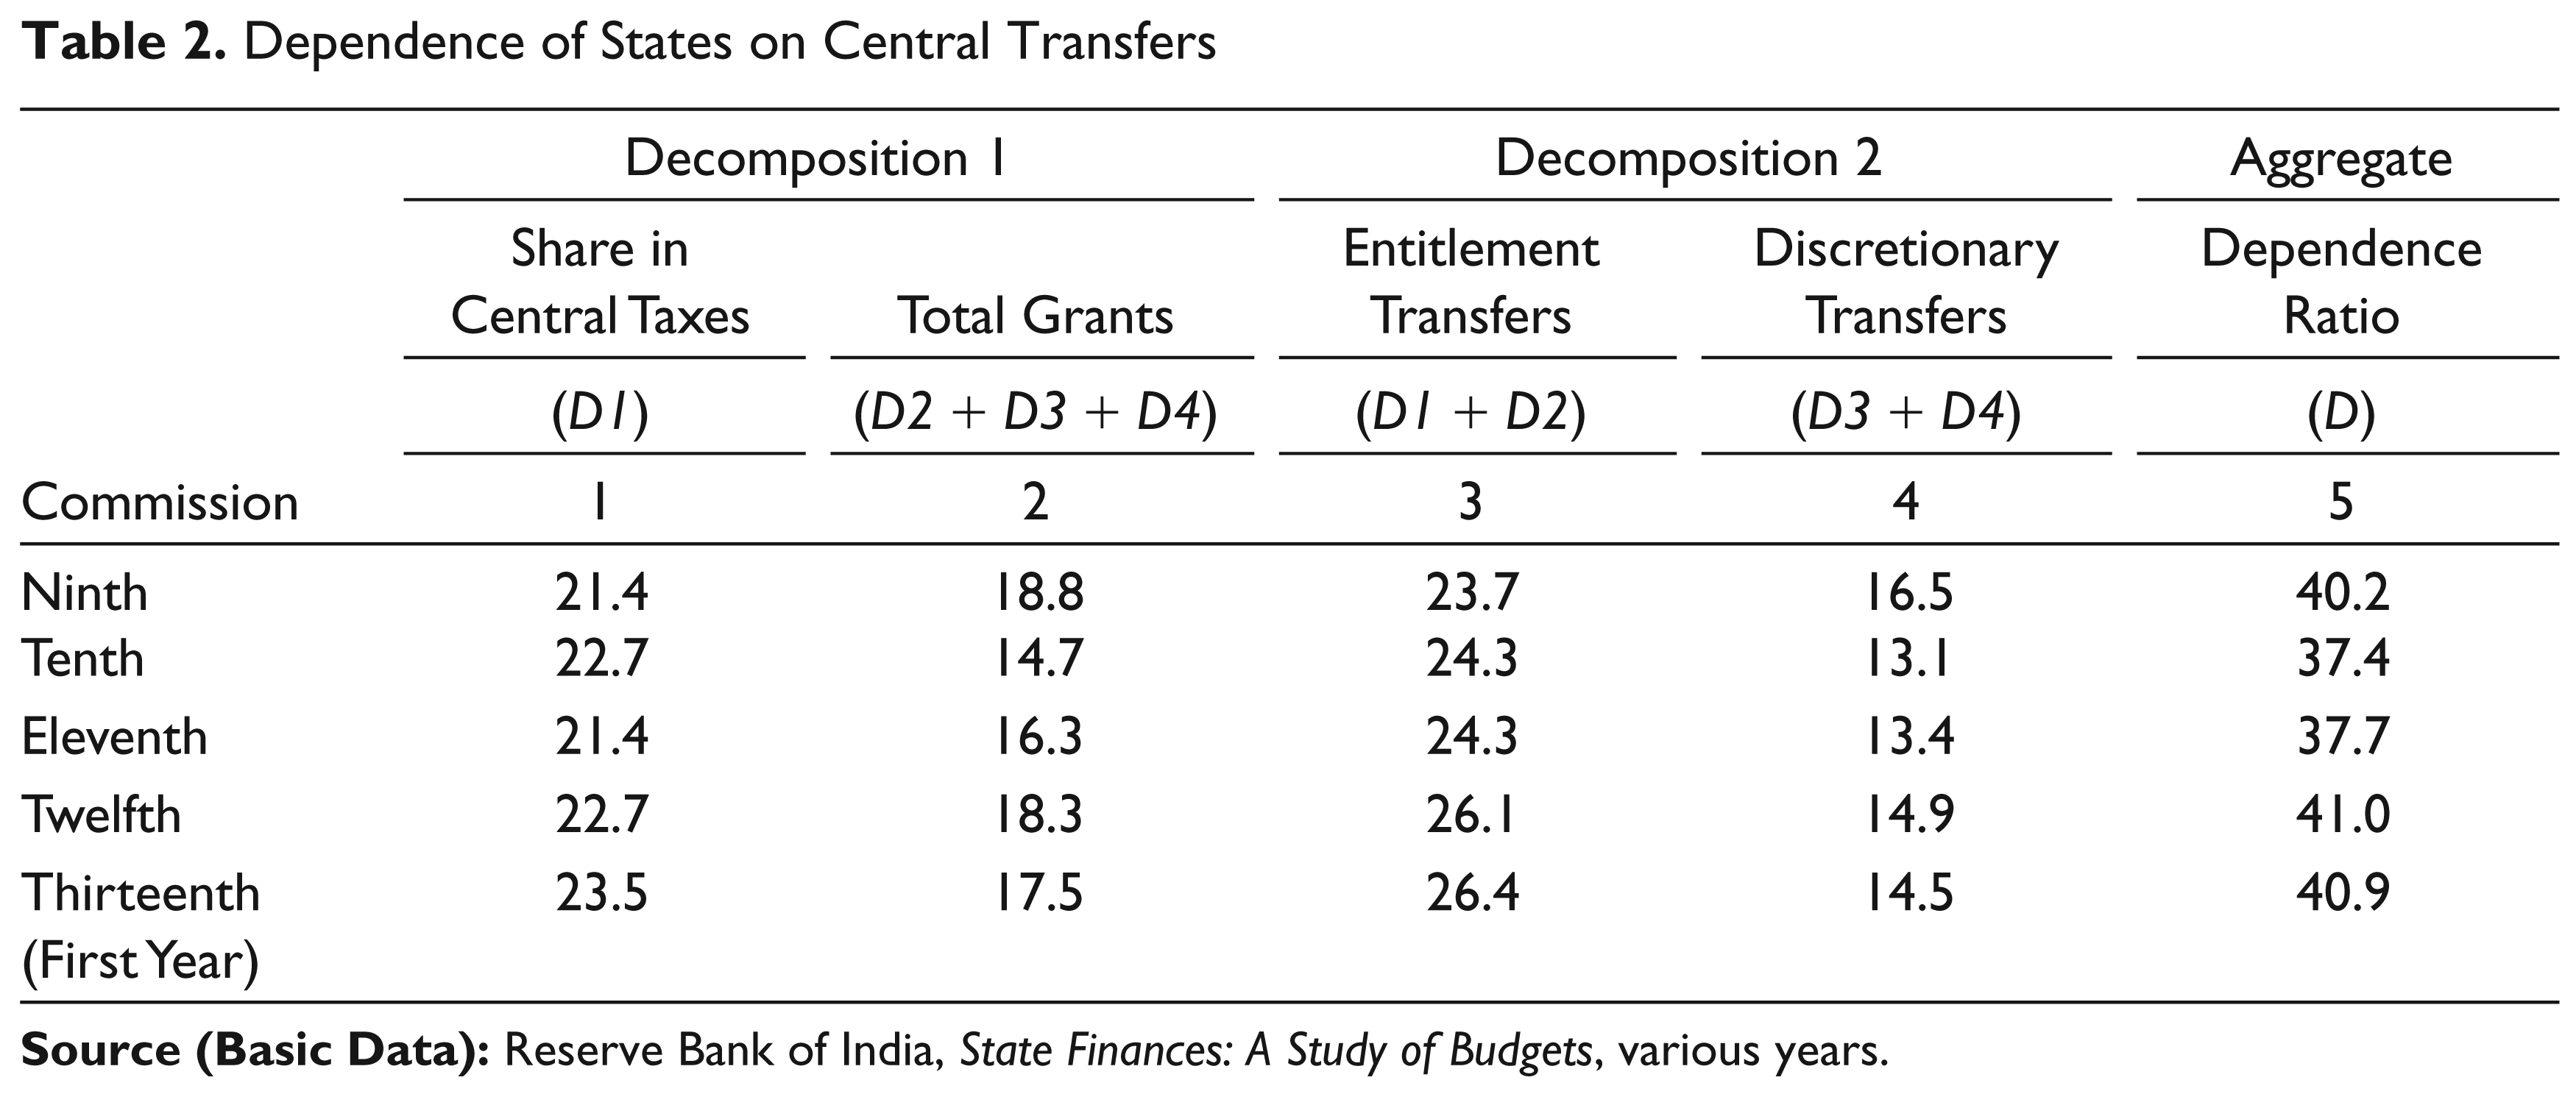
The dependence of all states on central transfers (D) was 40 per cent in the Ninth FC and it fell by 3 percentage points in the Tenth FC; and thereafter rose to 41 per cent in the Twelfth FC and continued in the first year of the Thirteenth FC. This rise may be attributed to the economic slowdown and inability of states to raise more resources to meet their obligation. On the whole the aggregate dependence ratio (column 5) for the all states was increasing since the Tenth FC.
All states are dependent on central taxes to the extent of 53 to 60 over the five commission periods. If the statutory grants are taken into account (entitlement transfers) then the extent of dependence increases to 60–64 per cent. Decomposition 1 of dependence shows that central taxes over the four commission periods and the first year of the fifth commission have been in the range of 21–23 per cent while total grants varied between 14 and 18 per cent. In Decomposition 2 the entitlement transfers account for 23–26 per cent and discretionary transfers 13–16 per cent.
Decomposition and Pattern of Dependence: Individual States
High-Income General-Category States
Dependence of States
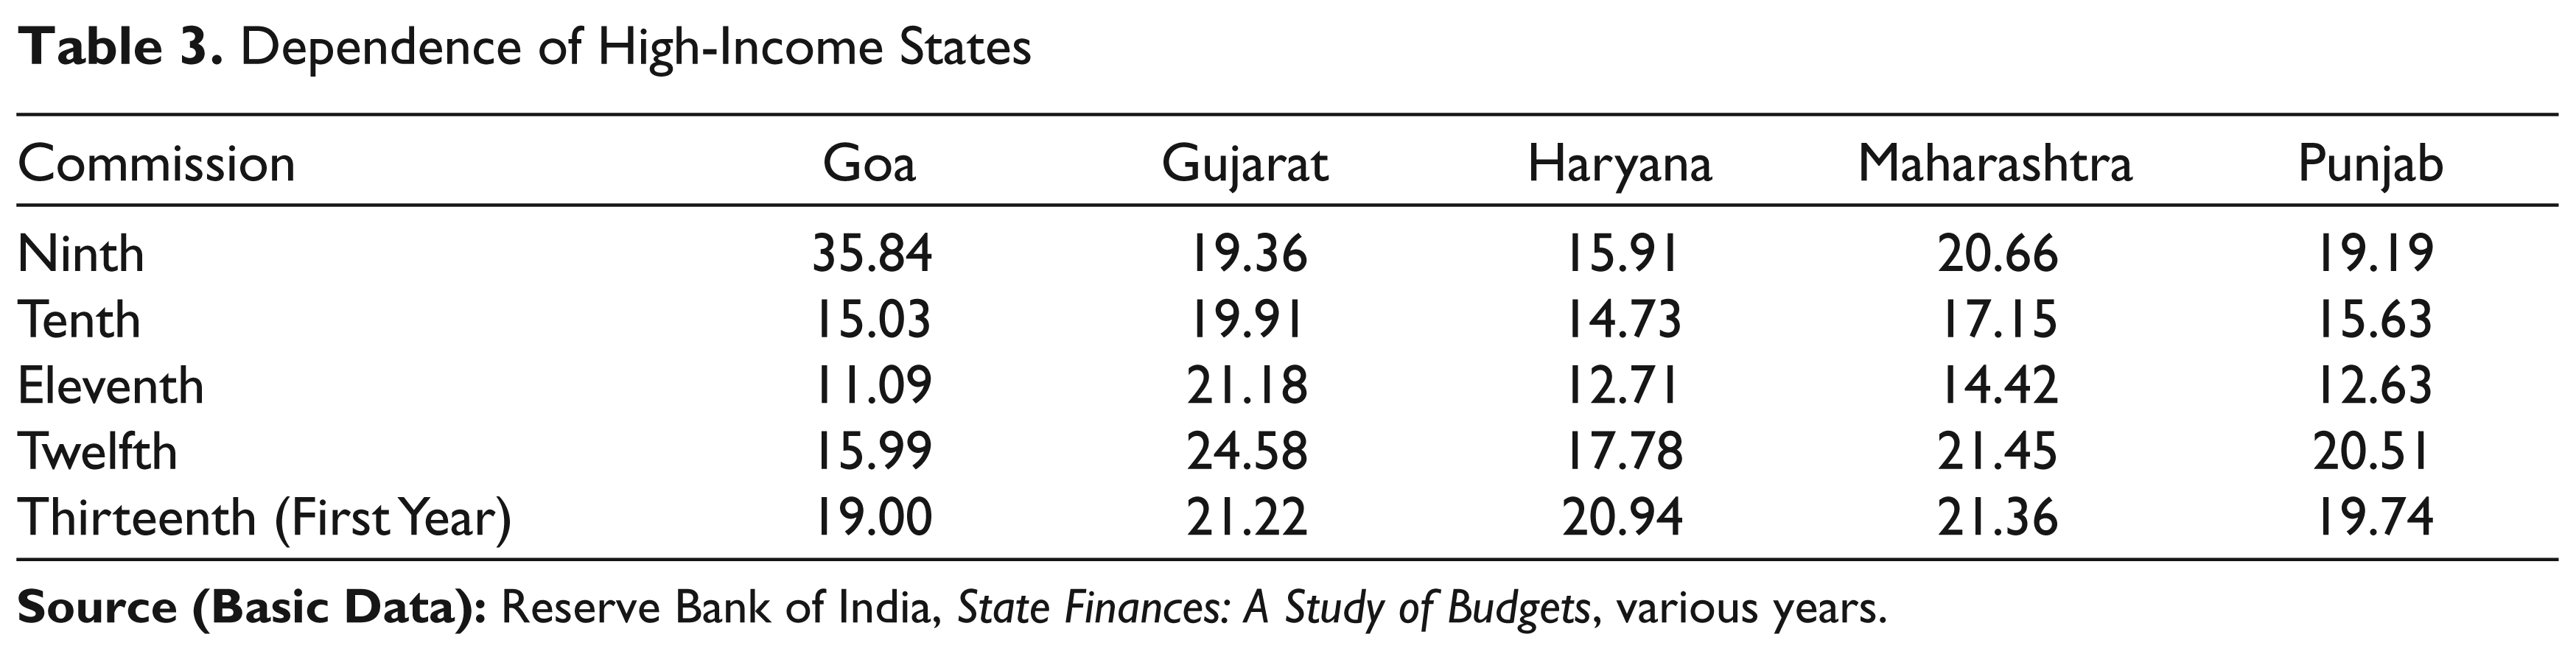
The high-income general-category states receive the lowest transfers relative to their revenue receipts. On average, Haryana is shown to be the least dependent state on central transfers, followed by Punjab, Maharashtra, Goa and Gujarat. As shown in Table 3, there are interesting patterns over time across states and across Finance Commissions (Ninth to Thirteenth). If Goa’s dependence ratio for the Ninth FC period is excluded it is observed that the variation across Commissions and high-income states have been in the range of 11–24 per cent.
In the case of Goa, the extent of transfer has come down over time from an average of 36 per cent during the Ninth FC to just about 11 per cent in the Eleventh FC, subsequently increased to 16 per cent in the Twelfth FC and 19 per cent in the first year of the Thirteenth FC.
For Haryana, the share has ranged between 12.7 and 17.8 per cent.
For Maharashtra, it has ranged from 14.4 per cent on an average to 21.5 per cent. The lowest share was in the Eleventh Finance Commission period.
For Punjab, the share has varied between 12.6 and 20.5 per cent. Here also the lowest share was during the Eleventh Finance Commission award period.
For Gujarat, it has ranged between 19.4 and 24.6 per cent.
Comparing across Finance Commissions, the high-income group states obtained the lowest shares during the Eleventh Finance Commission period, followed by the Tenth Finance Commission period.
Dependence of High-Income States
Decomposition of Dependence of States
Table 4 shows the decomposition of dependence for higher income states in two ways.
Decomposition of Dependence: High-Income States
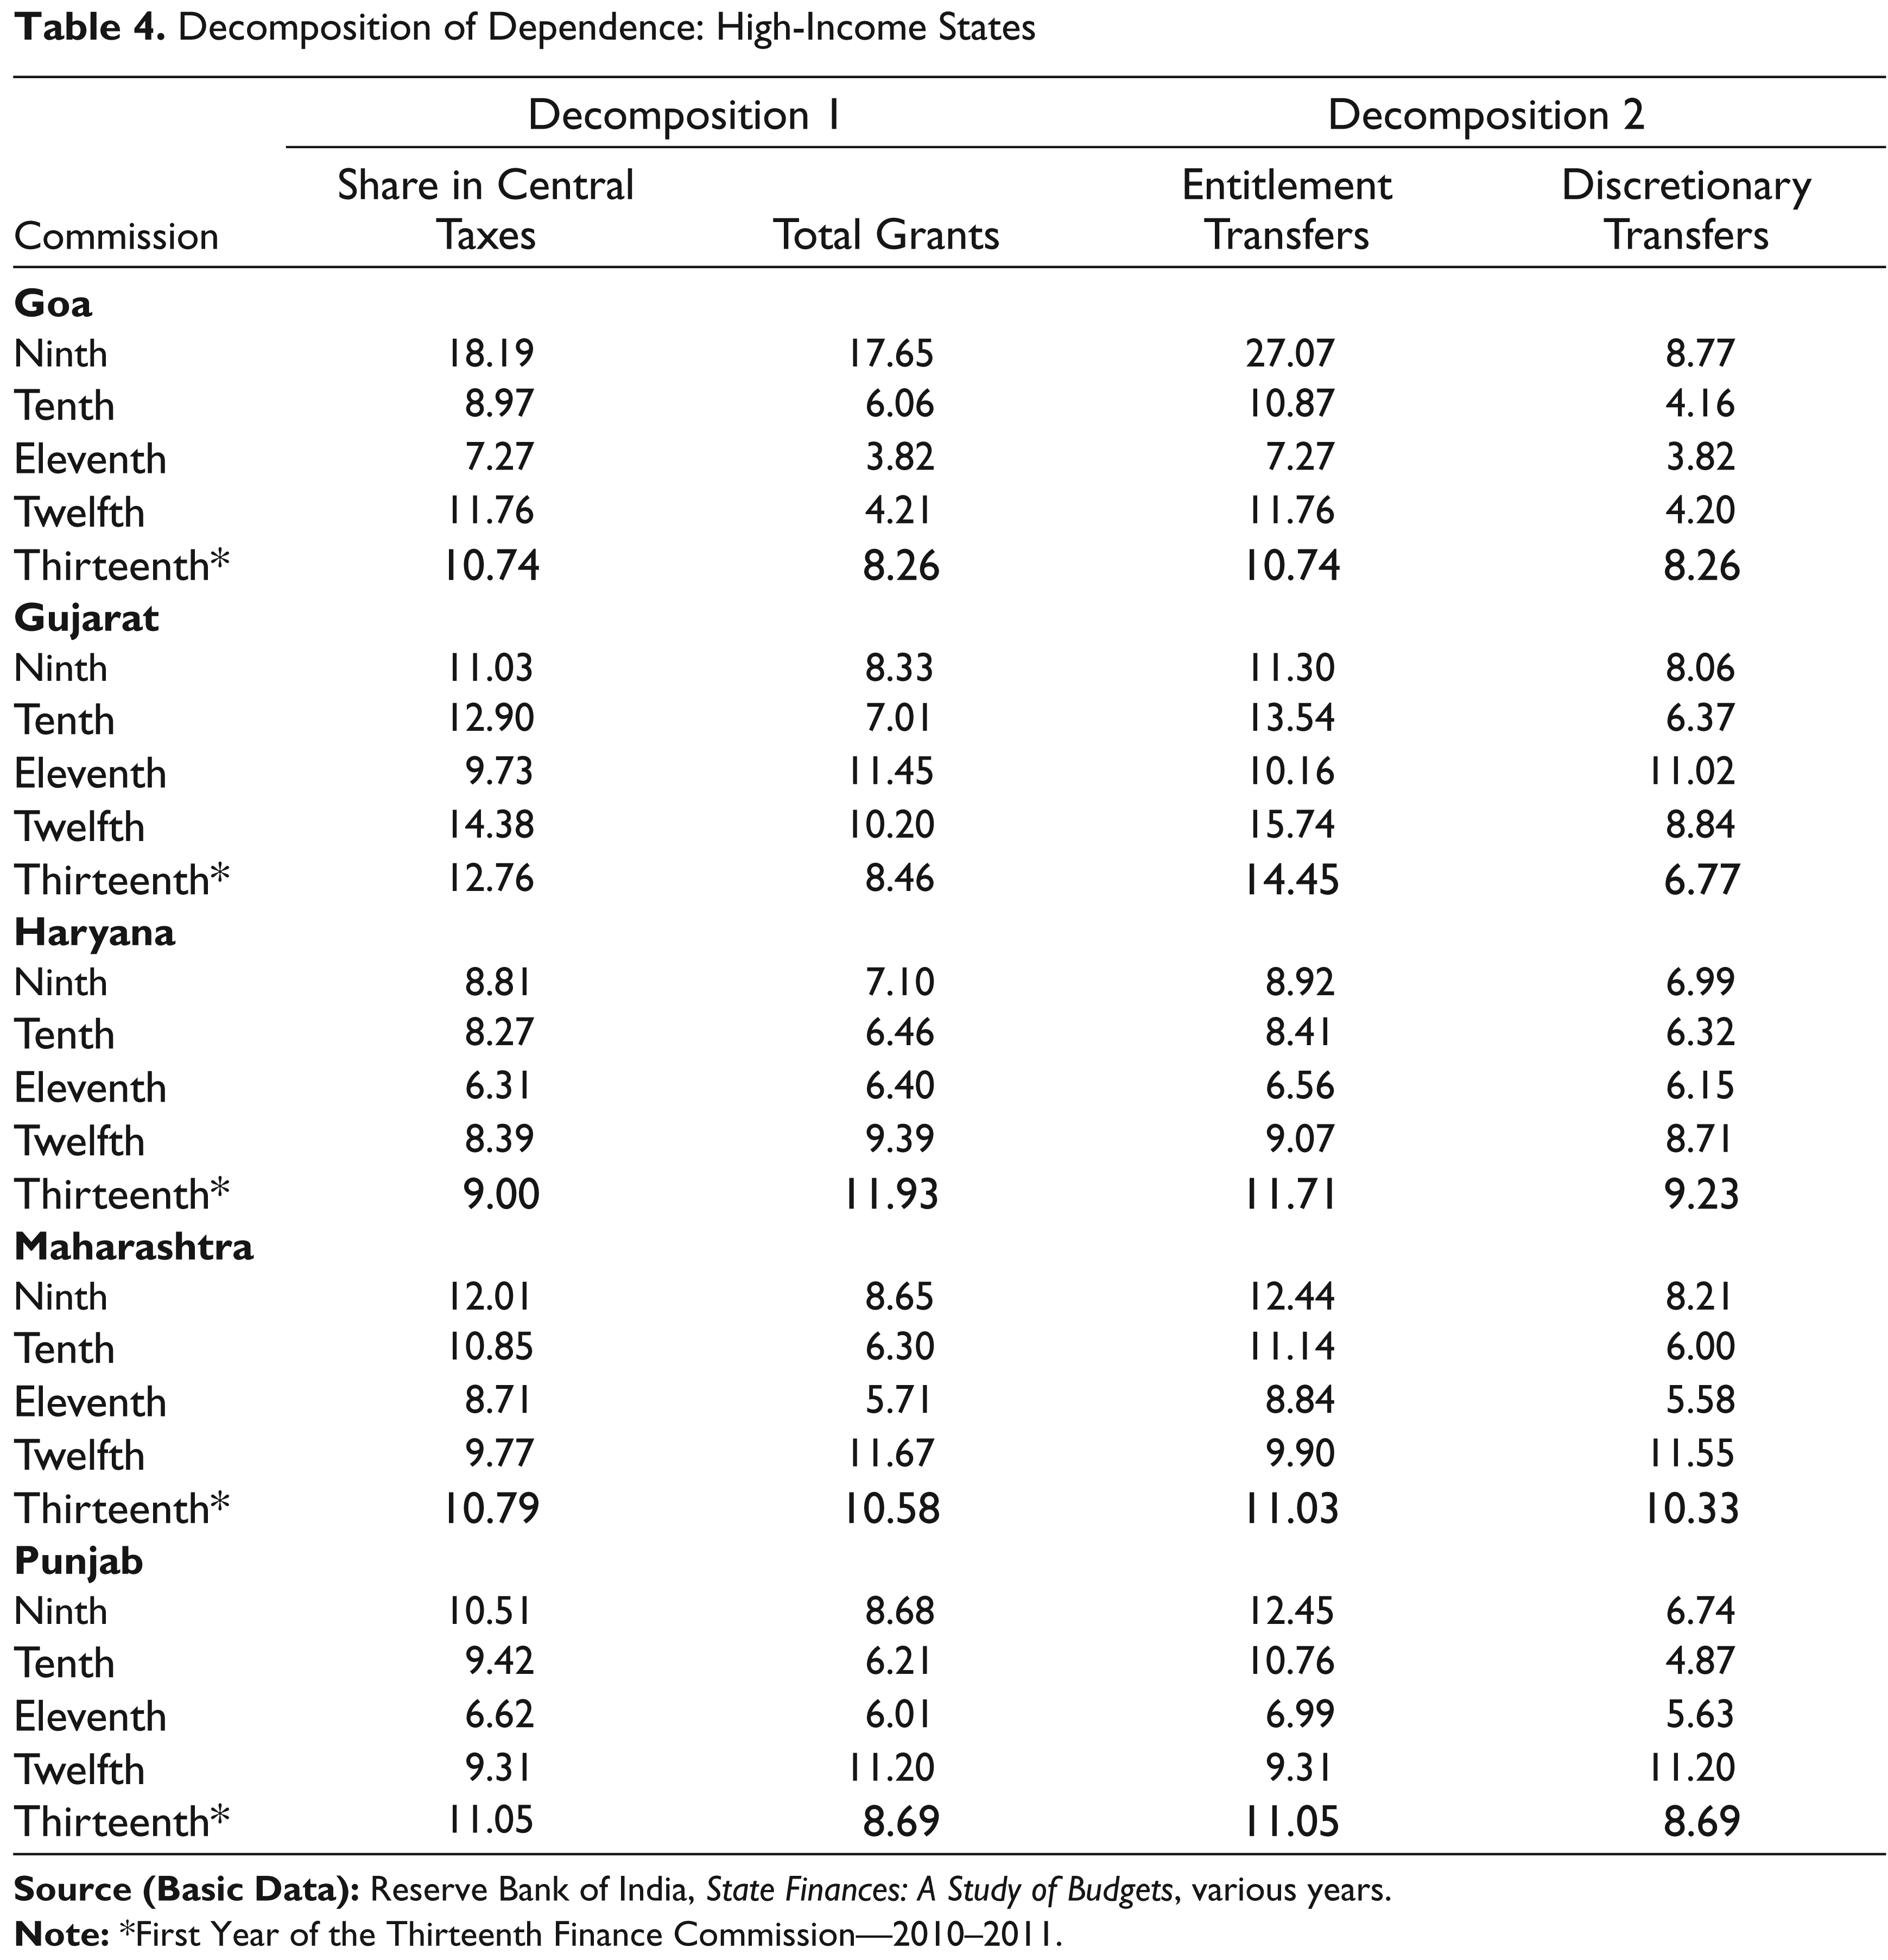
In decomposition 1 the highest-income state, namely, Goa’s share in central taxes has varied from 7.2 to 18.2 per cent while total grants was in the range of 3.8–17.6 per cent. In Decomposition 2 entitlement transfers varied from 7.3 to 27.1 per cent while discretionary transfer ranged between 3.8 and 8.8 per cent. In both the decompositions, the minimum share was in the Eleventh FC and the maximum in the Ninth FC. If the Ninth FC is excluded, the variation in central taxes and entitlement transfers was in the range of 7–11 per cent over the FC period. The range is similar as there were no statutory transfers (D2) given to Goa during this period.
For Gujarat, the share in central taxes varied from 9.7 to 14.4 per cent and total grants, 7.0–11.5 per cent, while entitlement grants was 10.2–15.7 per cent and discretionary transfers was 6.4–11.0 per cent. In the case of central taxes and entitlement transfers the shares were minimal in the Eleventh FC; consequently the total grants and discretionary transfers are the maximum in this period.
For Haryana, the share in central taxes ranged between 6.3 and 9.0 per cent and total grants 6.4–11.9 per cent while entitlement grants was 6.6–11.7 per cent and discretionary transfers was 6.2–9.2 per cent. The minimum share was in the Eleventh FC and the maximum was in the first year of the Thirteenth FC.
For Maharashtra, the share in central taxes varied from 8.7 to 12.0 per cent and total grants 5.7–11.7 per cent while entitlement grants was 8.8–12.4 per cent and discretionary transfers was 5.6–11.6 per cent. It is observed that the minimum share was in the Eleventh FC for central taxes (8.7 per cent) and entitlement transfer (8.8 per cent) while total grants and discretionary transfers were maximum (11.6 per cent) in the Twelfth FC.
For Punjab, the share in central taxes ranges from 6.6 to 11.1 per cent and total grants 6.0 to 11.2 per cent while entitlement grants was 6.9 to 12.5 per cent and discretionary transfers was 4.9 to 11.2 per cent. Decomposition 1 shows decline in shares of central taxes from the Ninth to Eleventh FC and thereafter improved to 11.1 per cent in the first year of the Thirteenth FC but total grants fell to 8.7 per cent. The same is observed in Decomposition 2. Punjab did not receive statutory grants in the Twelfth FC and first year of the Thirteenth FC.
Middle-Income General-Category States
Dependence of States
Among the middle-income general-category states, across states, the lowest dependence on Finance Commission transfers is that of Tamil Nadu and the highest that of West Bengal. Table 5 shows the dependence of general category middle income states.
Dependence of Middle-Income States
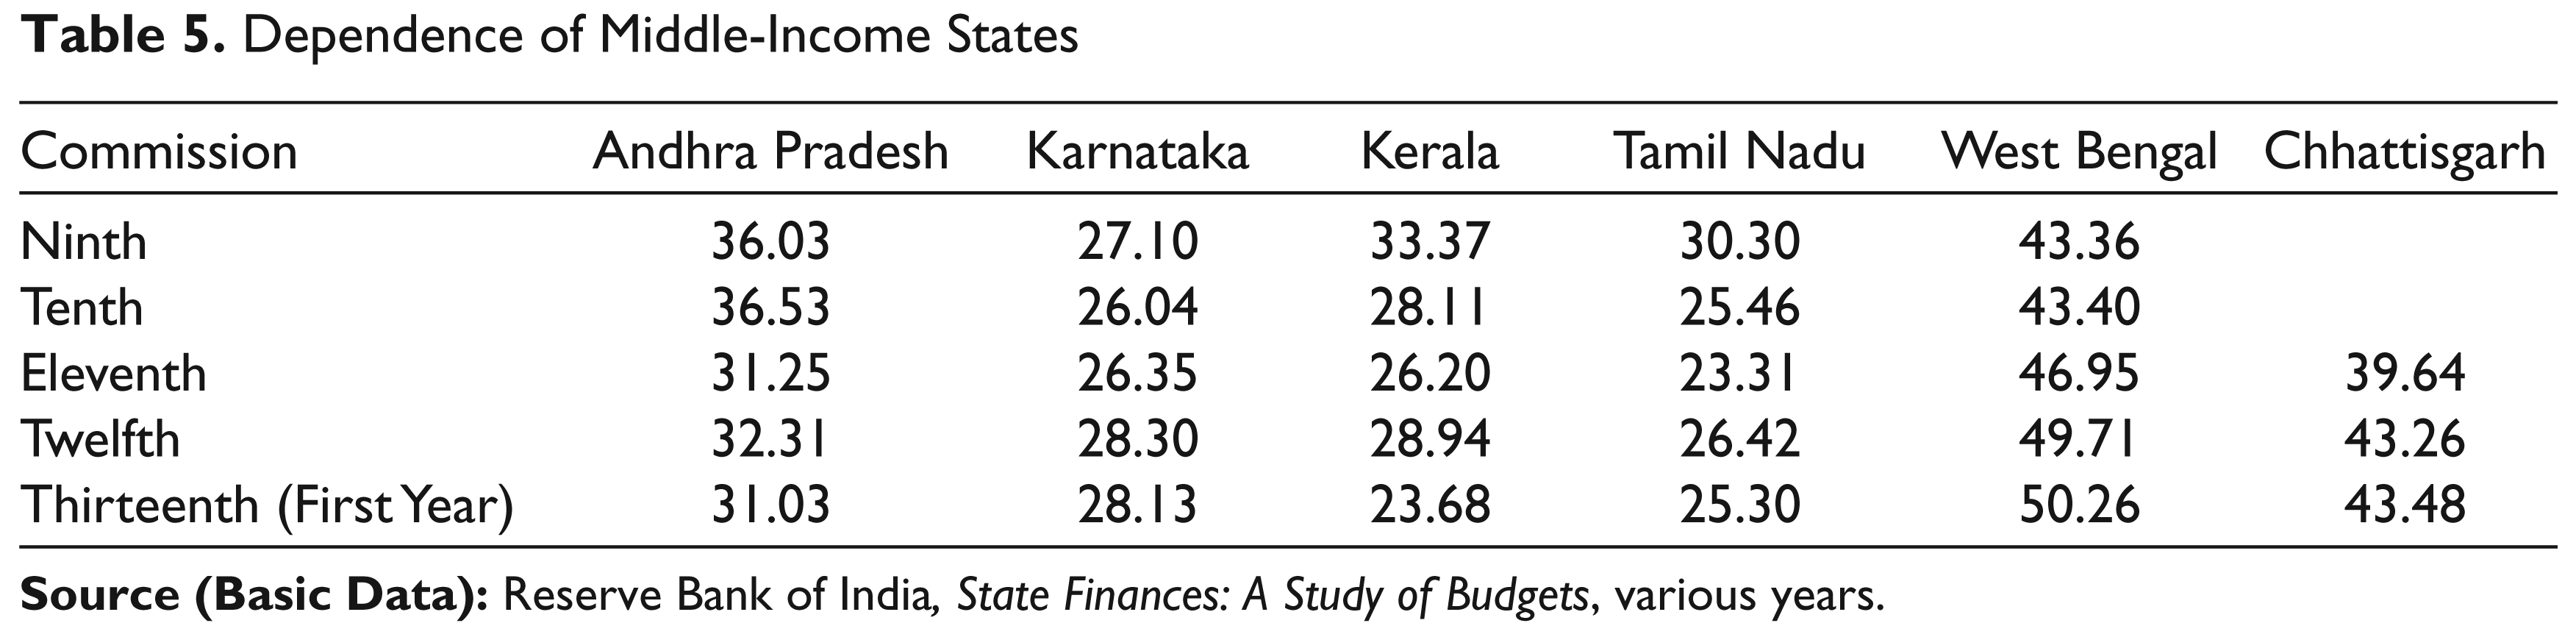
The dependence ratio has remained relatively stable for Karnataka over five Commission periods (26–28 per cent).
For Andhra Pradesh, there is a significant decline from 36 per cent in the Ninth and Tenth FC to 31–32 per cent in the Eleventh to Thirteenth FC.
In the case of Tamil Nadu, there has been significant decline from 30 per cent in the Ninth to 23 per cent in the Eleventh FC. In Twelfth FC the ratio increased to 26 per cent, and came down to 25 per cent in the first year of the Thirteenth FC.
For Kerala, the dependence ratio fell from 33 to 26 per cent in the Ninth to Eleventh FC and thereafter rose to 29 per cent in the Twelfth FC and thereafter fell to 24 per cent in the first year of the Thirteenth FC.
The dependence of West Bengal and Chhattisgarh has increased over the Finance Commission periods.
Decomposition of Dependence of States
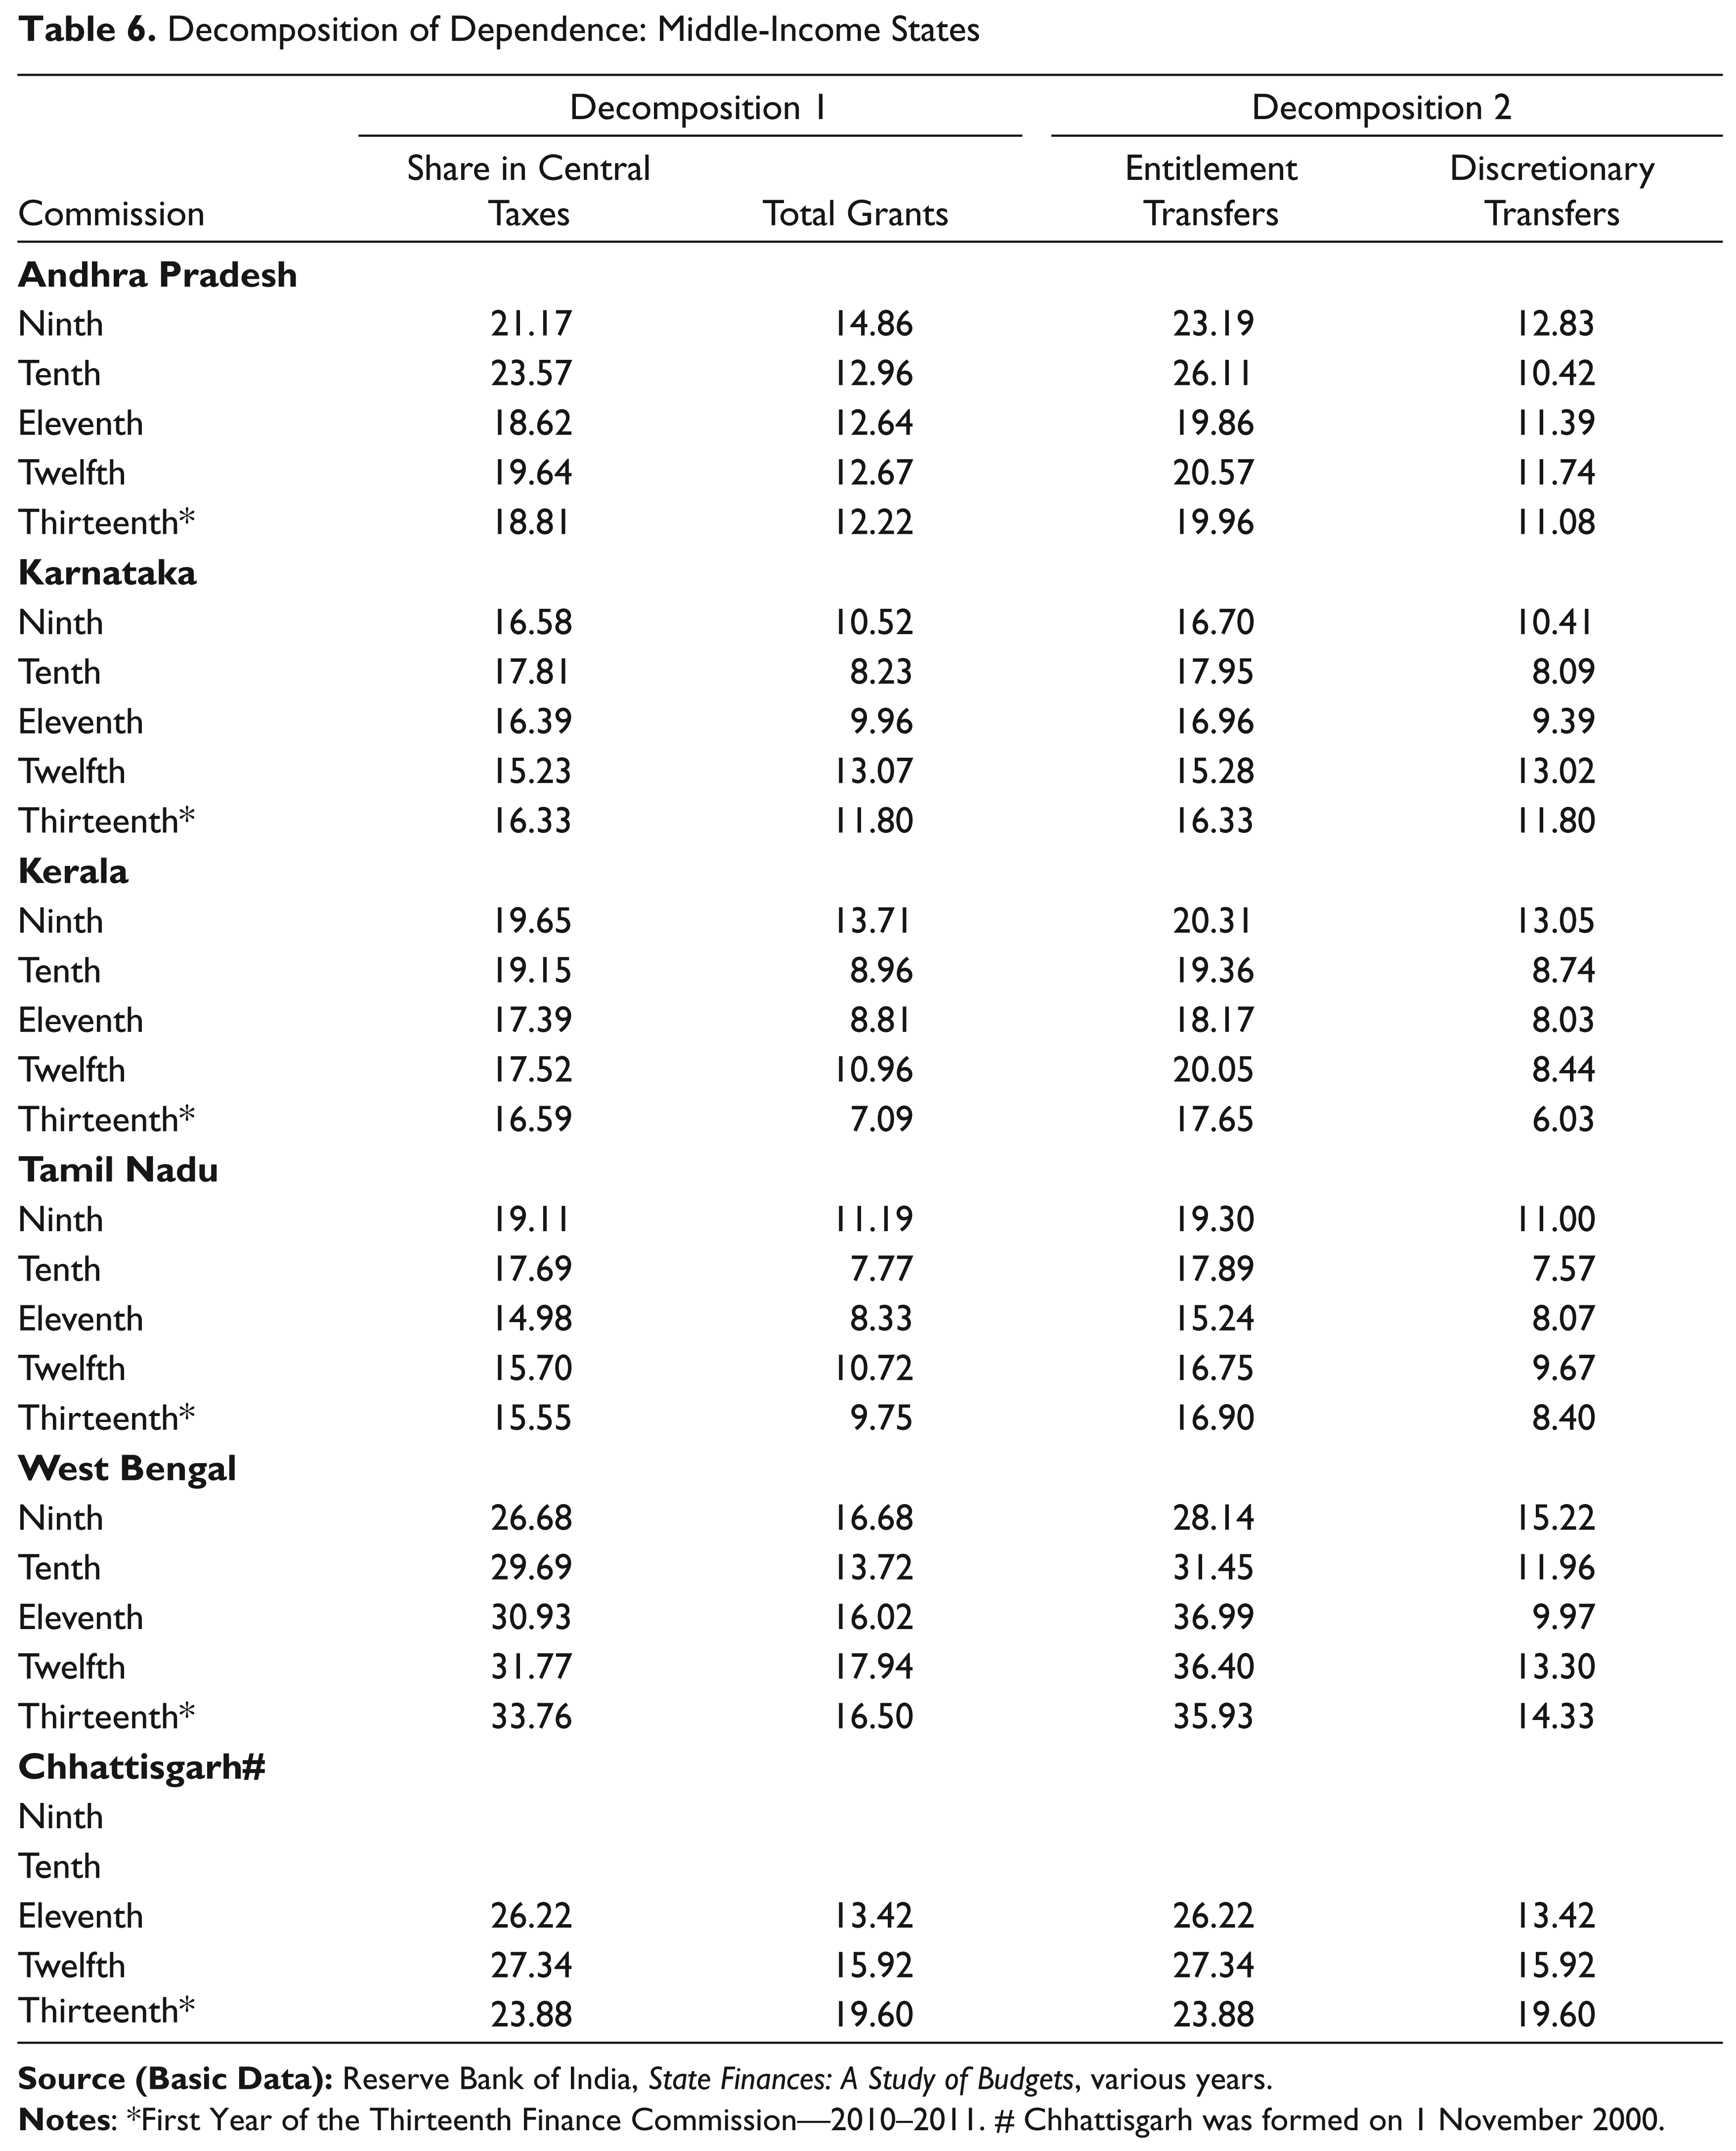
Table 6 shows the decomposition of dependence for general-category middle-income states in two ways. It is observed that dependence of middle-income states is higher than that of advanced states.
For Andhra Pradesh, Decomposition 1 shows that the component of grants has declined from 14.9 to 12.2 per cent over the finance commission periods. It has been below 13 per cent from the Tenth to Thirteenth FC. The share of central taxes has broadly been in the range of 18–23 per cent. The maximum was in the Tenth FC and the minimum was in the Eleventh FC. The discretionary transfer in Decomposition 2 varied in the range of 10–12 per cent over the FC periods. Entitlement transfers fluctuated over the commission periods in the range of 19–23 per cent.
Karnataka has a lower dependency ratio as compared to Andhra Pradesh. The share of central taxes and entitlement transfers varied in the broad range of 15–17 per cent while grants and discretionary transfers in the range of 8–11 per cent.
For Kerala, the dependence on share in central taxes has come down from 19 per cent in the Ninth FC to 16 per cent in the first year of Thirteenth FC. Total grants fell, which was 13 per cent in the Ninth FC, declined to 9 per cent in the Tenth and Eleventh FC, subsequently rose to 11 per cent and came down by 3 percentage points in the first year of Thirteenth FC.
The share of dependence of Tamil Nadu is lower than Karnataka. Decomposition shows that the share of central taxes fell from 19 to 17 per cent in the Ninth and Tenth FC periods and thereafter stabilized at around 15 per cent while there is volatility in total grants. Decomposition 2 shows that entitlement transfers fluctuated between 15 and 19 per cent and discretionary transfers, if the Ninth FC is excluded, varied in the range of 7–9 per cent.
In the case of West Bengal, the dependence is highest among the middle-income states and, as discussed earlier, has been rising over successive FC periods. The share in central taxes rose from 26 to 33 per cent over the FC periods. Total transfers ranged between 16 and 17 per cent over the years except for the Tenth FC where it was 14 per cent. Decomposition 2 shows that entitlements grants have gone up over the years from 28 to 36 per cent. Discretionary transfers fell from 15 to 9 per cent in the Eleventh FC and then rose to 14 per cent in the first year of the Thirteenth FC.
For Chhattisgarh, both the decompositions show that in the Eleventh and Twelfth FC the share in central taxes and entitlement taxes is the same as no statutory grants were given to the state.
Decomposition of Dependence: Middle-Income States
Dependence of Low-Income States
Low-Income General-Category States
Dependence of States
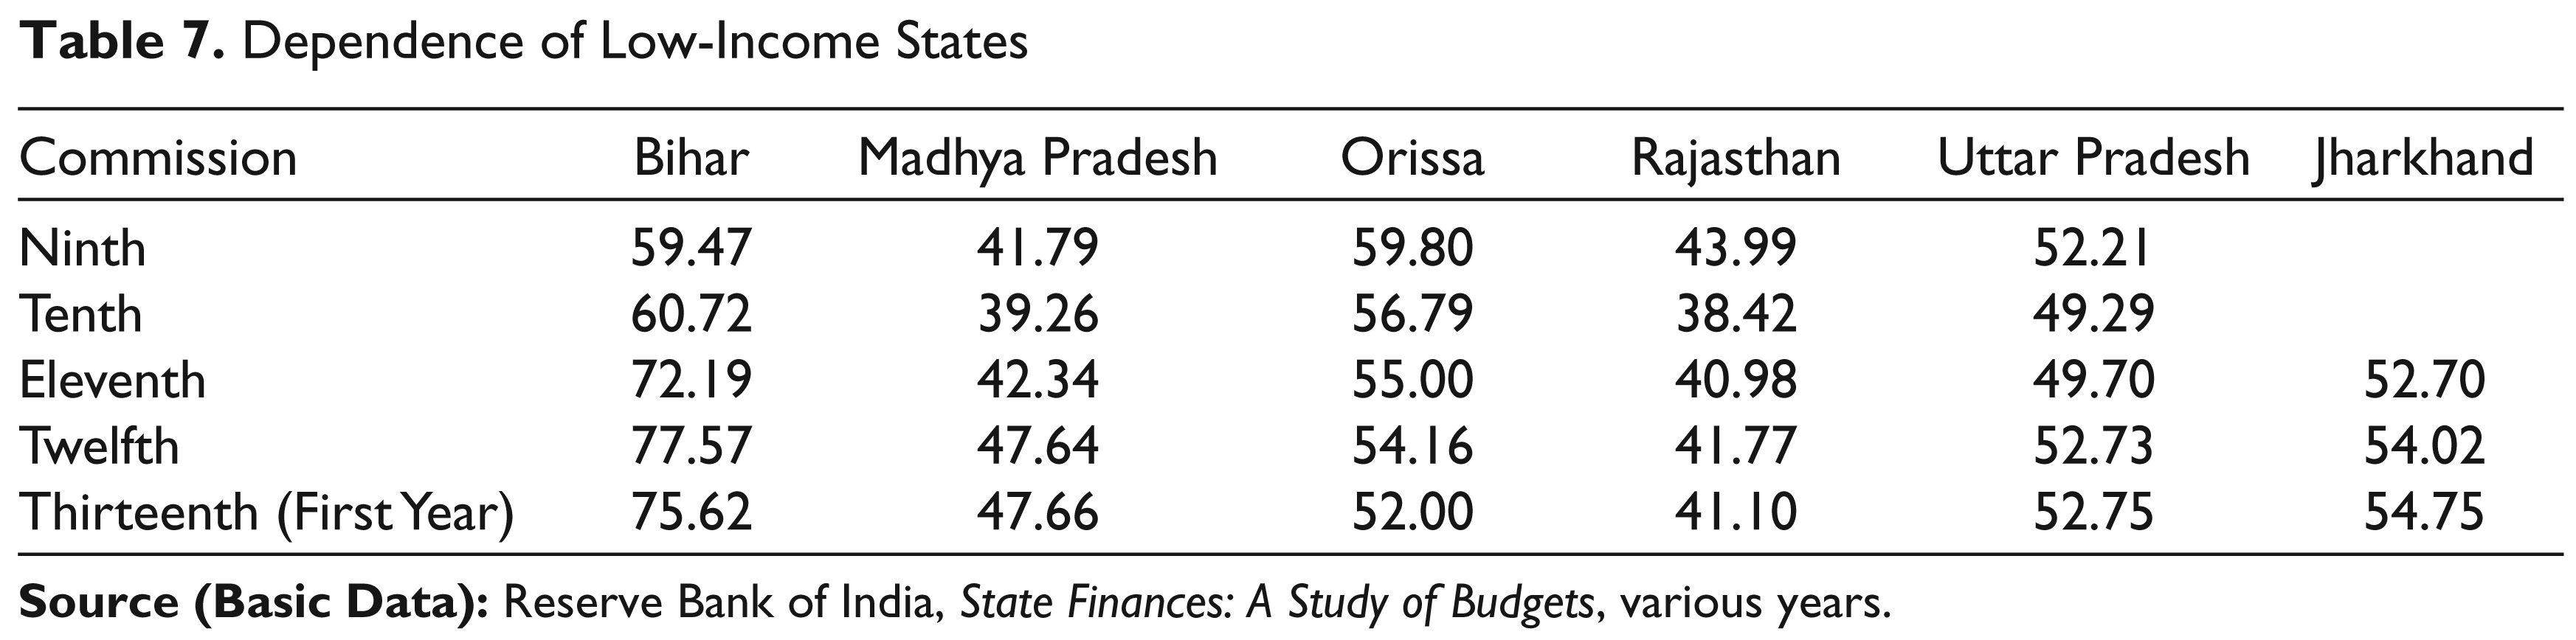
In the low-income states of the general category, the dependence of transfers in revenue receipts is far more compared to the middle- and high-income groups. As shown by Table 7, for the Twelfth Finance Commission period, it varies from a minimum of 42 per cent for Rajasthan to a maximum of 78 per cent for Bihar. The dependence on central transfers among the low-income states is highest in Bihar, followed by Orissa, Jharkhand, Uttar Pradesh, Madhya Pradesh and Rajasthan.
For Bihar, the dependence ratio has increased from 59–78 per cent during the Ninth to Twelfth FC, and was about 76 per cent in the first year of the Thirteenth FC. The rate of increase has been higher from the Tenth to Twelfth FC.
The dependence for Madhya Pradesh has also increased since the Tenth FC from 39–48 per cent.
For Orissa, the dependence fell from 60–52 per cent over the Ninth FC to the first year of the Thirteenth Commission period.
For Rajasthan, the dependence increased from the Tenth FC onwards from 38–41 per cent.
For Uttar Pradesh, the dependence rose from 49 per cent in the Tenth FC to 52 per cent over the years.
For Jharkhand also, the dependence increased from 52–54 per cent from the Twelfth FC onwards.
On the whole the dependence of low-income states has been increasing from the Tenth FC onwards except for Orissa where the dependence on central transfers has been decreasing.
Decomposition of Dependence of States
Table 8 captures the decomposition of dependence for general-category low-income states in two ways. It is observed that dependence of low income states is higher than that of middle income states.
Decomposition of Dependence: Low-Income States
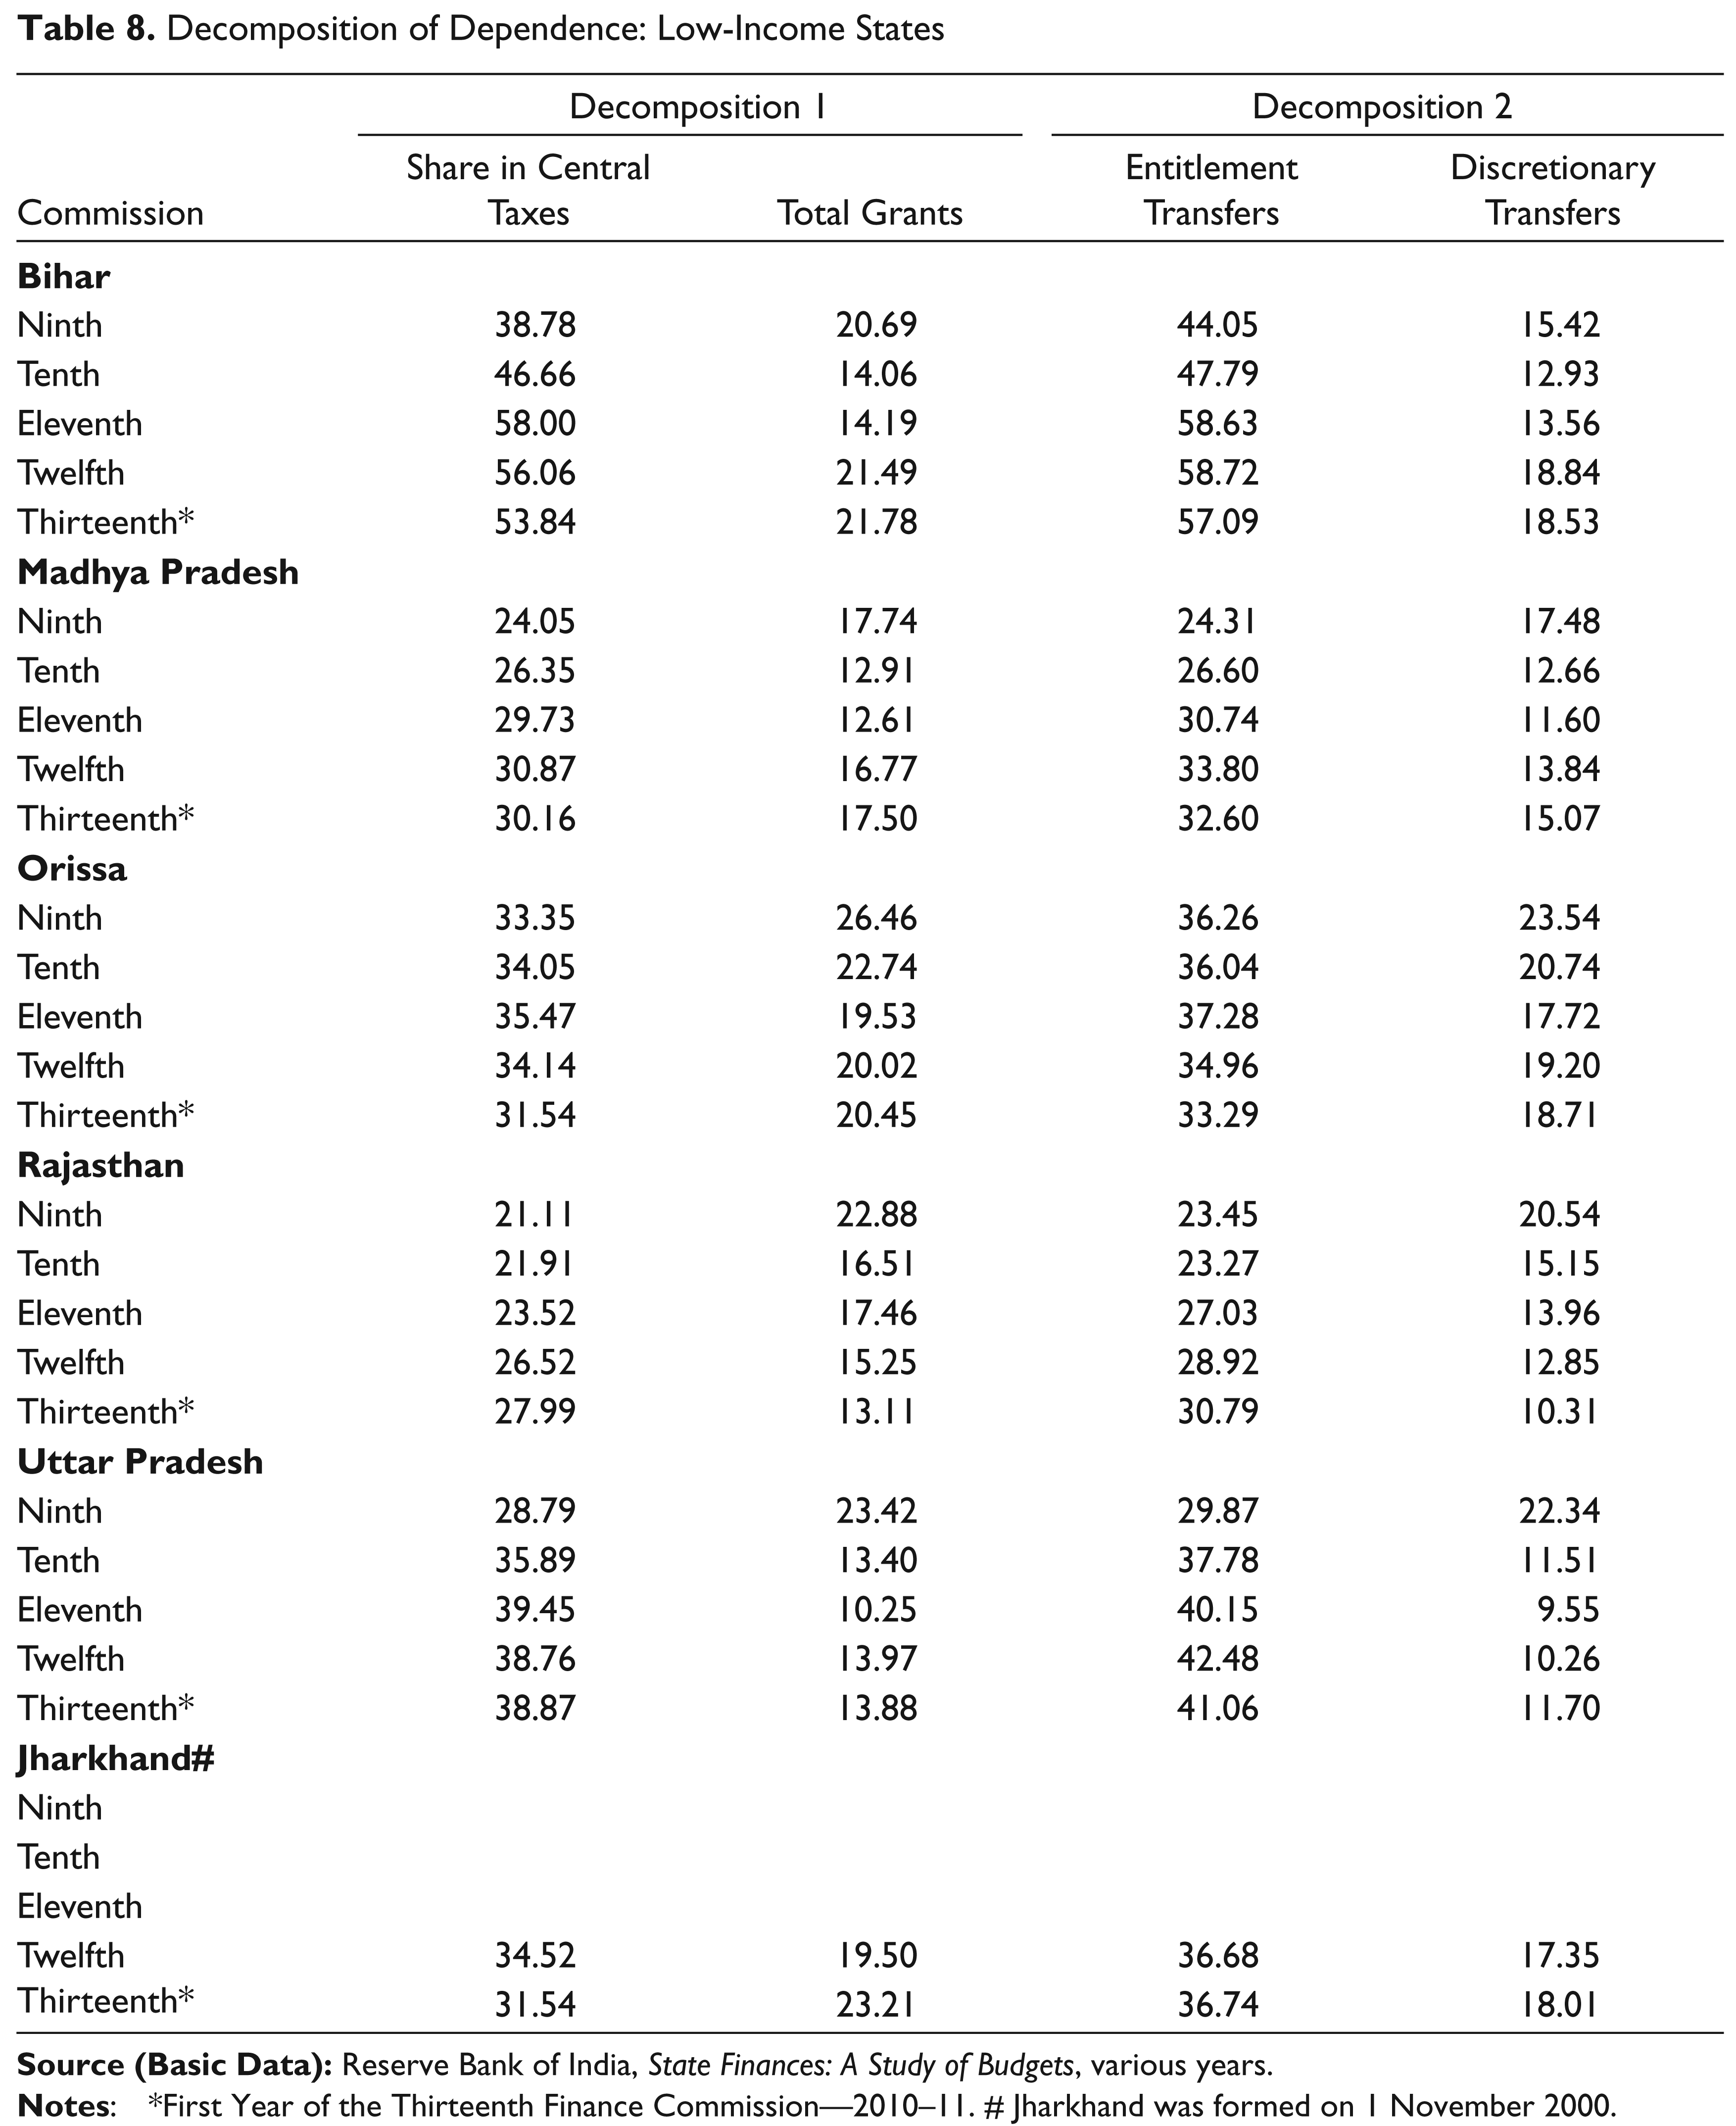
For Bihar, Decomposition 1 shows that the share of central taxes increased from 39–58 per cent in the Ninth to Eleventh FC and thereafter decreased to 54 per cent in the first year of the Thirteenth FC. On the other hand, total grants in the Ninth, Twelfth and the first year of the Thirteenth FC was about 21 per cent and during the Tenth to Eleventh FC about 14 per cent. In Decomposition 2 the entitlement transfers rose from 44–59 per cent in the Ninth to Twelfth FC and came down to 57 per cent in the first year of the Thirteenth FC. Discretionary transfers fluctuated between 13 and 18 per cent over the years.
For Madhya Pradesh, the share in central taxes increased from 24 to 30 per cent over the years, total grants fluctuated between 13 and 18 per cent while entitlement transfers also rose from 24 to 33 per cent over the commission periods and discretionary transfer varied between 12 and 15 per cent for the Ninth FC when it was 17 per cent.
In the case of Orissa, the composition of dependence, namely, the share in central taxes varied from 32 to 35 per cent over the years and total grants 20 to 23 per cent, excluding the Ninth FC (26 per cent); while entitlement grants ranged from 33 to 37 per cent and discretionary transfers from 18 to 24 per cent.
For Rajasthan, the composition of share in central taxes increased from 21 to 28 per cent and total grants fluctuated between 13 and 17 per cent, excluding the Ninth FC (23 per cent). The second decomposition shows that entitlement transfers rose from 23 to 31 per cent over the years and discretionary transfers oscillated between 10 and 5 per cent, excluding the Ninth FC (21 per cent).
For Uttar Pradesh, the decomposition shows that share in central taxes rose from 29 to 39 per cent during the Ninth to Eleventh FC and stabilized at 39 per cent in the Twelfth FC and the first year of the Thirteenth FC. Excluding the Ninth FC (23 per cent), the total grants varied between 10 and 14 per cent. In Decomposition 2 entitlement transfers increased from 30 to 42 per cent from the Ninth to Twelfth FC and fell by 1 percentage point in the first year of the Thirteenth FC. Excluding the Ninth FC (22 per cent), the discretionary transfers varied between 10 and 12 per cent.
For Jharkhand, the composition for the Twelfth FC was 35 per cent for central taxes and 20 per cent for total grants. In the second decomposition for the Twelfth FC, central taxes were 37 per cent and discretionary transfers 17 per cent. The composition in the first year of the Thirteenth FC share in central taxes was 32 per cent and total grants was 23 per cent while Decomposition 2 entitlements were 37 per cent and discretionary transfers were 18 per cent.
The decomposition of dependence of low-income states shows that they are extremely dependent on entitlement transfers, namely, share in central transfers and statutory transfers, to finance their activities.
Special-Category States Group 1
Dependence of States
Table 9 captures the dependence of special-category states Group 1. It is observed that dependence of special category states is higher than the general-category low-income states. The dependence is highest for Jammu and Kashmir, followed by Meghalaya, and then Himachal Pradesh and Sikkim.
Dependence of Special-Category States: Group 1
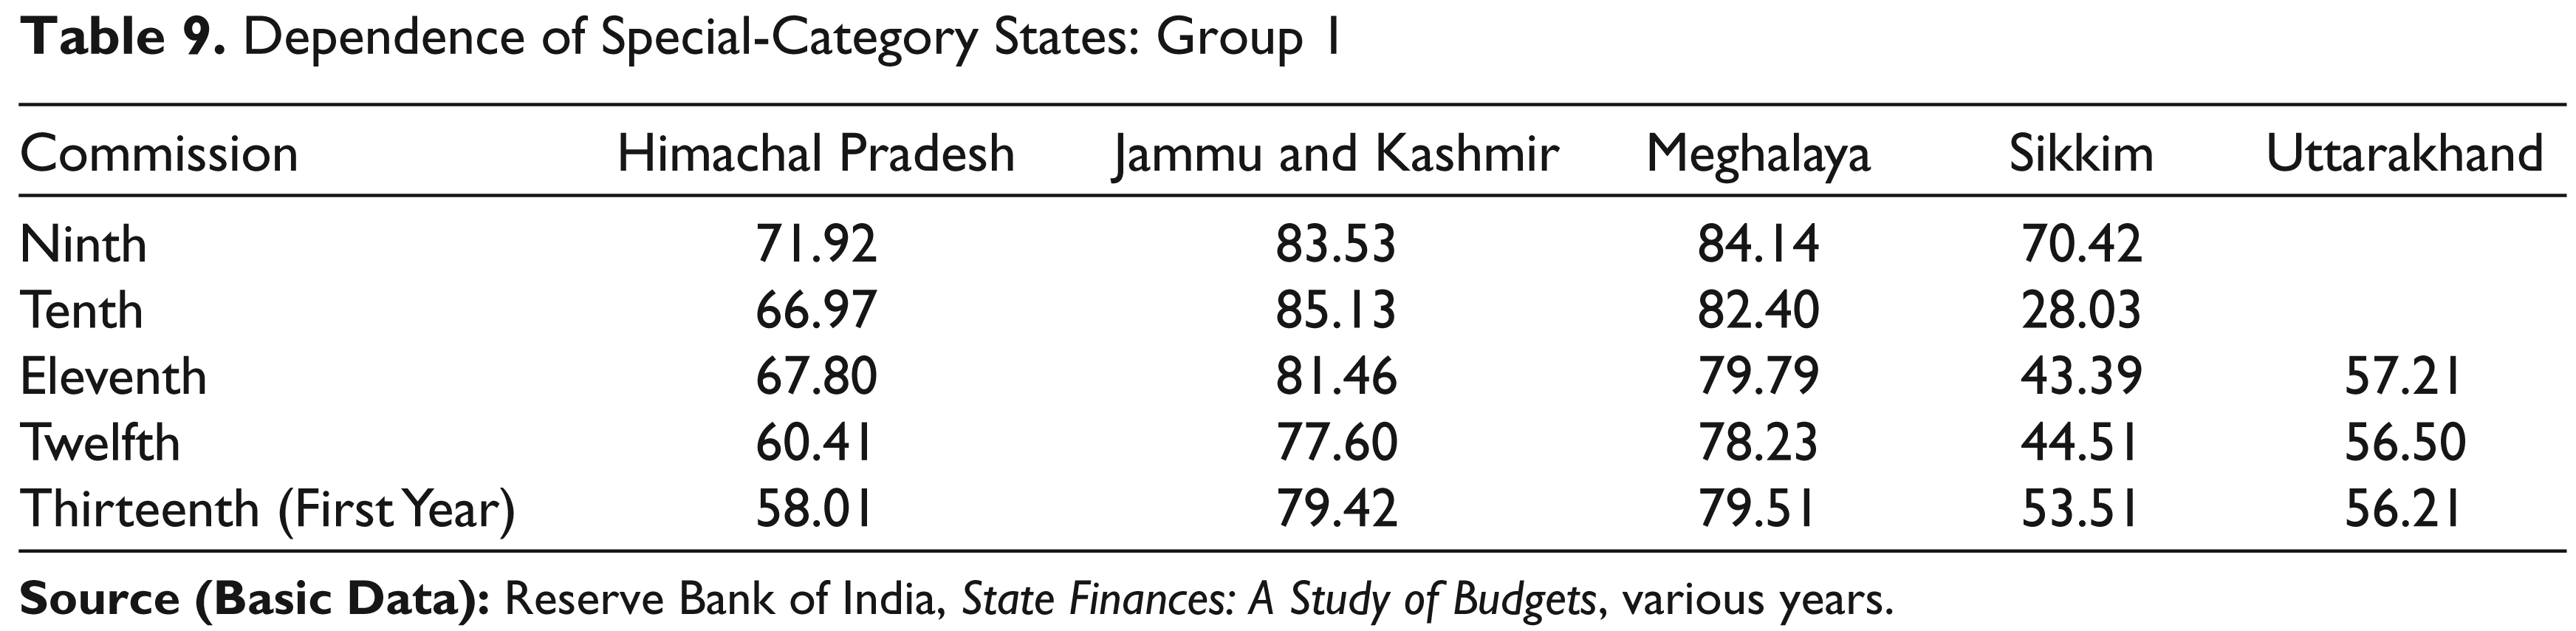
For Himachal Pradesh, the dependence on central transfers fell from about 72 to 58 per cent over the Ninth FC to the first year of the Thirteenth FC except for the Tenth FC where the ratio was 68 per cent.
In the case of Jammu and Kashmir, dependence was above 81 per cent from the Ninth to Eleventh FC while it fell to 78 per cent in the Twelfth FC and subsequently rose to 79 per cent in the first year of the Thirteenth FC.
For Meghalaya, dependence came down from 84 to 78 per cent in the Ninth to Twelfth FC, and thereafter rose to about 80 per cent in the first year of the Thirteenth FC.
In the case of Sikkim, the dependence ratio was highest in the Ninth FC and thereafter fell sharply to 28 per cent in the Tenth FC. No statutory grants were provided by the Tenth FC and other grants were also nil. From the Eleventh FC, dependence rose from 43 to 54 per cent by the first year of Thirteenth FC. This reflects more of an increase in the state’s own revenues rather than a fall in the transfers
For Uttarakhand, it varied between 56 and 57 per cent in the Eleventh FC to the first year of the Thirteenth FC.
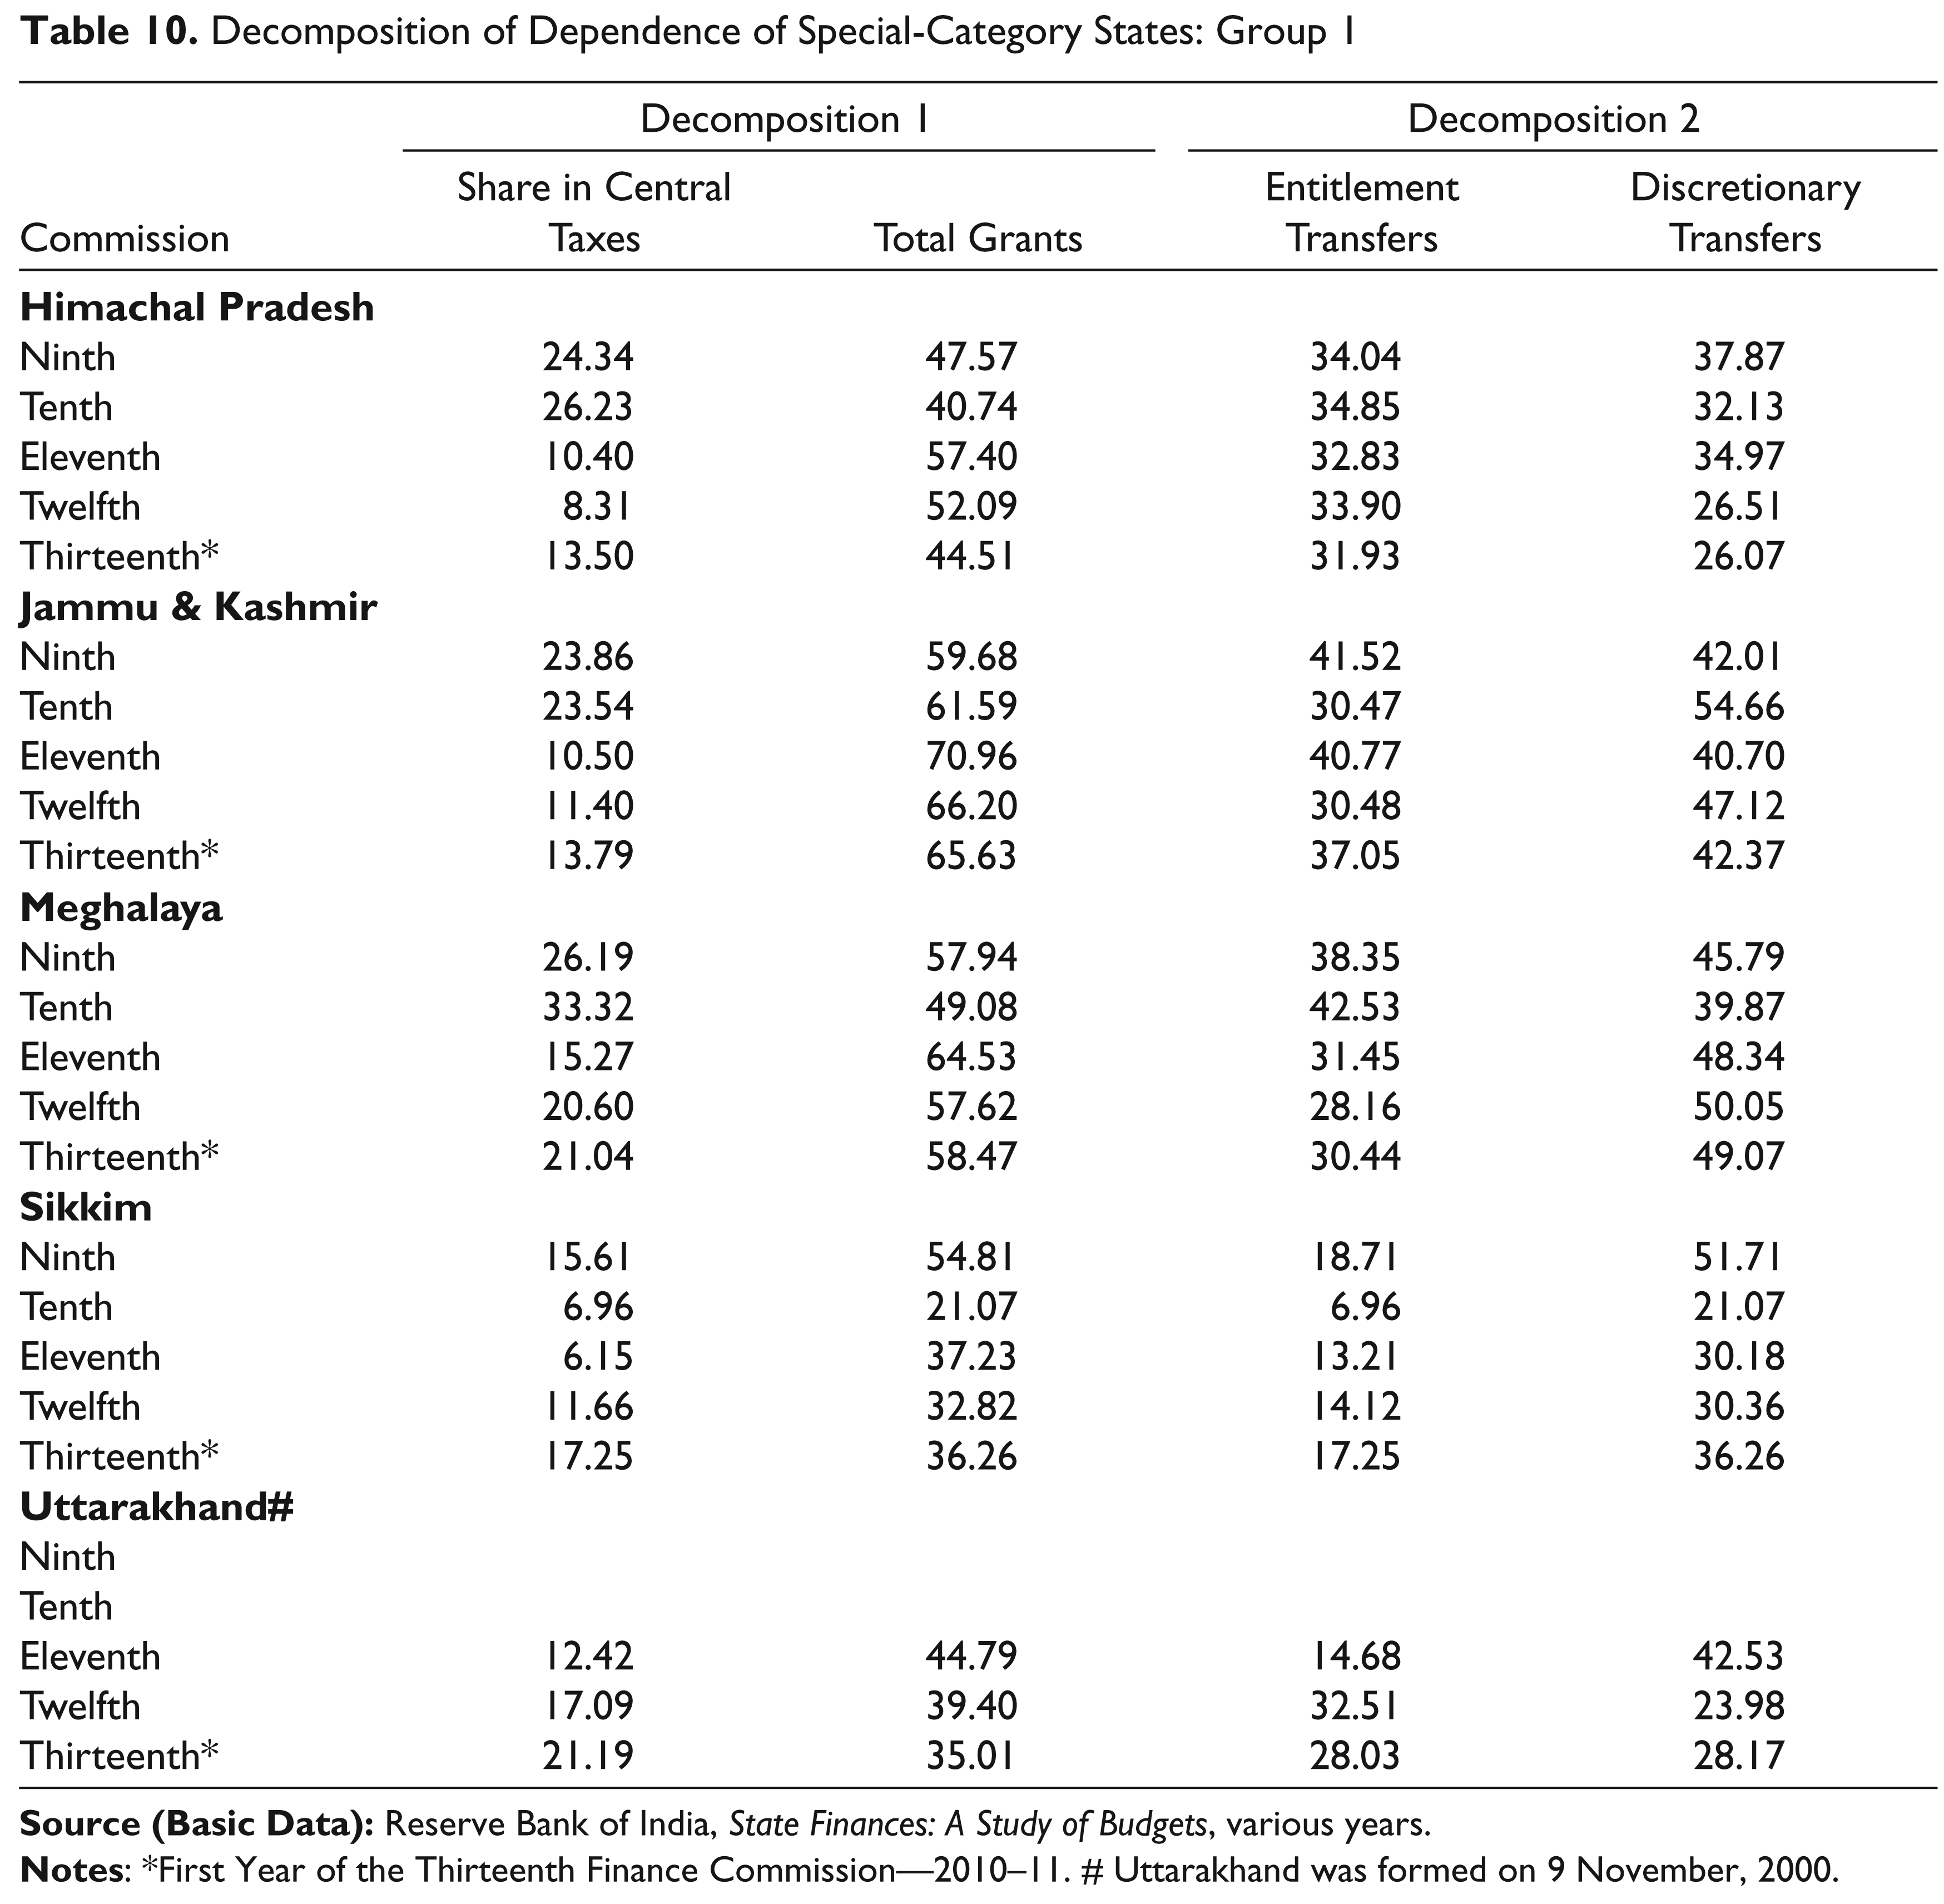
Decomposition of Dependence of States
Table 10 captures the dependence of special-category states Group 1. Since special-category states are mostly funded by grants it is observed that grants play major role in these economies. The decomposition of dependence shows that total grants across Group 1 states ranged between 32 and 71 per cent over the commission periods Ninth to Thirteenth. Since Sikkim did not receive any grants in the Tenth FC the share fell to 21 per cent while the dependence ratio was 28 per cent. Excluding the Tenth FC period of Sikkim, for Group 1 as a whole the dependence ratio is in the range of 43–85 per cent. The discretionary transfers seem to play an important role in Decomposition 2.
Decomposition of Dependence of Special-Category States: Group 1
Special-Category States: Group 2
Dependence of States
Table 11 captures the dependence of special-category states Group 2. It is observed that the dependence of special category states Group 2 is higher than Group 1. Among Group 2 the dependence is highest for Nagaland, followed by Manipur, Mizoram, Arunachal Pradesh, Tripura and Assam.
Dependence of Special-Category States: Group 2
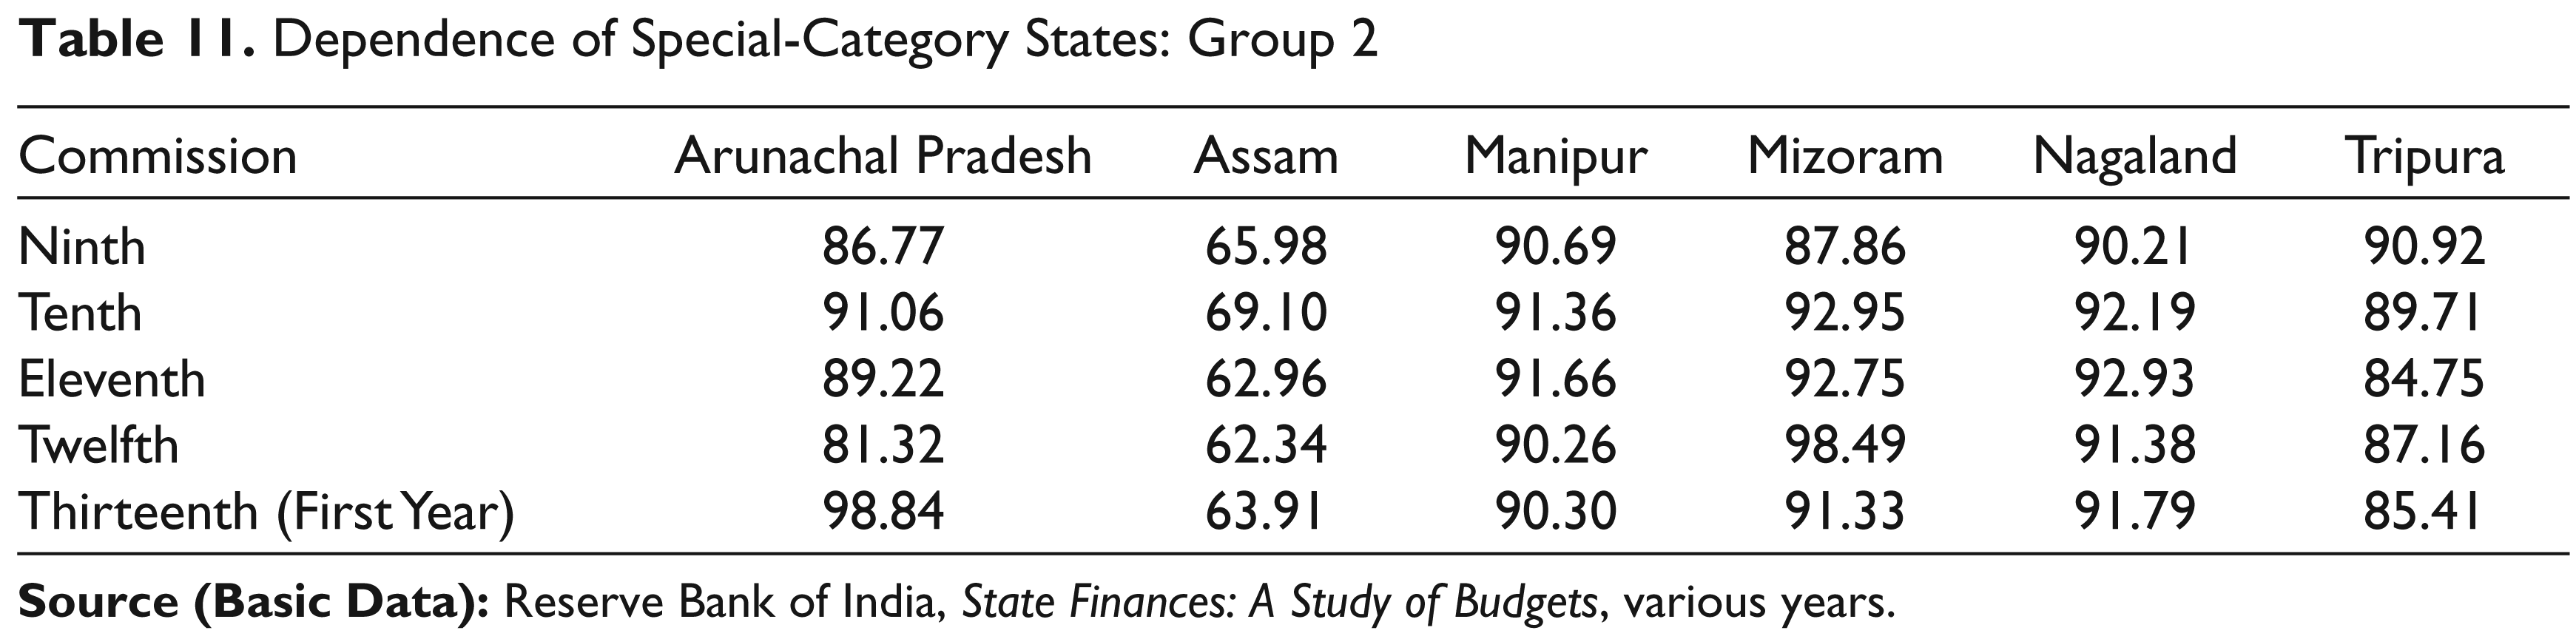
Assam has the minimum dependence on transfers in the range of 62–69 per cent. In comparison, the highest dependence has been Nagaland 90–93 per cent followed by Manipur 90–92 per cent, Mizoram 88–93 per cent, Arunachal Pradesh 81–98 per cent and Tripura 85–91 per cent. The north-eastern states remain highly dependent on central transfers.
Decomposition of Dependence of States
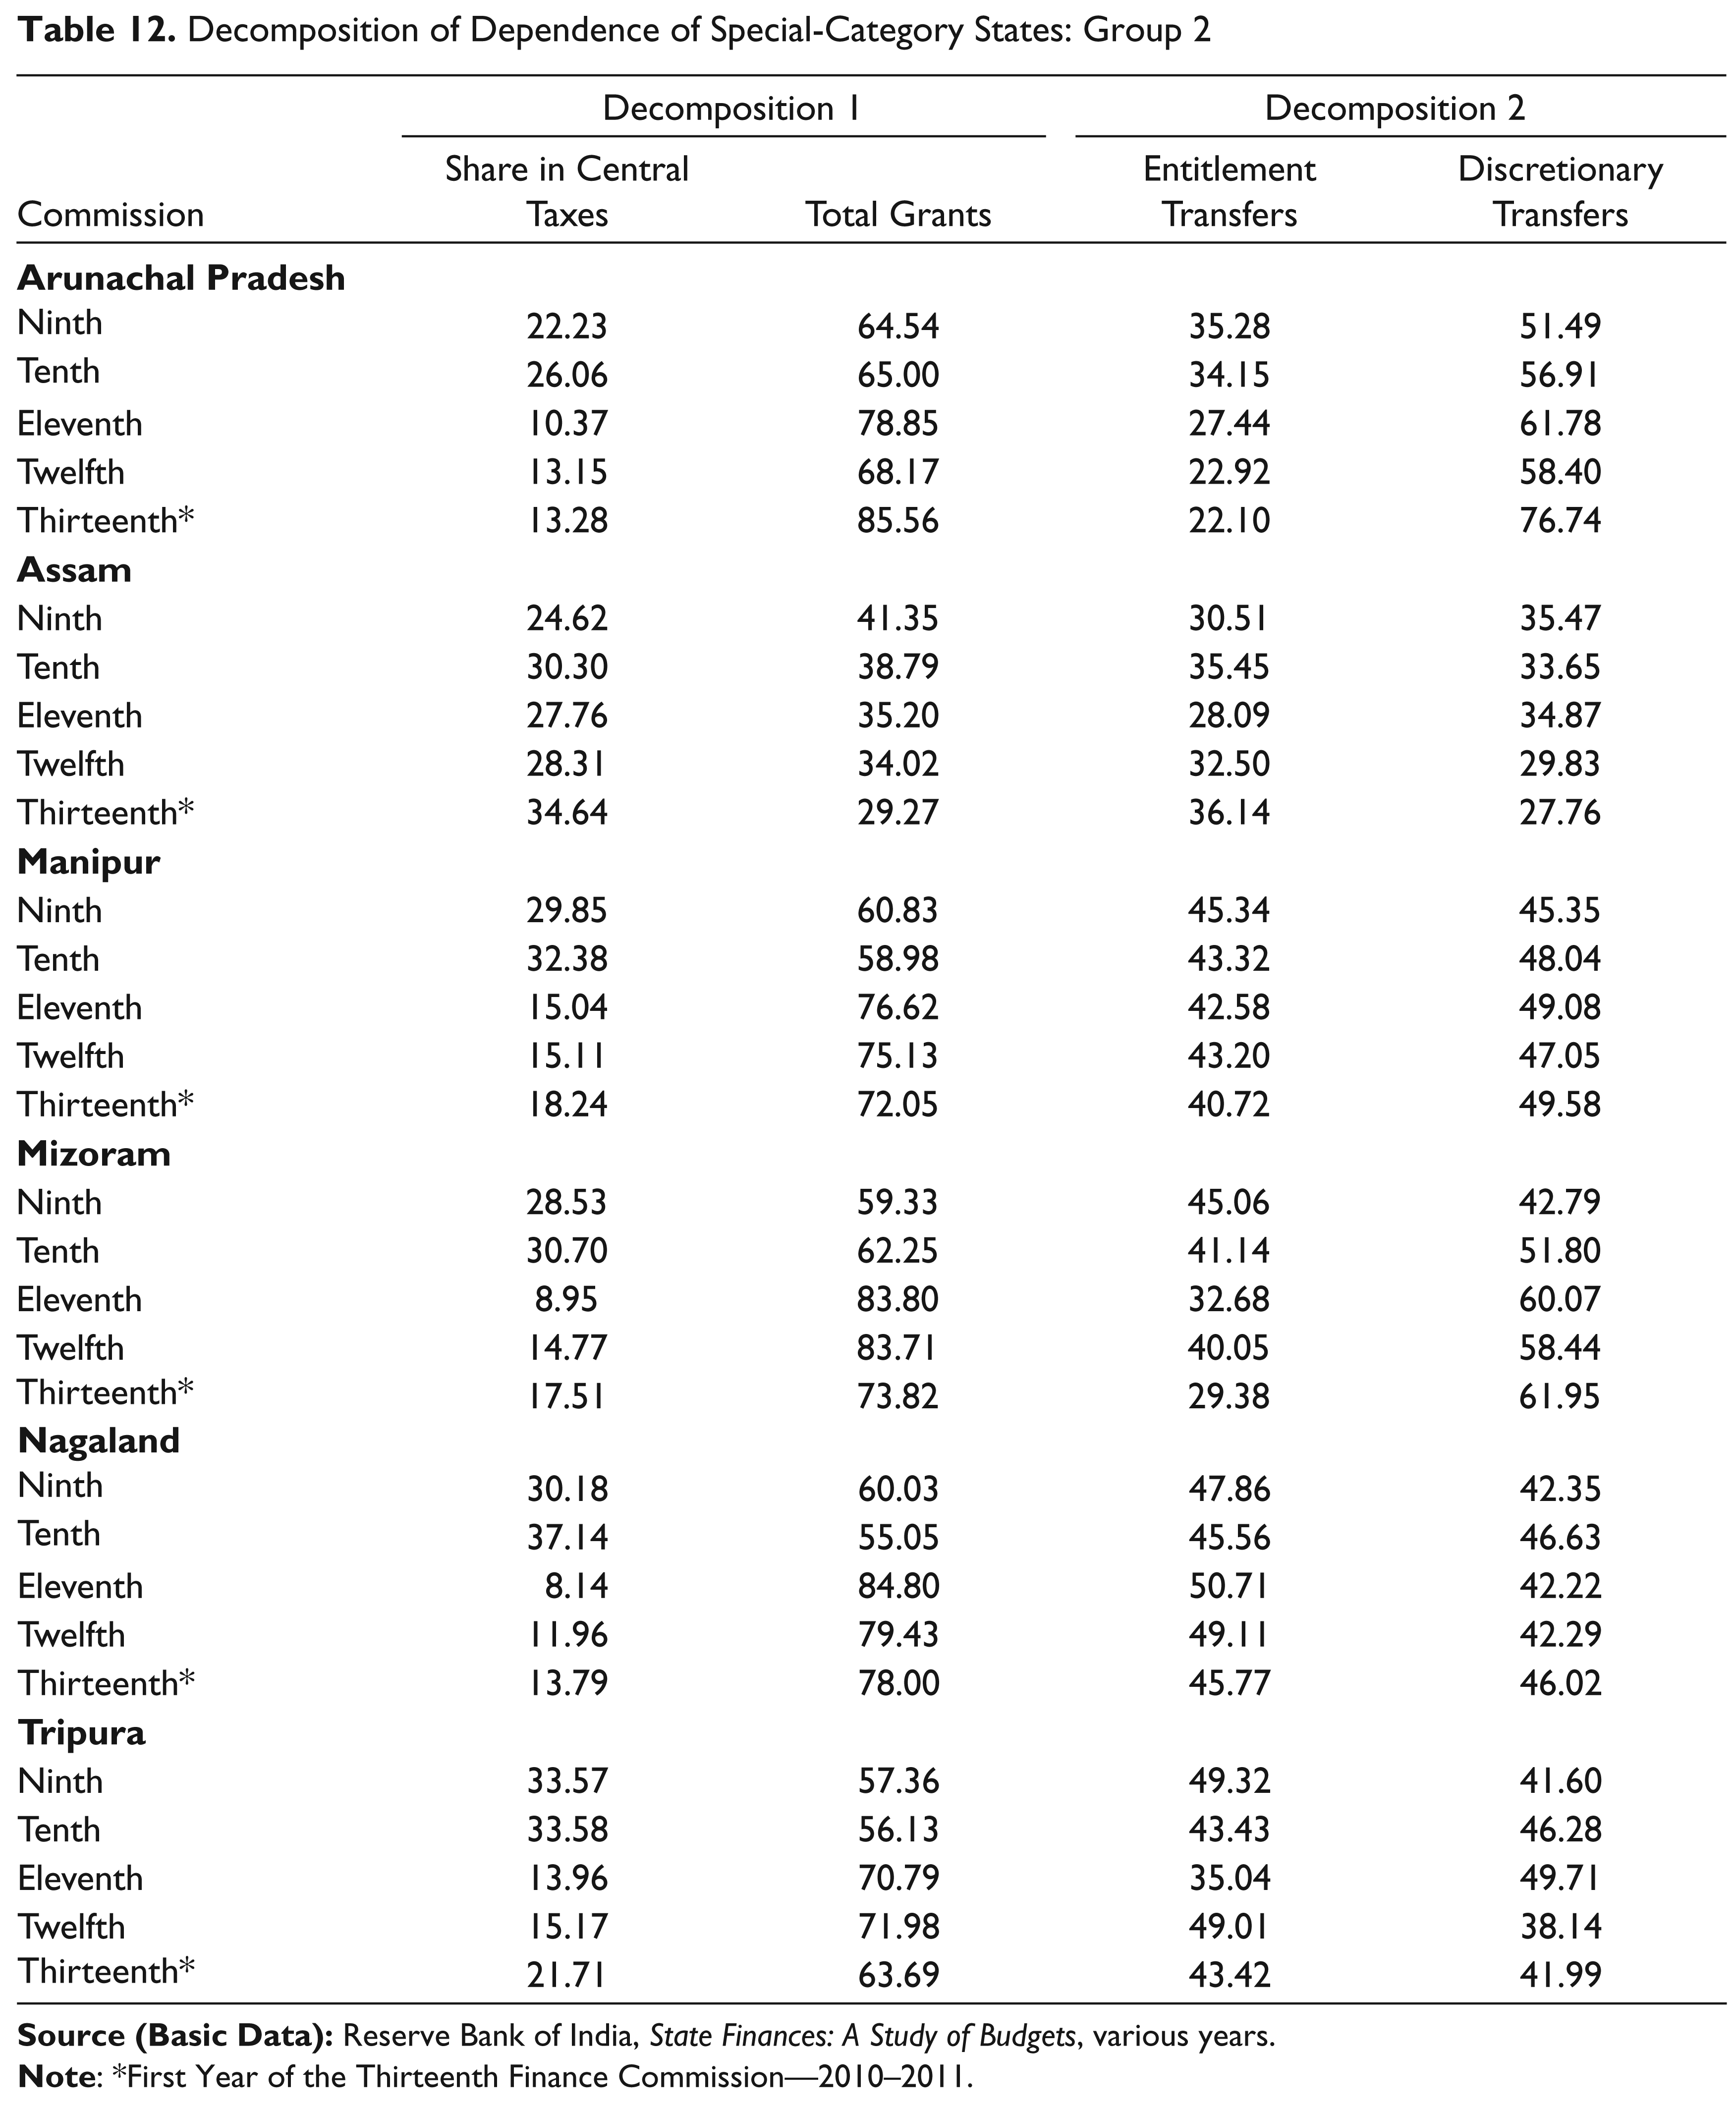
Table 12 captures the decomposition of special-category states Group 2 in two ways. Since special-category states are mostly funded by grants it is observed that grants play a major role in these economies. The decomposition of dependence shows that total grants ranged between 55 and 85 per cent over the commission periods of the Ninth to Thirteenth FC, if Assam is excluded. In the case of Assam, the range is between 29 and 41 per cent and the share is central taxes are 25–35 per cent. In the case of other states the shares are high in the Ninth and Tenth FC periods and fell sharply in the Eleventh FC and were in the range of 8–21 per cent. In Decomposition 2, discretionary transfers account for a higher share as compared to entitlements especially in Arunachal Pradesh, Manipur and Mizoram. In other states it seems fluctuating.
Decomposition of Dependence of Special-Category States: Group 2
Analysis of Per Capita Transfers and Per Capita Gross Domestic Product
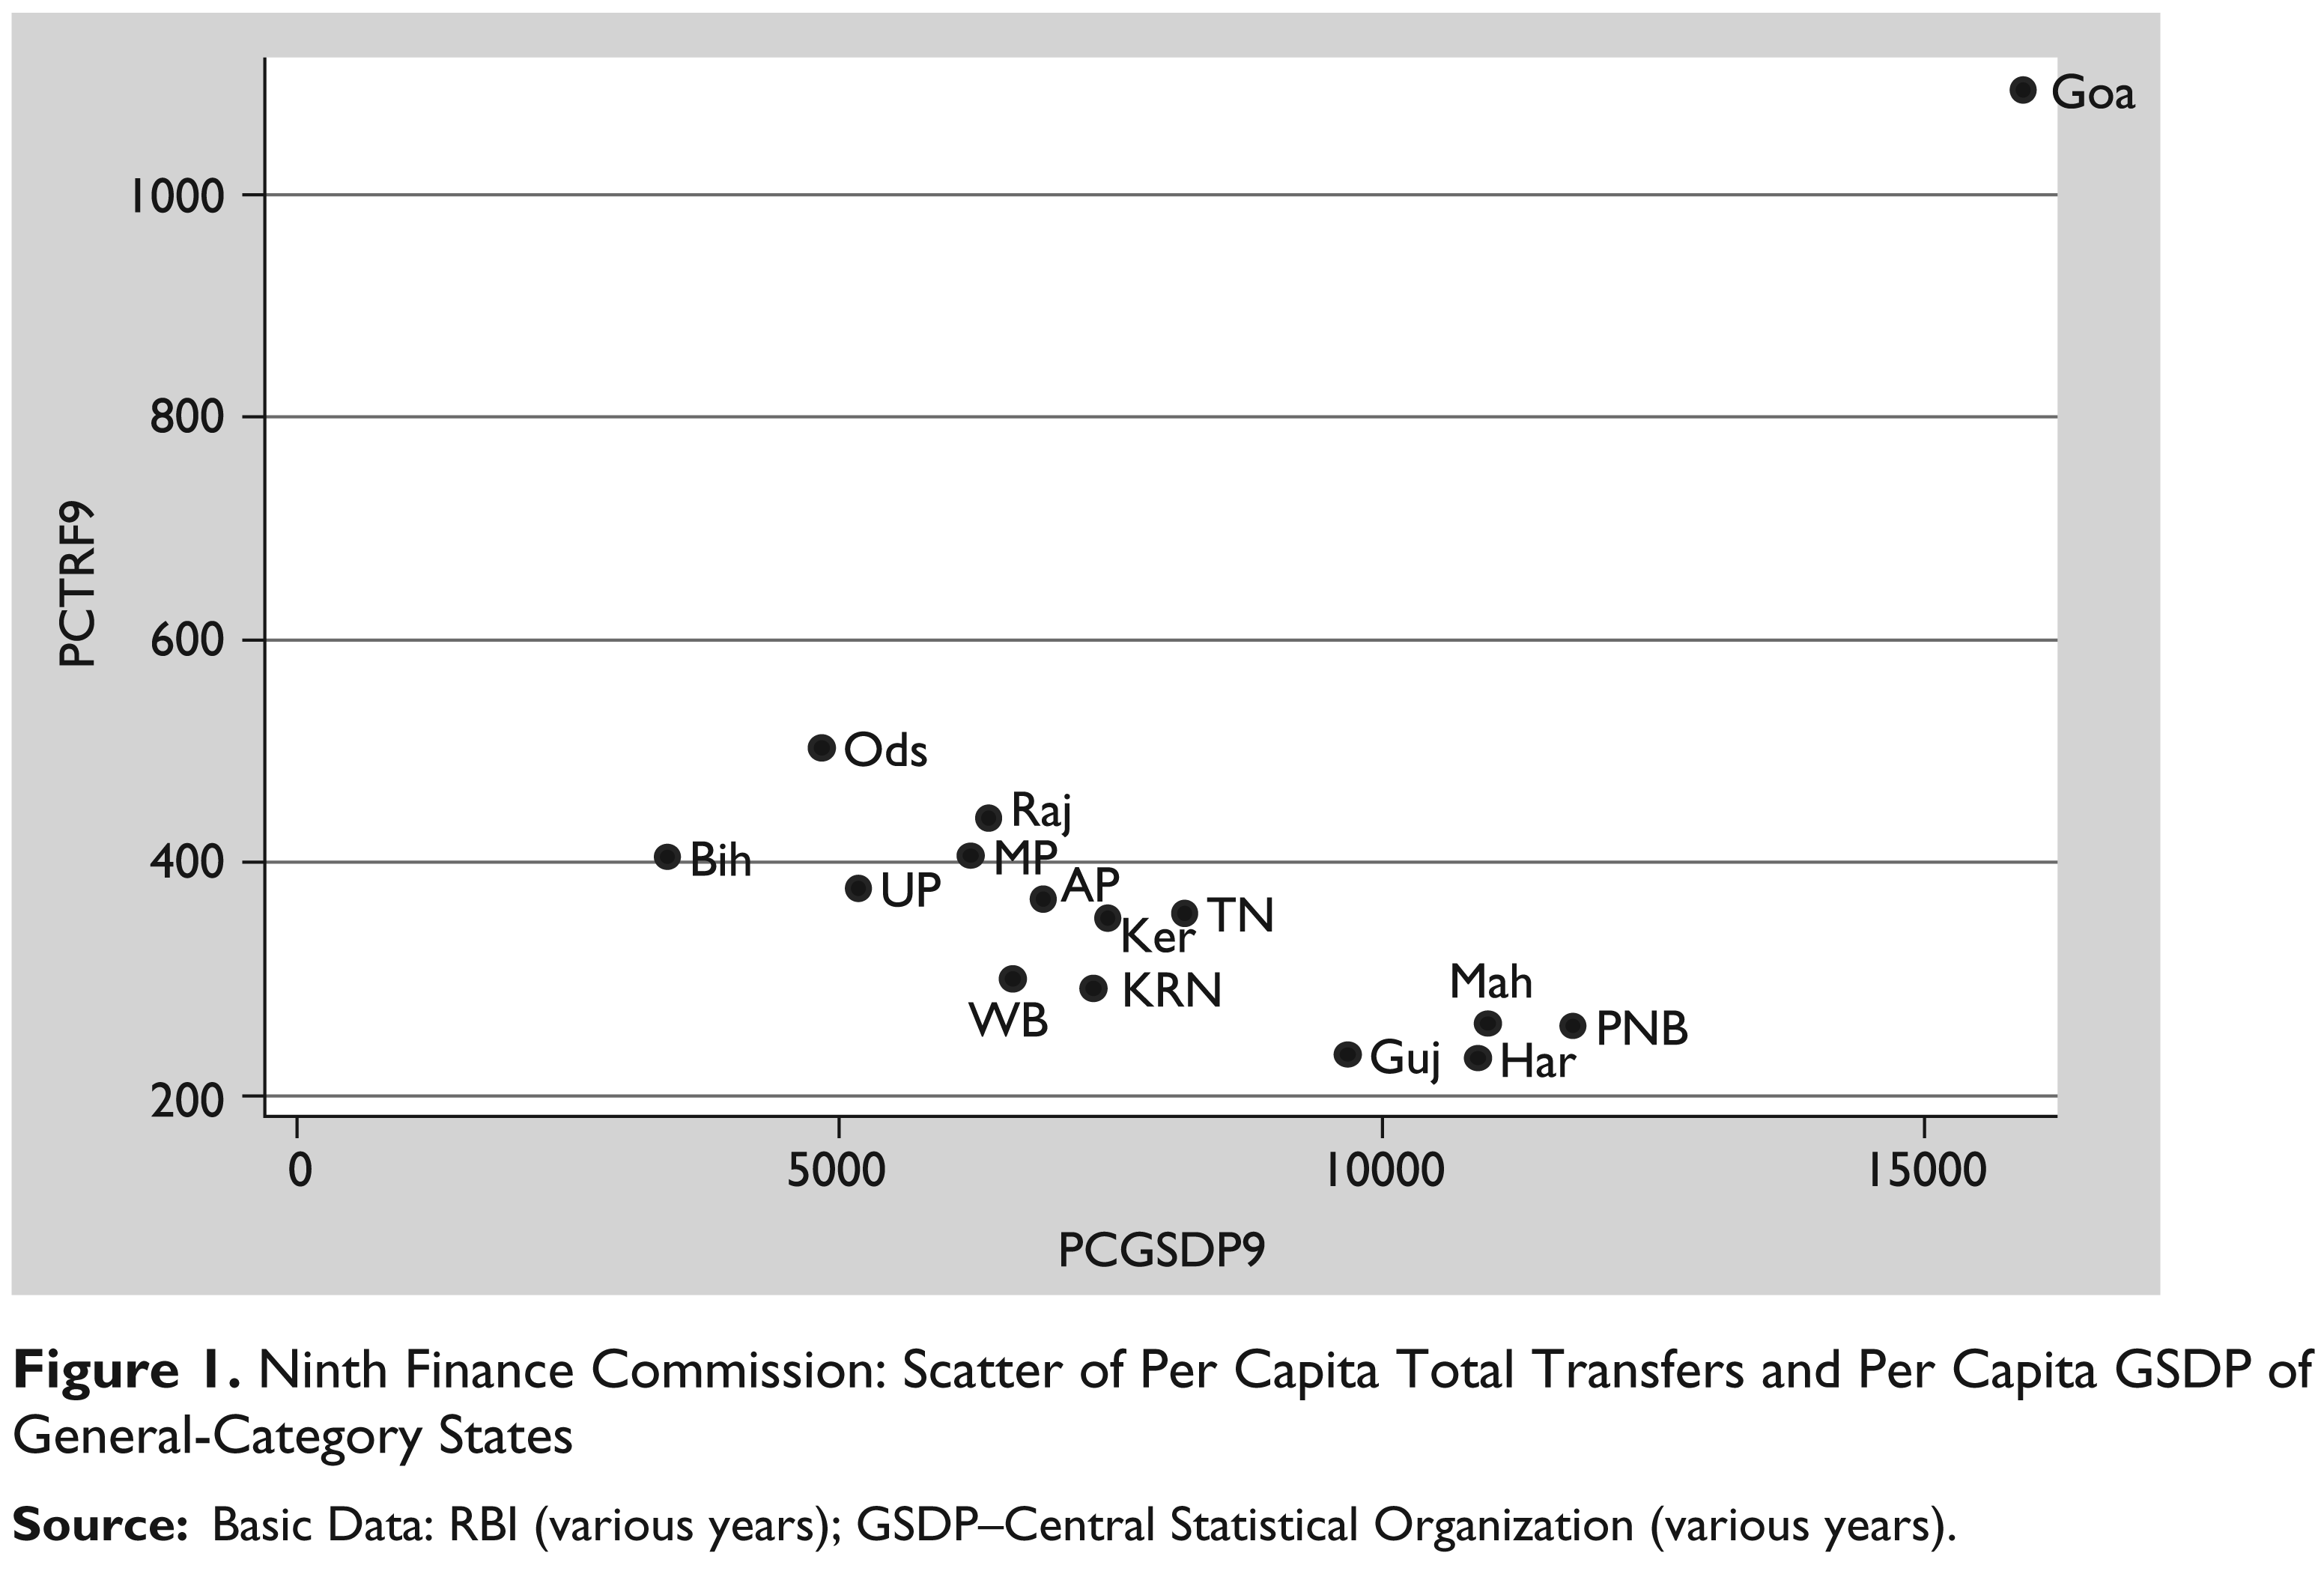
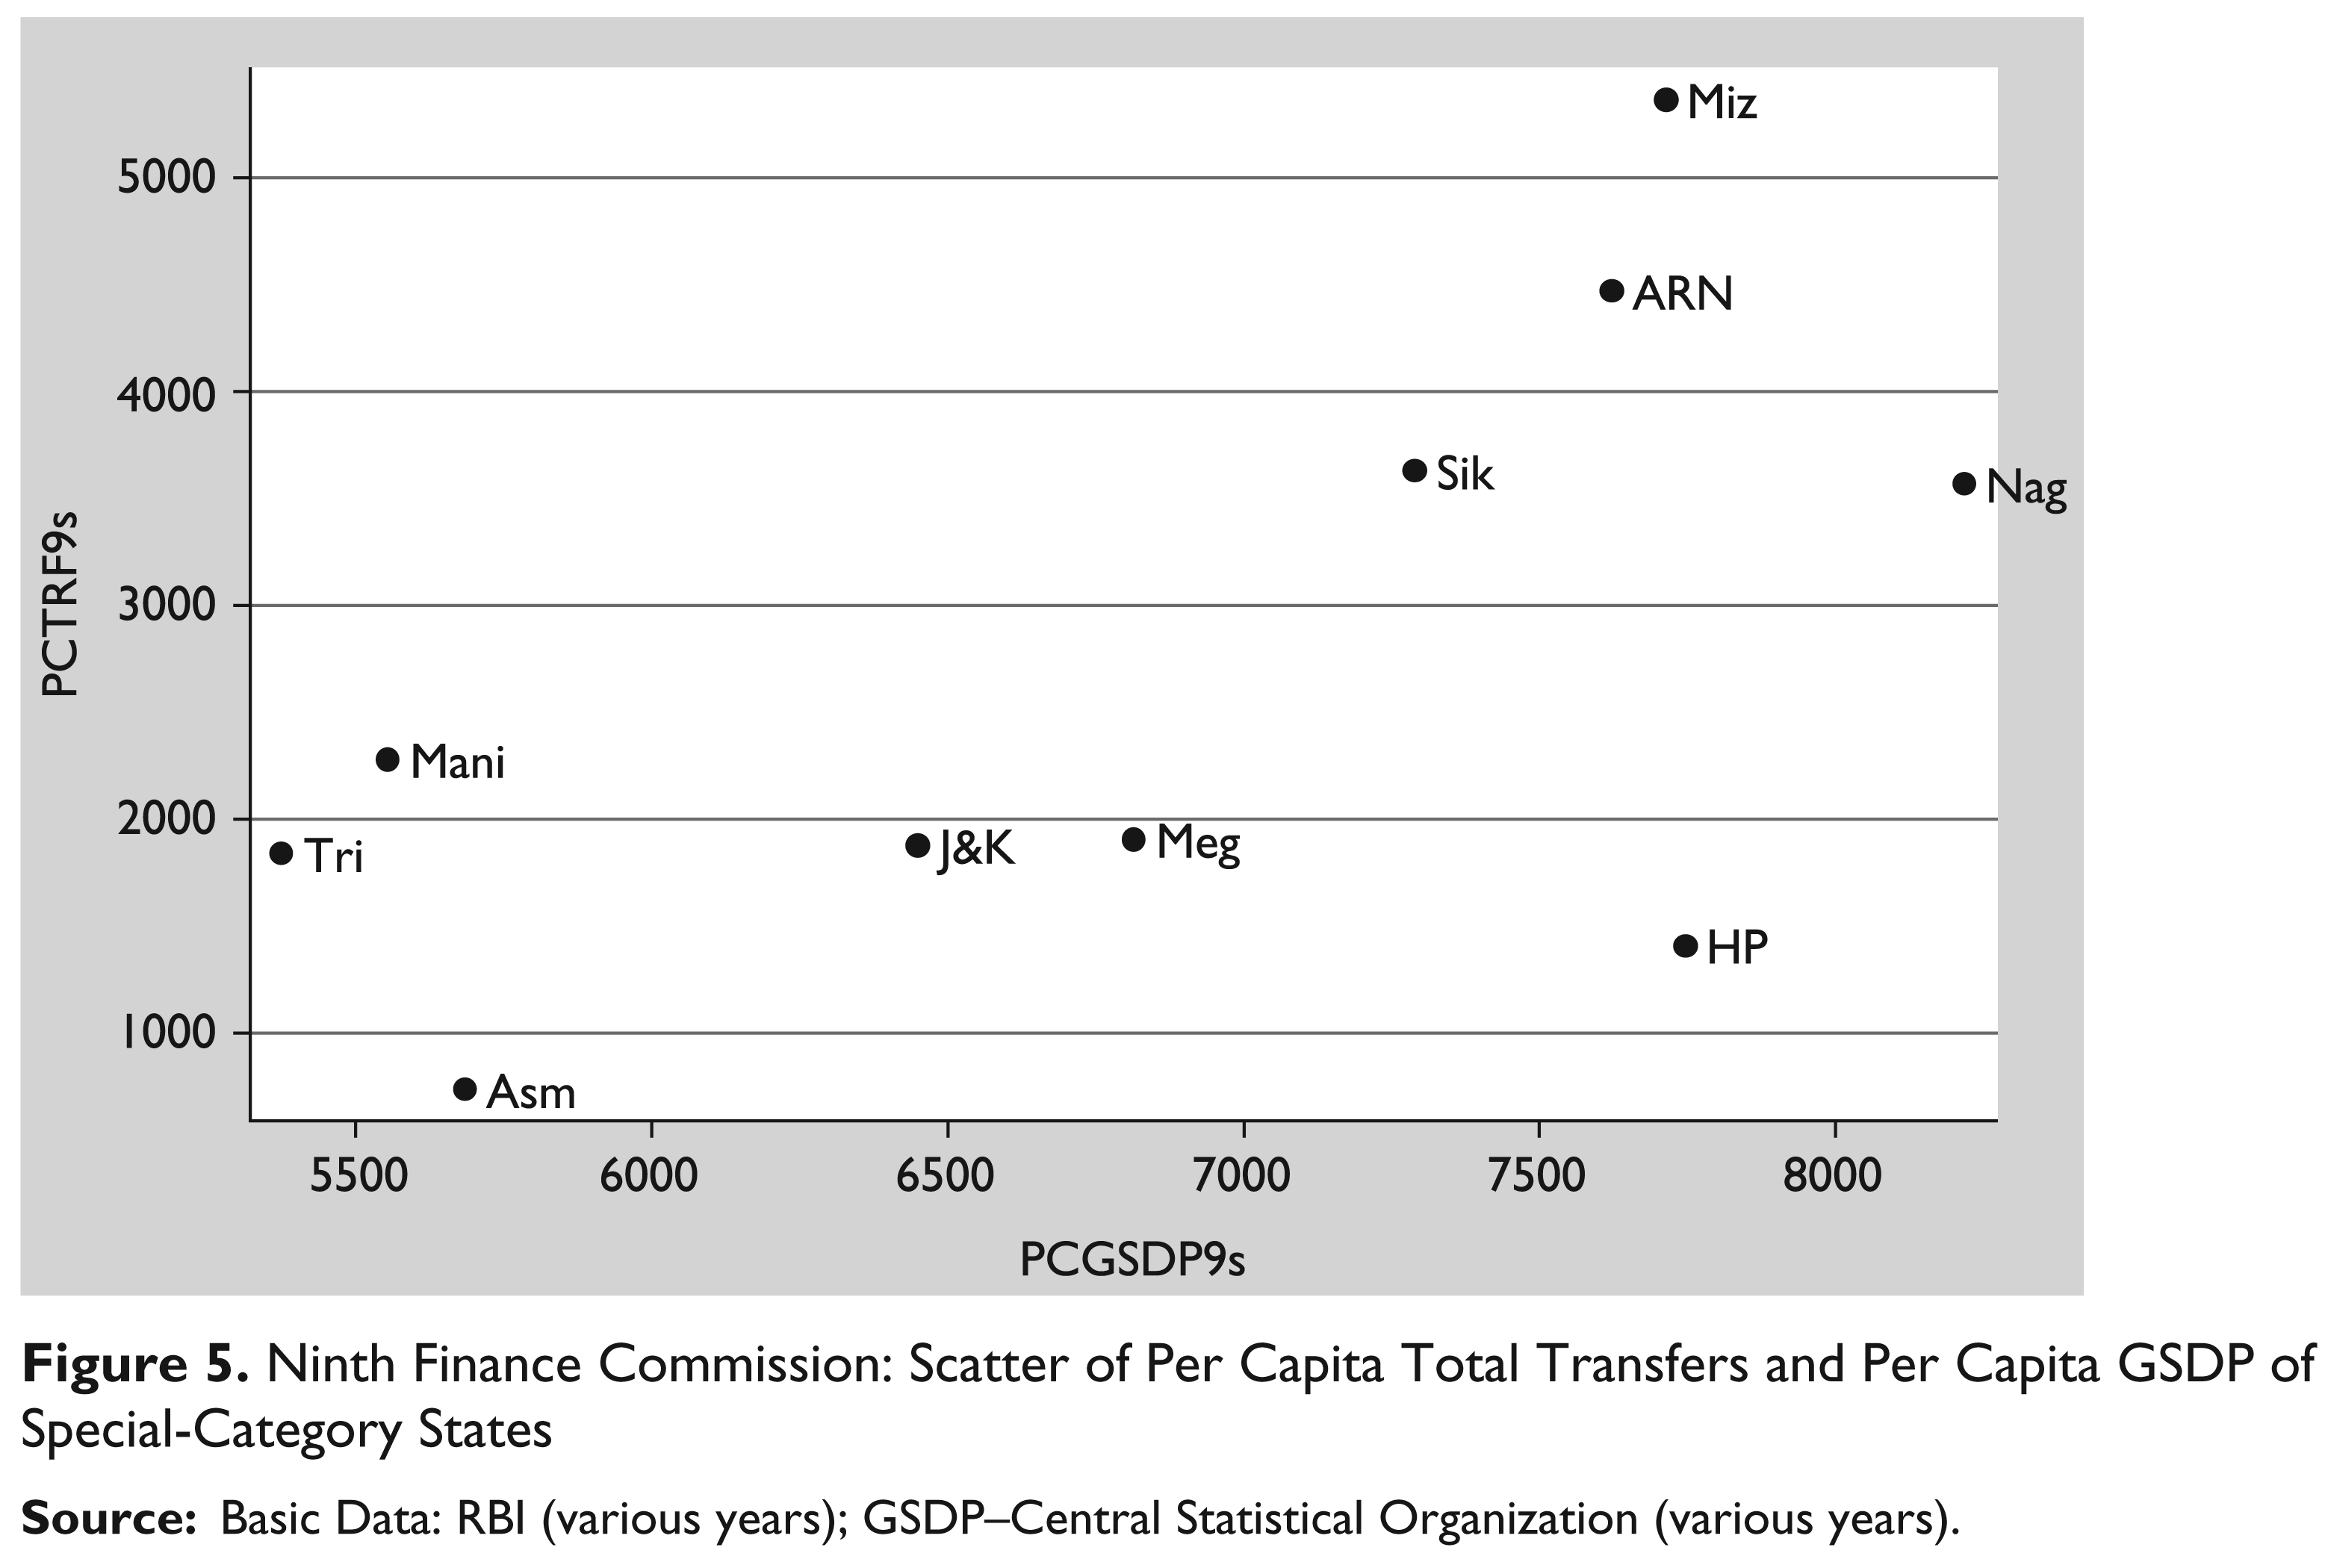
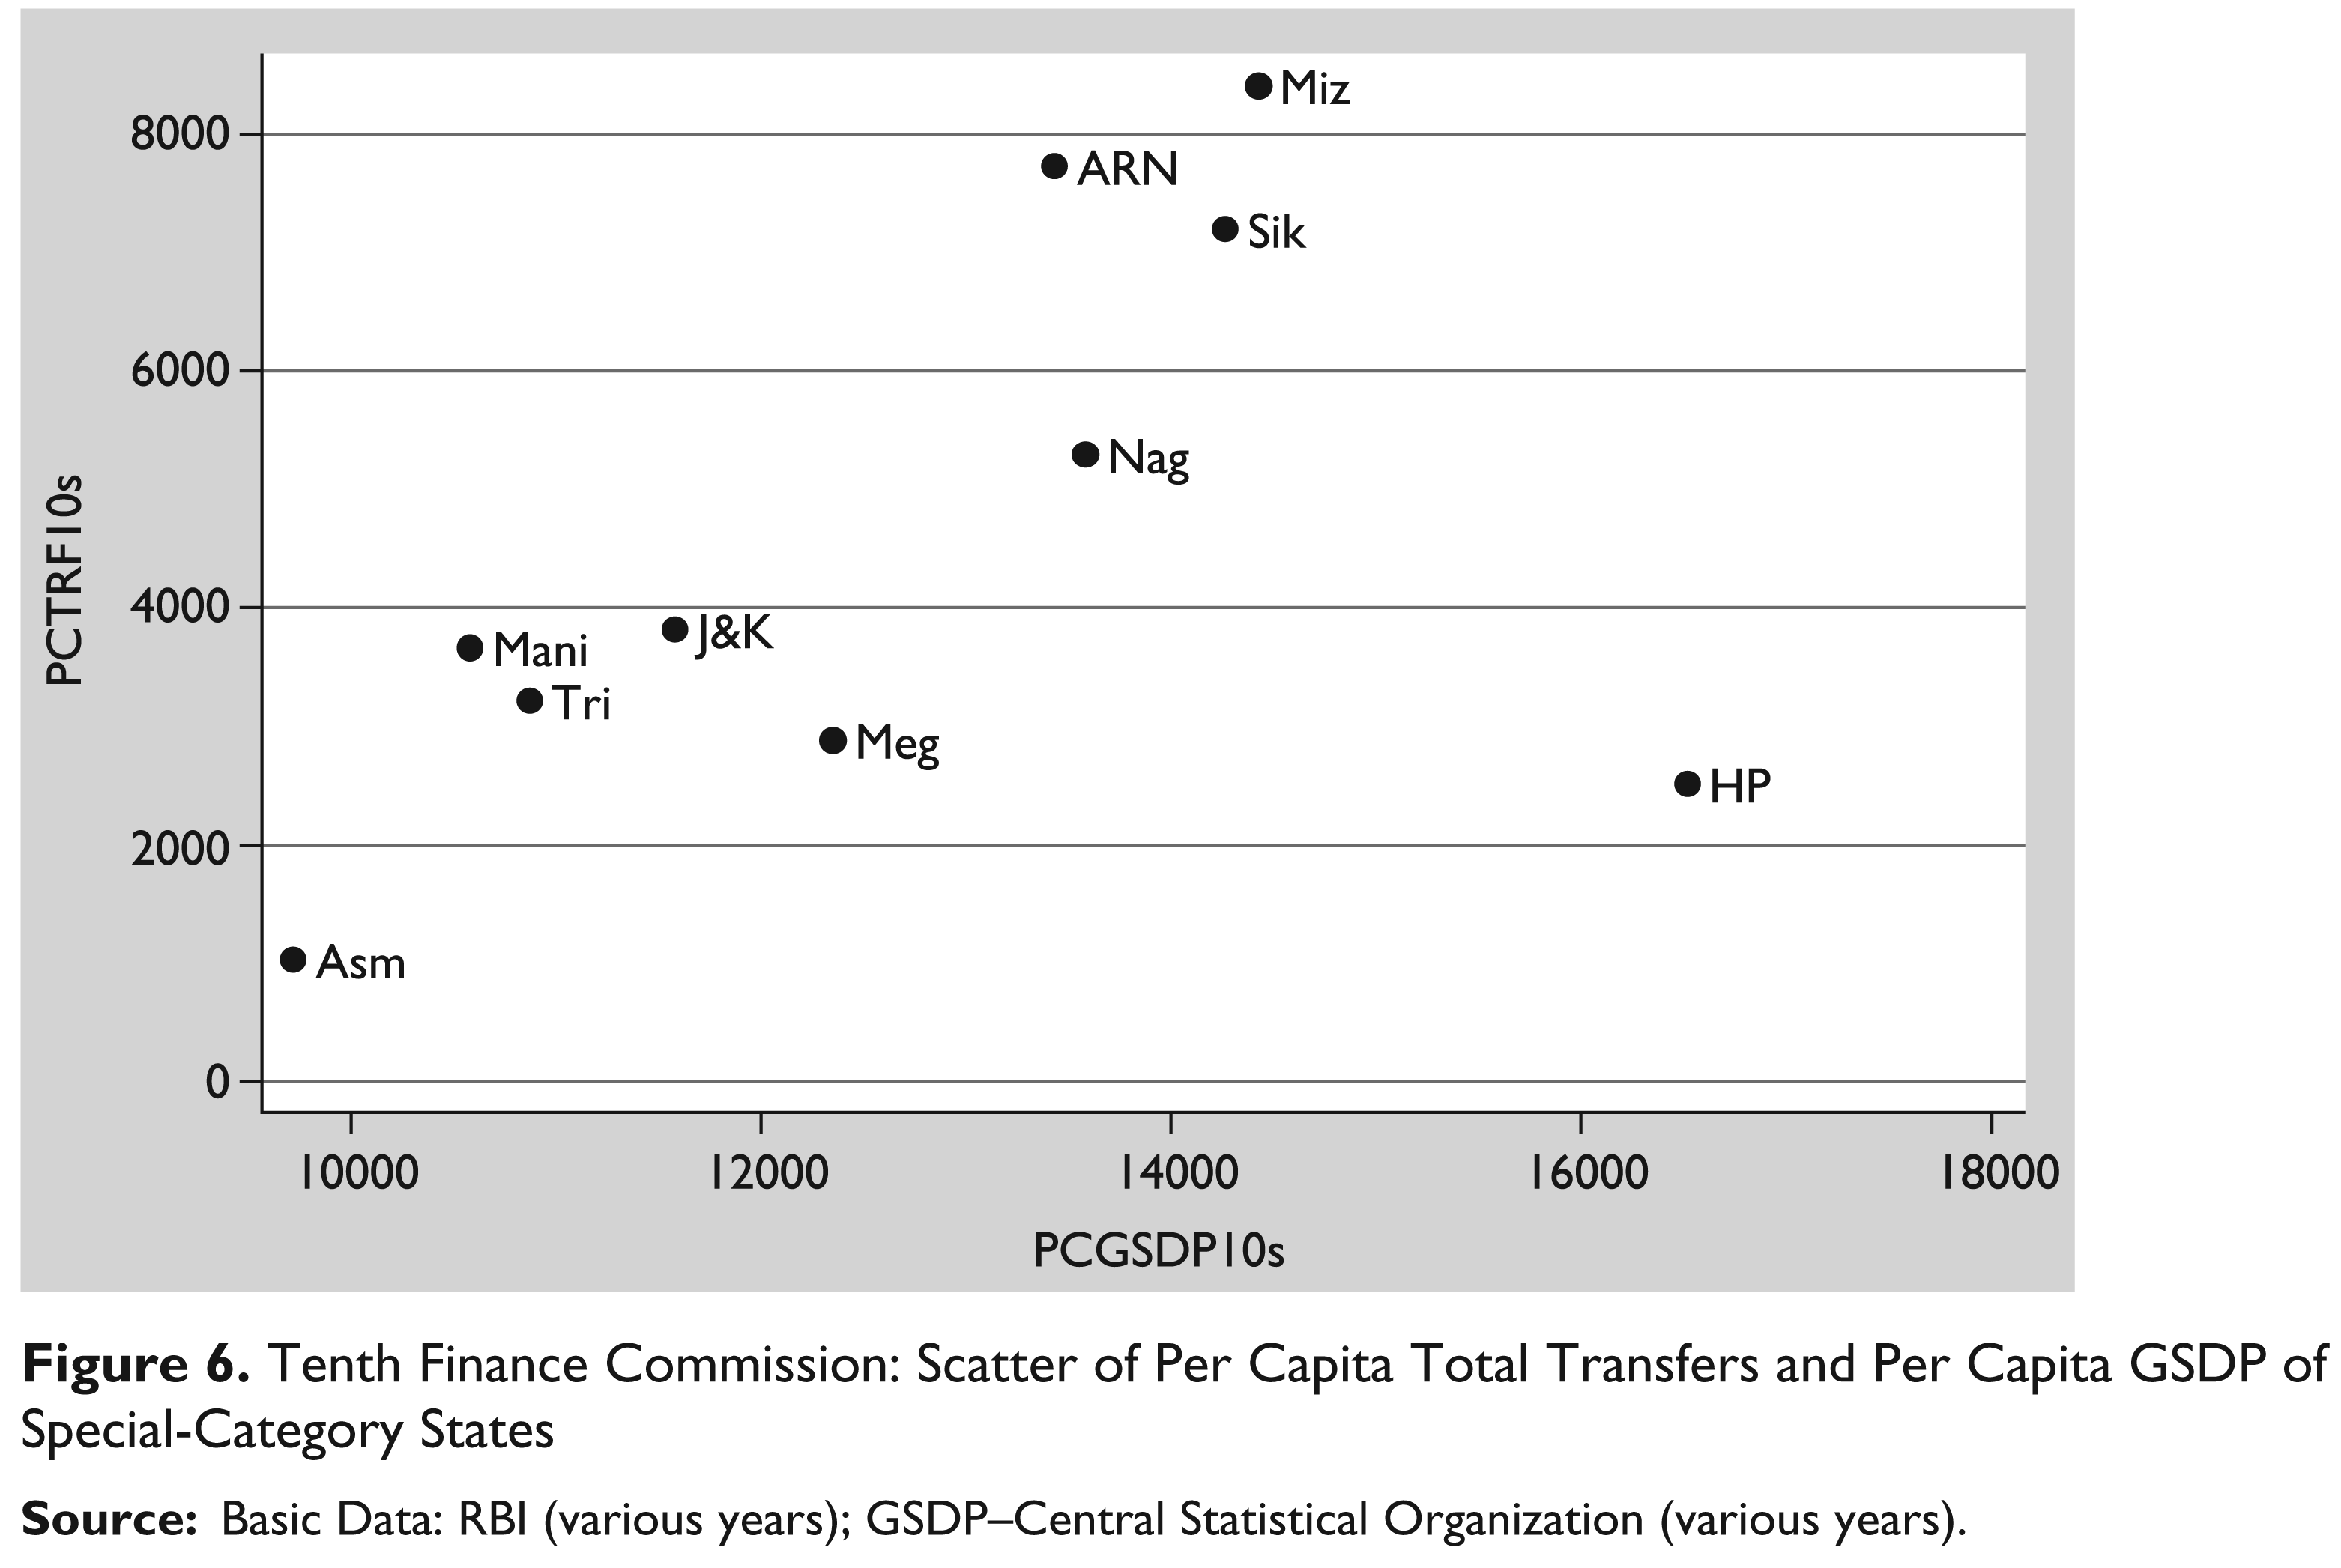
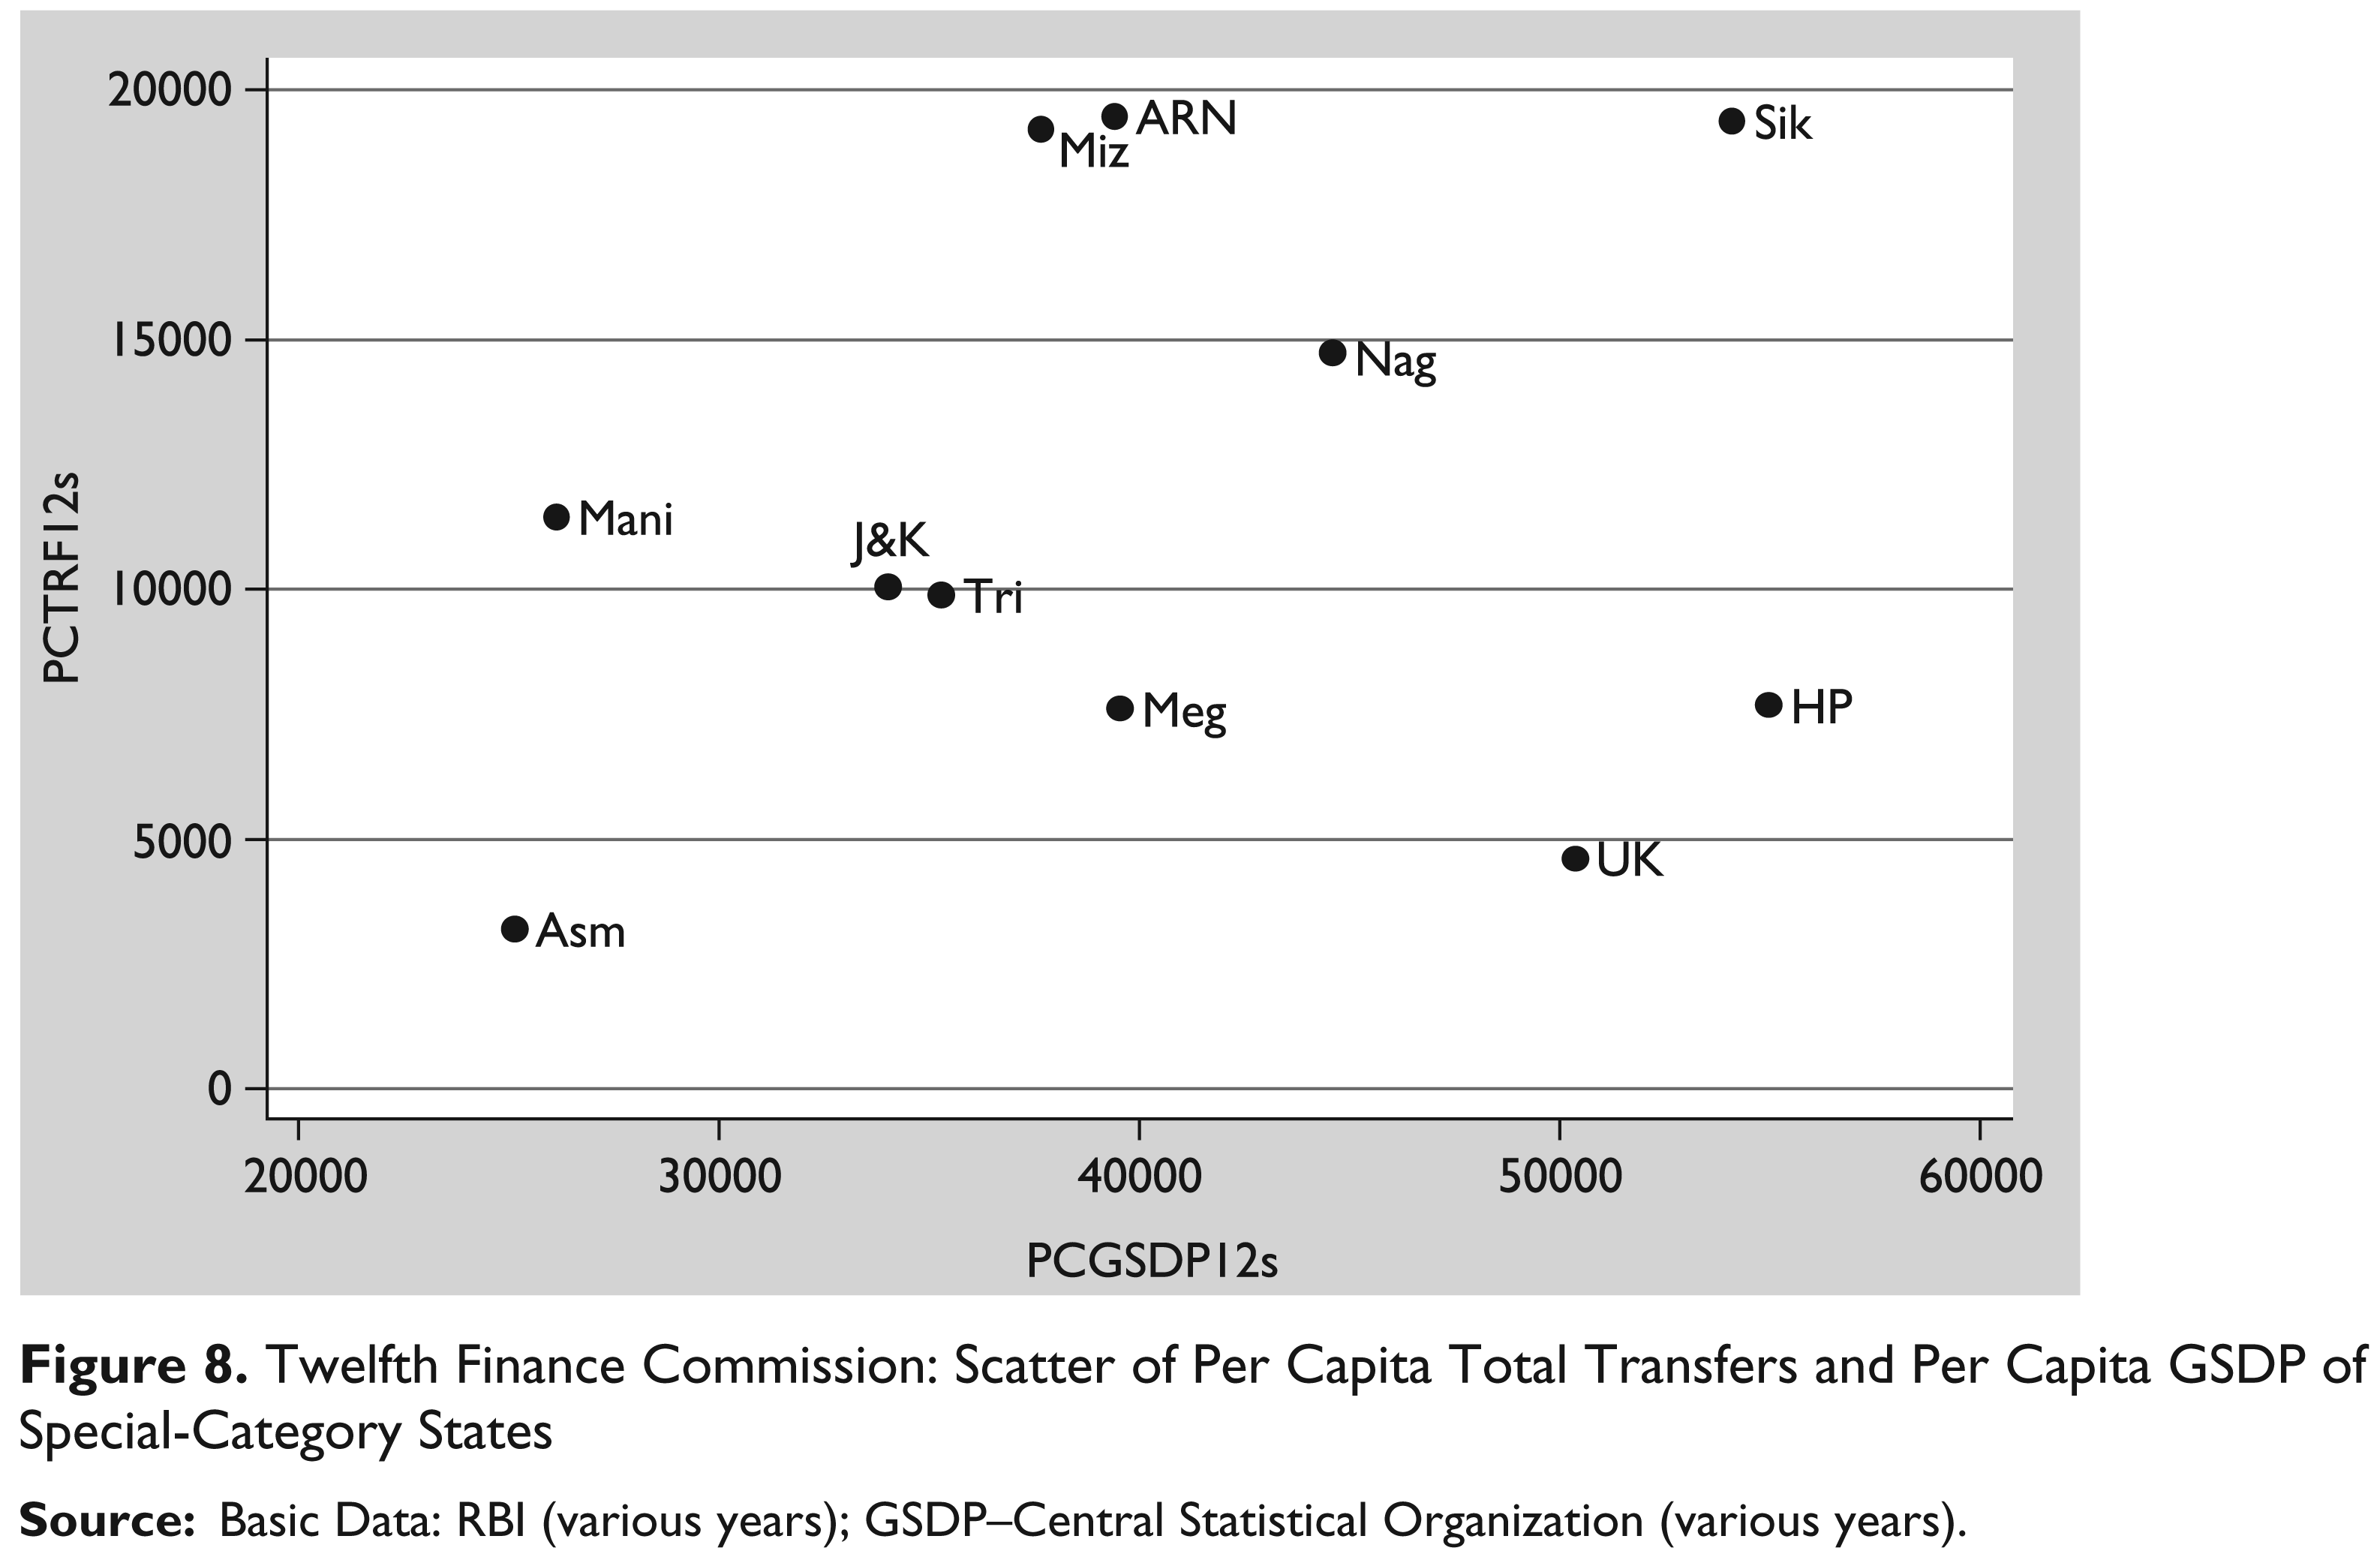
In this section total transfers and gross domestic product are present graphically in per capita terms from the Ninth to Eleventh FC period for the general- and special-category states separately. In the Ninth FC period (Figure 1) the high-income state like Gujarat, Maharashtra, Punjab and Haryana receive less per capita transfers from the centre as compared to the middle-income and low-income states. The same scenario emerges from the dependence analysis in the earlier sections.
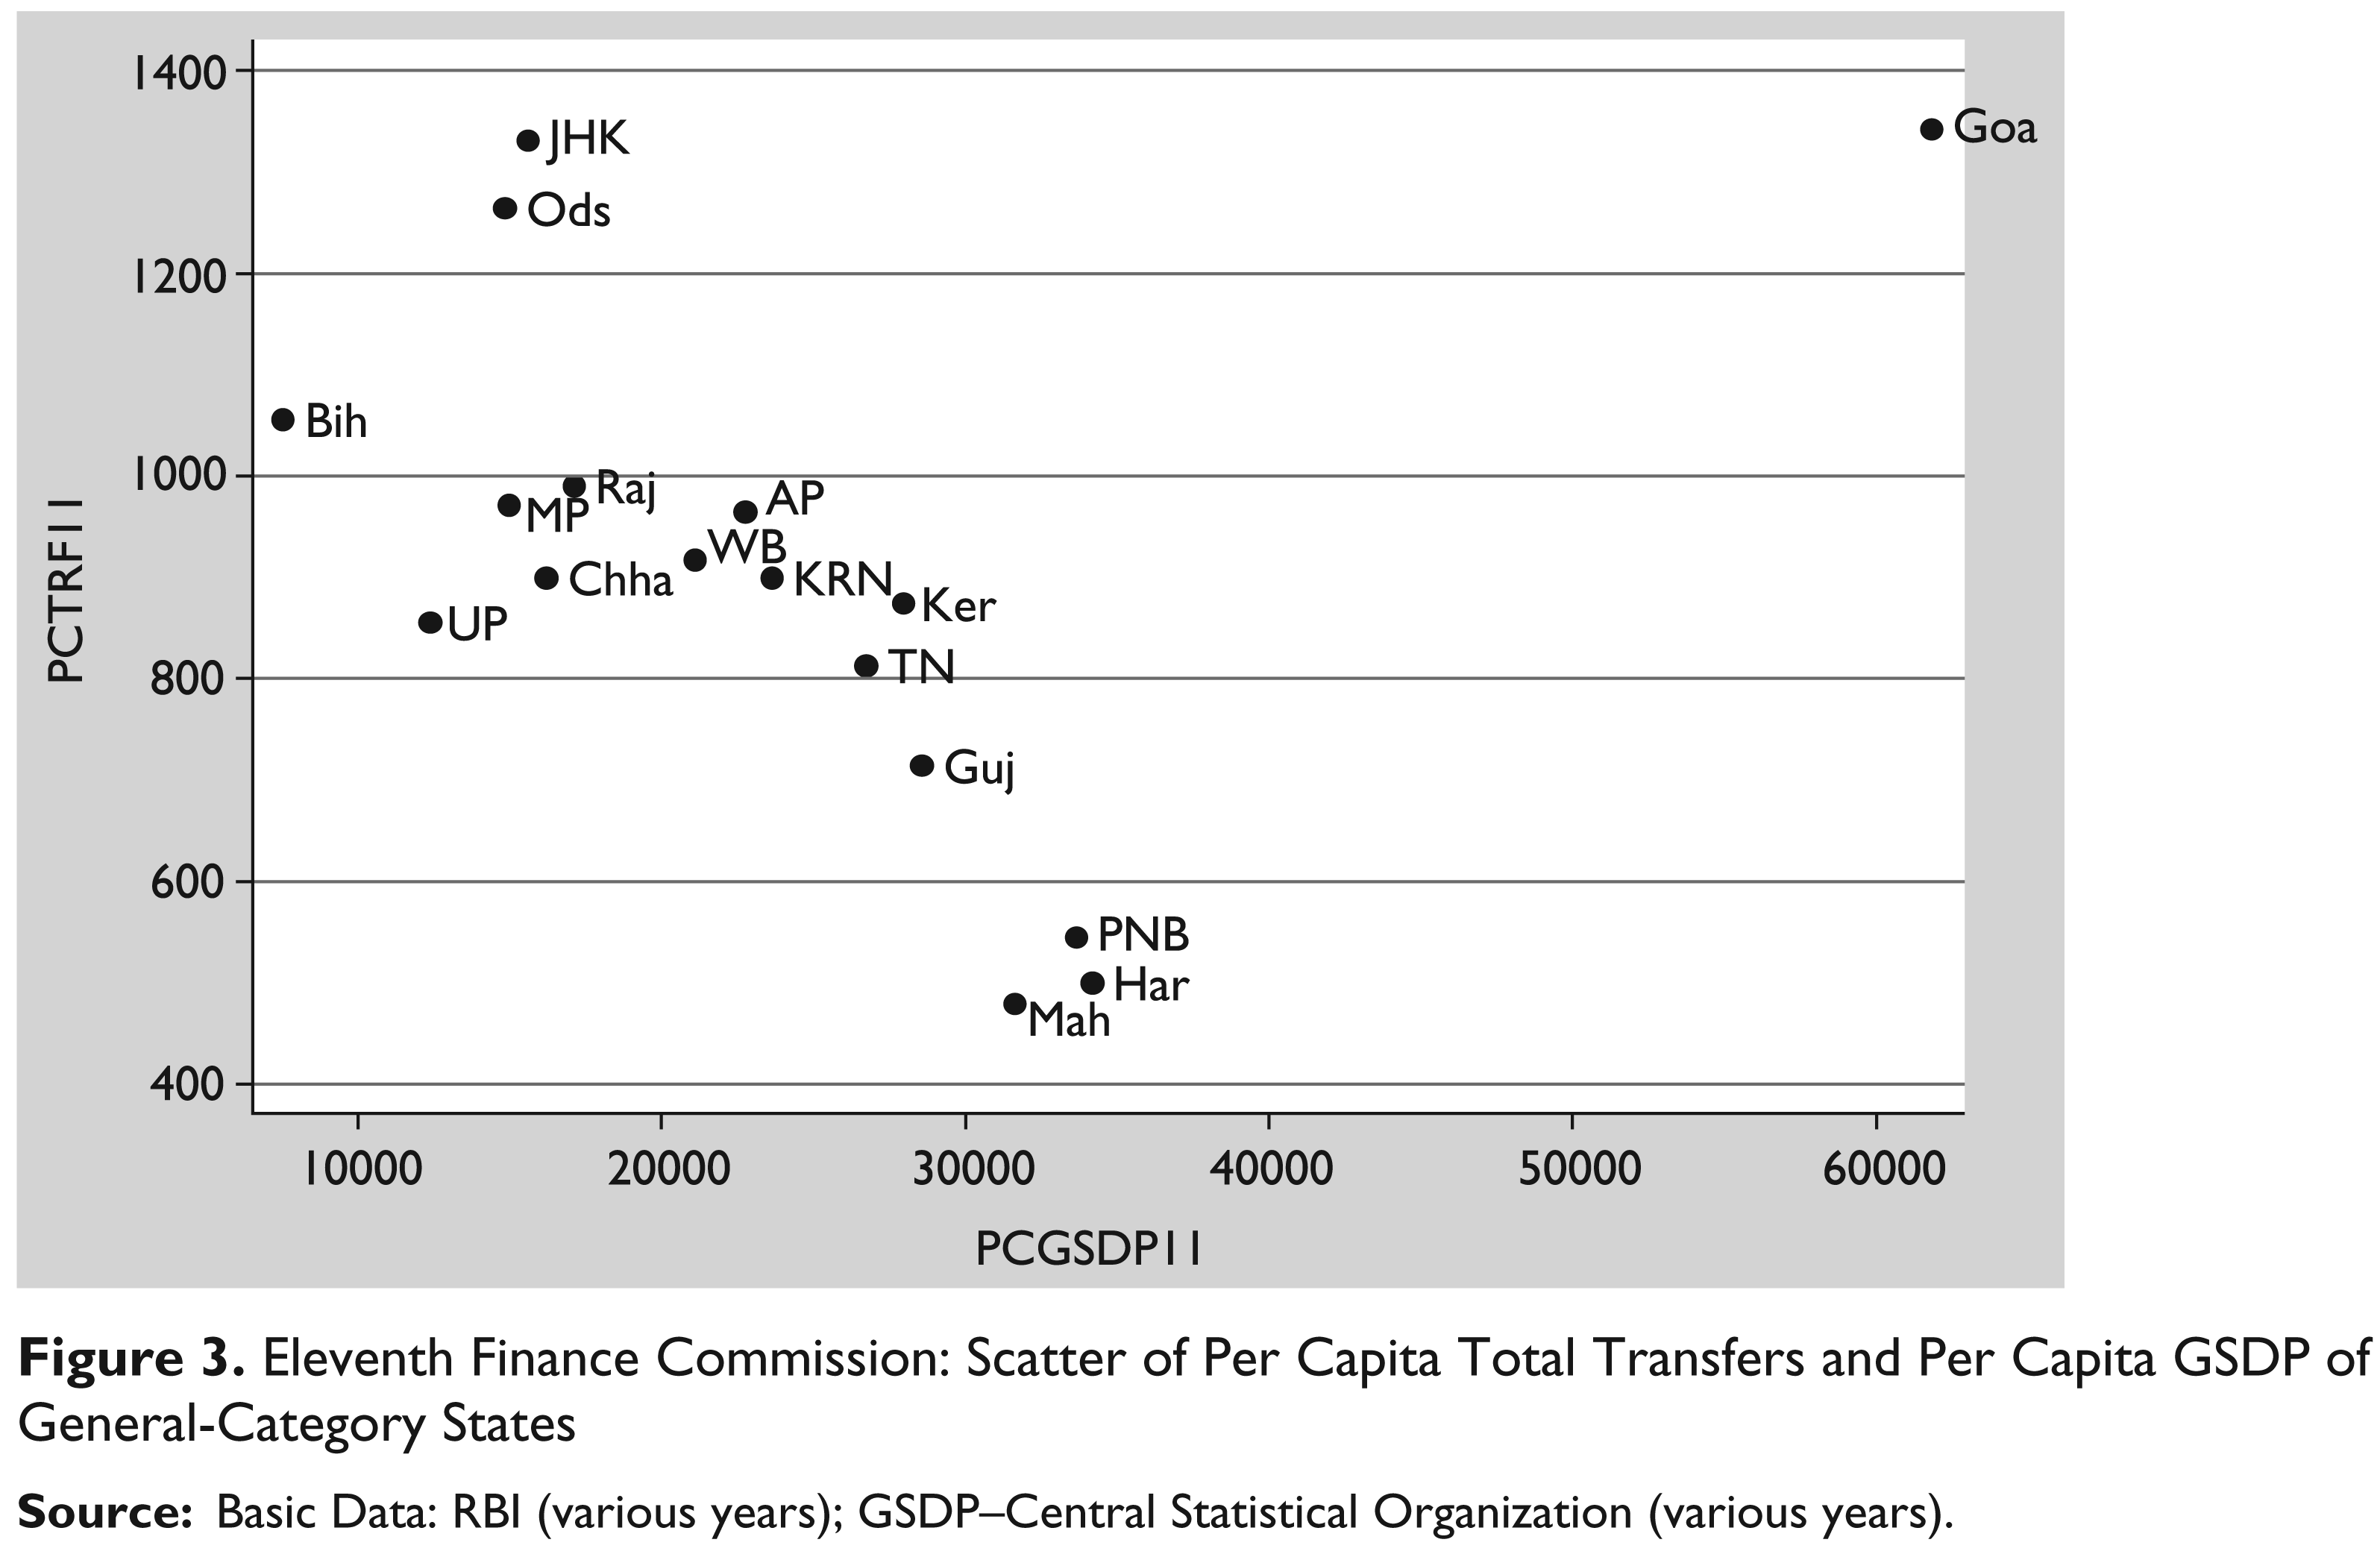
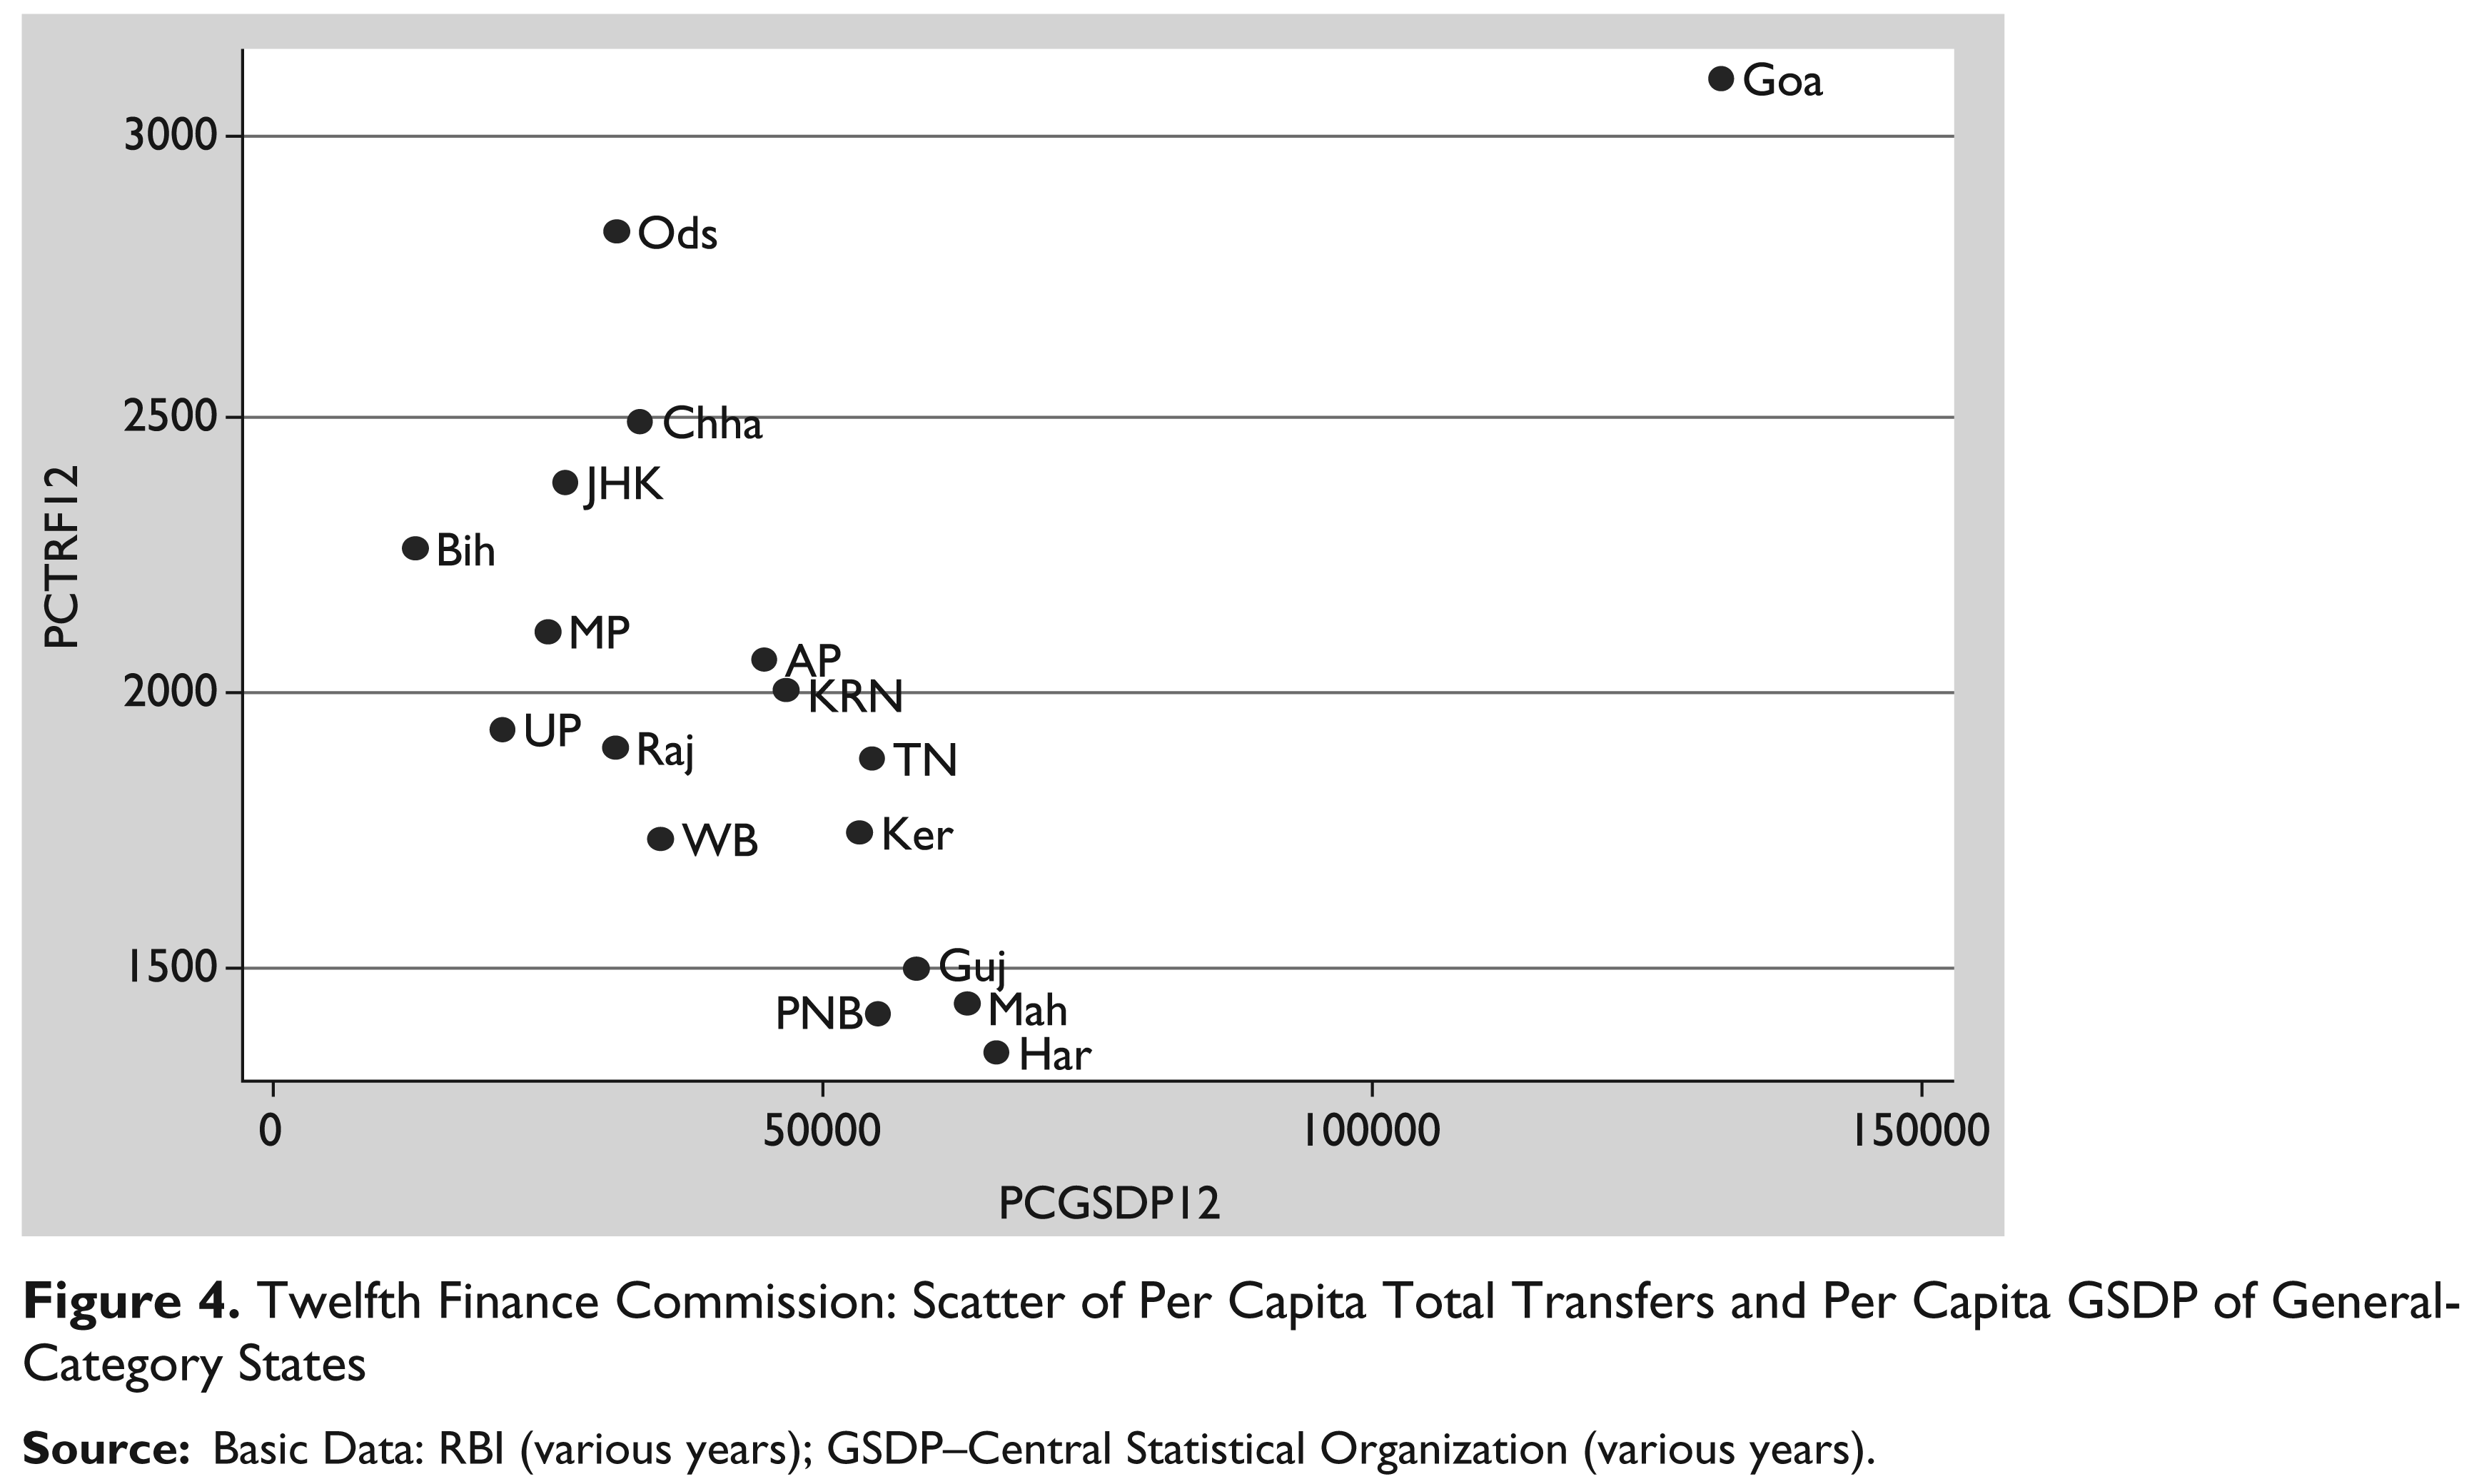
Similarly, for the Tenth FC (Figure 2), though the per capita income levels and transfers have risen for the states in general, it is observed that high income states are receiving less transfers as compared to the middle and low income states, while Goa is an outlier in all the Commission periods. This can be observed for the Eleventh FC (Figure 3) and the Twelfth FC (Figure 4). The per capita transfers over the Commission period has increased for the low income and middle income states.
In the case of special-category states the scatter between per capita total transfers and per capita gross domestic product shows the low income states like Manipur, Tripura and Assam receive less per capita transfers as compared to the better-off states (Figures 5–8).


Conclusions
In this article, we have looked at the pattern of dependence of the states on central transfers. This analysis is done with respect to the revenue receipts of the states. We have looked at the pattern of dependence both in terms of the aggregate account of the states (all states) and for individual states. This article developed a methodology to decompose the dependence of the states on total transfers from the centre. An index of dependence was formulated and total transfers consisting of four sources of funds that are qualitatively different are decomposed using the index of dependence. The decomposition is presented in two ways. The first decomposition shows the share in central taxes and total grants as two separate categories while in the second entitlement transfers and discretionary transfers are shown as two separate categories.
A state’s dependence on central taxes has changed over time for the general-category states categorized into high-, middle- and low-income states and special-category states into Group 1 and Group 2. The high-income general category states receive the lowest transfers relative to their revenue receipts. On average, Haryana is shown to be the least dependent state on central transfers, followed by Punjab, Maharashtra, Goa and Gujarat. Among the middle-income states, across states, the lowest dependence on Finance Commission transfers is that of Tamil Nadu and the highest, that of West Bengal. In the low-income states the dependence is far more as compared to the middle- and high-income groups. The dependence on central transfers among the low income states is highest in Bihar, followed by Orissa, Jharkhand, Uttar Pradesh, Madhya Pradesh and Rajasthan. Among the special-category states Group 1, dependence is higher than the general-category low-income states. The dependence is highest for Jammu and Kashmir, followed by Meghalaya, Himachal Pradesh and Sikkim. In the special-category states Group 2, the dependence is higher than Group1. Among Group 2, the dependence is highest for Nagaland, followed by Manipur, Mizoram, Arunachal Pradesh, Tripura and Assam.
These changes are partly due to the recommendation of the Finance Commission regarding the share that should be given to the states from Centre’s shareable portion of tax revenues as well as on changes in macro variables. Important among the macro variables are the ratio of the centre’s gross tax revenue and state’s own revenue receipts with respect to GDP.
State-wise decomposition shows how far the states rely on central transfers and grants for their revenues, alternatively the decomposition could be viewed in terms of entitlement and discretionary transfers. In general the decomposition shows that in high-income states the share of central transfers varied between 6 and 18 per cent, for middle-income between 15 and 34 per cent, for low-income states between 21 and 58 per cent, special-category Group 1 states between 6 and 33 per cent and Group 2 states between 8 and 37 per cent. On the other hand, total grants for high-income states varied from 4 to 18 per cent, for middle-income states from 7 to 20 per cent, low-income states from 13 to 26 per cent, special-category Group 1 states from 33 to 71 per cent and Group 2 states from 59 to 86 per cent. Alternative decomposition showed that entitlement transfers of high-income states ranged between 7 and 27 per cent, middle-income states between 15 and 37 per cent, low-income states between 23 and 58 per cent, Group 1 states between 26 and 51 per cent and Group 2 states between 28 and 77 per cent. Discretionary transfers fluctuated from 5–11 per cent for high-income states, 8–14 per cent for middle-income states, 10–23 per cent for low-income states, for Group 1 states 21–54 per cent and Group 2 states 28–77 per cent. This shows that discretionary transfers are important for the low-income and Group 1 and 2 states.
The scatter of per capita transfers and per capita incomes shows that the high-income states like Gujarat, Maharashtra, Punjab and Haryana are receiving less per capita transfers from the centre as compared to the middle-income and low-income states. However, low-income states like Manipur, Tripura and Assam receive less per capita transfers as compared to the better-off states.
In a scheme of transfers that aims to achieve a suitable degree of equalization, it is to be expected that the share of transfers in revenue receipts would in general be larger for the states that have relatively lower fiscal capacities. Any departures from this expected pattern would be due to higher than average tax effort on the part of some states (where the share of transfers in revenue receipts will be less-than-average) or due to some components of transfers that are not equalizing in nature.
Footnotes
Appendix
Composition of Central Transfers: All States
| Item | Share in Central Taxes (%) | Plan Transfers (%) | Statutory Transfers (%) | Others (%) | Total Central Transfers |
| 1990–1991 | 53.0 | 34.9 | 8.3 | 3.9 | 100.0 |
| 1991–1992 | 52.5 | 37.2 | 6.6 | 3.6 | 100.0 |
| 1992–1993 | 53.7 | 37.5 | 5.5 | 3.2 | 100.0 |
| 1993–1994 | 51.4 | 41.4 | 4.3 | 3.0 | 100.0 |
| 1994–1995 | 55.6 | 38.7 | 4.1 | 1.6 | 100.0 |
| 1995–1996 | 58.2 | 29.8 | 8.0 | 4.0 | 100.0 |
| 1996–1997 | 60.4 | 30.5 | 6.2 | 2.9 | 100.0 |
| 1997–1998 | 62.9 | 28.6 | 2.6 | 5.9 | 100.0 |
| 1998–1999 | 62.7 | 31.8 | 2.3 | 3.3 | 100.0 |
| 1999–2000 | 59.4 | 32.8 | 2.3 | 5.5 | 100.0 |
| 2000–2001 | 57.6 | 27.8 | 9.1 | 5.4 | 100.0 |
| 2001–2002 | 55.1 | 30.7 | 9.8 | 4.4 | 100.0 |
| 2002–2003 | 55.6 | 29.7 | 8.1 | 6.6 | 100.0 |
| 2003–2004 | 56.9 | 31.3 | 6.4 | 5.4 | 100.0 |
| 2004–2005 | 58.2 | 31.0 | 5.7 | 5.1 | 100.0 |
| 2005–2006 | 55.1 | 26.1 | 10.6 | 8.2 | 100.0 |
| 2006–2007 | 56.0 | 28.0 | 8.3 | 7.8 | 100.0 |
| 2007–2008 | 58.2 | 28.6 | 7.6 | 5.6 | 100.0 |
| 2008–2009 | 55.3 | 31.8 | 7.0 | 5.8 | 100.0 |
| 2009–2010 | 52.2 | 32.9 | 7.9 | 7.0 | 100.0 |
| 2010–2011 | 57.3 | 29.9 | 7.2 | 5.5 | 100.0 |