



Abstract
This exploratory study attempts to discover the impact of firm-specific characteristics on the shareholder value of the listed companies in India. Apart from this, it seeks to explore whether the significant firm attributes are common to both the dimensions of shareholder value, that is, accounting-based (economic value added (EVA)) as well as market-based dimensions (market value added (MVA) and Tobin’s Q). The data for this study consists of panel data of 100 companies in India covering the financial years from 1997–1998 to 2008–2009. Multiple regression analysis is employed to study the relationship. The study reveals that investors tend to reward the companies which have higher profitability, lower market risk, efficient resource management, high leverage, more liquidity, higher marketing expenditures and robust market capitalization. Evaluating shareholder value on the basis of accounting and market-based dimensions, the study identifies that the selected corporate attributes explain about 34 per cent of the variation in the accounting-based surrogate EVA, whereas they account for more than 55 per cent variation in the firm’s shareholder value when it is measured on the basis of market-based surrogates, MVA and Tobin’s Q. The primary limitations of this study are the size of its sample and non-inclusion of other variables (for example, market, environmental, regulatory, etc.) which may have an effect on the shareholder value. As maximizing shareholder value has become the widely accepted corporate objective the world over, its enhancement has become the key responsibility of corporate executives and managers.
Keywords
Introduction
Shareholder value creation has become the motto of most blue-chip companies since the late 1990s. The quest for long-term value creation has provided a common language to employees across all operating and staff functions and has directed all management decisions to be modelled, monitored, communicated and compensated towards the most fundamental objective, that is, to bring an improvement in the value addition to the shareholders investment. In a market-driven economy, there are a number of companies that create wealth whereas others certainly destroy it. As a result, corporate executives may seek to inquire about the fundamental factors that cause the difference between the best and the worst performing companies and ultimately derive the long-term sustainable shareholder value. Thus, the proposed study attempts to identify the significant firm-specific corporate attributes that can presumably have the considerable impact on the shareholder value creating capabilities of the selected Indian companies.
The study has been divided into six sections. The second section reviews the existing literature and develops research hypothesis. The third section gives a framework of analysis, while the fourth section describes the database and research methodology. The fifth section presents the empirical results and discussion. Finally, the sixth section summarizes the findings and points out limitations of the study.
Literature Review
Most of the studies dealing with shareholders’ value creation have focused on the comparison of traditional performance measures (like earnings, cash flow and productivity parameters, net present value, etc.) and value-based measures (like economic value added, economic value added as percentage of capital employed, etc.) The purpose of such an exercise was to identify the most significant performance measure that best explains the shareholder value (Biddle et al., 1997; Chen and Dodd, 1997; Fernandez, 2001; Kramer and Pushner, 1997; Malik, 2004; Medeiros, 2005; Misra and Kanwal, 2004; Ramana, 2004; Worthington and West, 2004).
The existing literature on the determinants of shareholder value creation is not well developed till date. The studies which tried to identify the value drivers, emphasized associate shareholder value with specific financial or strategic attributes only. For instance, Kakani (2001) studied the relationship between ownership distribution and shareholder value creation in Indian stock markets and identified that one should prefer those stocks in which owners and managers have a good management record and have invested more of their time and money and also hold a larger stake in the firm. Venkateshwarlu and Kumar (2004) empirically studied the relationship between non-market value performance indicators and market value, with a view to understand the value creation process in Indian enterprises. The study examined accounting profitability, cash flow and growth as the three non-market dimensions of shareholder performance and identified cash flow per share as an important determinant of market return of any firm.
Kaur and Narang (2010) examined the corporate attributes that can be associated with the Indian companies’ economic value added (EVA) disclosure choices. The study found that the EVA usage and disclosure choice of Indian companies is influenced by their size, profitability, leverage and sales efficiency.
Pandey (2006) empirically explored the significance of profitability and growth as drivers of shareholder value, measured by market-to-book value (M/B ratio). The study found that the economic profitability–growth interaction variable has a positive coefficient indicating that growth associated with economic profitability influences shareholder value positively. In addition, the study indicated negative relationship between M/B ratio and firm size whereas positive association of M/B ratio with business risk, financial risk and capital intensity.
There are studies such as Kakani et. al. 2001, which have attempted to study the determinants of an Indian firm’s financial performance across various dimensions like shareholder value, accounting profitability and its components, growth and risk of sample firms. The study identified age, leverage, market expenditure and international diversification as significant determinants of firm value studied across the shareholder value dimension.
Reviews of existing research on the subject reveals the need for a comprehensive study to explore the relationship between firm-specific attributes and their contribution to shareholder value. Thus, the present study has been conducted to meet the following specific objectives:
To what extent the firm-specific characteristics determine the shareholder value of Indian companies. Whether the significant firm-attributes are common to both the dimensions of shareholder value, that is, accounting based (EVA) as well as market-based (market value added (MVA) and Tobin’s Q).
For the purpose of this research, shareholder value creation has been taken as the dependent variable and a set of firm-specific characteristics as explanatory variables. The selection of the variables incorporated in the study was made on the basis of review of literature. A brief explanation of all these variables along with the research hypothesis has been given in the following section.
Framework of Analysis
Stern Stewart & Company, the New York-based consultancy firm, has created two concepts, that is, Economic Value Added (EVA) and Market Value Added (MVA) to assess the value addition capabilities of companies. While the EVA of a company is a historical figure based on the efficiency with which it used the resources at its disposal in a particular year (that is, wealth created in a year), its MVA is the market assessment of its ability to create wealth in the future (Stewart, 2000). Moreover, a number of researchers like Boasson and Boasson (2005), Kakani (2001) and Rashid (2008) argued Tobin’s Q Ratio to be the most appropriate measure of value creation. Hence, in the present study, three surrogates of shareholder value creation, that is, EVA, MVA and Tobin’s Q have been selected and studied as dependent variables. Among these, EVA is used as the accounting-based dimension whereas MVA and Tobin’s Q have been taken as the market-based dimensions of shareholder value. A brief explanation of each of the selected dependent variable is given below:
Economic Value Added
EVA has gained wide acceptance, in both the investment community and corporate boardrooms, as a measure that links managerial decisions to shareholder value creation (Ramezani et. al. 2002). Stewart (2000) defined EVA to be an estimate of true economic profitability and the performance measure that is most directly linked to the creation of shareholder value overtime value creation), or discount under (shareholder value dilution), the capital invested. In this study, EVA has been taken as a dependent variable representing the shareholder value created or eroded by a company.
Market Value Added
MVA is a significant overall summary assessment of corporate performance, one that shows how successful a company has been in allocating, managing and redeploying scarce resources to maximize the net present value of the enterprise and the wealth of its shareholder (Stewart, 1994). The financial advisory also argue that the real measure of a company’s long term ability to add shareholder value is MVA as it depicts the confidence of the capital market on the company’s performance (Dubey, 2000). MVA being the absolute measure of shareholder value creation is obtained as the difference between the company’s market value of invested capital and its economic capital. A positive MVA indicates that the company is building value for its shareholders whereas a negative MVA signals dilution of shareholder value. Therefore, the above discussion leads to the selection of MVA as the market-based surrogate of shareholder value creation.
Tobin’s Q Ratio
This ratio was developed by James Tobin of Yale University, Nobel Laureate in Economics, who hypothesized that the combined market value of all the companies on the stock market should be about equal to their replacement costs. The Q ratio is calculated as the market value of a firm’s assets divided by the replacement value of the firm’s assets (Tobin, 1969).
Boasson and Boasson (2005) explain that if the market value reflects solely the recorded assets of a company, Tobin’s Q would be one. If Tobin’s Q is greater than one, then the market value is greater than the value of the company’s recorded assets. This suggests that the market value reflects some unmeasured or unrecorded assets of the company. On the other hand, if Tobin’s Q is less than 1, the market value is less than the recorded value of the assets of the company. This suggests that the market may be undervaluing the company.
Due to the data limitations, a substitute measure of Tobin’s Q ratio is used for the present study. It is calculated by first adding the market value of equity, book value of preferred stock and book value of debt and then dividing the sum with book value of assets.
Various firm-specific attributes and the rationale of their inclusion as a possible determinant of firm’s value creation are discussed below:
Age
Sorensen et al. (1999) argued that organizational inertia operating in old firms tend to make them inflexible and unable to appreciate changes in the environment. Newer and smaller firms, as a result, take away market share in spite of disadvantages like lack of capital, brand names and corporate reputation with older firms. Kakani and Kaul (2002) found that older firms are unable to react quickly to the recessionary phase while the younger companies are a lot more agile and open to the opportunities that come with the opening up of the sector that helps them to adapt changing trends and customer preferences. Raman and Dangwal (2003) also identified that the continuous use of outdated management and marketing practices along with the obsolete technology used by older firms are the main causes of their lesser growth. On the contrary, Malhotra and Singh (2007) stated that the age of a company may be considered as a crude proxy for both, accumulation of experience as well as reduction in the perceived risks. An older firm may have significant market share due to the long-established clientele, customers’ loyalty and business linkages with various factors of production and distribution.
Size
Size is expected to be an important determinant of firm’s performance that positively contributes to its shareholder value. Capital market imperfections give a number of advantages to larger firms in securing finance and enjoying economies of scale in almost all the fields like management, production, marketing and distribution. These advantages help the larger firms to have stronger competitive capabilities, superior access to the organizational resources and increased market power than smaller ones to achieve their goals. Moreover, the economies of scale in product and financing market further assist the larger firms to reduce their cost of production thereby increasing return on capital and hence shareholder value. Boubakar et al. (2008) identified that the impact of size factor on value creation is negative for small sized firms (−36.9 per cent) and positive for large sized firms (16.6 per cent). The phenomenon can be explained by the resource constraints and financing problems of small firms. Kakani et al. (2001) empirically tested that an increase in the size of a firm, apart from increasing its profit margin and its profitability, also reduced its risk. All these factors led to an increase in the firm’s shareholder value. Hence the foregoing discussion justifies the acceptance of size as an independent variable in the study having a positive impact on its shareholder value. For the purpose of the study, size has been measured by three broad measures namely assets, sales and market capitalization, each representing a different view of a firm’s ability to expand.
Profitability
Profitability of a company has been recognized as a driver of corporate growth and value creation by many researchers. Varaiya et al. (1987) found that both profitability and growth influence shareholder value, but profitability has a greater impact. Kakani et al. (2001) also found that a higher profit margin implies that the firm enjoys significant market power and hence can reap what economists call ‘producers surplus’ or ‘rents’. Moreover, Glenning and Goth (2007) revealed that the most striking differentiating factor of top-quartile companies’ performance in terms of total shareholder return (TSR) has been their ability to grow revenues strongly. Hence, to gauge the firms’ efficiency of converting its assets, investments, capital, sales and equity into value for shareholders, the present study uses five measures of profitability, that is, return on total assets (ROTA), return on investments (ROI), return on capital employed (ROCE), profit margin and return on equity (ROE). A higher ratio of these measures reflects a firm’s capability to generate more earnings resulting in a higher spread and improved shareholder value.
Risk
Pandey (2006) empirically found that economic profitability has a positive correlation with growth, size and capital intensity; it has a negative correlation with beta and leverage (two determinants of a firm’s risk). On the other hand, since the market value of a firm is a function of its return, given the level of risk (cited from Fruhan, 1979 and quoted in Kakani et al., 2001), risk of a firm becomes an important determinant of its valuation and hence of its shareholder value.
Systematic Risk
Market risk/systematic risk of the firm denoted with beta measures is the sensitivity of a firm’s share price in relation to the market index. Pitman et al. (2006) explain that one outcome of lower volatility is that it leads equity investors to require a lower risk premium. This translates into a lower cost of capital, which in turn improves the conditions for wealth creation. Hence, it can be interpreted as higher the market risk (beta), more will be the shareholders’ expected returns, resulting in a higher cost of equity and reduced shareholder value.
Unsystematic Risk
Leverage has been taken as a proxy of unsystematic risk. It is used to establish a negative relationship between shareholder value and the higher proportion of debt component in the capital structure of Indian companies. Kakani and Kaul (2002) explained that higher leverage or poor solvency position reduces a firm’s financial flexibility, apart from increasing its financial and bankruptcy risk. It implies that a higher debt component in the capital structure puts extra pressure of fixed interest burden on the firms. Kakani et al. (2001) stated that the capital structure of a firm also affects its governance, to the extent that debt-holders become important stakeholders of a firm with higher leverage. Hence, the positive effects of higher debt financing depend on the ability of debt-holders to monitor the activities of management. In an institutional context, where this does not take place, the negative effects of higher leverage would prevail. Hence, in the present study beta and leverage have been taken as the proxies for the firm’s systematic and unsystematic risks respectively.
Efficient Resource Management (ERM)
The efficiency, with which a firm manages and utilizes its resources, is another factor affecting the value generation ability of a firm. The impact of ERM on shareholder value of a firm can be judged on the basis of four broad measures namely assets turnover ratio (ATR), working capital turnover ratio (WTR), inventory turnover ratio (ITR) and capital turnover ratio (CTR). ATR measures the company’s ability to generate sales revenue in relation to the size of the asset investment. If the assets do not create a sufficient amount of sales, these are not used effectively and this fact can have an unfavourable impact on the amount of operating profitability and on the shareholder value. At the same time, unutilized or underutilized assets increase the requirement of costly financing for additional expenditure on their maintenance and upkeep that again effects the shareholder value adversely. Thus, higher ATR implies more sales with same level of assets resulting in higher profitability and improved shareholder value. Kakani et al. (2001) stated that WTR, a measure of the solvency position of a business group is basically an expression of how much, in liquid assets, the firm currently has to build its business, fund its growth and produce value. Kishore (2002, p. 172) explains that by optimizing the investment in current assets and by reducing the level of current liabilities, the company can reduce the locking up of funds in working capital thereby, it can improve the return on capital employed in the business and hence its shareholder value.
The goal of shareholder’s wealth maximization is related to ITR that shows the efficiency with which inventory is managed and how rapidly the inventory is turning into receivables through sales. A low inventory turnover signals the excessive inventory levels than warranted by production and sales activities resulting in unnecessary tie up of funds, reduced profits and increased costs (Pandey, 1997). On the contrary, a high inventory turnover may be due to the replenishments of inventory in too small lots that further results in higher ordering costs and it may also signal that firm carries low levels of inventory that may result in frequent stock outs. But if the higher inventory turnover indicates that stocks are sold more frequently it means lesser amount of money is required to finance the inventory. Hence, ITR influences the liquidity position and operating efficiency of a firm and hence its shareholder value. Further, CTR conveys the firm’s efficiency in utilization of capital employed to generate revenues for its shareholders.
Liquidity
Pandey (1997) explains that
a liquid firm has less risk of insolvency i.e. it hardly experience a cash shortage or stock-outs. However, there is a cost associated with maintaining a sound liquidity position as a considerable amount of firm’s funds will be tied up in current assets, and to the extent this investment is idle, the firm’s profitability will suffer.
Hence the firm’s liquidity position involves risk–return implications where a firm either accepts higher risk (of low liquidity) and higher return or accepts lower risk and lower profitability. Pitman et al. (2006) identified that liquidity in the market makes the regulatory authorities able to perform their function of monitoring the firms and can improve its value. Based upon the above discussion the study considers liquidity as an important determinant of firm’s shareholder value.
Marketing Expenditure
Higher expenditure on marketing and advertising helps firms in building their reputation and also acts as an entry deterrent for new entrants in the industry (Pant and Pattanayak, 2007). Such expenditure helps to create awareness regarding products and services offered by the company and help to build the customer loyalty. Marketing expenses in building brands can also help firms to get over difficult years and protect their market share and sales volume, and defy industry trends (Mathur et al., 1998 and quoted in Kakani et al., 2001). Thus, marketing expenditure can be hypothesized to have a positive influence on the shareholder value.
Research and Development Expenditure
Research and development expenditure is expected to be a substantial determinant of corporate growth and shareholder value generation. Higher spending in R&D leads to a higher shareholder value which suggests that high R&D firms are innovative and profitable (Pant and Pattanayak, 2007). Glenning and Goth (2007) suggested that companies need to meld innovations and creativity to drive growth and value creation in the long run. A successful R&D initiative allows a firm to go for new product development, improved methods and technological upgradation which leads to a secure market share as well as high economic profitability that ultimately generates more shareholder value. Hence the study perceives the positive impact of Research and Development expenditure on shareholder value creation.
Methodology
The present study deals with the decisive question of ‘What Drives Shareholder Value in the Indian Corporate Sector’. This section explains in detail data source, sample frame and the empirical model developed in the study.
Data Source and Sample Frame
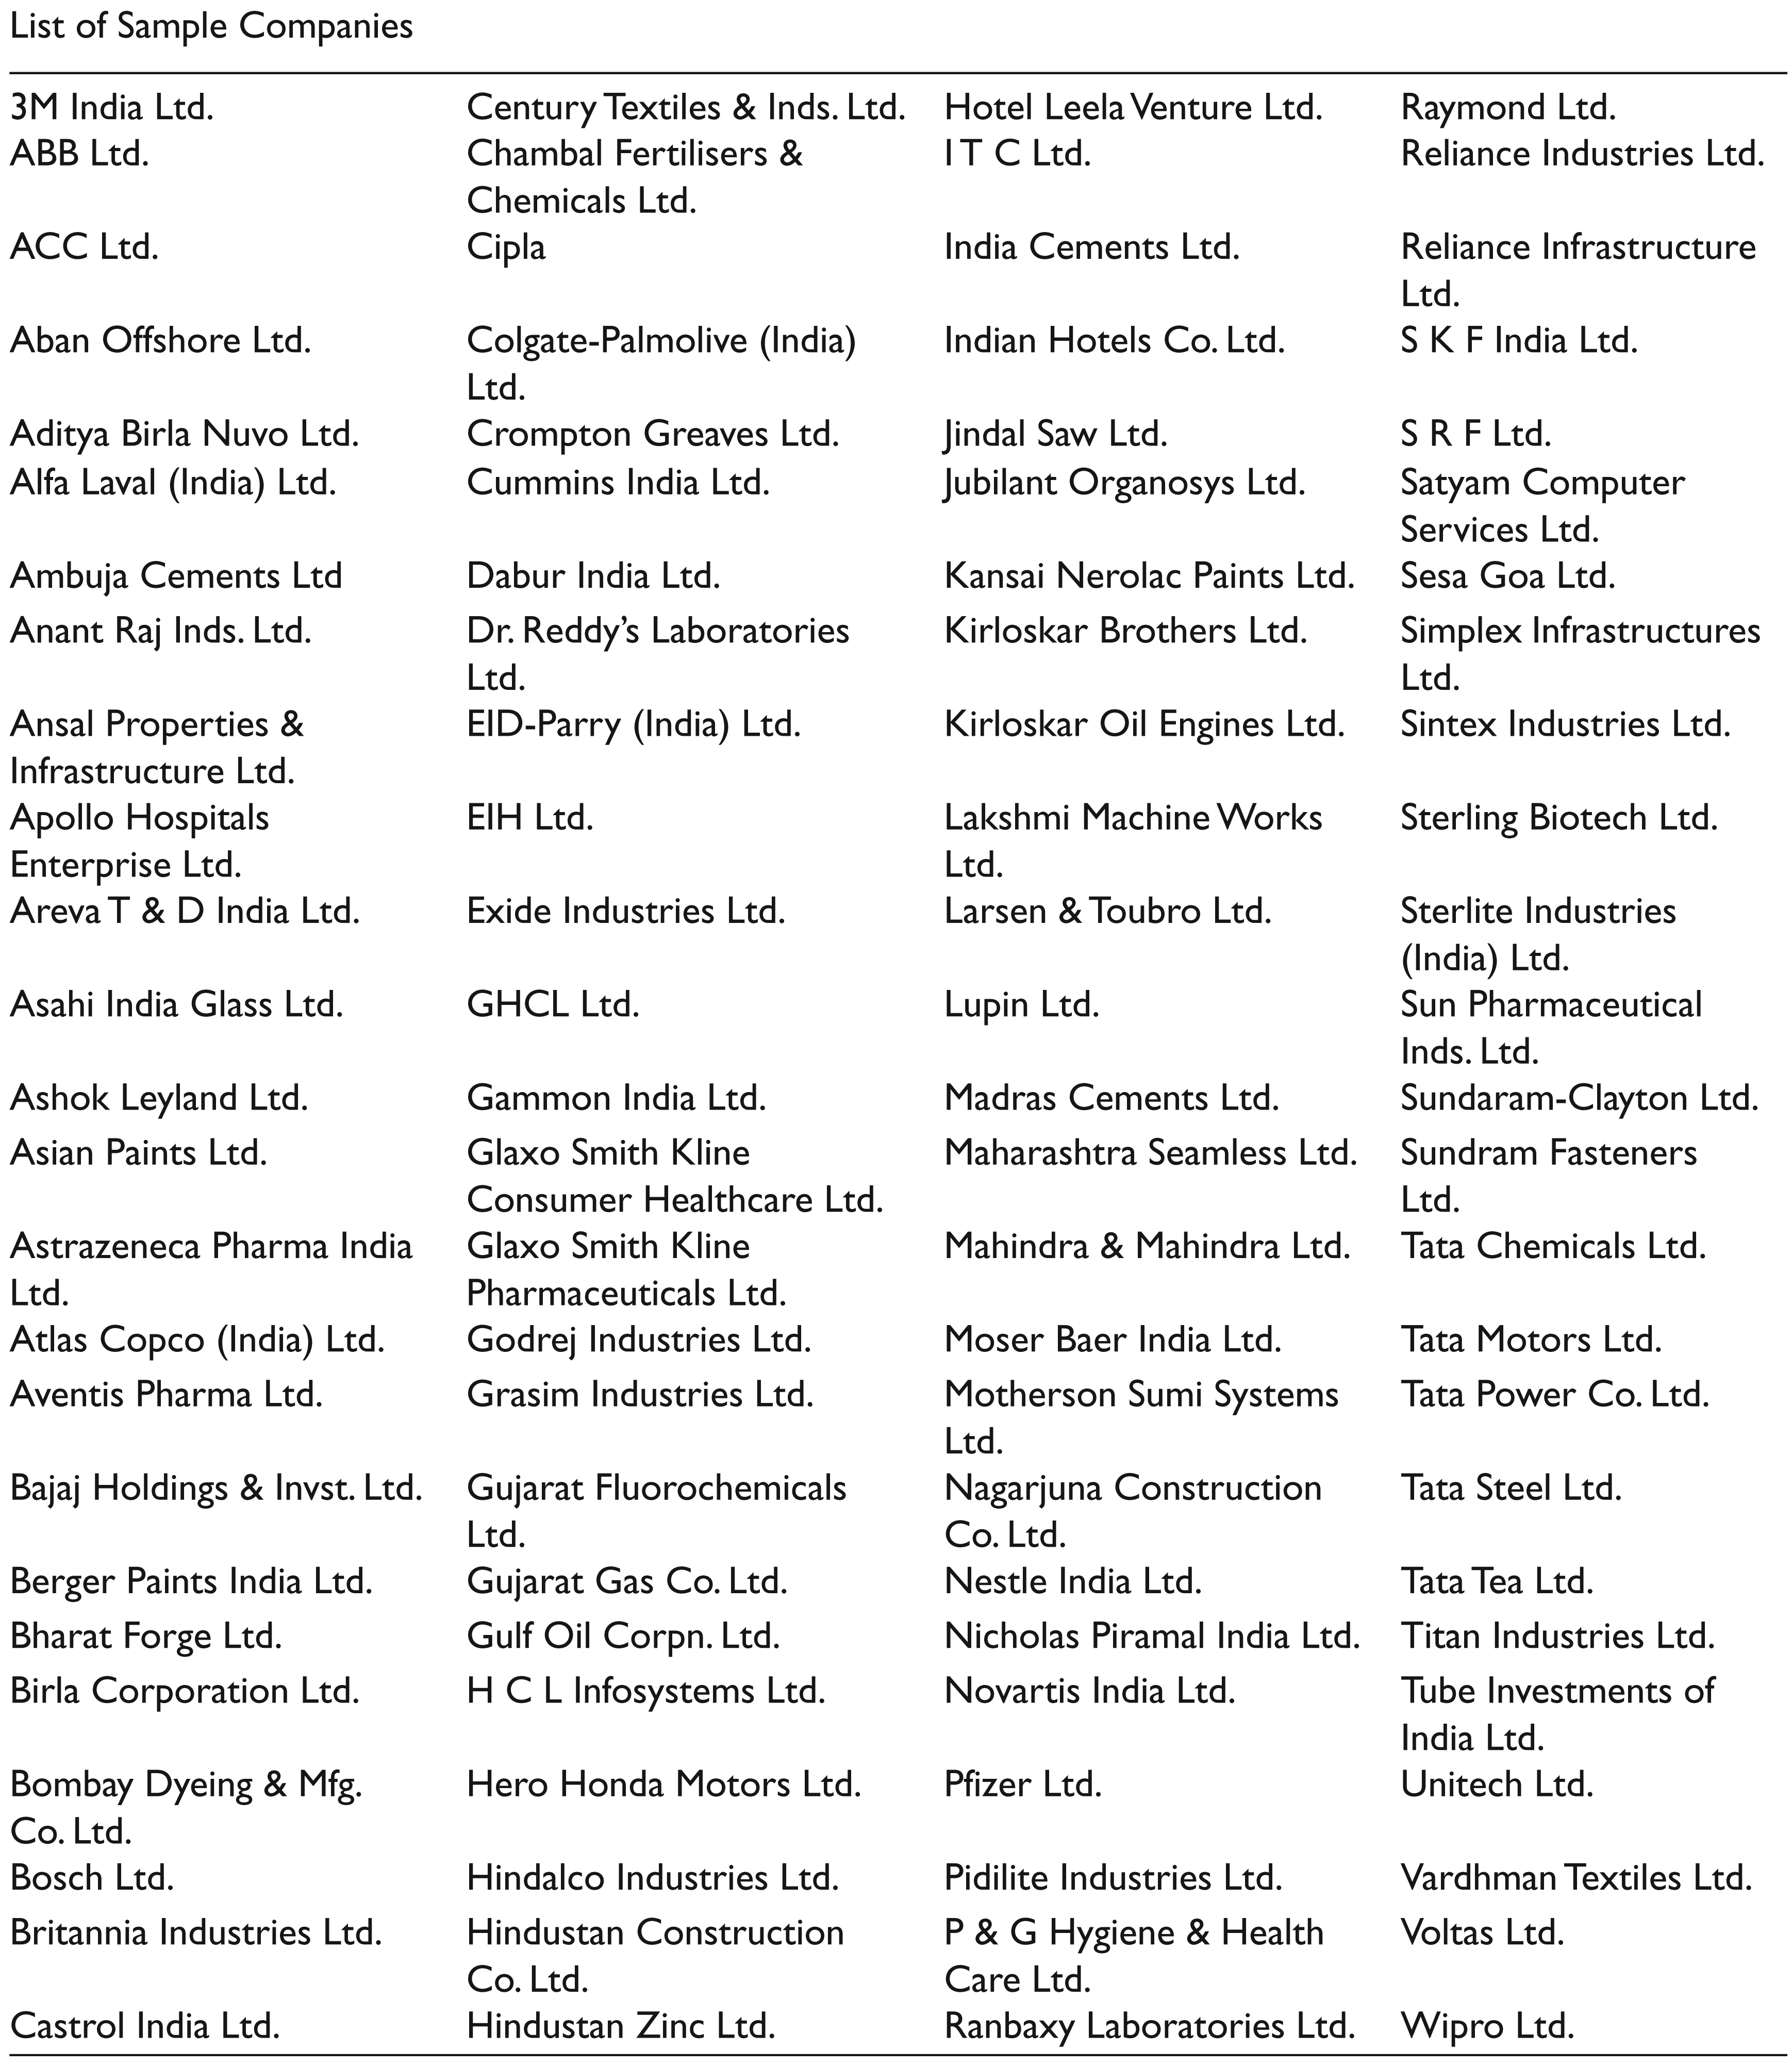
For the underlying objectives of the research work, initially a sample of the top 200 companies has been selected from BT-500, India’s most valuable companies. The rationale behind selecting BT-500 (year 2006 rankings) as that sample base is that, these companies are ranked on the basis of market capitalization in the Indian securities market and hence can be projected as India’s largest and best-performing companies (Business Today, 2006). At first, out of 200 companies, banks, financial institutions and NBFCs are excluded to prevent distortions in the comparisons. Second, companies for which complete financial information is not available have been excluded. Further, companies which are identified as outliers have also been excluded from the list resulting in a final sample of 100 companies. To avoid factors like temporal stability and business cycles influencing the study, a longer time frame of 12 years has been used. Thus, the data for this study consists of panel data of 100 companies in India covering the financial years from 1997–1998 to 2008–2009 (the list of sample companies is provided in the Appendix). The study applies multiple regression analysis for which the relevant financial data has been sourced primarily from the CMIE’s corporate database Prowess. The capital market data regarding share prices has been obtained from the Capitacharts of Capital Market Publishers of India, Ltd.
Statistical Diagnostic
Before proceeding to the regression analysis, various assumptions underlying multivariate analysis were tested. To assess the ‘normality’ of the variables employed in the regression analysis, the study applied visual analysis (that is, derivation of the probability plots), descriptive statistics (skewness and kurtosis) as well as the statistical test for normality, that is, the Kolmogorov–Smirnov test. The variables that exhibit a statistically significant departure from normality were diagnosed through data transformations by taking either log or square root of the respective variables. Testing for normality and possible remedies adopted in the study are given in Table 1.
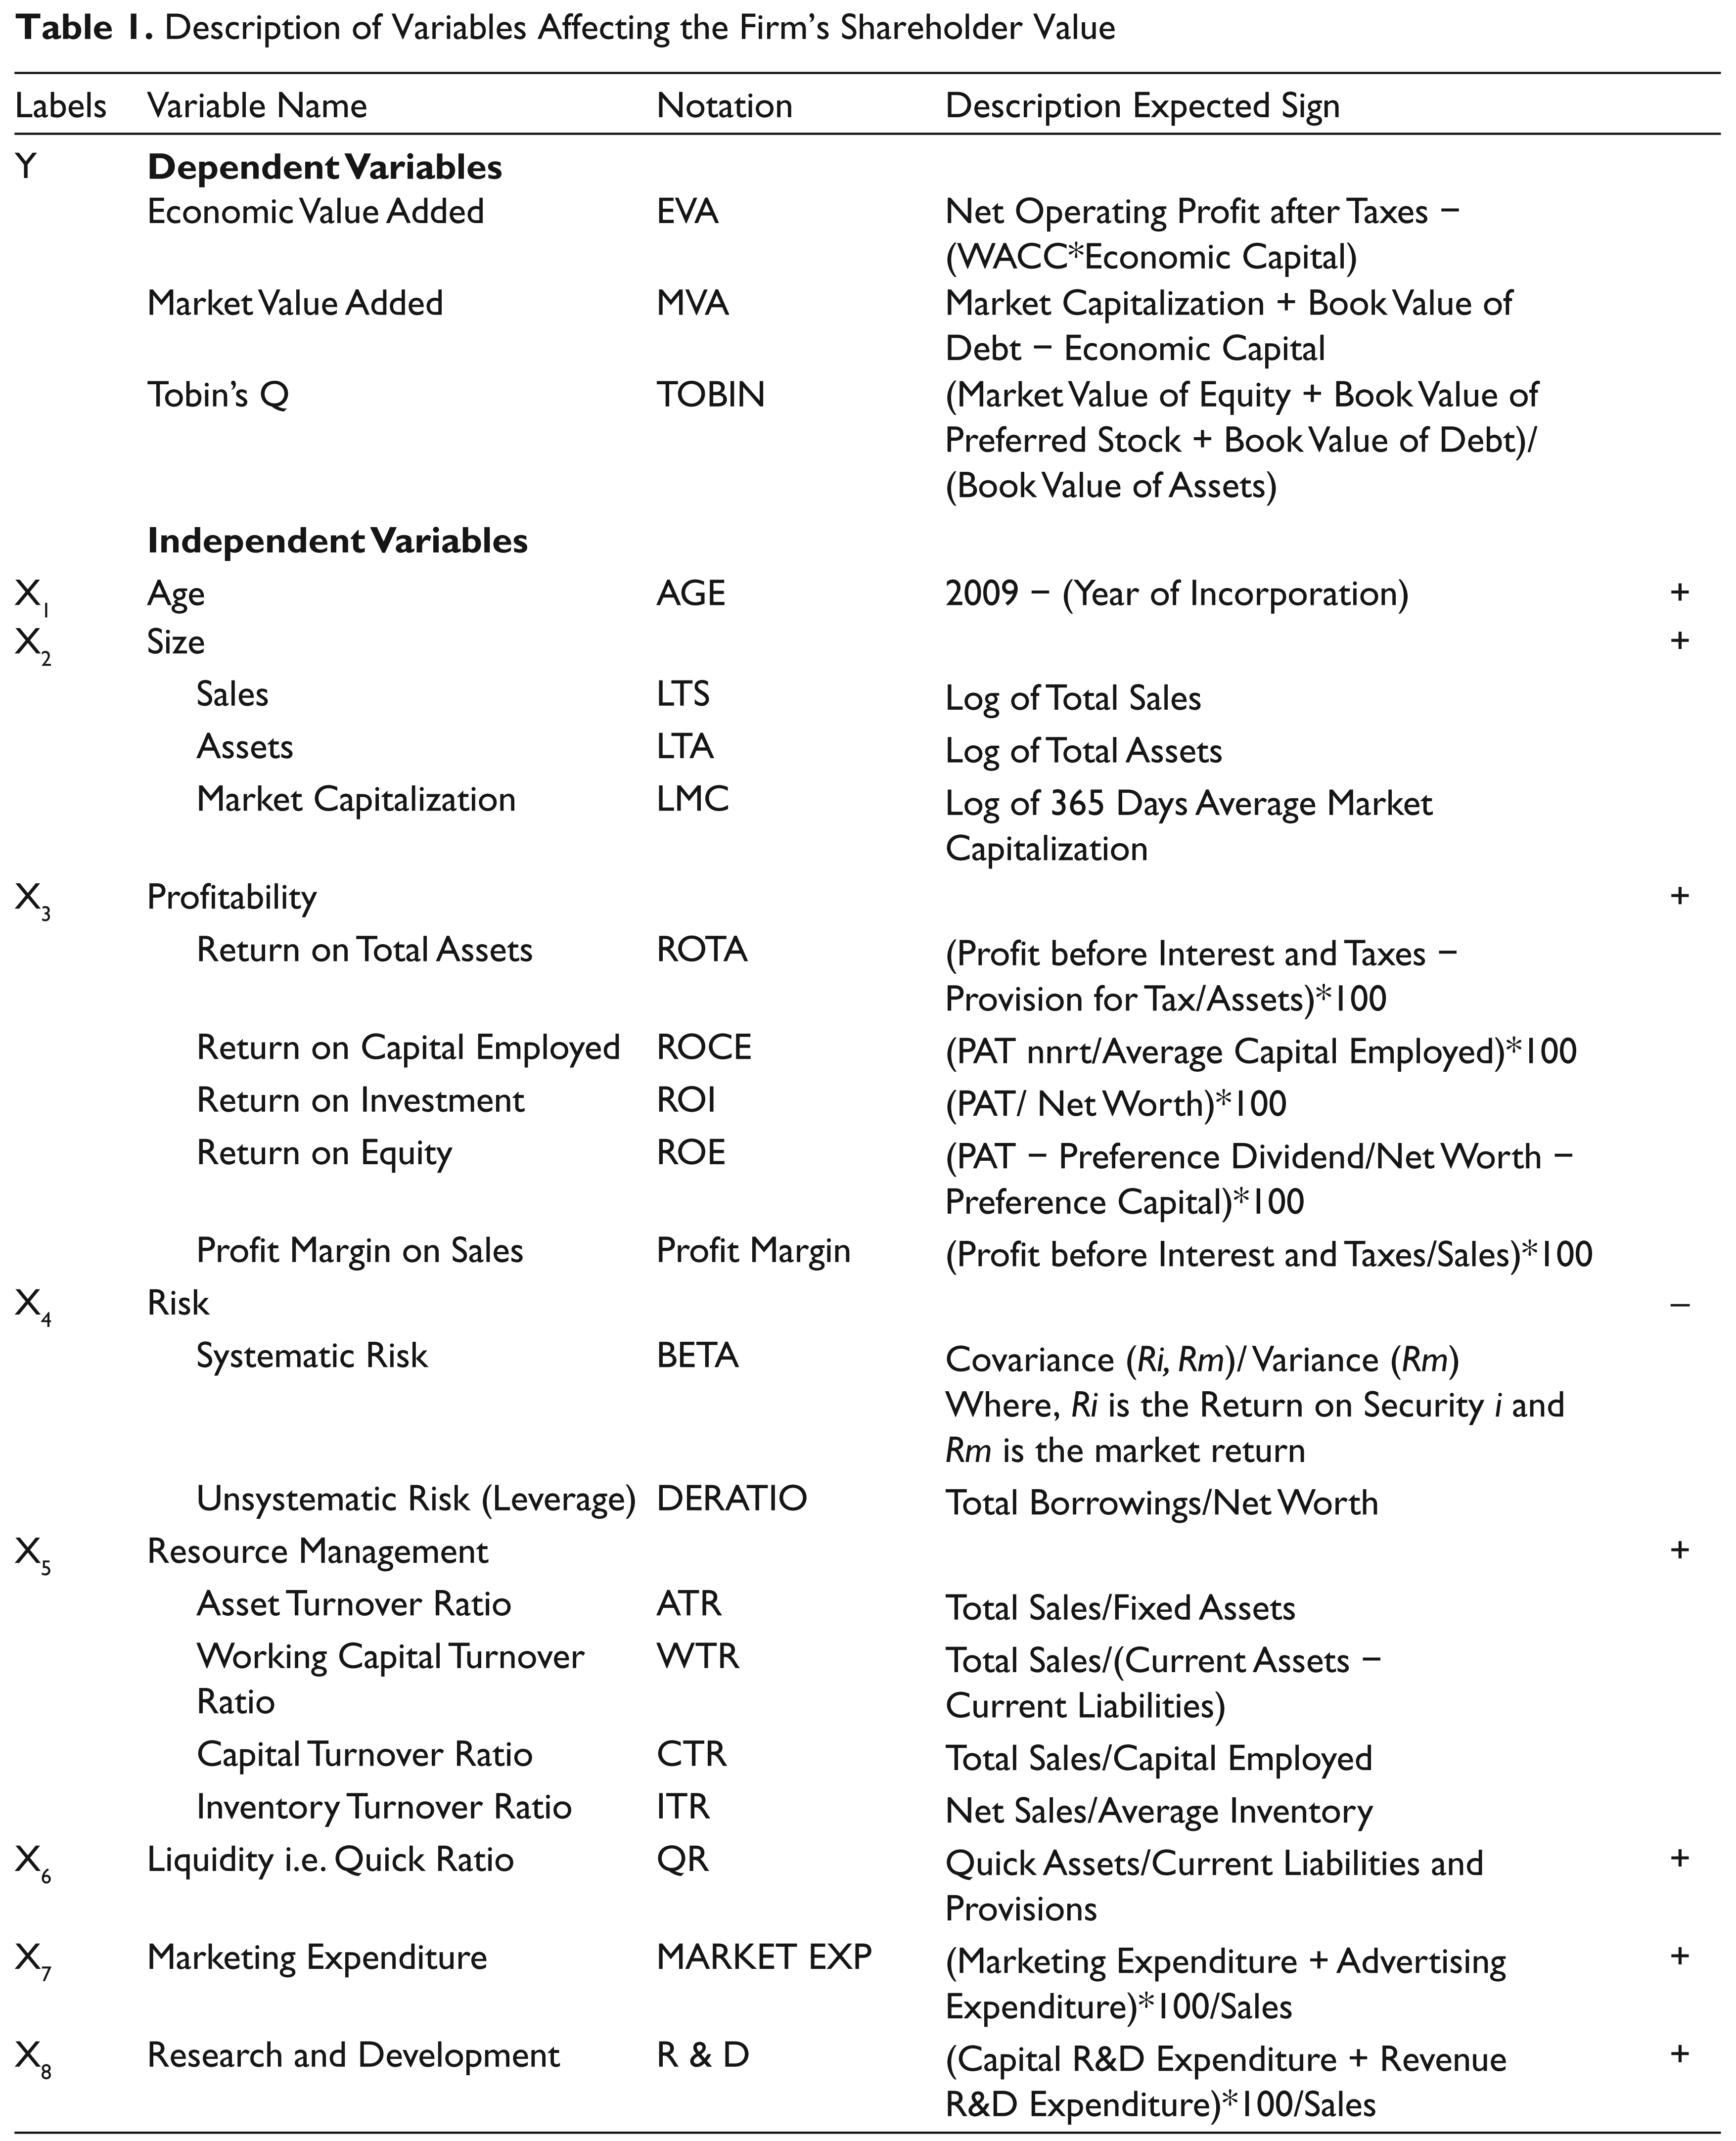
Description of Variables Affecting the Firm’s Shareholder Value
Pearson’s correlation coefficient matrix and the average variance inflating factor (VIF) were calculated to detect and solve the existence of ‘multicollinearity’ among the independent variables (Field, 2000).
The White procedure was applied to ensure that coefficients are not ‘heteroscedastic’. Further, the study also calculates Durbin–Watson statistics to check the assumption of independent errors (‘auto-correlation’). For the purpose of the study, the backward elimination method of the stepwise regression technique was employed (Gujrati, 2004).
Empirical Model
To assess the predictive power of a set of corporate attributes on the shareholder value of a company, the study uses the tool multivariate regression analysis. The explanatory variables used in the study are firm-specific characteristics as described in Table 2. For the statistical analysis, all the variables have been taken as an average of 12 years, that is, from 1998 to 2009. A firm’s shareholder value creation has been thus taken as a function of various firm-specific characteristics like age, size, profitability, risk, etc., as shown below:
Shareholder Value Creation = f {Age, Size, Profitability, Risk, Resource Management, Liquidity, Marketing Expenditure and Research & Development Expenditure}, that is,
where, Y is the shareholder value i.e. (EVA/MVA/Tobin’s Q)
X1, X2, X3..............X8are the various firm-specific attributes (as defined in Table 2) β1, β2, β3................β8are coefficients of independent variables that are to be estimated a is the constant i.e. Value of Y when b of all independent variables is zero n is the error term which is used as a surrogate for all those variables that are omitted from the model but affect the dependent variable collectively.
Notations and formulas used for the variables and the expected relationships of explanatory variables with dependent variable (shareholder value) are presented in Table 2.
Analysis
This section presents the results of the stepwise regression analysis based upon the three dimensions of shareholder value creation, that is, EVA, MVA and Tobin’s Q. We begin by discussing the results of regression analysis with EVA as the dependent variable and then move on to regressions with MVA and Tobin’s Q as the dependent variables respectively. In each case, explanatory variables representing corporate attributes remain the same. As discussed earlier, the study uses three separate measures of firm size (that is, assets, sales turnover and market capitalization), five measures of a firm’s profitability (that is, ROI, ROE, profit margin, ROCE and ROTA), four variables representing a firm’s resource management (that is, ATR, CTR, ITR and WTR) and two measures of risk (that is, beta and leverage). Hence, Pearson’s correlation matrix was at first formed and evidenced high degrees of correlation among various independent variables selected to represent one corporate attribute, that is, among five profitability measures as well as among size surrogates, etc., causing the problem of multicollinearity. After examining the partial correlations, the variables which were not informative were excluded. Hence, only one surrogate of each independent corporate attribute has been taken in one model resulting in the 60 regression models (with different combinations) for each dimension of shareholder value creation. In the present study, the results of the best model in each case, that is, EVA, MVA and Tobin’s Q have been presented and discussed.
Testing for Normality and Possible Remedies Adopted
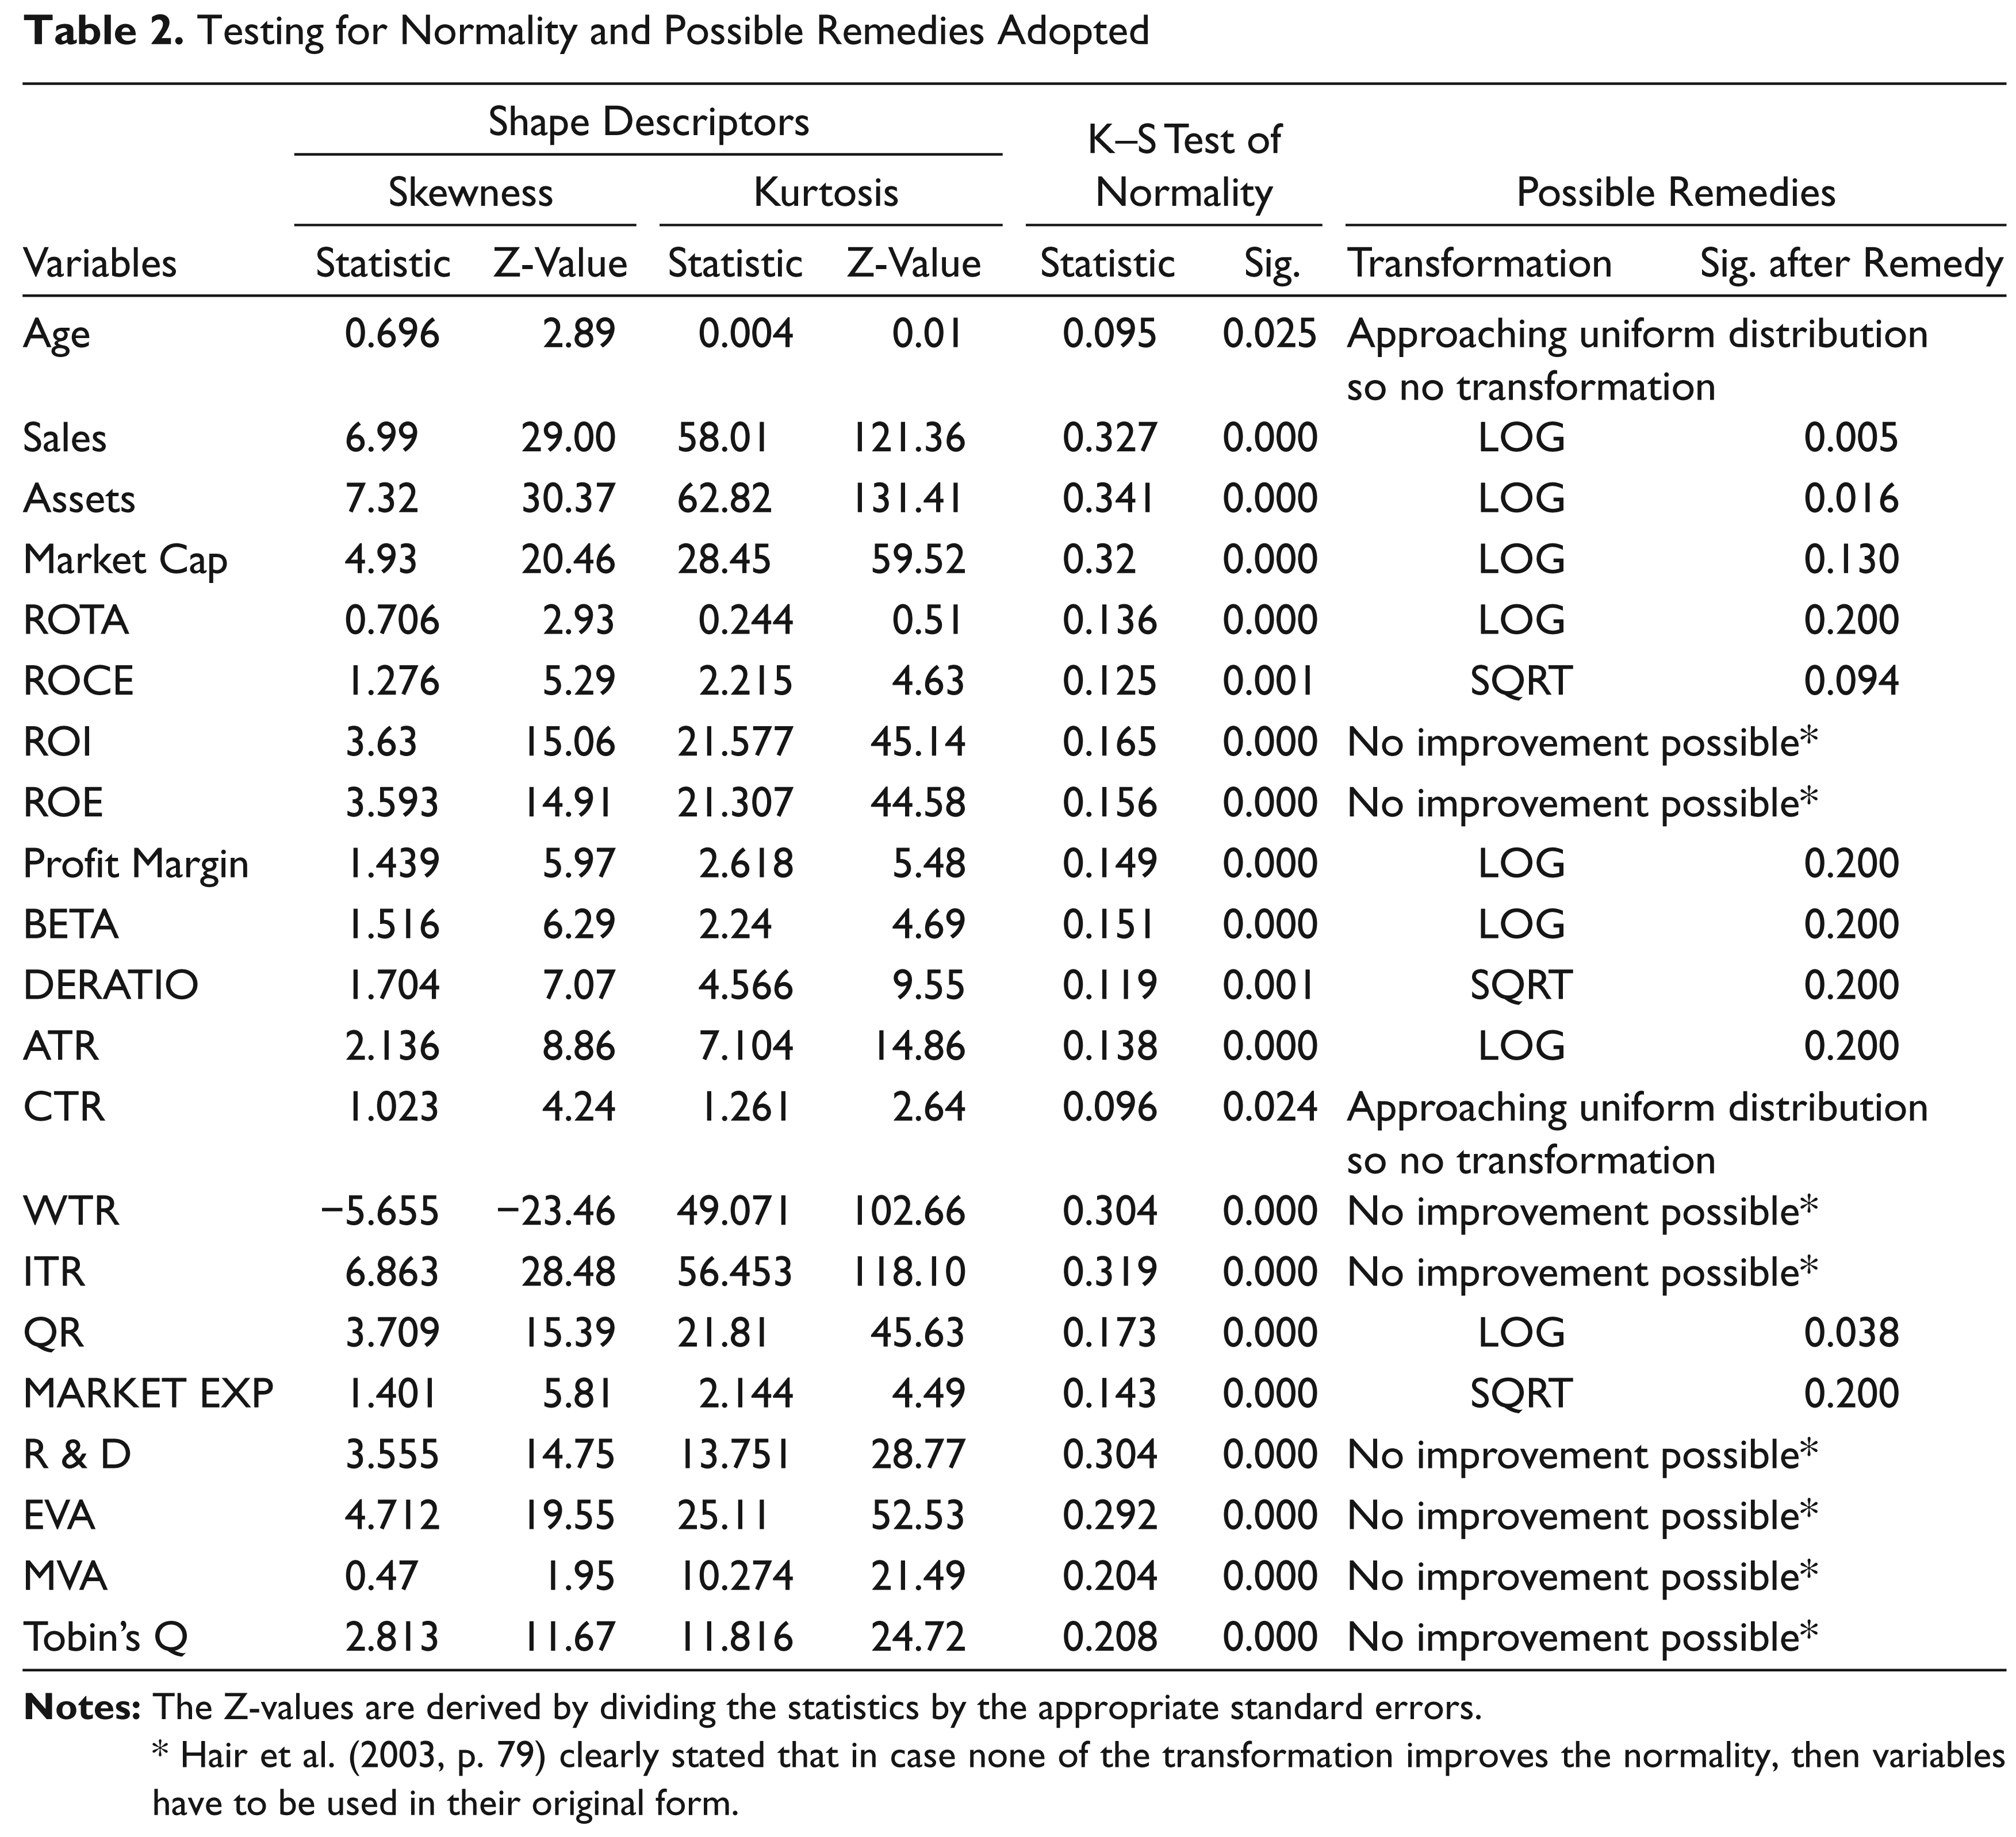
* Hair et al. (2003, p. 79) clearly stated that in case none of the transformation improves the normality, then variables have to be used in their original form.
EVA Dimension
Table 3 reports the result of regression analysis between various firm-specific attributes and EVA (the accounting-based surrogate of shareholder value creation) of selected Indian companies. Applying the backward elimination method, the model starts by including all the independent variables in the regression equation and deletes market cap, QR, and R&D expenditure in the elimination process. Evaluated on the basis of ‘best model fit’ criteria with improved adjusted R2 and fulfilling the model validity diagnostic, a fourth model has been chosen as the best among all. This model provides adjusted R2 of 30.1 per cent with statistically significant F-value at 8.095. The average VIF at 1.503 confirms that the problem of multicollinearity does not exist in the model. The Durbin—Watson test statistic at 1.824 also evidences the non-existence of auto-correlation.
Results of Multivariate Regression Analysis (Backward Elimination Method) with Economic Value Added (EVA) as Dependent Variable

*, ** and *** indicate that coefficients are statistically significant at 1%, 5% and 10% levels respectively.
As per the fourth model, it can be observed that profitability in terms of ROCE has a significant (at the 1 per cent level) and positive impact on shareholder’s value creation. On the contrary, BETA shows a significantly (at the 1 per cent level) negative association with EVA that signals the inverse relationship between systematic risk of a company and its shareholder value which is in line with the hypothesized relationship. These results confirm that companies can enhance their shareholder’s value by improving their profitability (in terms of ROCE) and reducing their market risk. DERATIO too reveals a positive influence on shareholder value that is found to be significant at the 5 per cent level of confidence. It shows that rate of return earned on the additional funds raised by highly geared Indian firms exceed the cost paid to the loan providers. Finally, the efficient management of a company’s working capital (WTR) also seems to assist management in making additions to the shareholder value. AGE and MARKET EXP are not found to be the significant determinants of shareholder value. Hence, as far as the EVA dimension is concerned, only four predictors, that is, profitability in terms of ROCE, risk (both BETA and DERATIO) and ERM of a firm in terms of WTR, turn out to be statistically significant explanatory variables that collectively explain about 34.3 per cent of the variation in shareholder value creation in selected Indian companies.
MVA Dimension
Table 4 presents the results of regression analysis considering MVA as a surrogate of shareholder value creation, the dependent variable of the study. The results suggest that size (in terms of LMC) has a significant positive coefficient indicating that large-size Indian firms are better placed in shareholder value. DERATIO again shows a significant and positive relationship with shareholder value creation. It can be implied as higher the debt component in capital structure, lower is the total cost of capital (due to tax shield on interest charges) that further improves the shareholder value.
The sixth model given in Table 3 was selected as the best model as it reported highest adjusted R2 of 54.1 per cent with a significant F value (p < 0.001).The model ensures the non-existence of multicollinearity with Average VIF at 1.667. The Durbin–Watson test statistic was also found to be satisfactory at 1.572. In this model, just two corporate attributes, that is, size (as LMC at 1 per cent), and leverage (at 5 per cent) were found to be the significant predictors that collectively explain as much as 56 per cent of the variation in shareholder value of a company. There is a lack of significant relationship between other corporate attributes and shareholder value when the latter is proxied by MVA.
Tobin’s Q Dimension
The results of regression analysis, taking Tobin’s Q as the dependent variable have been presented in Table 5. Consistent with the previously established relationship, profitability (in terms of ROCE) once again establishes a significant positive effect on shareholder value creation. Size as measured with LMC and MARKET EXP of a company depict a positive association with its shareholder value. Kakani et al. (2001) state that an increase in the size probably enhances a firm’s financial clout and its market power, while an increase in the marketing spend by a firm probably improves its market share apart from increasing the size of the product market itself, helping the firm to increase its sales, margins and shareholder value. Among efficiency ratios, CTR depicts a positive influence on shareholder value. It implies that sample companies report effective utilization of capital resources in generating revenues and creating value for their shareholders. A positive association between liquidity (QR) and Tobin’s Q indicates the competency of the sample companies to meet all present and potential demands on cash that minimizes cost and maximizes value of the firms. Moreover, the positive and significant slope coefficient of QR also signifies that companies with better liquidity position are excellently monitored by regulatory bodies, financial institutions and stock markets resulting in building the investor’s confidence that further leads to pick up the company’s market value and shareholder wealth.
Results of Multivariate Regression Analysis (Backward Elimination Method) with Market Value Added (MVA) as Dependent Variable
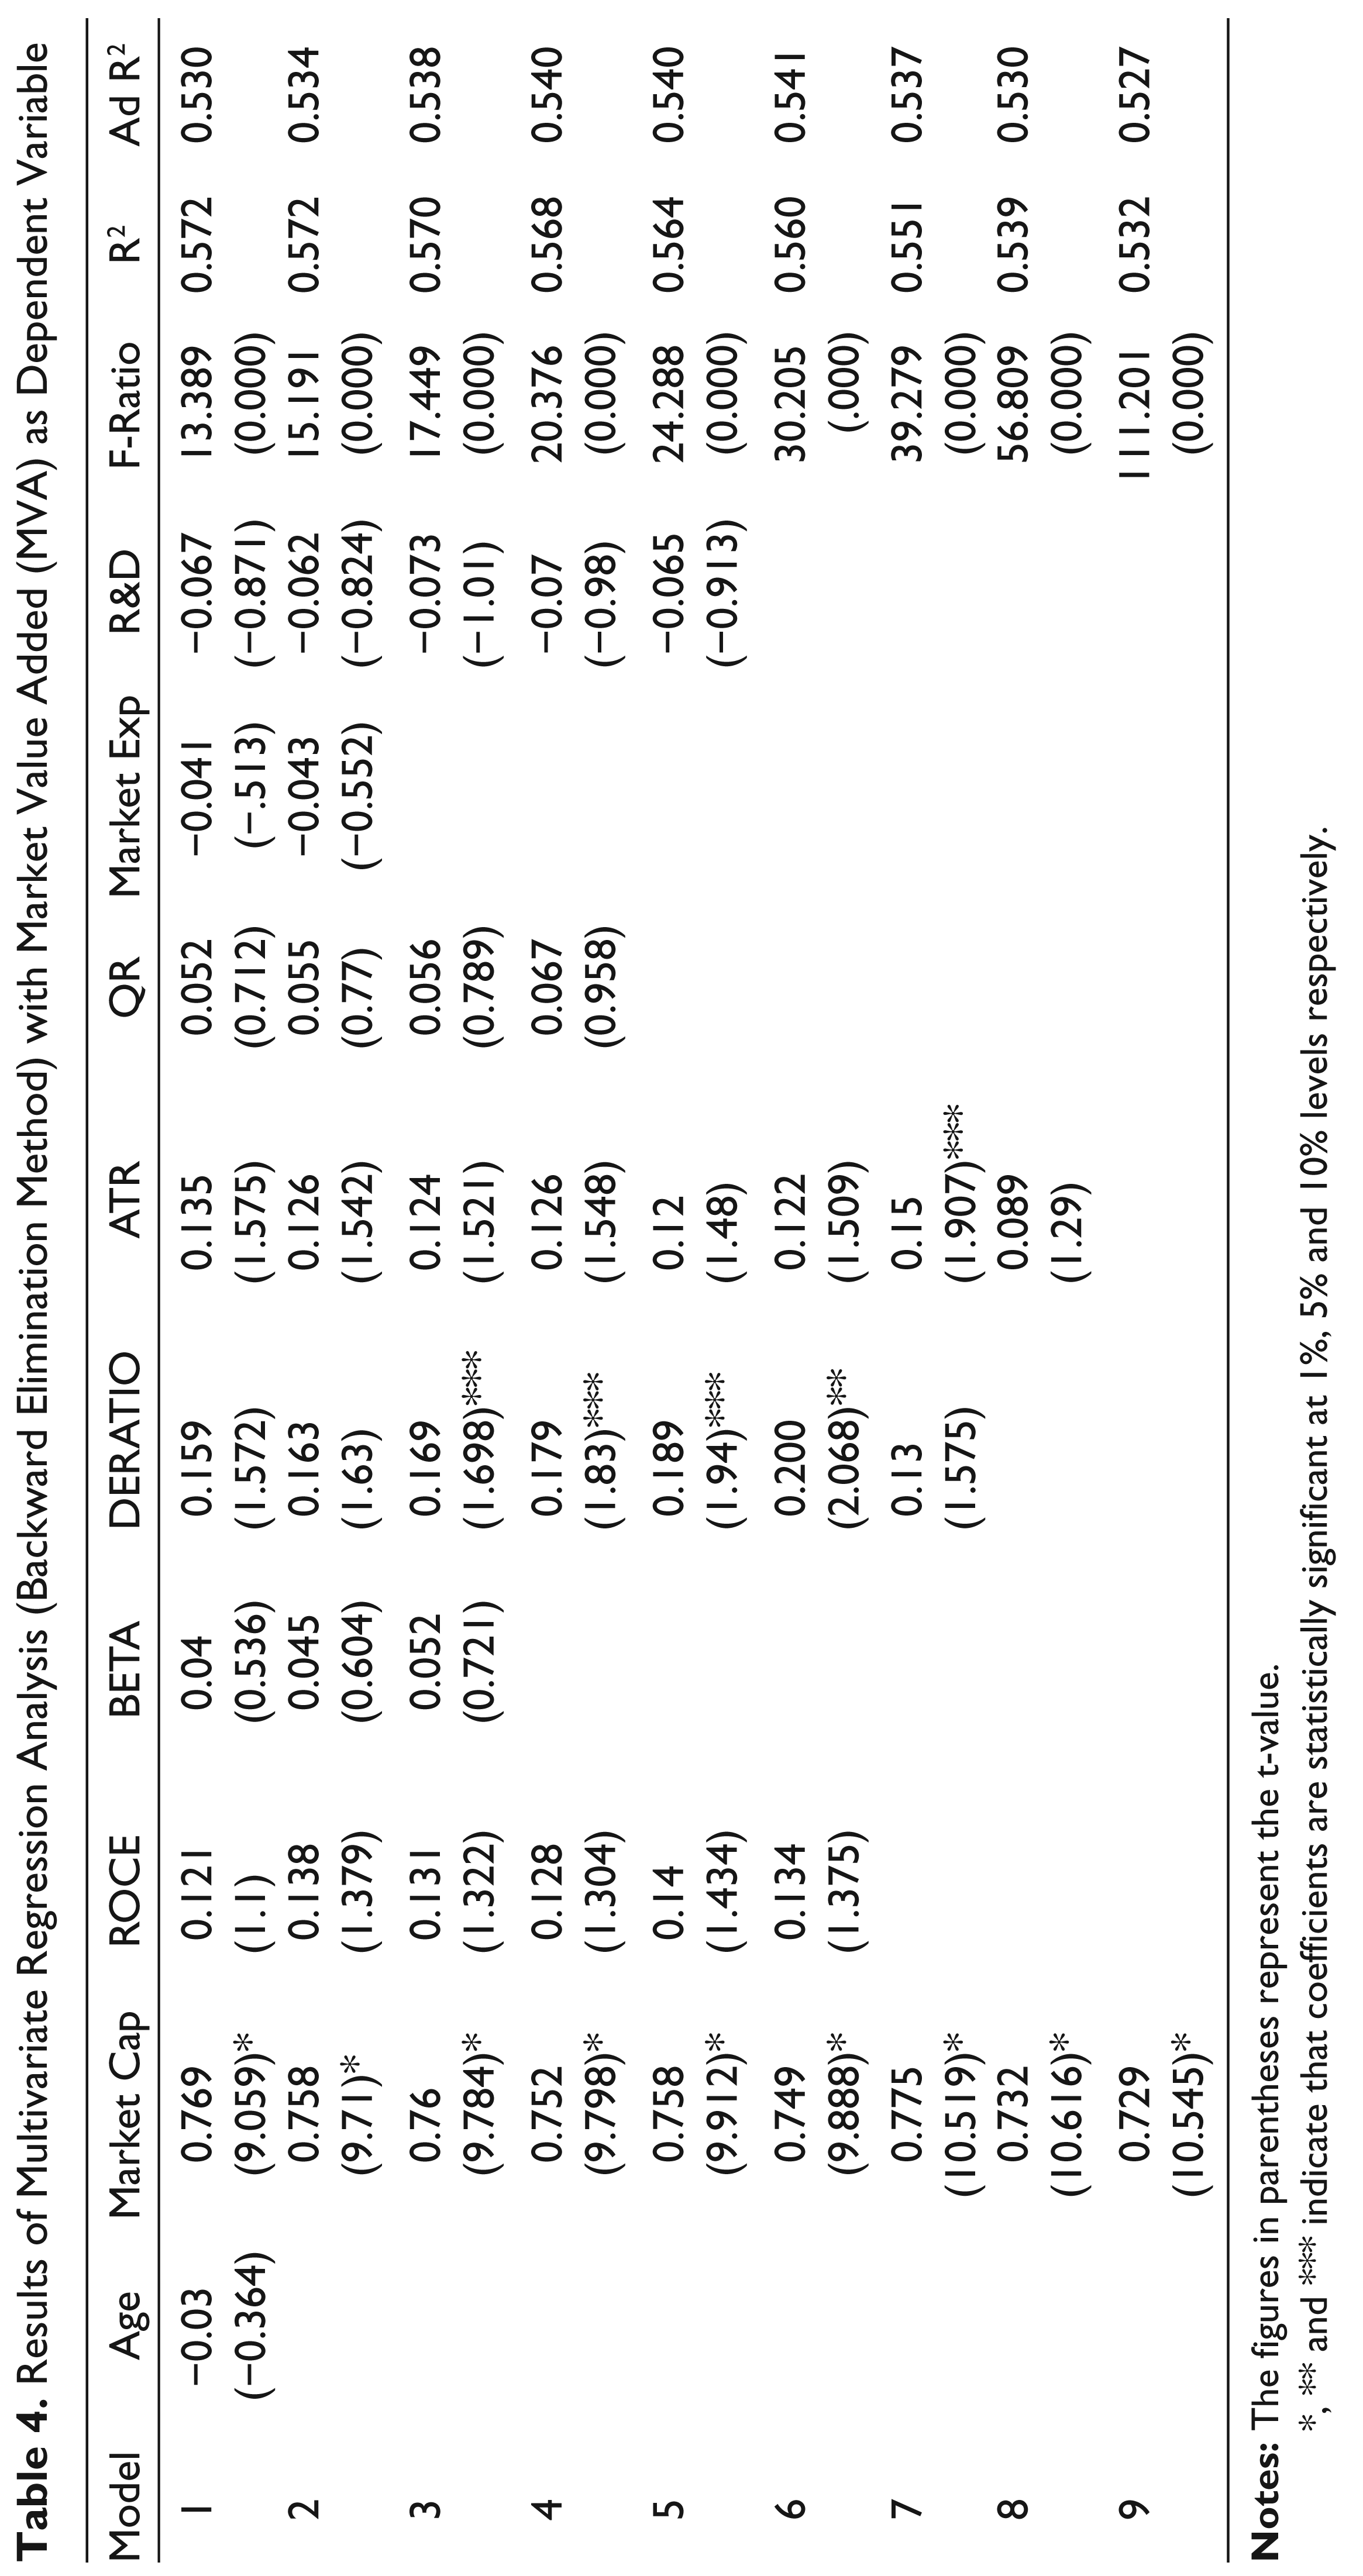
*, ** and *** indicate that coefficients are statistically significant at 1%, 5% and 10% levels respectively.
Results of Multivariate Regression Analysis (Backward Elimination Method) with Tobin’s Q as Dependent Variable
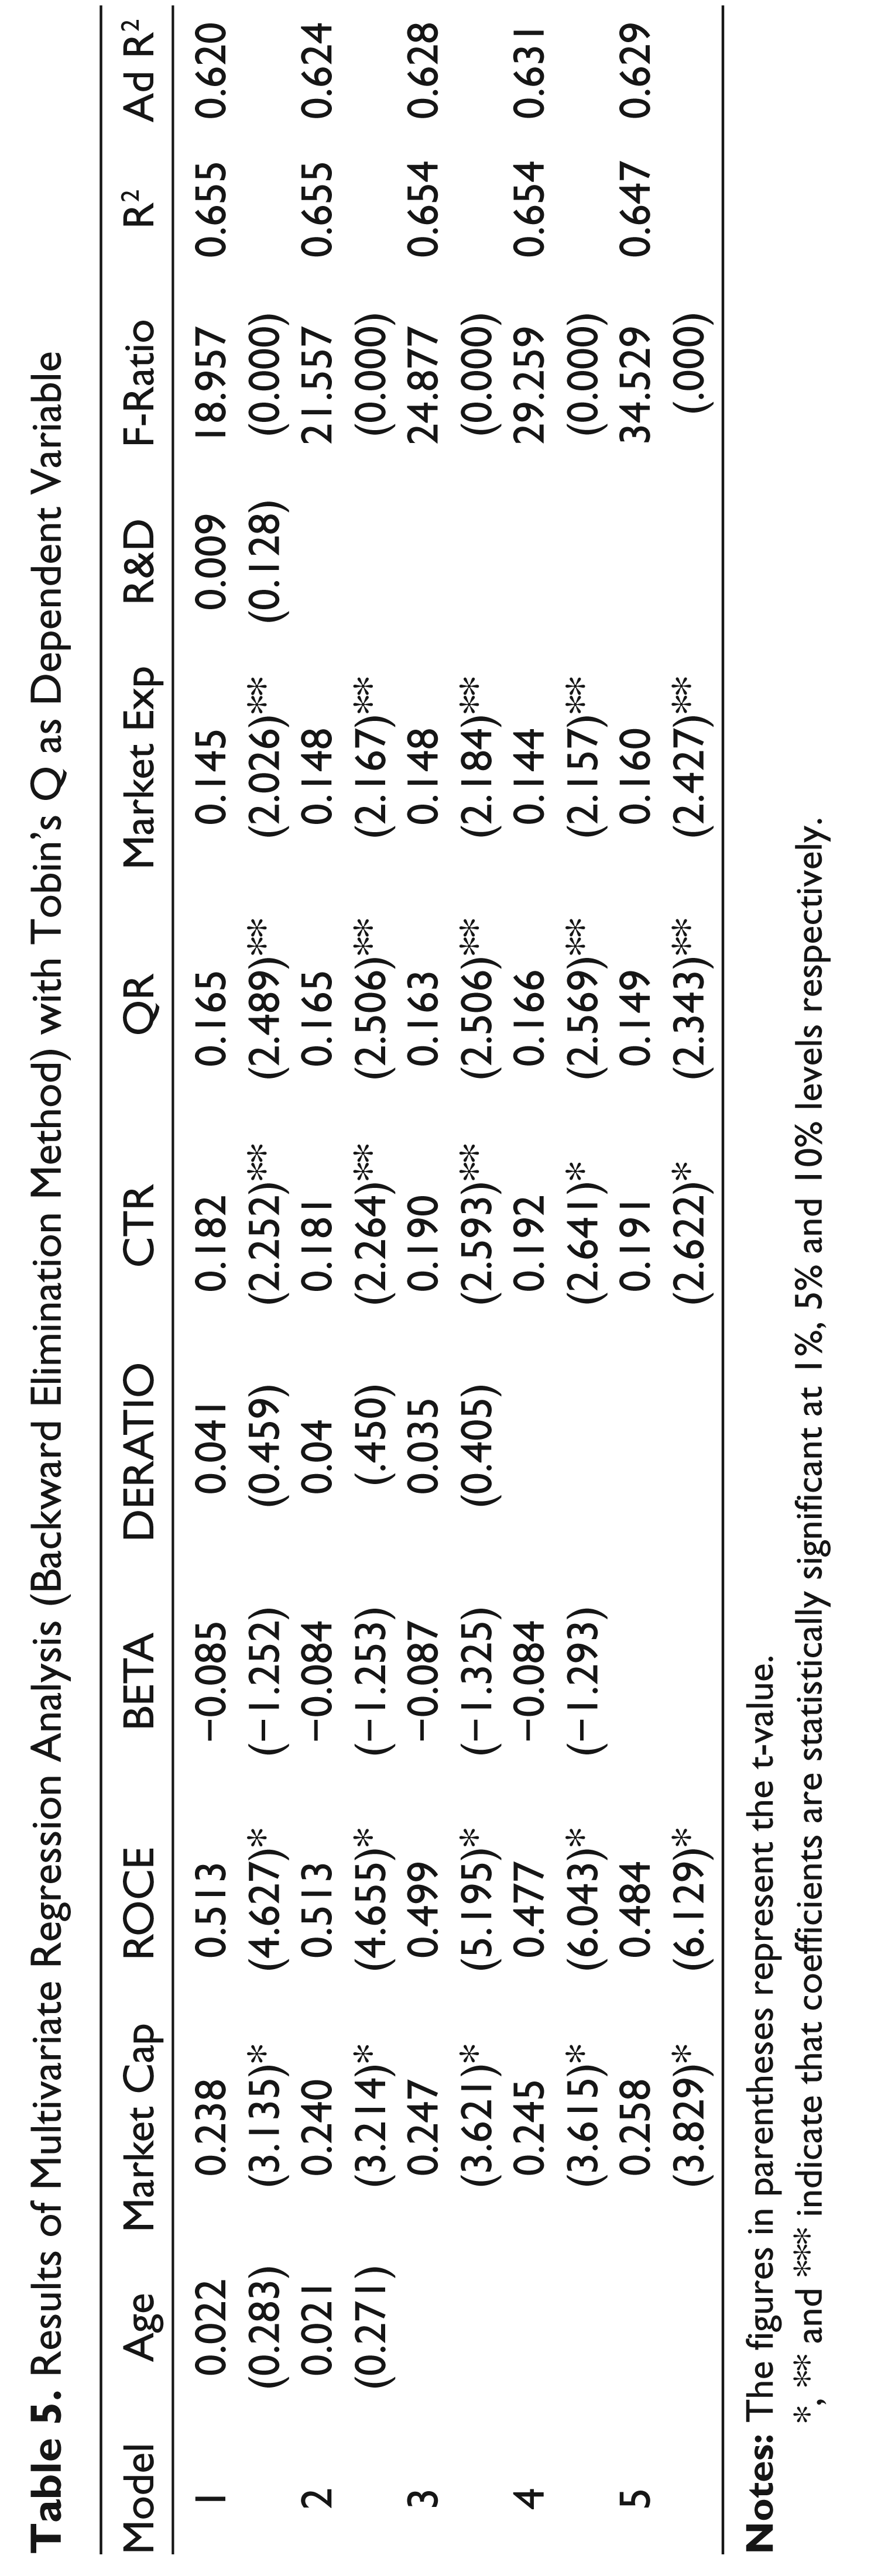
*, ** and *** indicate that coefficients are statistically significant at 1%, 5% and 10% levels respectively.
Further, to identify the best regression model for the sample companies, a suitable diagnostic and valid relationship between corporate attributes and Tobin’s Q ratio was adjusted for multicollinearity and auto-correlation. The diagnostic shows that fourth model given in Table 4 is better as it reports highest value of adjusted R2 at 63.1 per cent. The F statistics of the model is also significant as p < 0.001. The value of R2 confirms that independent variables (namely ROCE, LMC, CTR, QR and MARKET EXP) cause 65.4 per cent of the variation in shareholder value of the sample companies. The values of Durbin–Watson statistics at 1.288 and average VIF at 1.2975 also verifies that the model is statistically fit and proves the relationship between corporate attributes and shareholder value.
Thus, evaluating shareholder value on the basis of accounting as well as market based dimensions, the study reveals divergence between the results. It shows that the set of independent variables explain about 34 per cent of the variation in the accounting-based surrogate EVA whereas they account for more than 55 per cent variation in the firm’s shareholder value when it is measured on the basis of market-based surrogates, MVA and Tobin’s Q. Kakani et al. (2001) state ‘…to the extent that the effect of the predictor variables on market-based performance measures and accounting-based performance measures differs, it can be attributed to speculative forces that influence asset pricing in capital markets’. The present study reveals that although the firm characteristics like size, profitability, risk, efficient resource management, liquidity and market expenditure depict a significant influence on the shareholder value yet their composition differs. For instance, four variables, that is, ROCE, BETA, DERATIO and WTR are significant with respect to accounting-based dimension EVA, whereas just SIZE (LMC) and DERATIO depict significant association in case of market-based dimension MVA. Similarly, SIZE (LMC), ROCE, CTR, QR and MARKET EXP are found to be the significant predictors of shareholder value as far as Tobin’s Q is concerned.
The results clearly show that the all the hypotheses except H1, H4 and H8, evidence the pre-established relationships and thus accepted. On the contrary, an attempt has been made to identify the probable reasons that have led to divergence between the hypothesized and actual relationships with respect to other explanatory variables. AGE (H1), the first chosen firm attribute, is not found to be a significant predictor of shareholder value. It implies that being the oldest or the youngest company around does not lead a business to maximize shareholders’ interests. Rather, there is a need to maximize tradeoffs between margins and capital efficiency in various strategic and operational decisions. Further, leverage (H4) depicts a positive association with firm’s shareholder value as opposed to the expected negative relationship. The results of the study are in line with the net income approach of capital structure theory given by David Durand. It states that with increased use of debt, the weighted average cost of capital declines and the total value of the firm rises. Moreover, such positive association also witness that in Indian companies, institutional investors and debt holders perform an adequate and effective monitoring role. Pandey (2006) too, identified a similar relationship between leverage and shareholder value implying that higher financial risk increases shareholder value.
At last, R&D (H8) intensity has also been identified as an insignificant explanatory variable in both the accounting as well as market based dimensions of shareholder value. From accounting perspective, it implies that in Indian companies the amount spent on R&D activities captures such a small share of sales revenue that does not contribute to the shareholder wealth substantially. Moreover from market perspective, it seems as if Indian markets and investors do not perceive corporate R&D initiatives as an influential factor determining wealth generating capabilities of a business.
Conclusion
The study examines the firm-specific factors, among which the corporate decision makers can navigate their key choices and trade-offs to create superior shareholder value. The foremost limitation of the study was the data constraints in relation to missing financial or capital market data that forced the exclusion of certain companies from the list of companies to be analyzed. Moreover, the absence of detailed financial information (regarding cumulative non-recurring incomes and expenditures, cash operating taxes, etc.) also put constraints in making certain EVA-based accounting adjustments. These limitations and constraints perhaps, do not affect the worth of the research work significantly. The study analyzed that investors tend to reward those companies which have higher profitability, lower market risk, efficient resource management, high leverage, more liquidity, higher marketing expenditures and robust market capitalization. Thus, Indian managers need to be aware of the investors’ expectations for high profitability, lower risk, huge size and optimal utilization of firm’s resources as these are embedded in today’s market valuations. The senior executives and decision makers should also strive to push their management teams to think creatively and aggressively about upcoming opportunities in such a way that at the end of the day, all decisions, including decisions about growth opportunities must drive to the long term shareholder value creation.
Footnotes
Appendix
List of Sample Companies
| 3M India Ltd. | Century Textiles & Inds. Ltd. | Hotel Leela Venture Ltd. | Raymond Ltd. |
| ABB Ltd. | Chambal Fertilisers & Chemicals Ltd. | I T C Ltd. | Reliance Industries Ltd. |
| ACC Ltd. | Cipla | India Cements Ltd. | Reliance Infrastructure Ltd. |
| Aban Offshore Ltd. | Colgate-Palmolive (India) Ltd. | Indian Hotels Co. Ltd. | S K F India Ltd. |
| Aditya Birla Nuvo Ltd. | Crompton Greaves Ltd. | Jindal Saw Ltd. | S R F Ltd. |
| Alfa Laval (India) Ltd. | Cummins India Ltd. | Jubilant Organosys Ltd. | Satyam Computer Services Ltd. |
| Ambuja Cements Ltd | Dabur India Ltd. | Kansai Nerolac Paints Ltd. | Sesa Goa Ltd. |
| Anant Raj Inds. Ltd. | Dr. Reddy’s Laboratories Ltd. | Kirloskar Brothers Ltd. | Simplex Infrastructures Ltd. |
| Ansal Properties & Infrastructure Ltd. | EID-Parry (India) Ltd. | Kirloskar Oil Engines Ltd. | Sintex Industries Ltd. |
| Apollo Hospitals Enterprise Ltd. | EIH Ltd. | Lakshmi Machine Works Ltd. | Sterling Biotech Ltd. |
| Areva T & D India Ltd. | Exide Industries Ltd. | Larsen & Toubro Ltd. | Sterlite Industries (India) Ltd. |
| Asahi India Glass Ltd. | GHCL Ltd. | Lupin Ltd. | Sun Pharmaceutical Inds. Ltd. |
| Ashok Leyland Ltd. | Gammon India Ltd. | Madras Cements Ltd. | Sundaram-Clayton Ltd. |
| Asian Paints Ltd. | Glaxo Smith Kline Consumer Healthcare Ltd. | Maharashtra Seamless Ltd. | Sundram Fasteners Ltd. |
| Astrazeneca Pharma India Ltd. | Glaxo Smith Kline Pharmaceuticals Ltd. | Mahindra & Mahindra Ltd. | Tata Chemicals Ltd. |
| Atlas Copco (India) Ltd. | Godrej Industries Ltd. | Moser Baer India Ltd. | Tata Motors Ltd. |
| Aventis Pharma Ltd. | Grasim Industries Ltd. | Motherson Sumi Systems Ltd. | Tata Power Co. Ltd. |
| Bajaj Holdings & Invst. Ltd. | Gujarat Fluorochemicals Ltd. | Nagarjuna Construction Co. Ltd. | Tata Steel Ltd. |
| Berger Paints India Ltd. | Gujarat Gas Co. Ltd. | Nestle India Ltd. | Tata Tea Ltd. |
| Bharat Forge Ltd. | Gulf Oil Corpn. Ltd. | Nicholas Piramal India Ltd. | Titan Industries Ltd. |
| Birla Corporation Ltd. | H C L Infosystems Ltd. | Novartis India Ltd. | Tube Investments of India Ltd. |
| Bombay Dyeing & Mfg. Co. Ltd. | Hero Honda Motors Ltd. | Pfizer Ltd. | Unitech Ltd. |
| Bosch Ltd. | Hindalco Industries Ltd. | Pidilite Industries Ltd. | Vardhman Textiles Ltd. |
| Britannia Industries Ltd. | Hindustan Construction Co. Ltd. | P & G Hygiene & Health Care Ltd. | Voltas Ltd. |
| Castrol India Ltd. | Hindustan Zinc Ltd. | Ranbaxy Laboratories Ltd. | Wipro Ltd. |
Acknowledgements
The authors are grateful to the anonymous referees of the journal for their extremely useful suggestions to improve the quality of the article. The usual disclaimers apply.