
Abstract
The article studies the nature and direction of shock and volatility transmission among the nine non-overlapping sectoral indices of Bombay Stock Exchange (BSE) across eight different scales (from 2–4 days to 1–2 years) using a newly developed wavelet-based multi-resolution–extended dynamic conditional correlation GARCH (MRA–EDCC GARCH) model and compared the results with that of the traditional vector-auto regression–extended dynamic conditional correlation GARCH (VAR–EDCC GARCH) model. The study reveals that the volatility interaction is scale dependent. Significant variation in the magnitude and direction of the spillover incidences are observed between the results of the two models which elucidates that the traditional VAR–EDCC GARCH model may not be sufficient in unlocking the complex pattern of volatility interaction and the multiscale analysis can be further used to extract the hidden information. Shock spillover incidences are found to decrease with scale while the volatility spillover is found to vary both in magnitude and direction across scales. Previous literatures have established that volatility interaction among financial assets can be leveraged successfully in designing trading strategies that generates better results in comparison to the trading strategies that does not employ volatility interactions in their model. Given the findings that the magnitude and direction of volatility interaction changes with the change in investment horizon, it can be concluded that a strategy calibrated for short-term traders may not be optimal for long-term traders and vice versa.
Introduction
The study of volatility dynamics of the asset returns has gained considerable importance over the last decade because of numerous reasons. First, financial volatility exhibits features like the clustering and long memory which enhances its predictability as compared to its counterparts like price and returns. Second, measurement and assessment of volatility forms an integral part of risk assessment and monitoring exercise. The introduction of Basel accord has further boosted the importance of volatility forecasting in risk management. Third, volatility forms an essential input to the pricing of derivatives. Finally, financial analyst and the policy makers frequently rely on volatility as a proxy for financial and economic turmoil. All these reasons have sparked a colossal interest in the study and modelling of various facets of the financial market volatility. Volatility interaction among assets is one of such widely explored areas. Interaction among volatilities of different financial markets is traditionally manifested via two different forms—shock spillover and the volatility spillover. The shock spillover indicates how a random shock from one market is transmitted to the other market. If the ‘shocks’ are assumed to be the impact of news then the shock spillover indicates how news pertinent to one market impacts the volatility of another market and hence the phenomena can also be re-labelled as ‘news-spillover’. Volatility spillover gives the causal relationship among volatilities of different markets. It indicates whether a high volatility reign in one market is followed by a similar high volatility reign in the other market. An anti-persistent behaviour is observed if an increase in volatility in one market is followed by a decrease in volatility in the other market. Such behaviour is favourable from portfolio diversification’s point of view. This transmission of shocks and volatilities among the markets are induced by the market agents who trade over heterogeneous scales. Short-term traders, typically inter-day traders and hedge funds, trade primarily on the market information. At times they react to news relevant to a particular market by adjusting their position in the other market and thereby causing the news spillover. For example, a bad development in the US market may induce international portfolio managers to take a conservative position in the other markets to cut off further losses. Long-term traders like the central banks and pension funds relies more on fundamentals and places least importance on daily news and thus their transactions are least likely to induce shock spillover in the market. Portfolio managers and mutual funds trade on intermediate scales (typically between weekly to monthly) and relies both on the fundamentals and market information. Thus, the nature of volatility interaction among the assets depends on the horizon of investors participating in the transactions. Given this information it can be postulated that multi-frequency components of the market returns are more relevant in analyzing the spillover characteristics as opposed to the raw return-data which are diluted by fluctuations at different scales. The current article intends to test this hypothesis by applying a relatively new wavelet-based ‘multi-resolution–extended dynamic conditional correlation GARCH’ (MRA–EDCC GARCH) model and compared its result with the traditional Vector-Auto-Regression–Extended Dynamic Conditional Correlation GARCH (VAR–EDCC GARCH) model in detecting spillover characteristics among the nine non-overlapping sectoral indices 1 of Bombay Stock Exchange (BSE). Unlike previous literatures in this field (Fernandez, 2005; Huang, 2011; Lee, 2004) which considered mostly bivariate multi-scale interaction across financial markets of different economies the current study delves into multivariate multi-scale interaction of volatilities of different sectors of a same (Indian) economy. The multivariate framework is more relevant in tracing the complex path of volatility diffusion and the Indian backdrop is adopted with an intention to aid both the international and domestic traders, operating in India, to calibrate their sector allocation strategies in accordance with their investment horizon.
The rest of the article is organized as follows: The section ‘Literature Review’ traces the prior literatures on the subject. The section ‘Theoretical Framework’ provides the theoretical framework. The section ‘Data and Research Methodology’ explains the data and methodologies applied in the study, the section ‘Findings’ delves into the findings and the section ‘Conclusion’ concludes the article.
Literature Review
Interactions among the financial markets are generally studied from two different dimensions—the degree of return and/or volatility transmission and the degree of comovement or integration. Although there have been numerous studies on the volatility interaction among the financial markets, the application of wavelet decomposition techniques in the study is rather restricted. Candelon et al. (2008) stated that the study of stock market depencencies should take into account the behavioural differences between the short-term and long-term traders. When short-term investors are more interested in the interdependencies over a shorter time horizon, long-term investors mostly concentrates on high scale interdependencies. In this backdrop, wavelet-based time frequency analysis can be used as an essential tool in dissecting the complicated relationship across heterogeneous investor groups (Gençay et al., 2001; Ranta, 2010). Lee (2004) applied multi-resolution analysis (MRA) to probe the return and volatility spillover between the US and Korean markets. In his article he used MRA to split the stock market returns into different scale components (also called the crystals) and for each such scale component he applied ordinary least square regression of the Korean market’s return on the one day lagged value of the US market return and vice versa. To test volatility spillover between the markets Lee decomposed the square returns of the respective markets into different scales using MRA, and then performed similar ordinary least square regression. The study revealed a significant unidirectional return and volatility spillover from the US to the Korean market at the high frequency region (for the D1 and ‘D1+D2’ crystals). These results buttress the earlier findings based on VAR and GARCH methodologies and also supported the hypothesis that the spillover between the markets are mainly caused through the short-term fluctuations. Fernandez (2005) used similar methodology to study the return spillover among the eight indices of the G7 countries and ended up with an almost similar conclusion. Gallegati (2005) used wavelet correlation analysis to probe the degree of integration of MENA8 markets with the corresponding developed markets in the US and Europe and revealed that the markets are more and more correlated as the time-horizon increases. Kumar and Dhankar (2010) studied the relationship between stock returns and conditional volatility and found that the investors adjust their investment decisions taking into consideration the expected volatility and they demands extra risk premium for unexpected volatility. Their study reveals that the market volatility in turns influences investment strategy. Rua and Nunes (2009) used wavelet squared coherency to measure the degree of comovement among the major stock markets of the developed economies like Germany, Japan, the UK and the USA. Their study revealed that the comovements among the markets are stronger at lower frequencies and thereby suggesting that the benefit of diversification is relatively less for the long-term investors than the short-term counterparts. Their conclusion is further supported by Zhou (2012) who studied the multi-scale linkage among the returns and volatilities of the seven major REIT markets using the MODWT analysis. The study revealed that the return and volatility linkage among the markets increases with scale. Madaleno and Pinho (2012) used continuous wavelet transformation (CWT) and wavelet coherence analysis to study the financial linkage among FTSE100, DJIA30, Nikkei225 and Bovespa stock exchanges. Their study revealed strong coherence among the stock market indices at higher scales. Also, their phase analysis indicated that the linkages among the markets are heterogeneous across both time and scale. Huang (2011) applied bivariate MRA BEKK GARCH model to investigate spillover between NASDAQ (USA) and TWSI (Taiwan composite stock index). In his article Huang found that the NASDAQ returns strongly predict the TWSI returns and the prediction power is unevenly distributed over different scales. The BEKK GARCH model, when applied to the MRA crystals, reveals that the spillover effect is unevenly distributed over each time scale and is grossly different in direction and magnitude from the characteristics obtained using raw data. Statistically, significant spillover effect (shock transmission) is detected at both lower and higher scales but not in the intermediate scales. The present work extends the work of Huang along the following directions. Instead of the bivariate BEKK GARCH models (as used by Huang (2011)) the article adopts the multivariate EDCC GARCH model of He and Terasvirta (2004) and Nakatani and Terasvirta (2009). The motivation to switch from BEKK to DCC model is backed by findings of previous literatures which highlighted several disadvantages of the BEKK GARCH model. First, the parameters do not have a direct interpretation concerning lagged values of volatilities and shocks (Tsay, 2005). Second, the number of parameters required to be estimated in a full BEKK GARCH model increases rapidly limiting the number of assets that can be included. Thus, this model is rarely used when the number of series is larger than three or four. On the other hand, DCC model can be estimated in two steps which make this approach feasible when the number of series is large (Bauwens et al., 2006). Next the article is the first to apply the MRA–EDCC GARCH methodology to the sectoral indices of the Indian financial market. Given the fact that the information on shock and volatility spillover dynamics are crucial while allocating wealth across sectors, the study is expected to aid the Indian market agents in analyzing the ‘interaction-characteristics’ relevant to their investment horizon.
Theoretical Framework
The article develops the theoretical construct for the current study based on several informations, obtained from prior literatures. These are explicated sequentially as follows. Different agents trade at different scales in the same financial market. These agents range from intra-day traders to long-term traders (like the pension funds). Transmission of shocks and volatilities among the markets are induced by these heterogeneous agents. Short-term trader trade primarily on information and are mainly responsible for the shock transmission. Long-term trader relies on fundamentals rather than idiosyncratic information and is least likely to induce shock spillover. All this agents, operating at different scales, contributes to the volatility spillover with varied intensity. Furthur these agents frequently utilizes the shock and volatility interaction to devise and re-calibrate their trading and investment strategies (Kumar and Dhankar, 2010). Thus, if it can be empirically proved that the shock and volatility spillovers are scale dependent then it can also be concluded that an interaction-based investment strategy developed by a short-term trader may not be optimal for long-term traders and vice versa. In a nut-shell the article intends to test the following hypothesis:
H0: Direction and magnitude of shock and volatility spillovers among the financial assets are scale dependent.
against
H1: Direction and magnitude of shock and volatility spillovers among the financial assets are scale independent.
The schematic representation of the multi-scale interaction model at a particular scale j is given in Figure 1.
The schematic representation of the hypotheses that is empirically tested and the conclusion that it seeks to provides is represented in Figure 2.
Volatility Interaction Model at Scale j

The Tested Hypothesis and the Expected Conclusion

To achieve this objective the article utilizes wavelet-based MRA to decompose the raw return data into return components at different scales. Then the article applies a relatively new wavelet-based ‘multi-resolution analysis–extended dynamic conditional correlation GARCH’ (MRA–EDCC GARCH) model to probe into the volatility interaction effects at different scales. To compare the outcomes with that of a tradional scale independent model the article utilized the vector-auto-regression-extended dynamic conditional correlation GARCH (VAR–EDCC GARCH) model. A detail explanation of these models is given in the next section.
Data and Research Methodology
Data
The BSE, being the oldest in Asia with over 4900 listed companies and ranking among the top 10 global exchanges in terms of the market capitalization (as of 31 December 2009), is considered as a suitable proxy for the Indian financial market. Currently BSE hosts 11 non-overlapping industry-specific sectoral indices, namely, Information technology (IT), Auto, Bankex, Consumer Durable, Capital Goods, FMCG, Health care, Metal, Oil&Gas, Power and Realty. However, the base period for index calculation varies; for example, 1 February 1999 is the oldest base period set for IT, Auto, Consumer Durable, Capital Goods, FMCG, Health care, Metal and Oil&Gas; whereas the base period for the relatively new indices, namely, Power and Realty is set on 3 January 2005 and 2006, respectively (source: BSE website). This variation results in the accessibility of the historical prices over different intervals for different sectors. The article excludes Power and Realty sectors because of the availability of relatively fewer data points and accommodates the remaining nine sectors, covering a period from 5 April 2004 to 2 April 2012. The historical daily prices are downloaded from the BSE website and the corresponding returns are calculated as follows

where
Methodology
Precondition to fitting a MGARCH model is the estimation of the innovations in the return series. The estimation is traditionally done by fitting a VAR or VARMA model to the multivariate return series and filtering out the residuals. The residuals thus obtained are, however, scale invariant. A noble alternative to this filtering method is the wavelet-based multi-resolution analysis (MRA) which provides a mean-zero residuals at multiple scales. These scale dependent innovations can then be used to fit an EDCC–GARCH model to estimate the shock and volatility spillover dynamics at multiple scales. To check the effectiveness of this approach a traditional VAR–EDCC GARCH model is estimated with the raw data and the results of both the models are compared. The next part of this section provides succinct information of both these models.
VAR–EDCC GARCH
Given a (N X 1) vector of time series variables Rt = [r1t, ... , rNt], the p-lag order vector-autoregressive (VAR (p)) model can be represented as follows.

Where,

Where

An attractive feature of the conditional correlation models is the separate estimation of conditional variance and conditional correlations which leads to further flexibilities. The multivariate GARCH (p, q) representation of the conditional variance component is described as

Where,
H
0
:
against
H
1
: at least one off – diagonal elements of
Under the null hypothesis the model can be represented in diagonal DCC GARCH form whereas under the alternative hypothesis the same can be represented in EDCC GARCH form.
MRA–EDCC GARCH
Wavelet transformation is a noble approach of representing a discrete time series in the time-frequency space. The transformation is achieved by projecting a finite-energy time series on a pair of translated and dilated wavelets. These wavelets form the basis of the transformation and are of two basic types: father wavelet and mother wavelet. Father wavelets are used to capture the trend or low frequency components of the signal whereas the mother wavelet captures the deviation from the trend, that is, the detail components. The mother (}) and father (U) wavelets satisfy the following fundamental properties –


In order to capture the change in a signal at a particular frequency and at a particular point in time the wavelet coefficients are needed to be scaled and translated as shown in equation 9 where j being the scale parameter and κ the location parameter.

The wavelet and scaling coefficients are obtained by projecting the time series on the scaled and translated wavelets as follows:


The wavelet

Equation 12 can further be represented in simplified form as

Where,

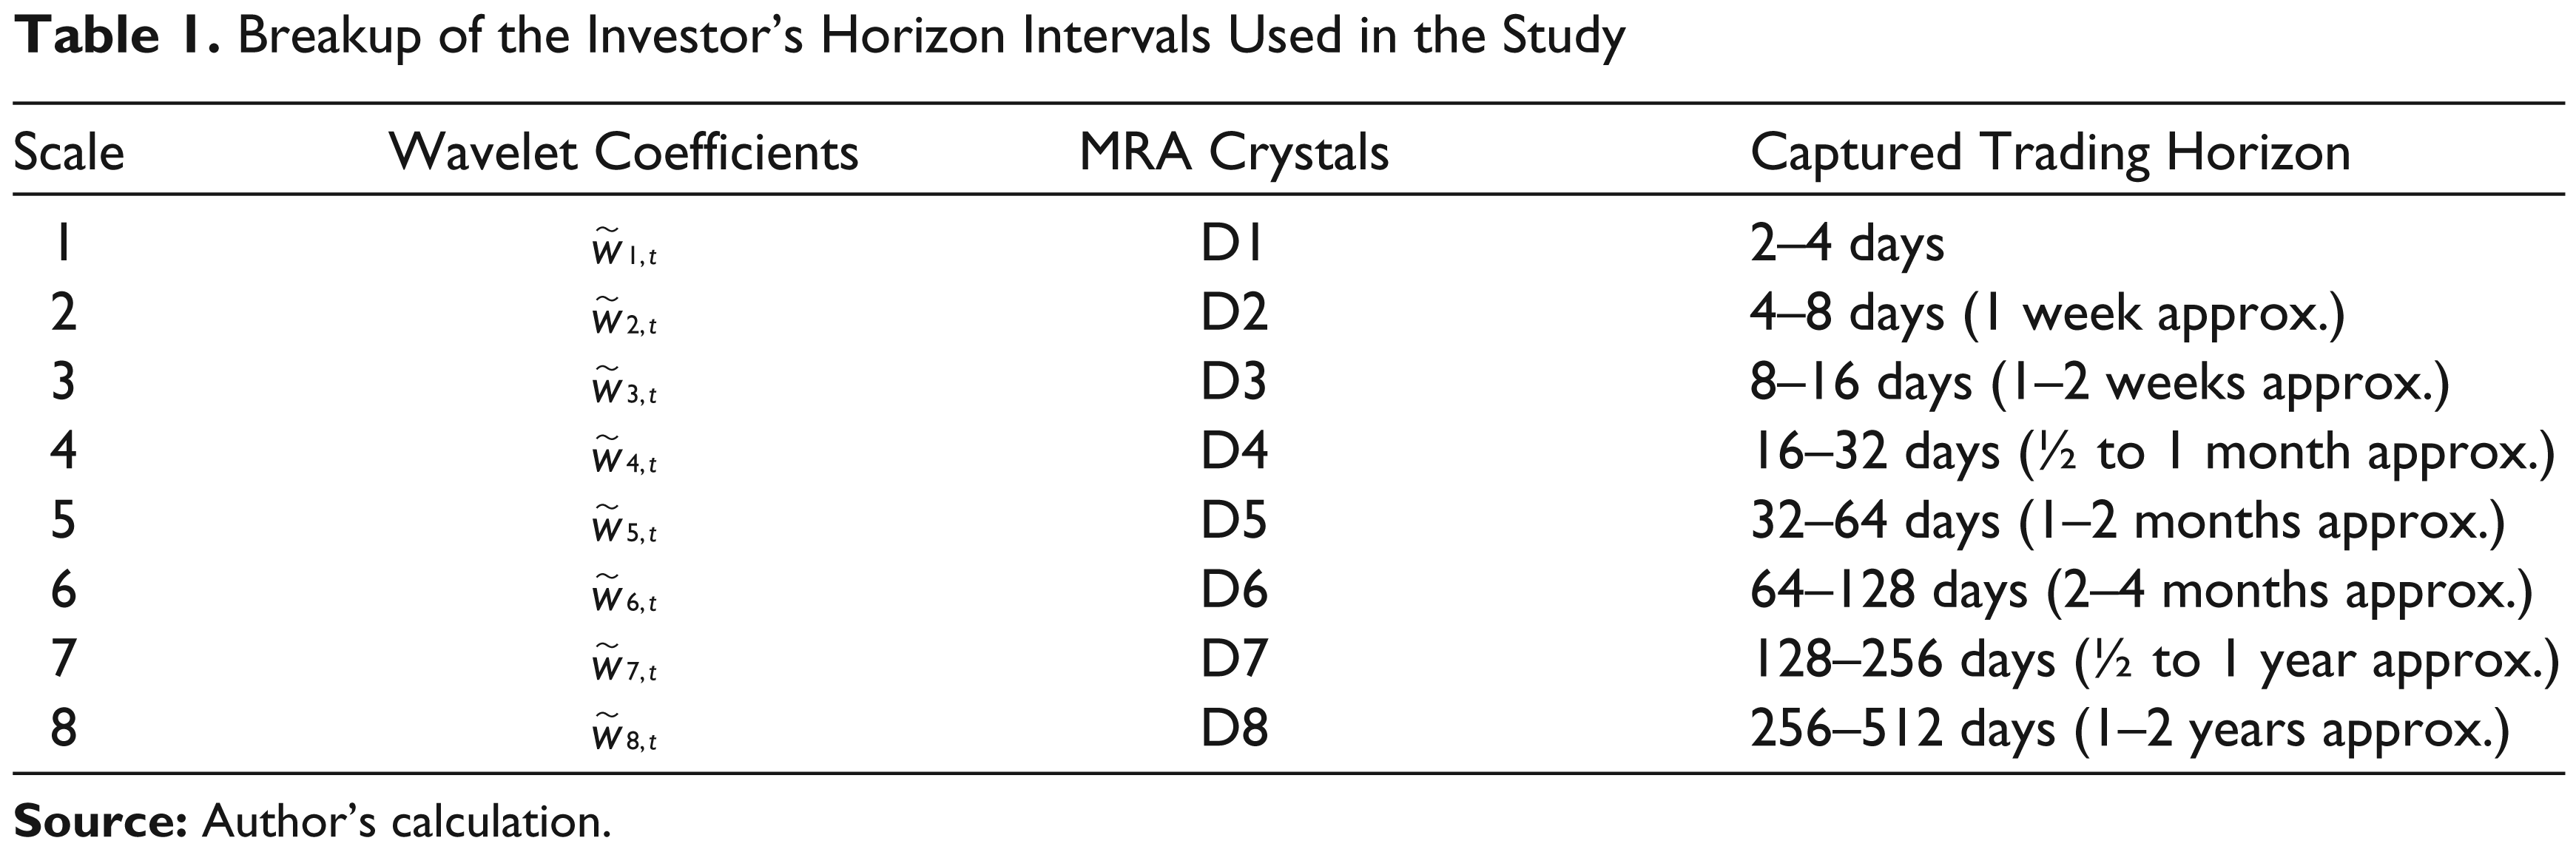
Breakup of the Investor’s Horizon Intervals Used in the Study
Findings
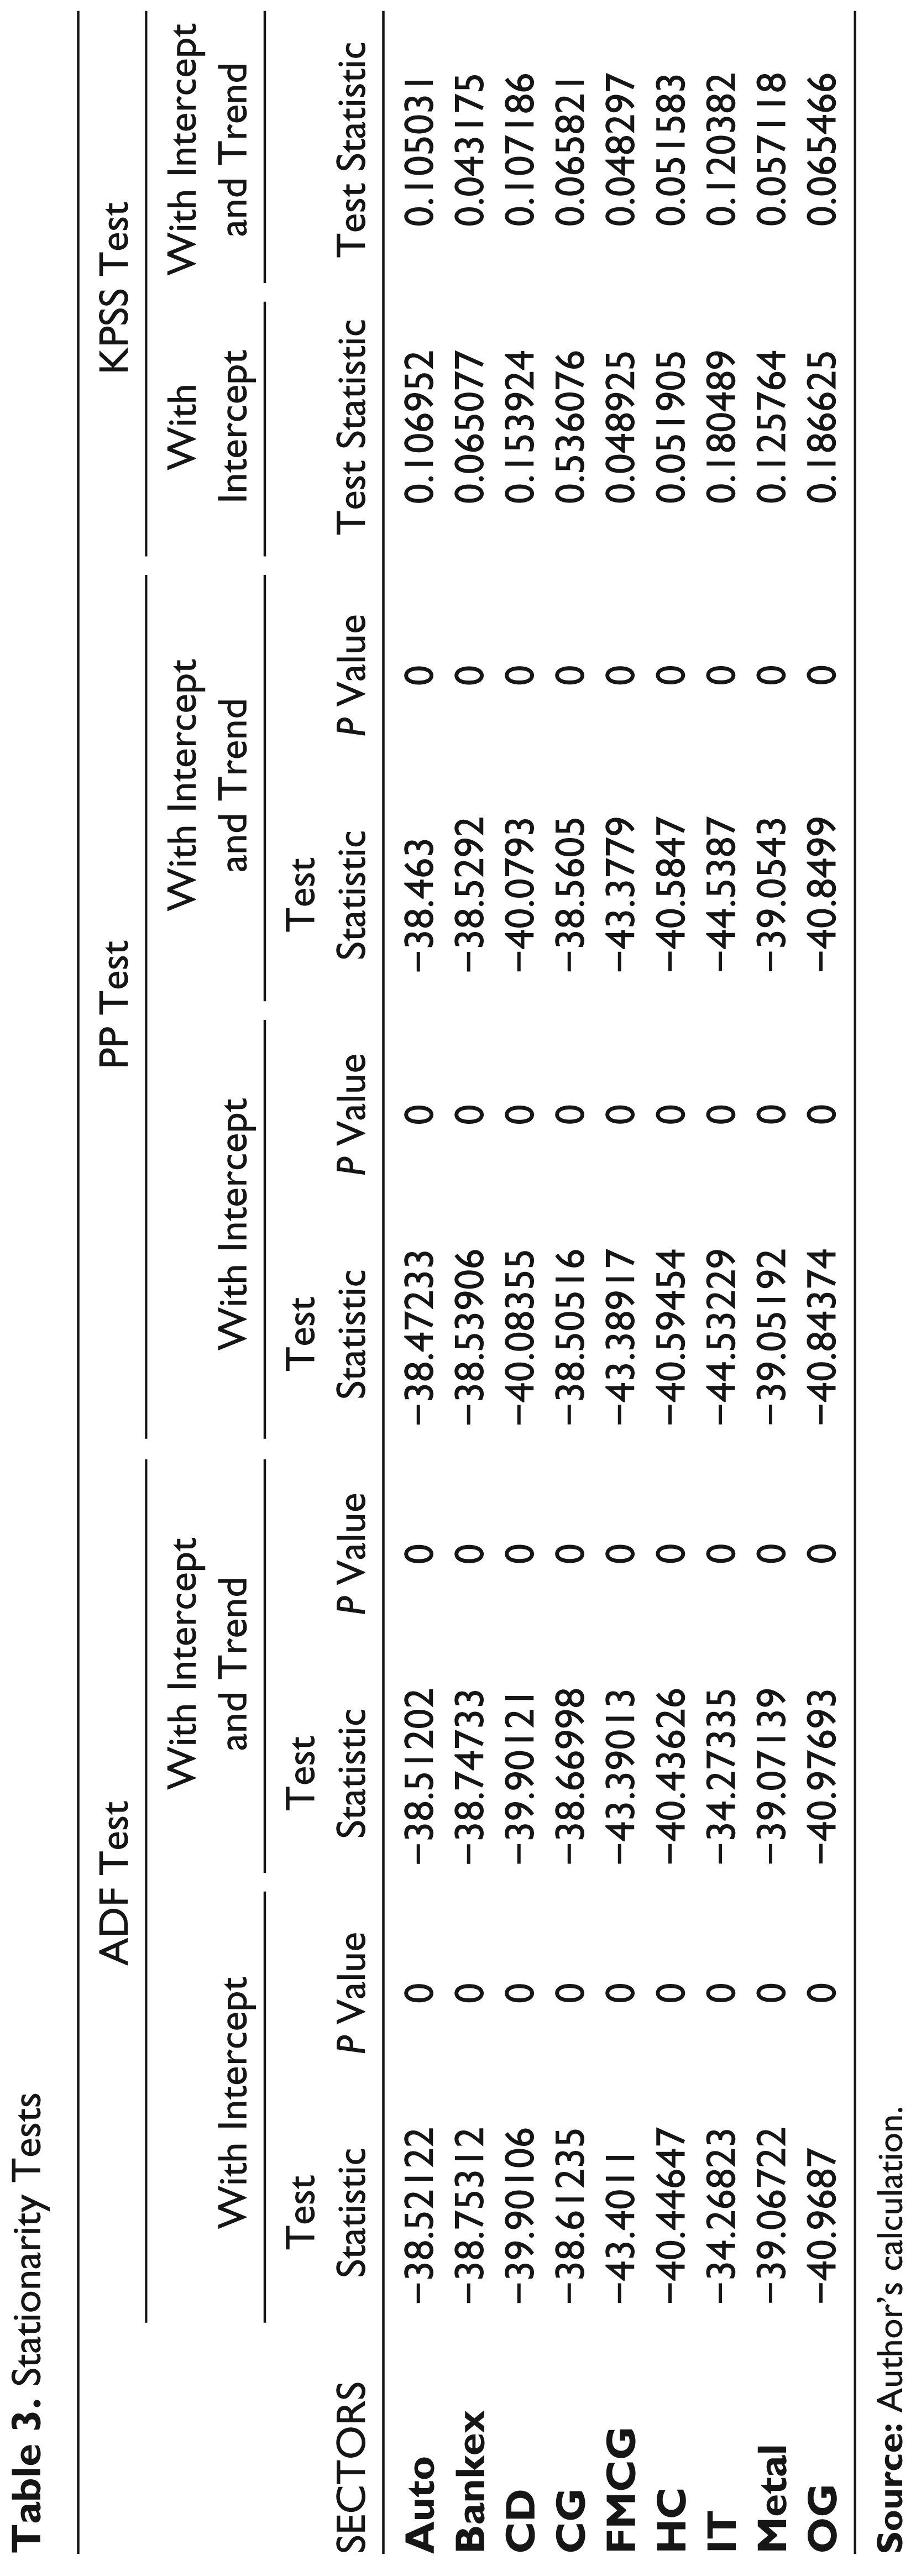
The descriptive statistics of the sectoral returns including the Jarque–Bera test for normality are displayed in Table 2 while the ADF, PP and KPSS tests for stationarity are shown in Table 3.
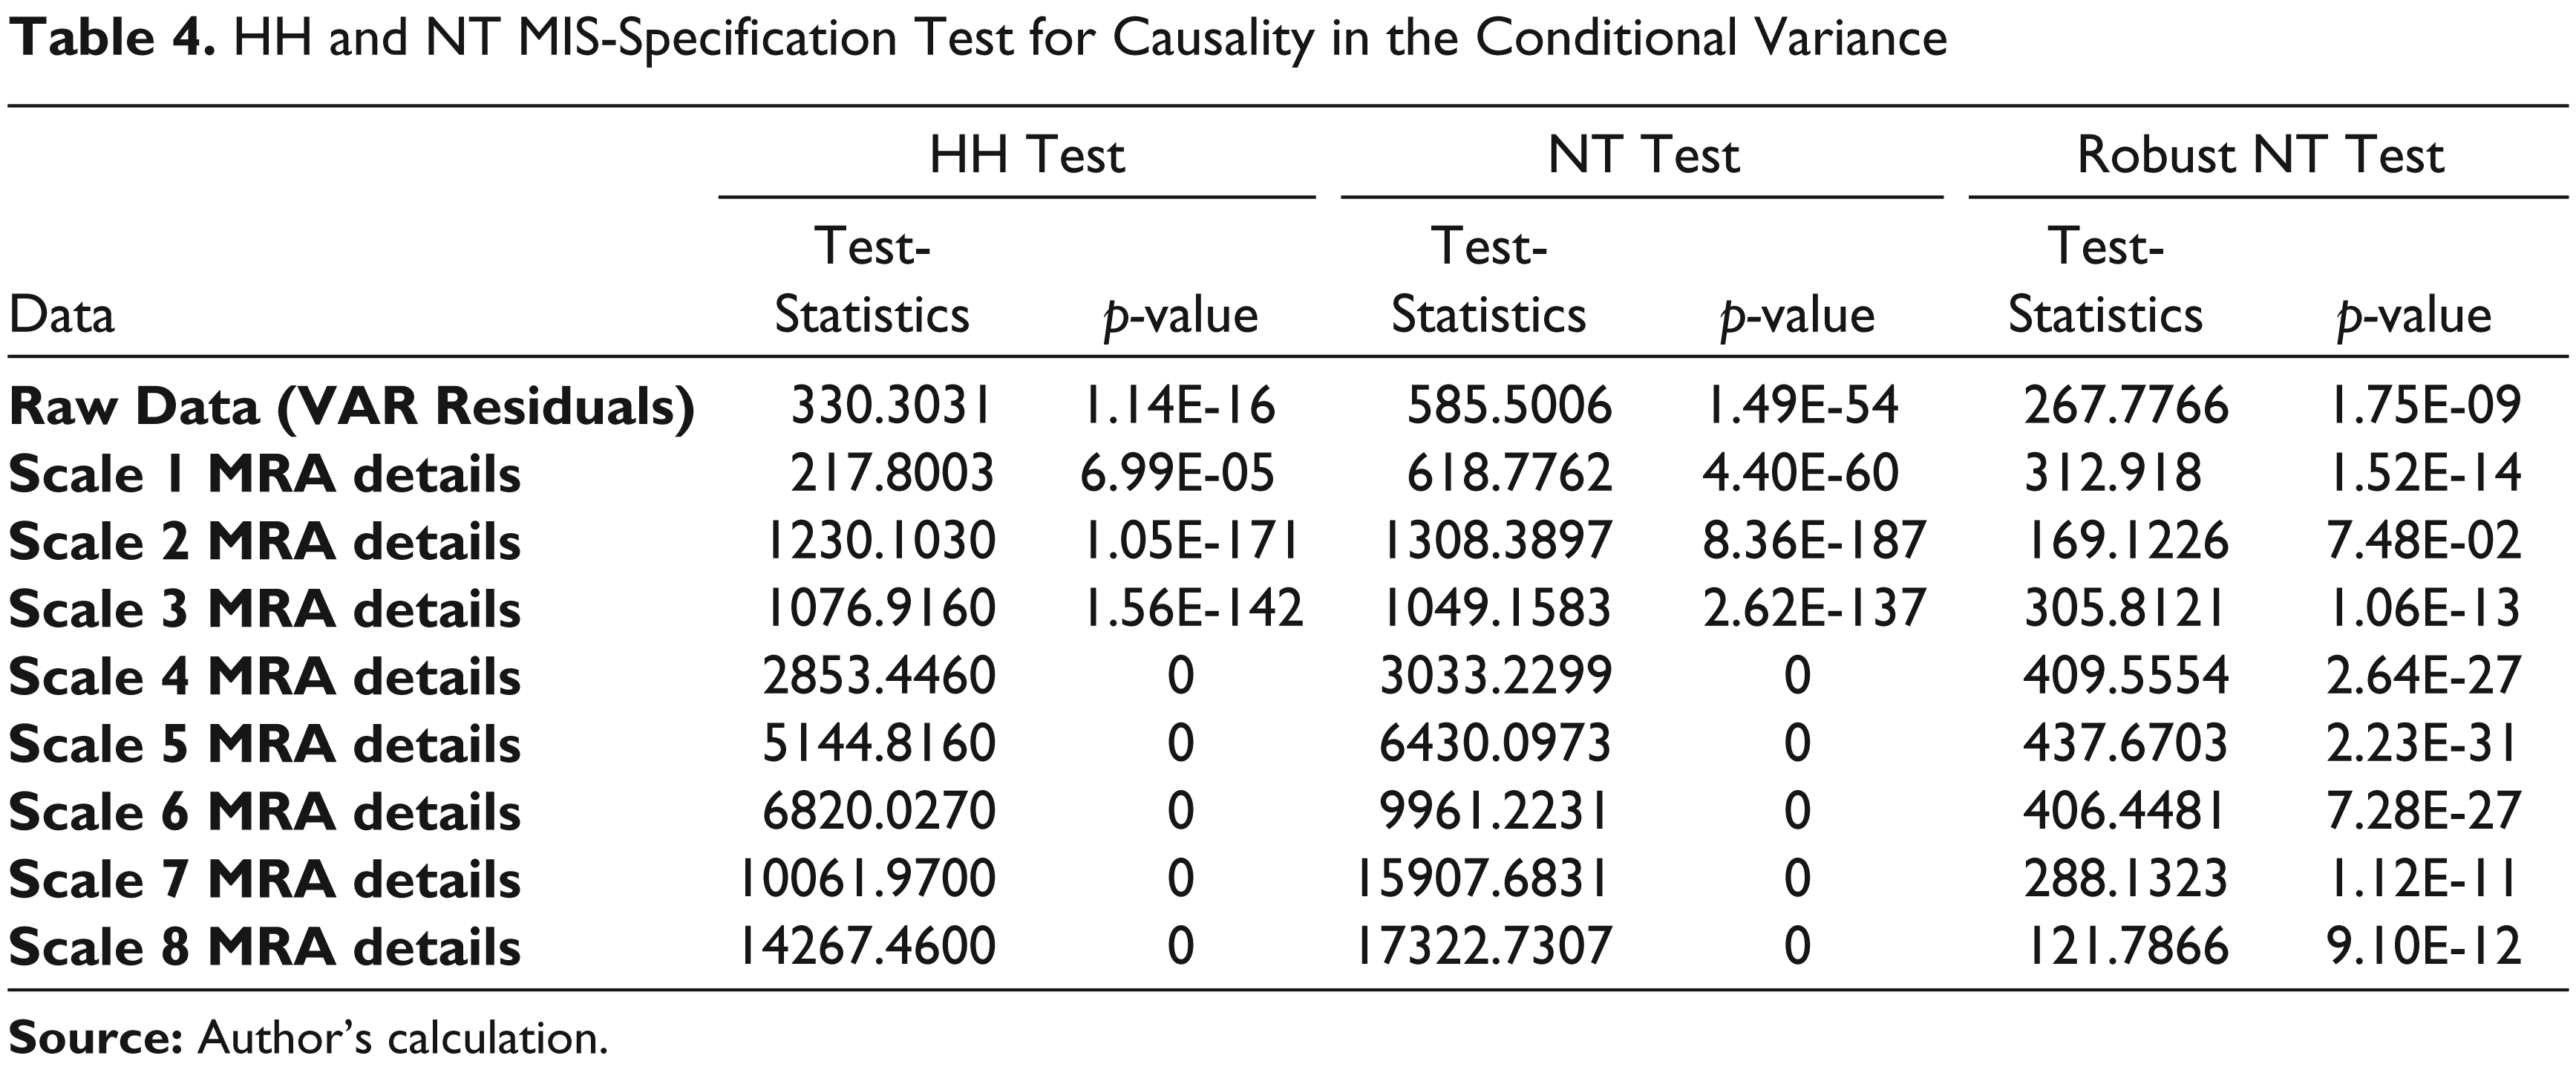
Table 2 reveals that the returns of all the sectors except for capital goods have negative skewness while the kurtosis is greater than three for all sectors. The results are further supported by Jarque– Bera test which indicates that the sectoral returns are not normally distributed (the zero p-values in the Jarque–Bera test-results indicates that the null hypothesis that the returns are normally distributed can be rejected at 1 per cent level of significance). The ADF and PP tests (Table 3) are conducted first with intercept and then with intercept and trend. For both the situations a zero p-value indicates that the sectoral returns are stationary. This conclusion is further buttressed by the KPSS test. Before fitting a VAR model to the return series lag order selection is performed using the traditional criteria like the Akaike information criterion (AIC), Schwarz information criterion (SC), Hannan–Quinn information criterion (HQ) and the Final prediction error (FPE). All the criteria excluding SC are found to be minimal at lag one. With this information a one lag order VAR model is fitted to the raw data and the residuals are filtered out for conditional volatility modelling. For the multi-scale analysis filtering is done using MRA. The HH and NT misspecification tests are conducted for correct specification of the DCC GARCH model and the results are displayed in Table 4.
The low p-values from these tests at different scales indicate that the null hypothesis that the ARCH and GARCH coefficient matrices (from the multivariate GARCH representation in equation 5) are jointly diagonal can be rejected at 1 per cent level of significance. The result buttresses the presence of causality in the conditional variance across all scales and justify the adoption of the extended DCC model as opposed to the diagonal-DCC model in modelling of the conditional volatilities of the VAR and MRA residuals. The result of the one lag order EDCC GARCH model is not given in the article because of its enormous volume. The table is available with the authors and can be accessed on request. The article acknowledges the presence of significant cross-spillover across sectors upon the fulfilment of the following two conditions
Summary Statistics on Raw Daily Returns

Stationarity Tests
HH and NT MIS-Specification Test for Causality in the Conditional Variance
The magnitude of the spillover coefficient is greater than a threshold value of 0.01.
This threshold value is selected to ignore any small spillovers which are statistically significant but fail to create any practical impact for the investors.
The spillover coefficients are statistically significant at 95 per cent confidence level. Student’s t-statistic is computed and hypothesis tests are conducted with the null and alternate hypothesis defined as follows:
H
0
: The spillover coeffecients are zero
against
H
1
: The spillover coeffecients are different from zero
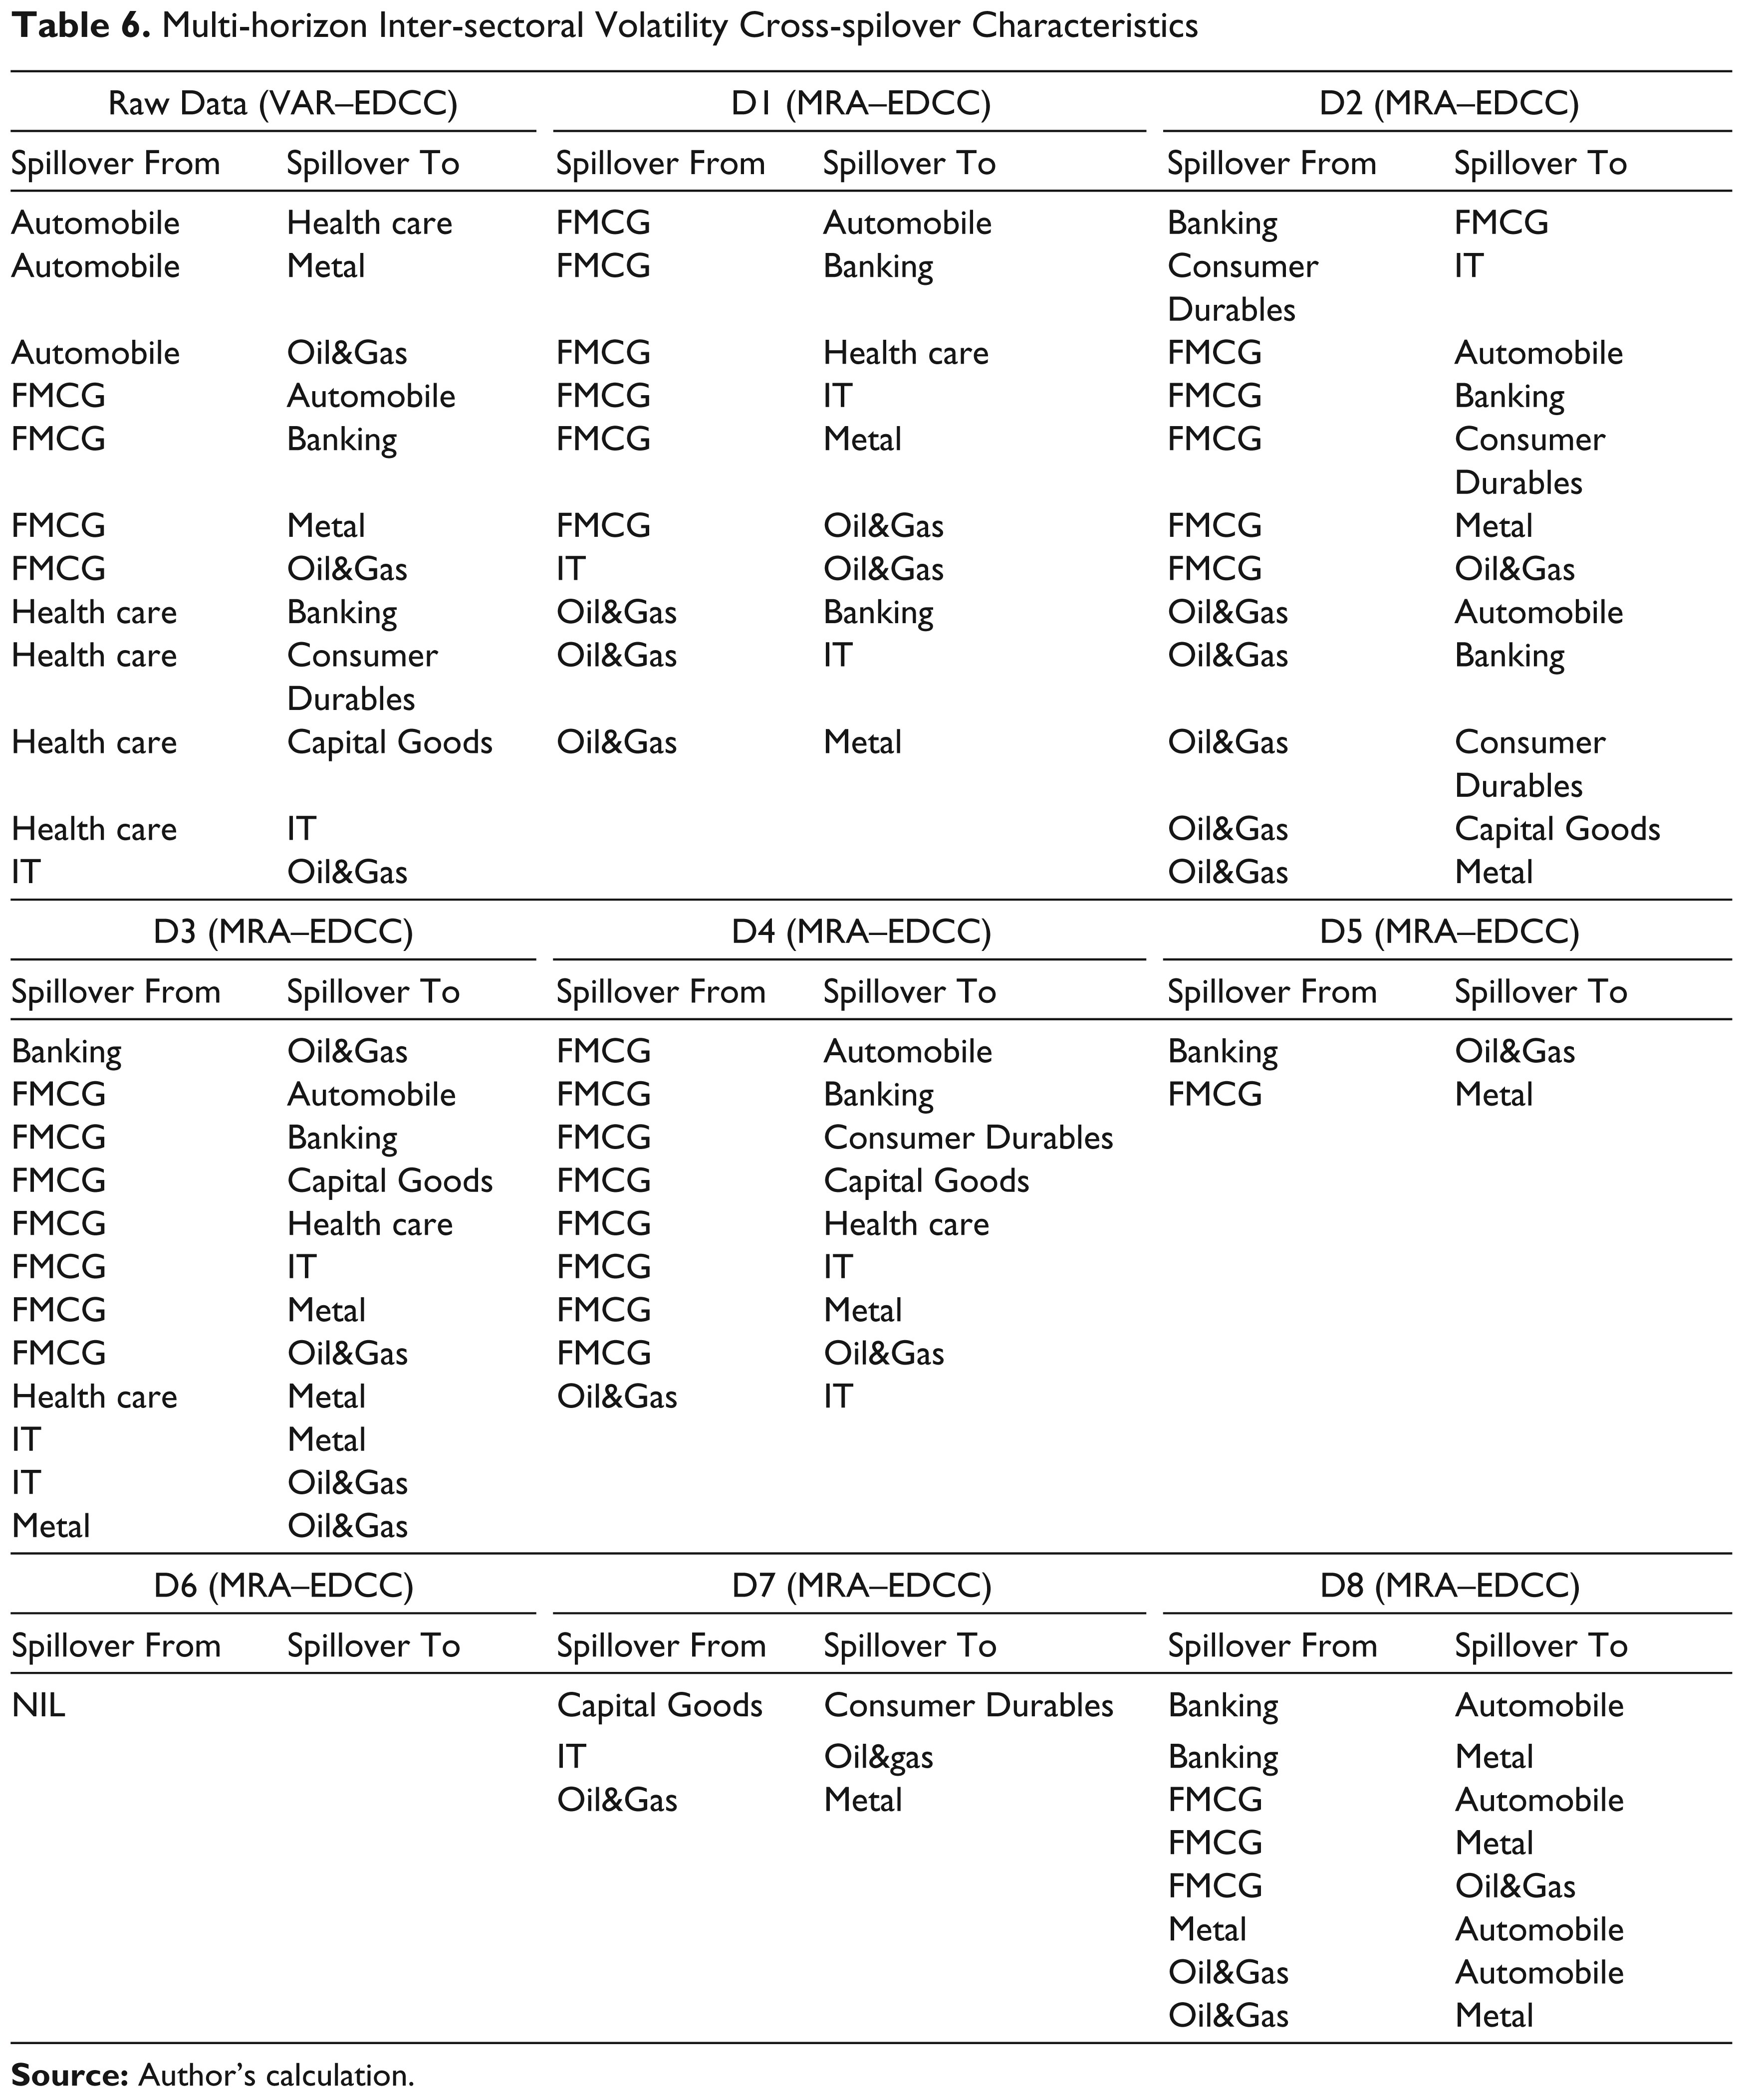
Following the screening process (as mentioned by the points 1 and 2 earlier) the inter-sectoral shock and volatility cross-spillover characteristics are traced and are reported in Tables 5 and 6, respectively. Under the headings ‘raw data’ in the tables, the significant spillover incidences from the scale invariant VAR–EDCC GARCH model are reported. Under the headings from D1 to D8, the significant spillover incidences from the scale dependent MRA–EDCC GARCH model across scales 1 to 8 respectively are displayed.
Multi-horizon Inter-sectoral Shock Cross-spilover Characteristics
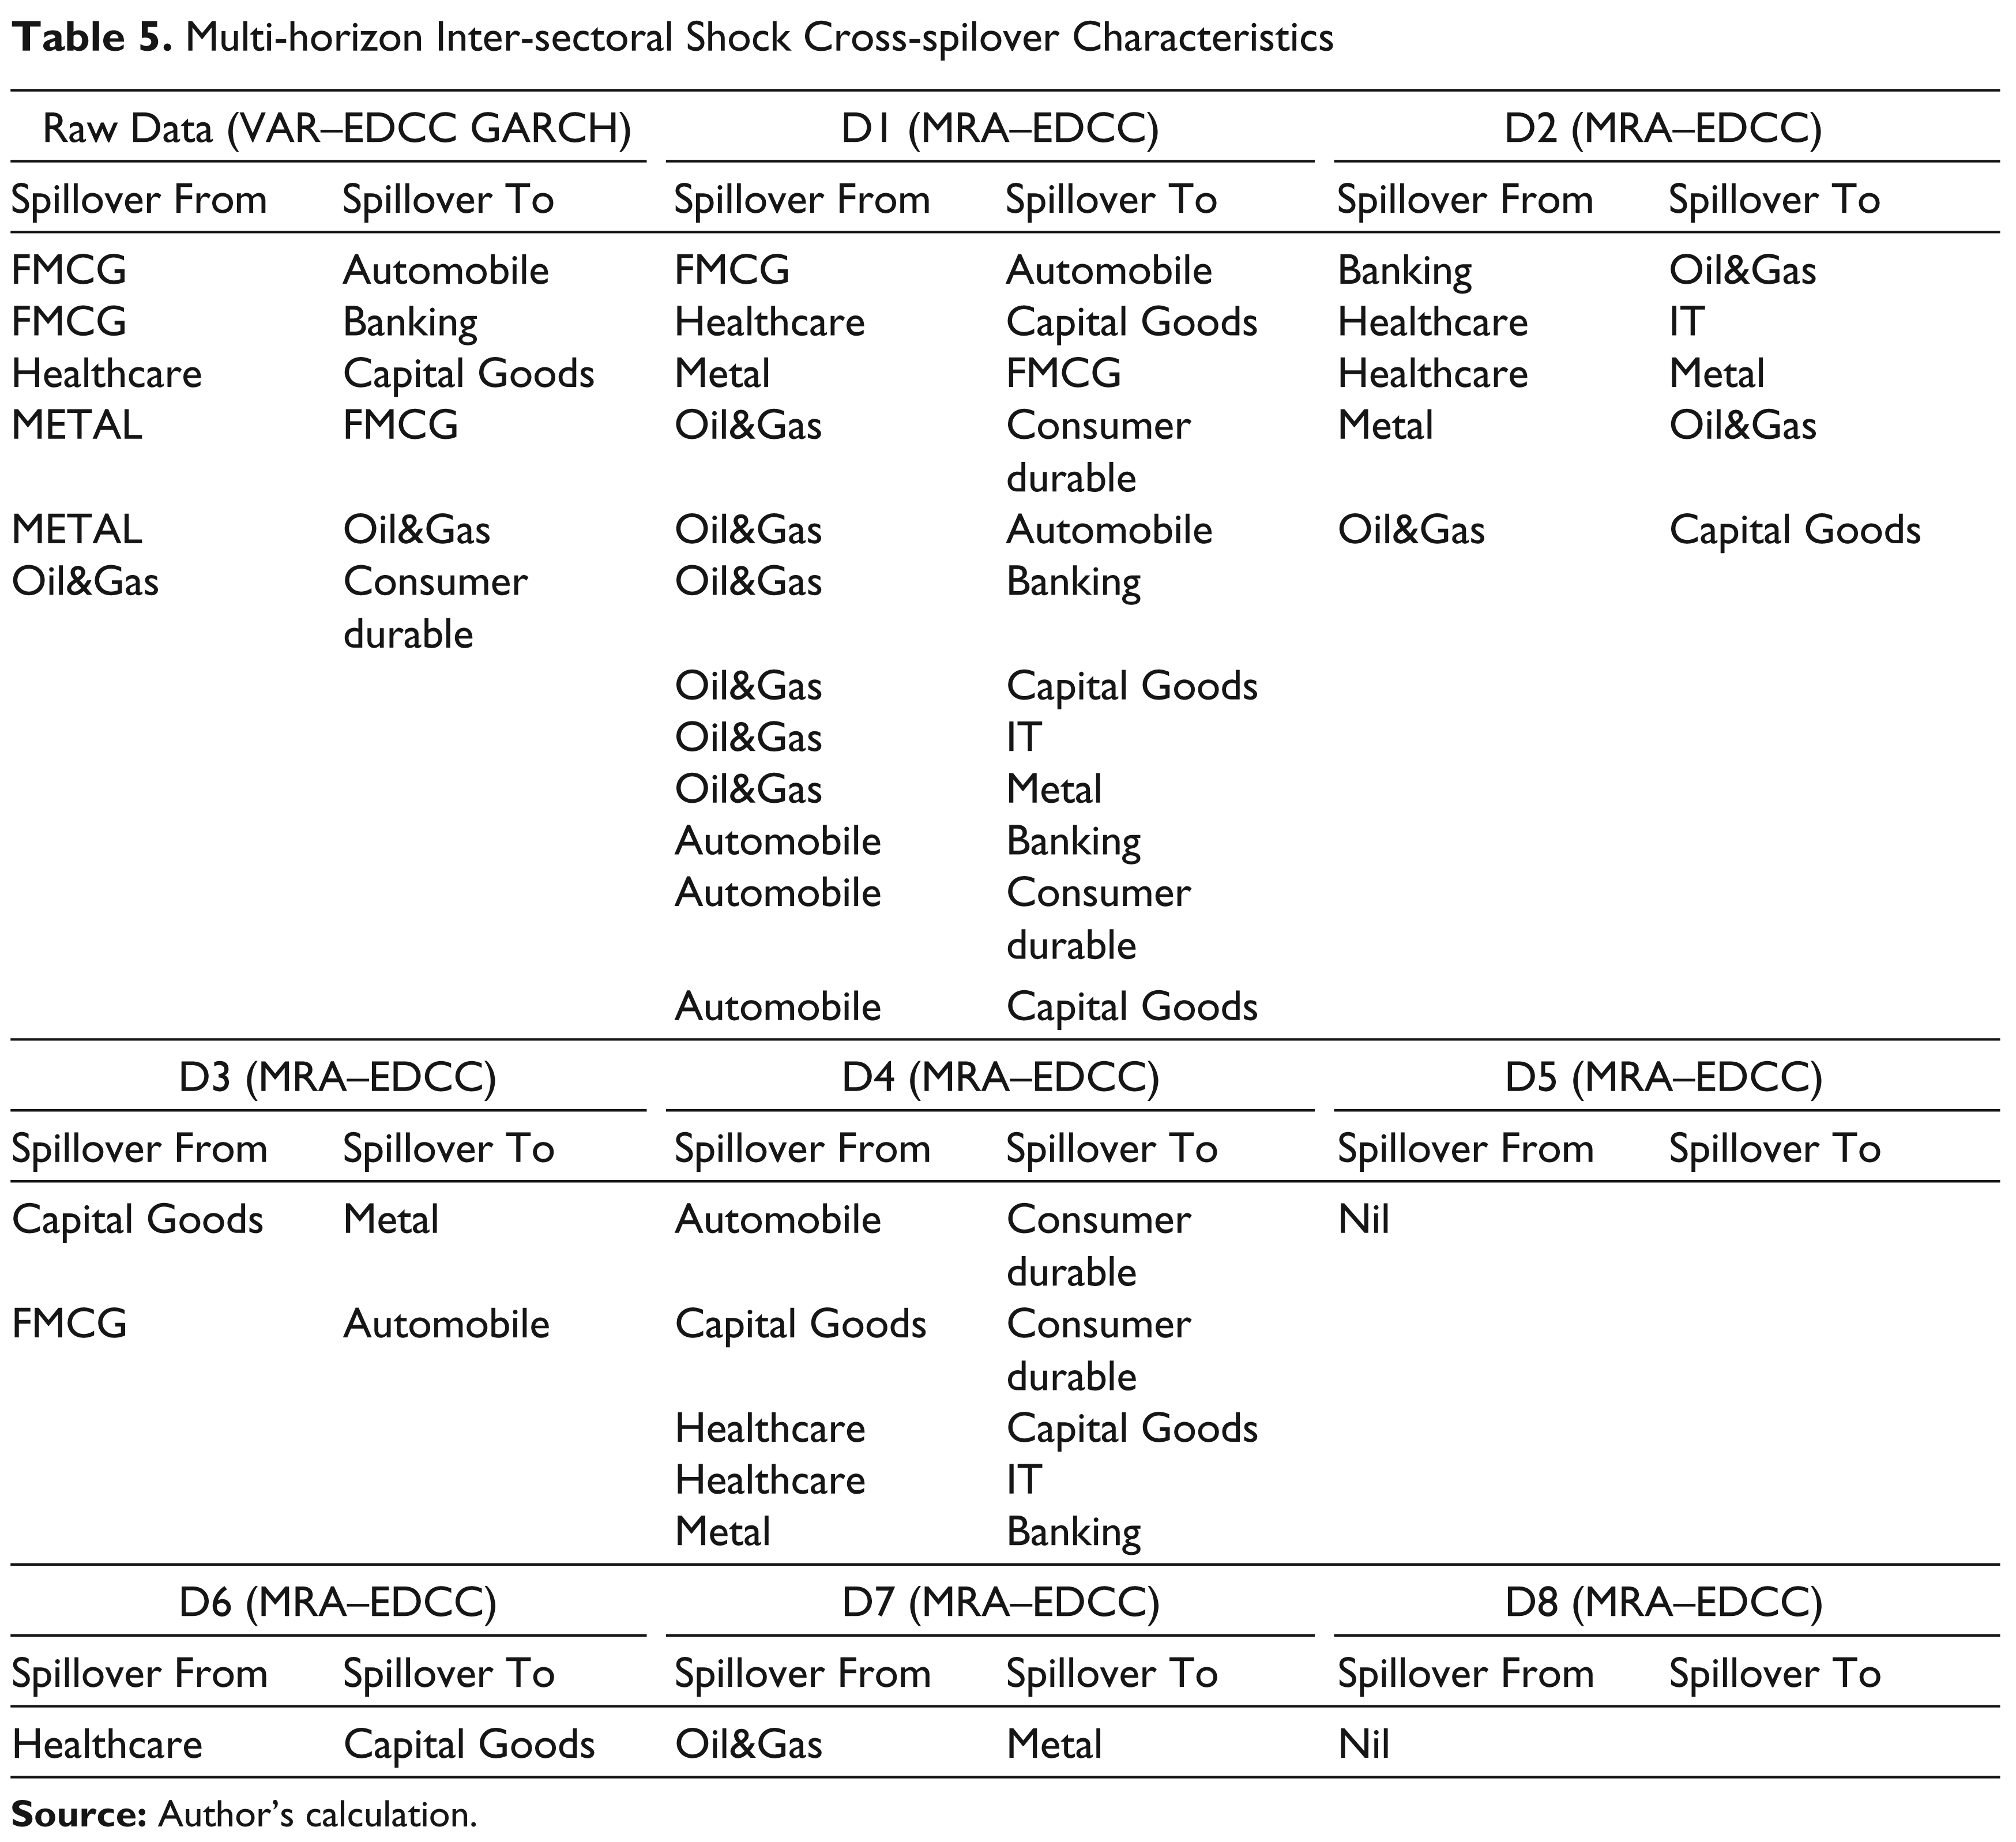
The Tables 5 and 6 reveal that the spillover characteristics obtained from the VAR–EDCC GARCH model is different from that obtained from the MRA–EDCC GARCH model which indicates that the traditional methodology may not be sufficient in understanding the complex pattern of volatility interaction. For example, Table 5 divulges that significant shock spillover from the Oil&Gas sector to the six out of the remaining eight sectors are captured at scale 1 which is not visible when the VAR–EDCC GARCH methodology is used. Similar conclusion can be drawn for the Automobile sector wherein shocks pillover to the Banking, Consumer Durable and Capital good sectors are reported from the use of the MRA–EDCC GARCH model at scale 1 but not from the VAR–EDCC GARCH model. Table 5 reveals highest number of unidirectional shock spillovers at the highest frequency level (scale 1) while no shock spillover is detected when the investment horizon is greater than 1 year (scale 8). Moderate number of shock spillovers is detected at the intermediate scales (scales 2–7). These findings are in perfect agreement with the theory which states that short-term trader trade primarily on information and are mainly responsible for the shock transmission. Long-term (greater than 1 year) trader relies on fundamentals rather than idiosyncratic information and is least likely to induce shock spillover. Intermediate scale trader trade based on both the incoming information and fundamentals and contributes to the shock spillover to a certain extent. Table 6 displays that volatility spillover is present at all scales with an exception at scale 5. Significant variations in the sectoral spillover are observed across the different scales which buttress the hypothesis that the volatility spillover is scale dependent. FMCG sector is found to exert volatility spillover across all scales while spillover incidences from Oil&Gas sector is revealed only from the time-scale analysis and not from the traditional model. Higher number of volatility spillover incidences are detected at the lower (1–4) and higher (8) scale while the intermediate scales (5–7) records relatively lower number of spillover incidences.
Multi-horizon Inter-sectoral Volatility Cross-spilover Characteristics
Conclusion
The article investigated the nature and direction of shock and volatility transmission among the 9 non-overlapping sectoral indices of BSE across 8 different scales (from 2–4 days to 1–2 years) using a newly developed wavelet-based MRA–EDCC GARCH model and compared the results with that of a traditional VAR–EDCC GARCH model. The study reveals that the volatility interaction is scale dependent. Significant variation in the magnitude and direction of the spillover incidences are observed from the results of the two models which indicates that the traditional VAR–EDCC GARCH model may not be sufficient in unlocking the complex pattern of volatility interaction and the multiscale analysis can be further used to extract the hidden information. Shock spillover incidences are found to decrease with scale while the volatility spillover is found to vary both in magnitude and direction across scales. These results are significant from risk management’s point of view. Previous literatures have established that volatility interaction among financial assets can be leveraged successfully in designing trading strategies that generates better results in comparison to the trading strategies that does not employ volatility interactions in their model (Harris et al., 2006; Pardo and Torro, 2007 for details). These trading strategies rely on taking a position in one asset following the signals given by the volatility of the other asset. A proper understanding of the direction and magnitude of volatility interaction is thus imperative to successful designing of such strategies. Given the findings of this article that the magnitude and direction of the interaction changes with the change in investment horizon, it can be concluded that a strategy calibrated for short-term traders may not be optimal for long-term traders and vice versa. Heterogeneous agents should consider the interaction characteristics pertaining to their investment horizon before calibrating their customised hedging and trading strategies.
Footnotes
Acknowledgements
The authors are grateful to the anonymous referees of the journal for their extremely useful suggestions to improve the quality of the article. Usual disclaimers apply.