
Abstract
The technologically intensive nature of the predictive maintenance (PdM) method restricts its use to companies with higher turnover. This research is aimed to propose a PdM model for an N-component repairable system by integrating non-homogeneous Poisson process (NHPP) models and a system availability concept such that the use of technology is minimized, thereby extending its applicability to companies with lower turnover. It is known that manufacturing systems show reliability degradation with repeated overhauls and component replacements. This has the effect that the mean time between failures (MTBF) is non-identically distributed. Hence, the failure pattern of each component is analyzed using NHPP models and the mean system availability is calculated, which is now compared with the threshold system availability deciding the overall maintenance of the system. Further, the developed model is validated on a wheat flour mill.
Introduction
It is a well-known fact that any manufacturing system degrades with time and needs maintenance after a certain interval in order to maintain the required level of production. Maintenance is a set of activities performed in order to maintain the required performance level of any manufacturing system/machine. Maintenance can be broadly categorized under three main headings: First is corrective maintenance, where maintenance is carried out when the machine has failed (Ahmad & Kamaruddin, 2012; Bevilacqua & Braglia, 2000). Second is preventive maintenance, where maintenance is performed at regular intervals in order to avoid machine breakdowns (Joo & Min, 2013; Moghaddam & Usher, 2011; Yeh, Kao & Chang, 2009; You, Li & Meng, 2011; Zhao, 2003). Third is predictive maintenance, where the health of the system is continuously monitored using sophisticated equipments and maintenance is performed only when required by the state of the system/machine (Chu, Proth & Wolff, 1998; Costa, Carnero & Oliveira, 2012; Dieulle, Berenguer, Grall & Roussignol, 2001; Hsiao, Drury, Wu & Paquet, 2013; Moya, 2004; Neves, Santiago & Maia, 2011; Silva, Negrao, Junior & Bobi, 2012). In corrective maintenance, the machine/machines is in a highly degraded state, prolonging the maintenance time, while preventive maintenance entails a higher frequency of maintenance, resulting in more than required maintenance, thereby increasing machine down time. Predictive maintenance supersedes the two maintenance types by performing maintenance only when required by the system/machine, thus optimizing the maintenance time, resulting in high availability, reliability, maintainability and productivity of the plant/machine (Beltran & Lopez, 2000; Carnero, 2006; Christer, Wang & Sharp, 1997; Dasgupta, Gupta & Sahay, 2011; Hu, Zhang & Liang, 2012; Jamali & Nor, 2012; Kakkar, 1999; Lupinucci, Perez, Davila & Tiseyra, 2000; Shahin, Shirouyehzad & Pourjamad, 2012; Tan & Raghavan, 2008; Villar, Masson & Games, 2000).
Past studies have established the superiority of predictive maintenance over other forms of maintenance, but still its application in companies is restricted to a countable few. There are two main hurdles encountered in the practical implementation of predictive maintenance: First is the absence of a predictive maintenance model on which it could be based (Tan & Raghavan, 2008) and second is the high cost of sophisticated predictive maintenance technology (Wendai & Daescu, 2002). High cost of predictive maintenance technology restricts its usage to a small group of companies enjoying high turnover (more than ₹ 1,000 crores). Moreover, companies with low turnover (less than ₹ 1000 crores) are unable to reap the benefits of predictive maintenance, as they are unable to afford the costly predictive maintenance technologies.
Objective of the Article
The objective of the article is to develop a predictive maintenance model that minimizes the use of costly predictive maintenance technologies in order to extend its applicability to companies with low turnover (less than ₹ 1,000 crores). This article proposes a predictive maintenance model for an N-component repairable system by integrating non-homogeneous Poisson process (NHPP) models and system availability concept such that the use of costly predictive maintenance technology is minimized.
In the following section, literature study on predictive maintenance policy is discussed. Subsequently, a predictive maintenance framework and methodology is proposed. The fourth section demonstrates the application of the proposed methodology on a wheat flour mill. Finally, the general conclusion is presented in the fifth section of this research article.
Literature Review
In the past, several predictive maintenance models have been developed employing different predictive maintenance technologies such as vibration analysis, thermography and sensors. The technologically intensive nature greatly increases the cost of predictive maintenance (Wendai & Daescu, 2002) and restricts its use to companies with higher turnover, while small scale industries are unable to reap the benefits of the predictive maintenance technique. Several predictive maintenance models developed by researchers using vibration analysis, thermography and sensors are shown in Table 1.
Technology-based Predictive Maintenance Models

Methodology
Here, an N-component repairable system is considered for study, where the failure of any component causes system downtime, in other words, it can be considered that the N-components are in series. Figure 1 depicts the proposed framework for predictive maintenance of N-component repairable system.

The following steps are involved in the proposed framework:
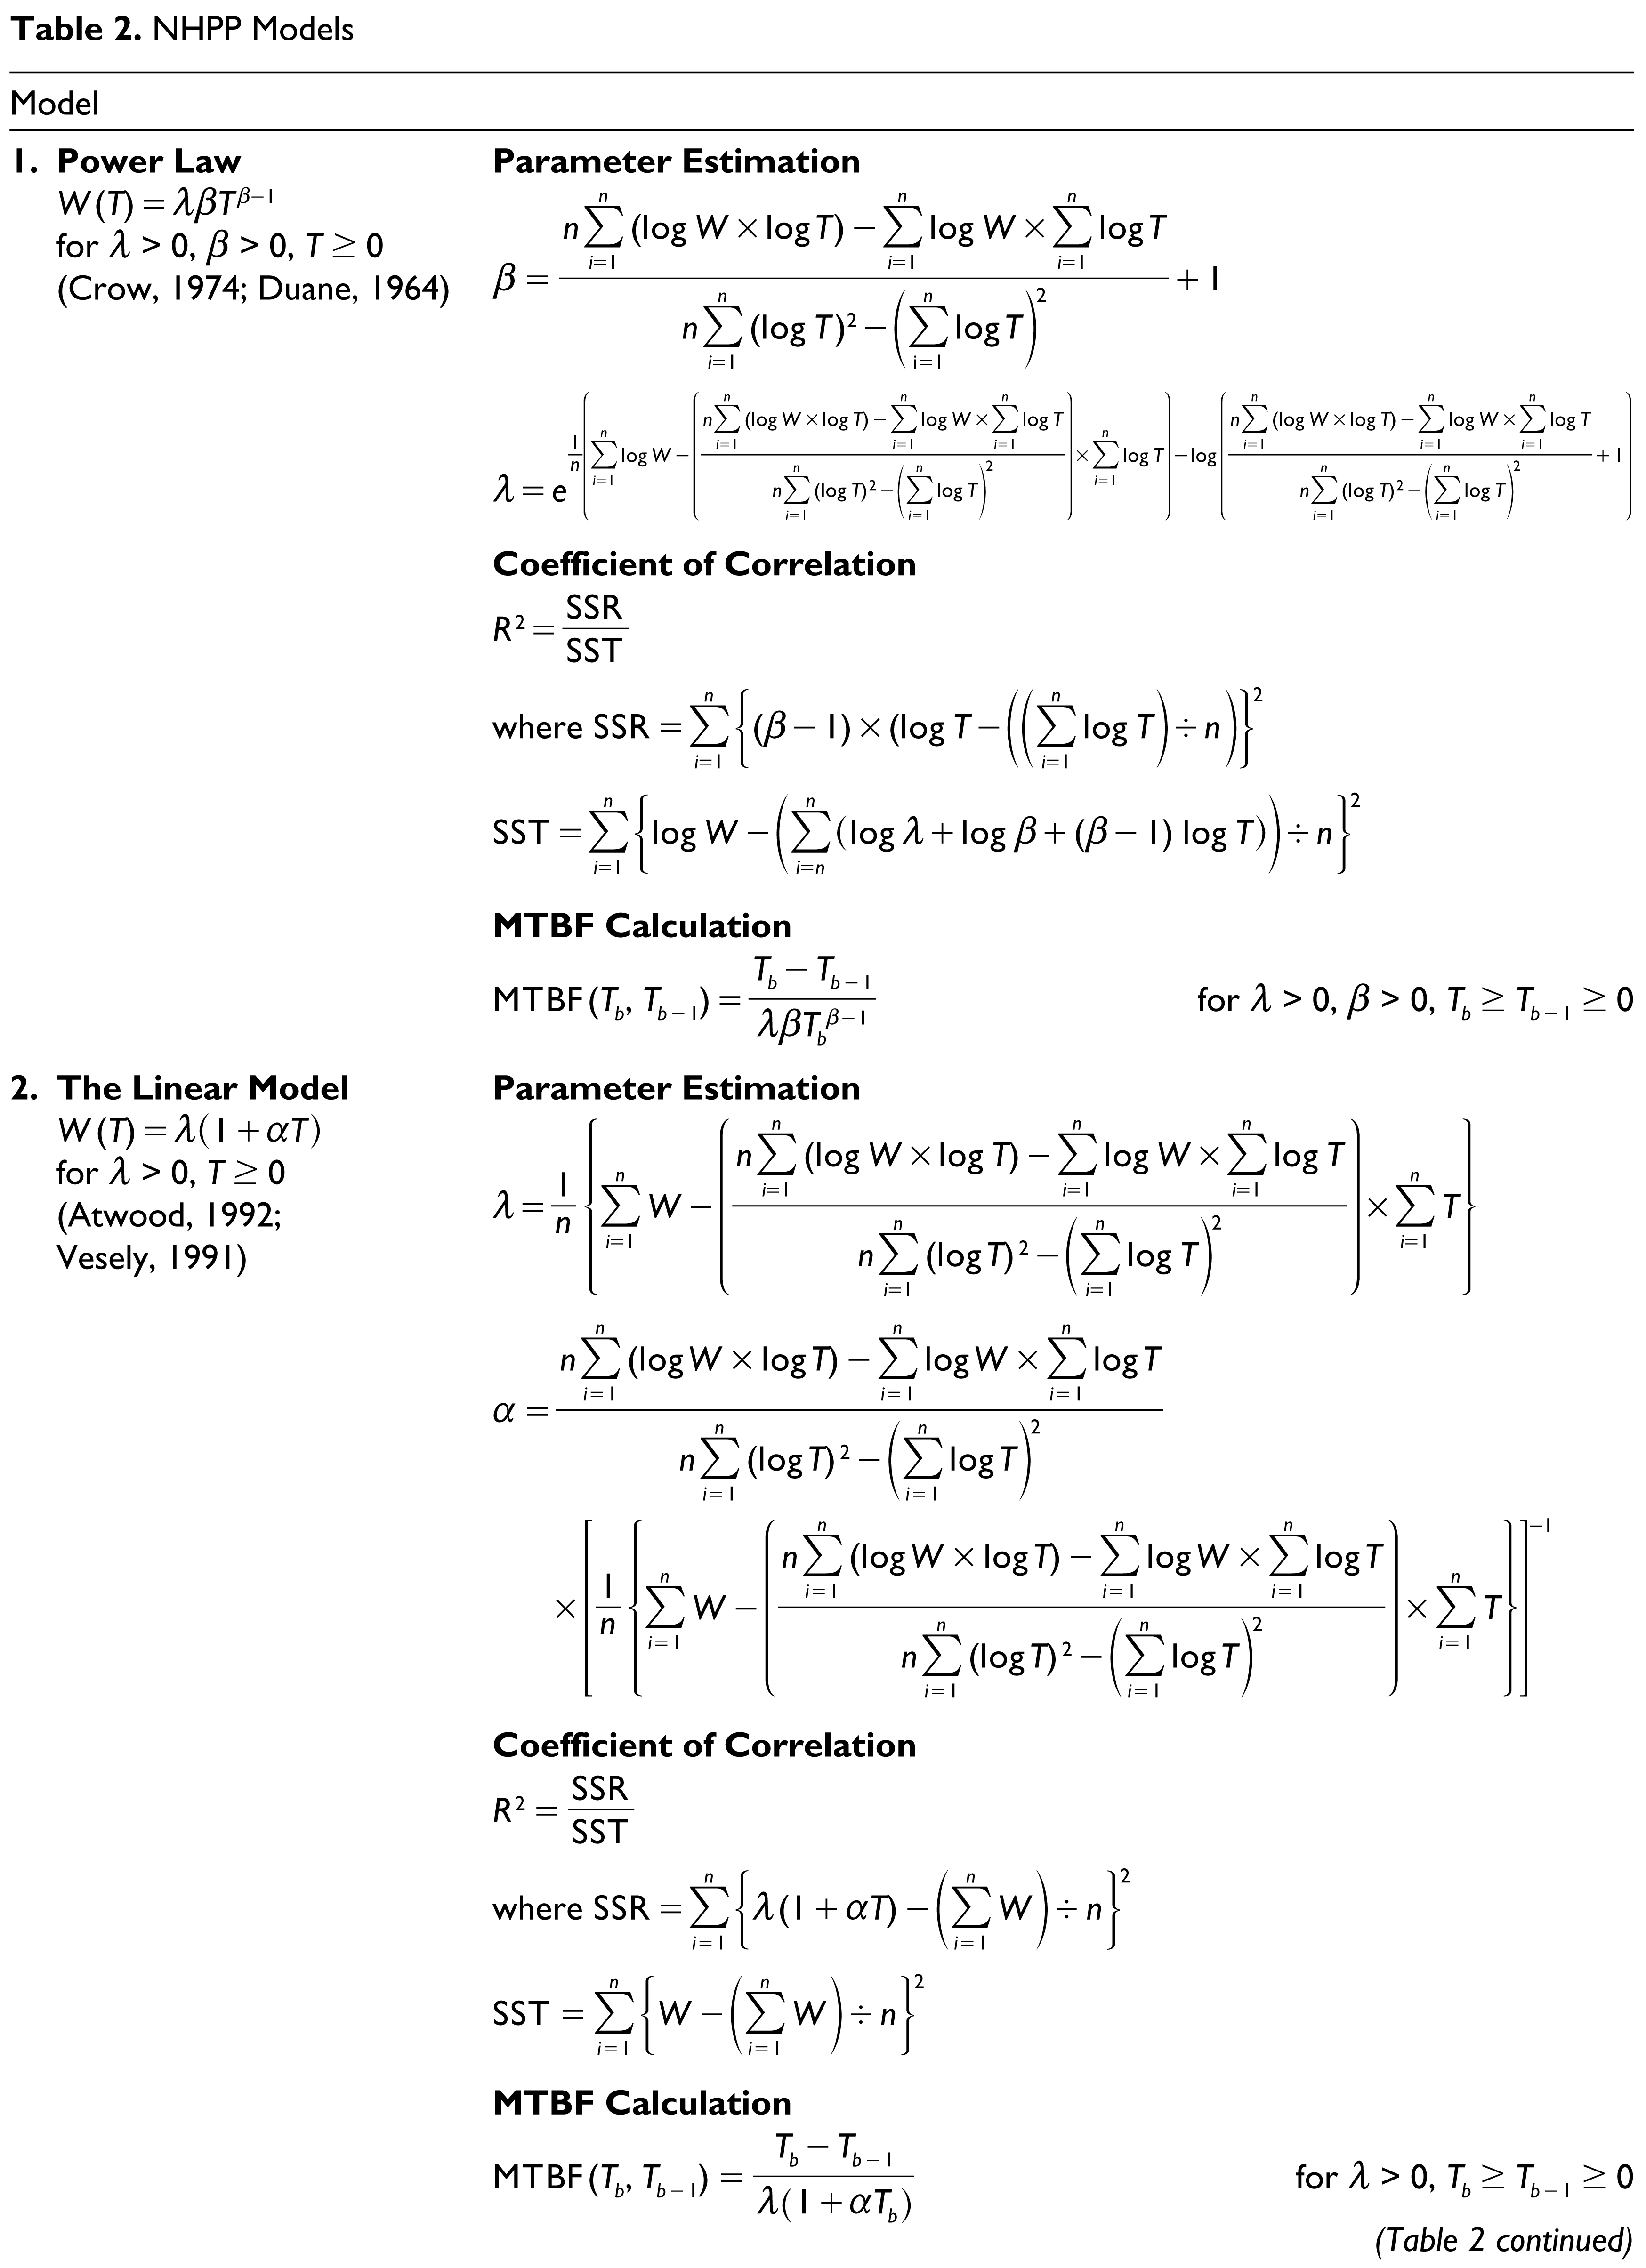
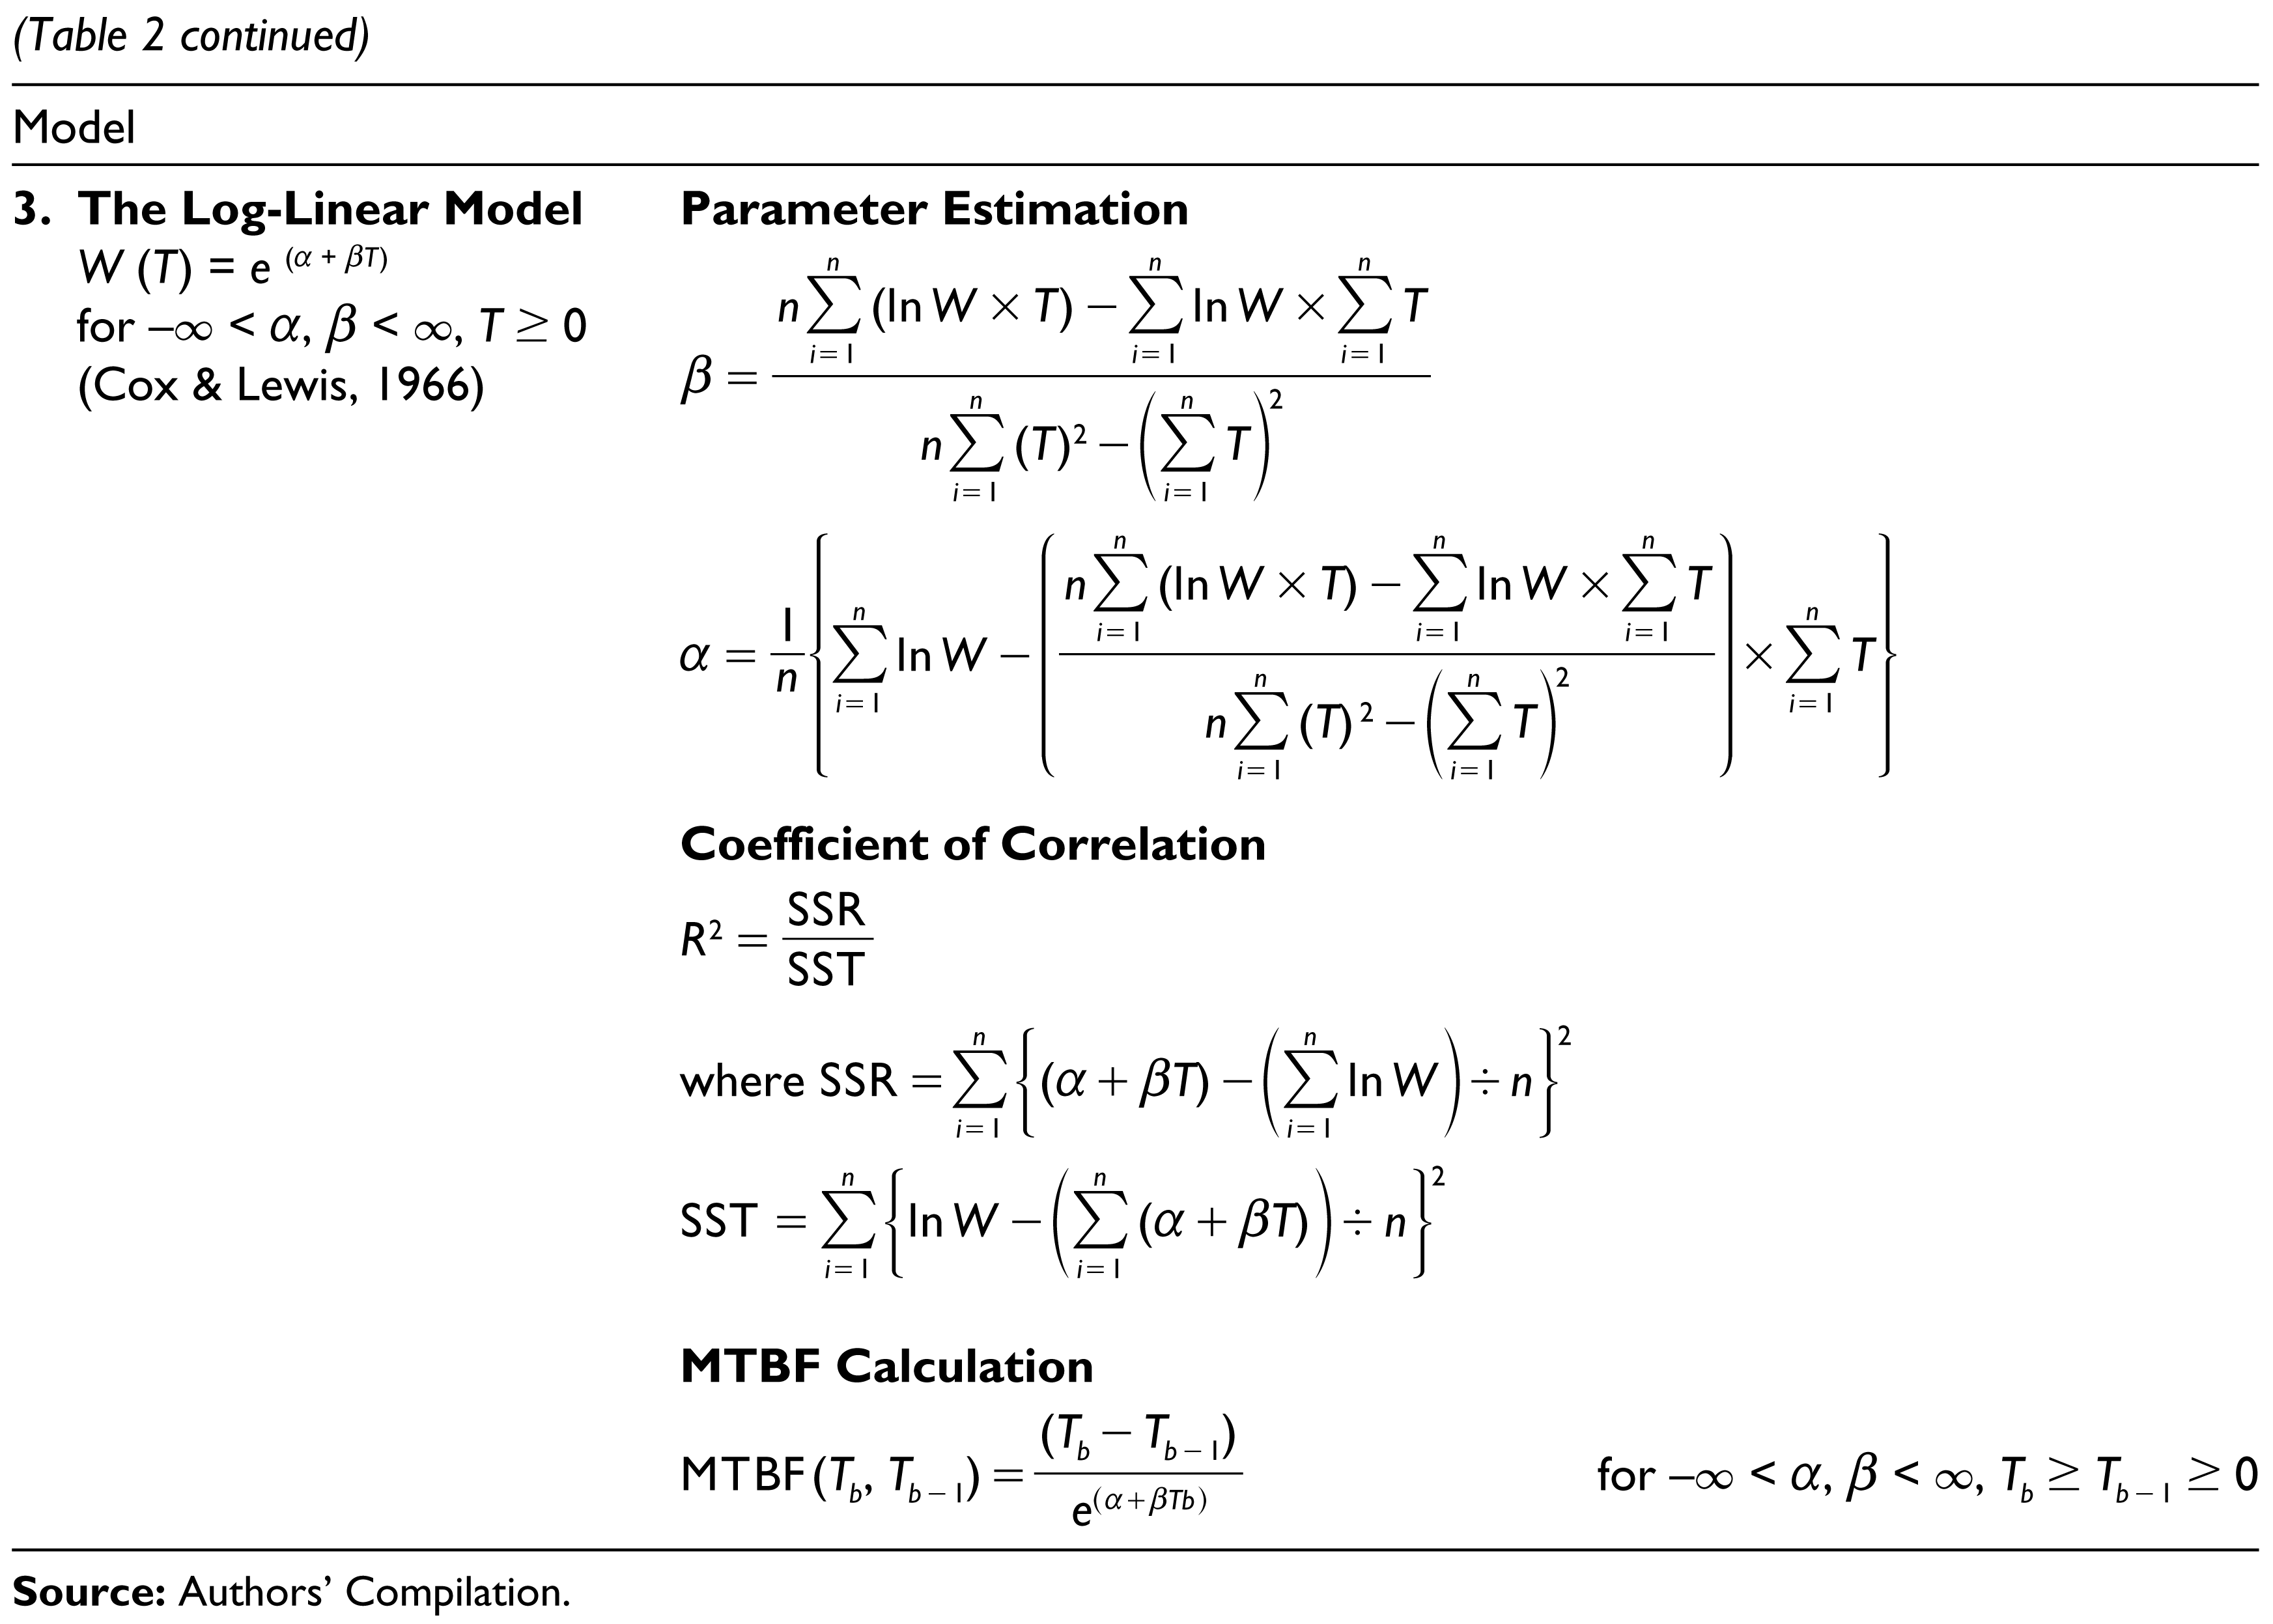
Step 1: Failure data generated from all the stoppages of the system is collected. Data contains all the information such as failure time, component failed and reasons of failure. Step 2: Many systems show reliability degradation with repeated overhauls and component replacements, so that the failure rate or MTBF for each component is not identically distributed and hence data collected in step 1 is analyzed using NHPP models. The well-established and tested formats of NHPP models have been used for analysis and are discussed here:
The following notations are used: W(T) is the failure rate; λ the scale parameter of NHPP model; β the shape parameter of NHPP model; α the improvement parameter of NHPP model; R(T) the reliability function; N(T) the number of failures in (0,T); n the number of observed failures; R2 the coefficient of correlation; SST the total sum of squares; SSR the regression sum of squares; SSE the error sum of squares.
The model with highest coefficient of correlation is used for failure rate calculation of the individual component.
Step 3: Failure rate calculated in step 2 is used to calculate the system availability consisting of N-components in series. Here we assume that no two components fail at the same time. Considering failure rate to be Wi(T) and repair time of component to be Ri, where i denotes component 1 to n. Machine downtime (D) can be given as

where Uptime is the time for which the plant/machine is running.
NHPP Models
Availability so calculated is compared with the threshold availability of the system, and when the availability becomes less than or equal to threshold availability, overall maintenance of the system is performed. Threshold availability is calculated as

where Avg.(o/p) is the number of units produced in a year/number of working days in that particular year, T(o/p) the time taken to produce single unit of output and Ts the time taken for overall maintenance of the system.
Model Application: A Case Example
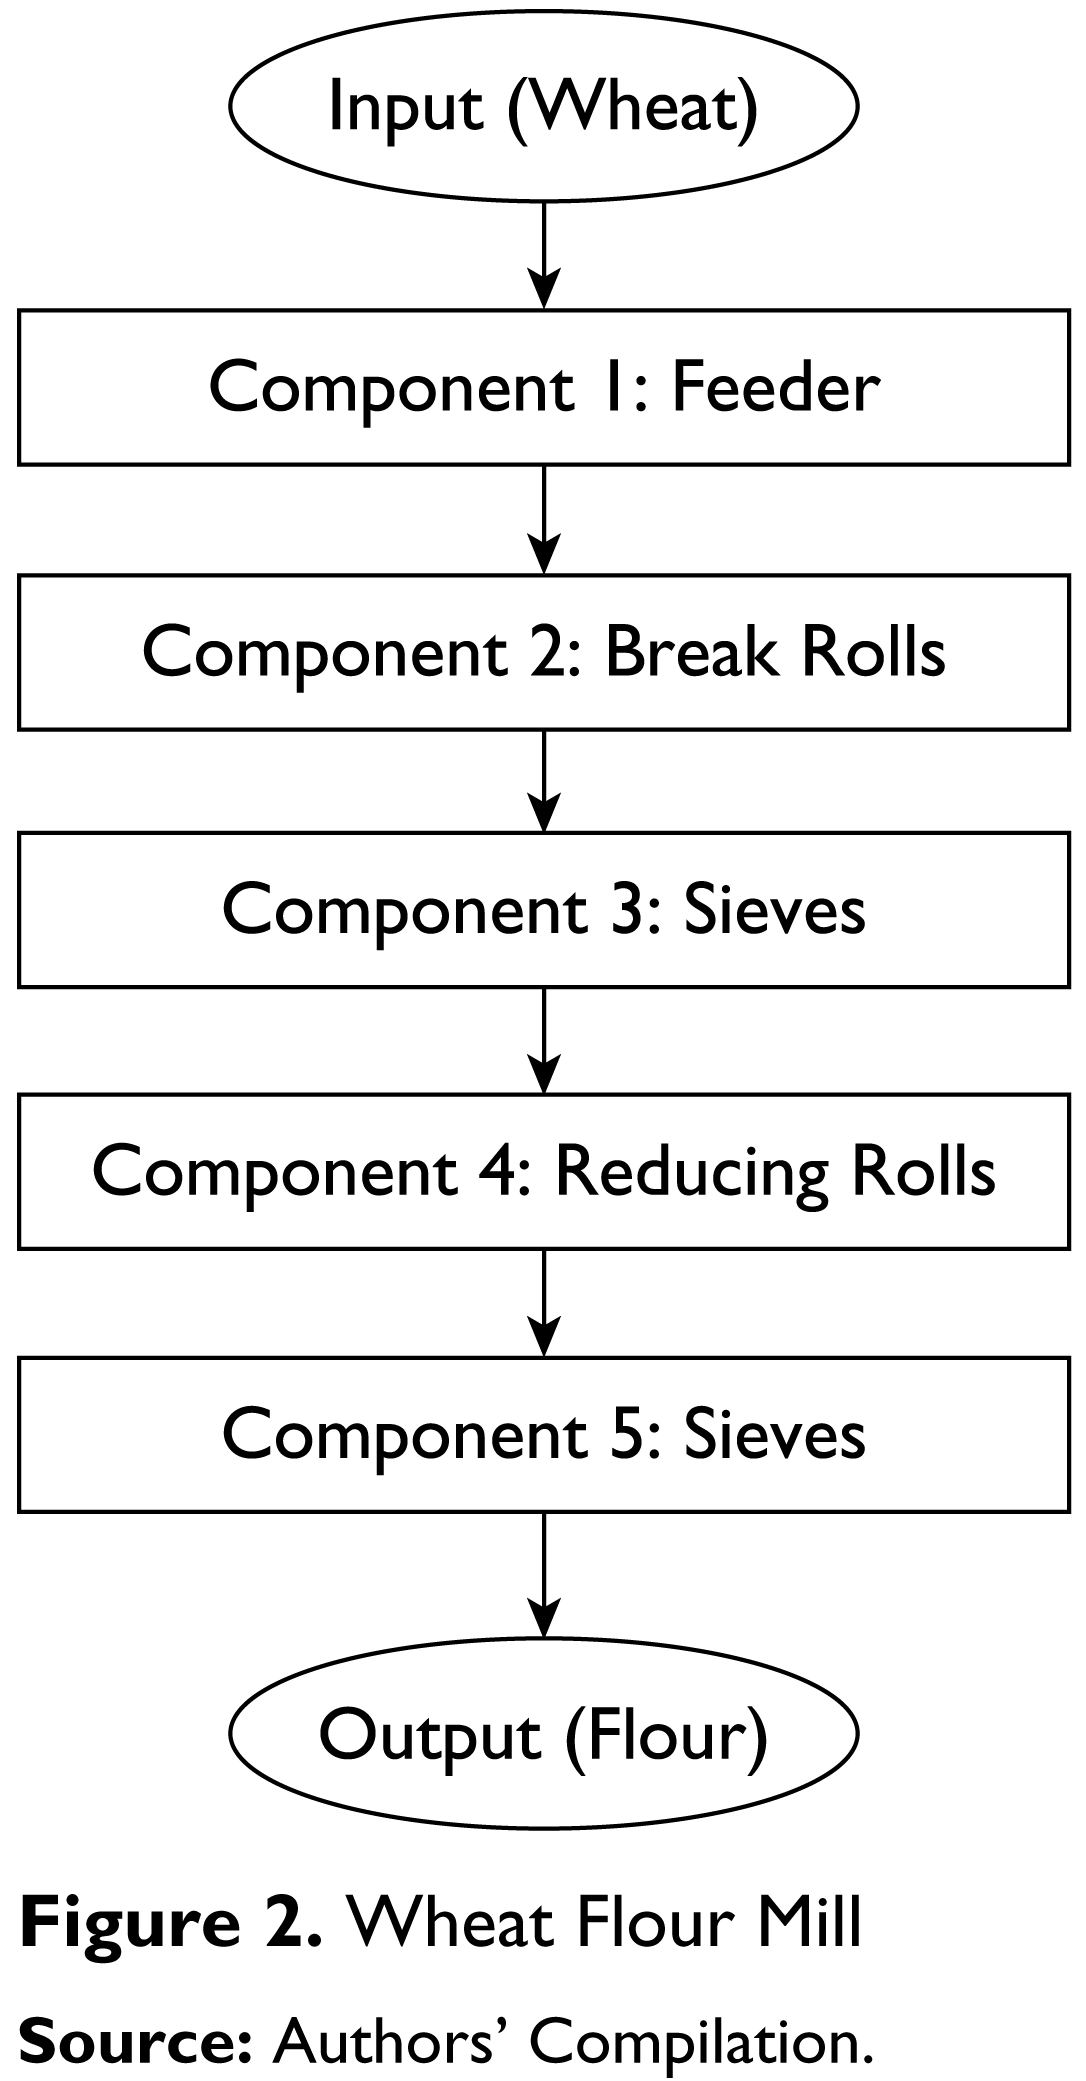
Here, a case example of a wheat flour mill is considered, which basically consists of five components: feeder, break rolls, sieves, reducing rolls and sieves. The mill has a capacity of producing 6 tonnes of flour every day, operating 10 hours a day and 6 days a week. The organization follows a scheduled maintenance policy in which the overall maintenance of the machine is done on every 30th day of the operation. Figure 2 shows the schematic diagram of the wheat flour mill.
Step 1: Failure data generated from all the stoppages of the flour mill is collected. Data contains all the information such as
Failure time Component failed Reasons of failure.
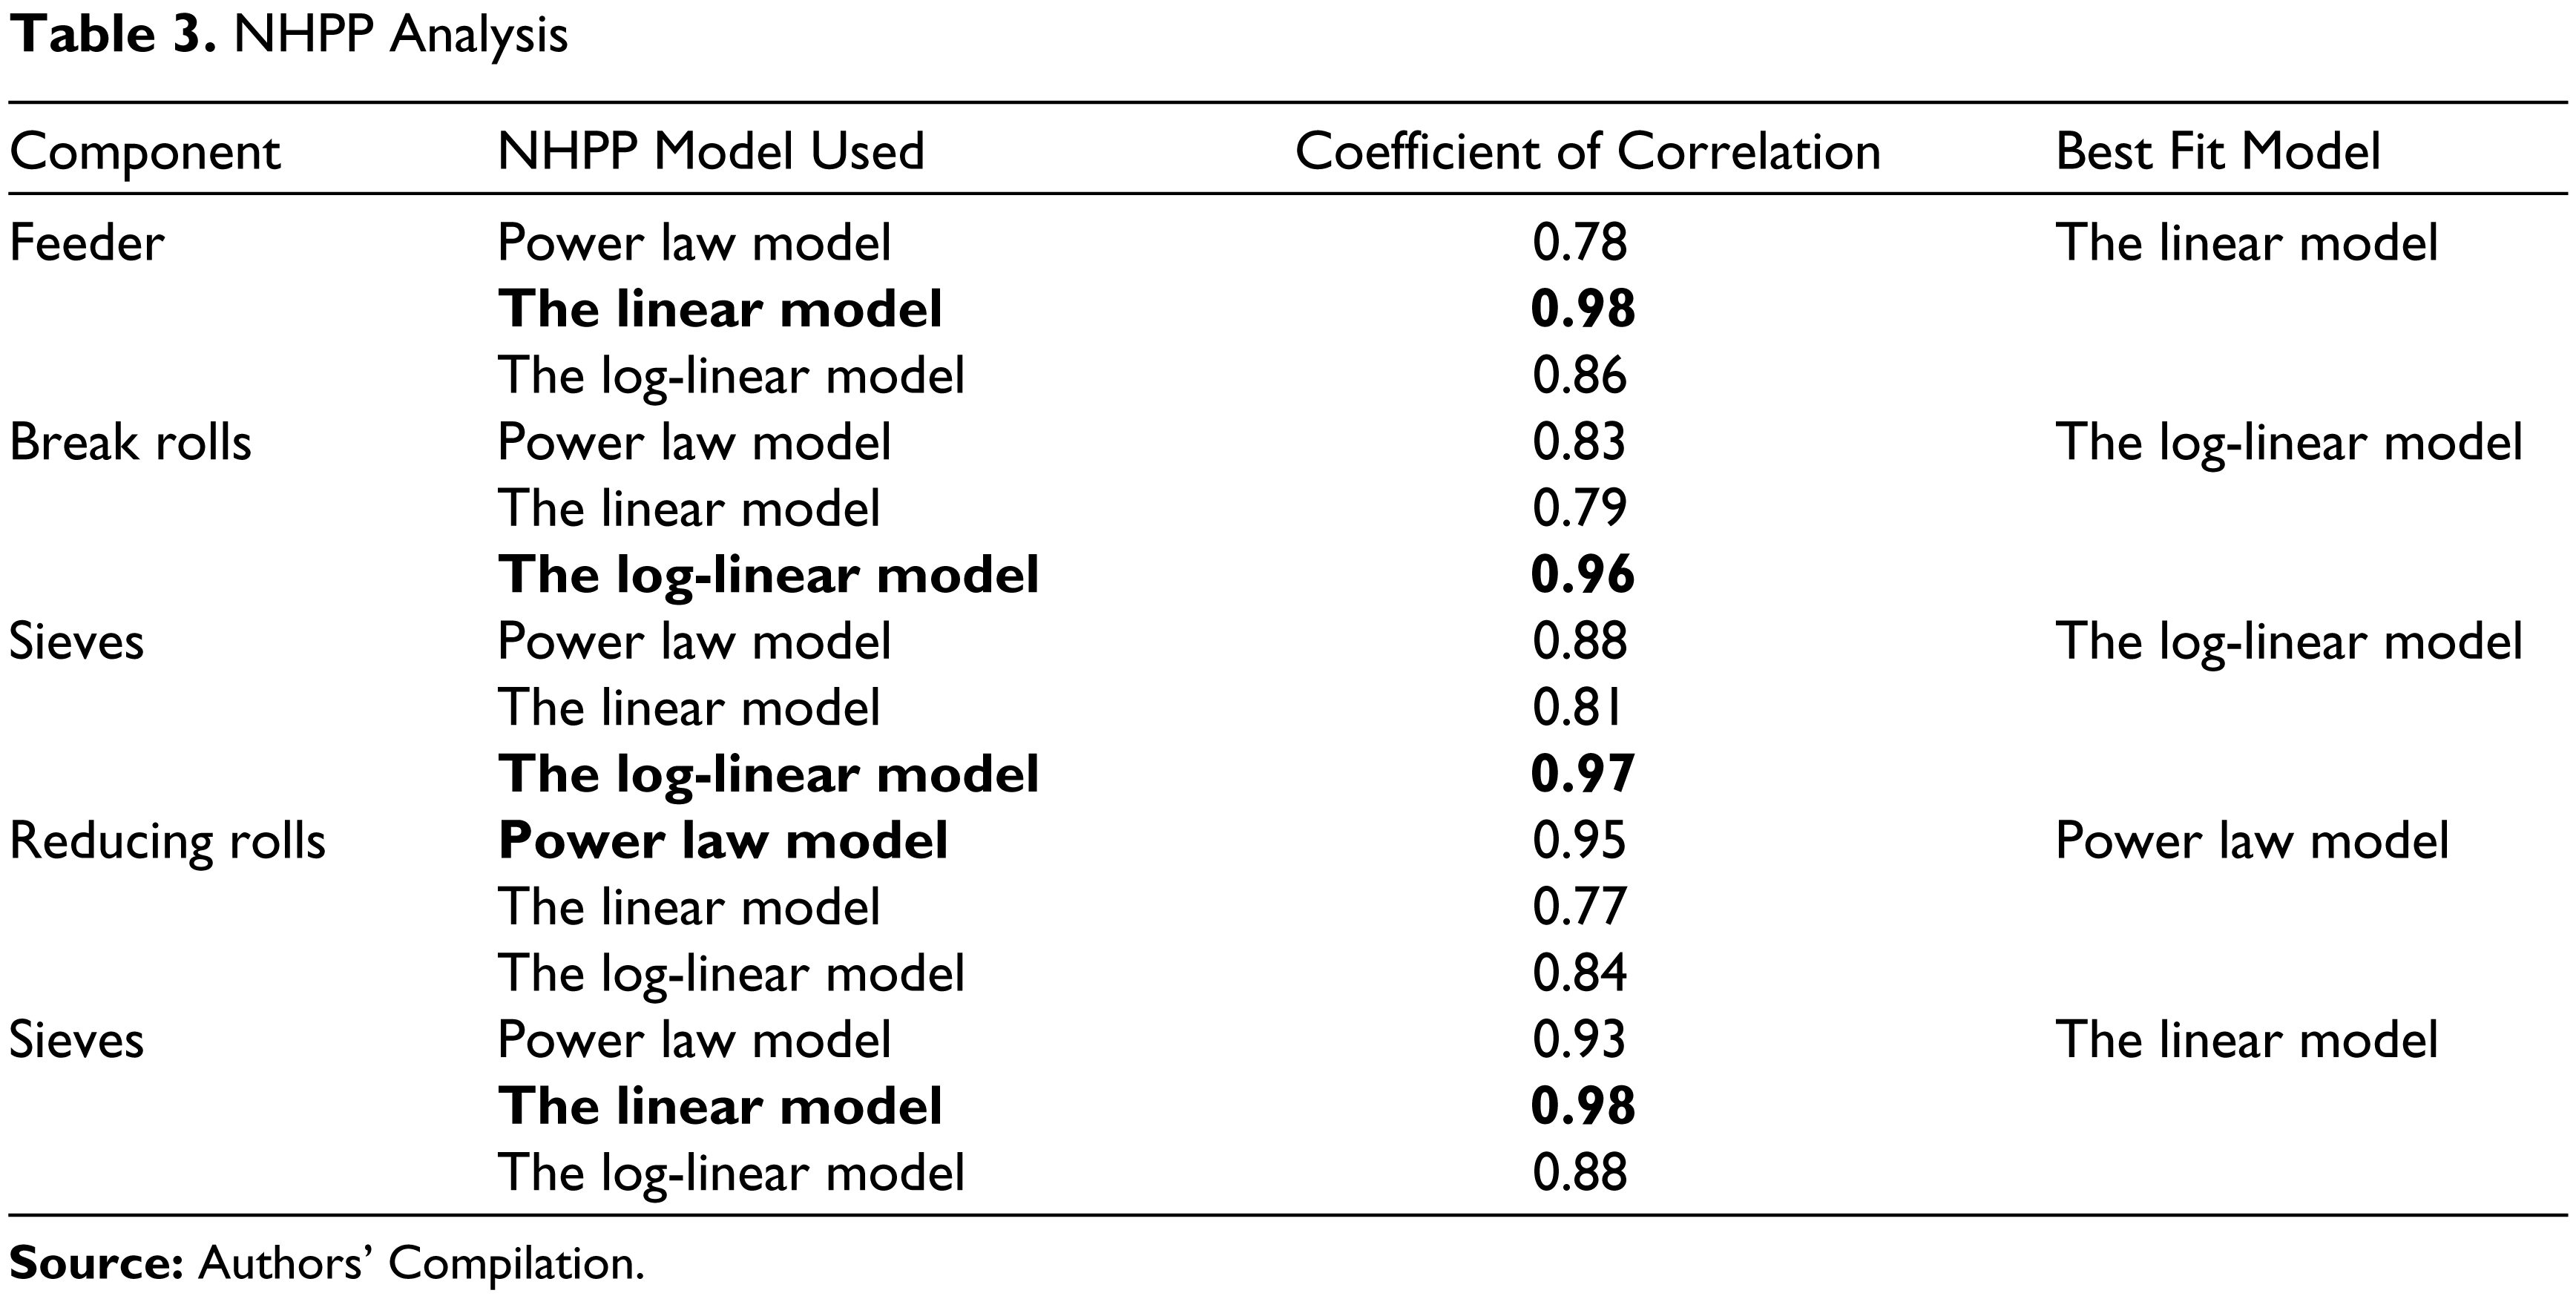
Step 2: NHPP models are used to analyze the failure data of all the components of the system. As shown in Table 2, the model with the highest coefficient of correlation is chosen for further calculation.
Sample calculation for coefficient of correlation (R2) is

For row one (feeder: power law model) in Table 2, SSR = 2.31 and SST = 2.96. Therefore, putting the values of SSR and SST in the formula for R2, we get

Step 3: In this step, we compute the system availability and compare it with threshold availability. Threshold availability is calculated using the annual demand of 1600 tonnes of flour and time taken for overall maintenance to be 10 hours. Threshold availability comes out to be 0.855. Availability calculated is compared with the threshold availability as shown in Table 3 as the system availability becomes equal to or less than the threshold availability when overall maintenance of the system is performed.
NHPP Analysis
From Table 4, we observe that the developed methodology advocates the overall maintenance of the system on the 46th day of operation, instead of the 30th day.
Comparison of System Availability and Threshold Availability

Conclusion
In this article, a new methodology of predictive maintenance using NHPP models and system availability concept is proposed. The proposed methodology bypasses the use of sophisticated and costly condition monitoring equipments for continuous monitoring of conditions of machines and is simpler to adopt in practical cases. This methodology identifies the appropriate NHPP model to explain the failure distribution, which is used to compute the system availability and hence decide the overall maintenance time of the system by comparing it with threshold availability. The methodology so developed is applied in a real life situation for deciding the maintenance policy of a wheat flour mill in India. The methodology suggests that the overall maintenance of the wheat flour mill is to be performed on the 46th day instead of the 30th day, as was earlier performed by the organization, hence reducing the unnecessarily higher frequency of overall maintenance as well as the maintenance cost to the company.
Directions for Future Research
To check the robustness of the model developed in this article, further research on the applicability of this model in other industrial systems/industries may be carried out.
Footnotes
Acknowledgements
We are thankful to the anonymous reviewers for their valuable suggestions, which helped to improve the content and readability of this research article.