



Abstract
This study’s main objective is to explore the antecedents of consumer switching behaviour in the context of mobile industry. At the same time, this study gives a closer focus on the roles that brand personality (BP) and perceived product quality play in customer satisfaction (CS), consumer brand identification and switching behaviour. Using a self-structured questionnaire, 381 usable responses were recorded for data analysis. Exploratory factor analysis (EFA), confirmatory factor analysis and structural equation modelling were employed to analyze the data. The EFA outcome reveals that excitement, competence and sophistication are the most significant qualities predicting BP in the mobile industry’s context. The result demonstrates that BP, indirectly through consumer brand identification and customer satisfaction, has a negative effect on consumer’s switching behaviour intention. Perceived product quality has a direct and indirect relationship with switching behaviour intention. Finally, it is revealed that BP has high impact on perceived product quality’s evaluation as well.
Keywords
Introduction
The role of the mobile phones in people’s everyday lives is ubiquitous. Not only have mobile phones changed the way people communicate (short message service [SMS], video calls, etc.) but they also are a platform through which individuals can exchange ideas and information, and participate in virtual environments (Isaid & Faisal, 2015). Since the mobile phone industry is very intense, and consumers are exposed to plenty of products in the market, consumers are inclined to switch from one product to another. This switching behaviour is a major concern for marketers and consumer analysts, who are trying to identify ways to engender less switching behaviour.
Much research has been conducted on SBI (switching behaviour intention); for instance, a study by Coyles and Gokey (2002) revealed that dissatisfaction is a key indicator of consumer switching behaviour in the insurance industry, while a study by Kelley, Hoffman and Davis (1994) showed that service failure is the key determinant of consumer switching behaviour in the retail industry. A study by Srivastava and Sharma (2013) revealed that customers’ satisfaction with service quality is a great indicator in preventing consumers switching behaviour. Nevertheless, to the best of our knowledge, no study has examined the direct and indirect effects of perceived product quality, as well as brand personality (BP), on switching behaviour. Moreover, to the best of our knowledge, no study has considered the role of BP and consumer brand identification in switching behaviour; hence, this study attempts to bridge these gaps. These research gaps can lead to significant research questions that can be very interesting for scholars of the consumer behaviour, marketing and branding fields. These questions can help scholars understand how mobile phone users assess BP, consumer brand identification and perceived product quality, and how they affect consumers’ subsequent behaviour.
The current study’s ultimate goal is to help policymakers, global business strategists, managers and scholars understand the relations between brand personality and switching behaviour by means of customer satisfaction (CS) and consumer brand identification. The research also attempts to highlight perceived product quality’s significant role and its relationship with CS, which eventually leads to greater consumer brand identification and negatively impacts mobile phone users’ switching behaviour.
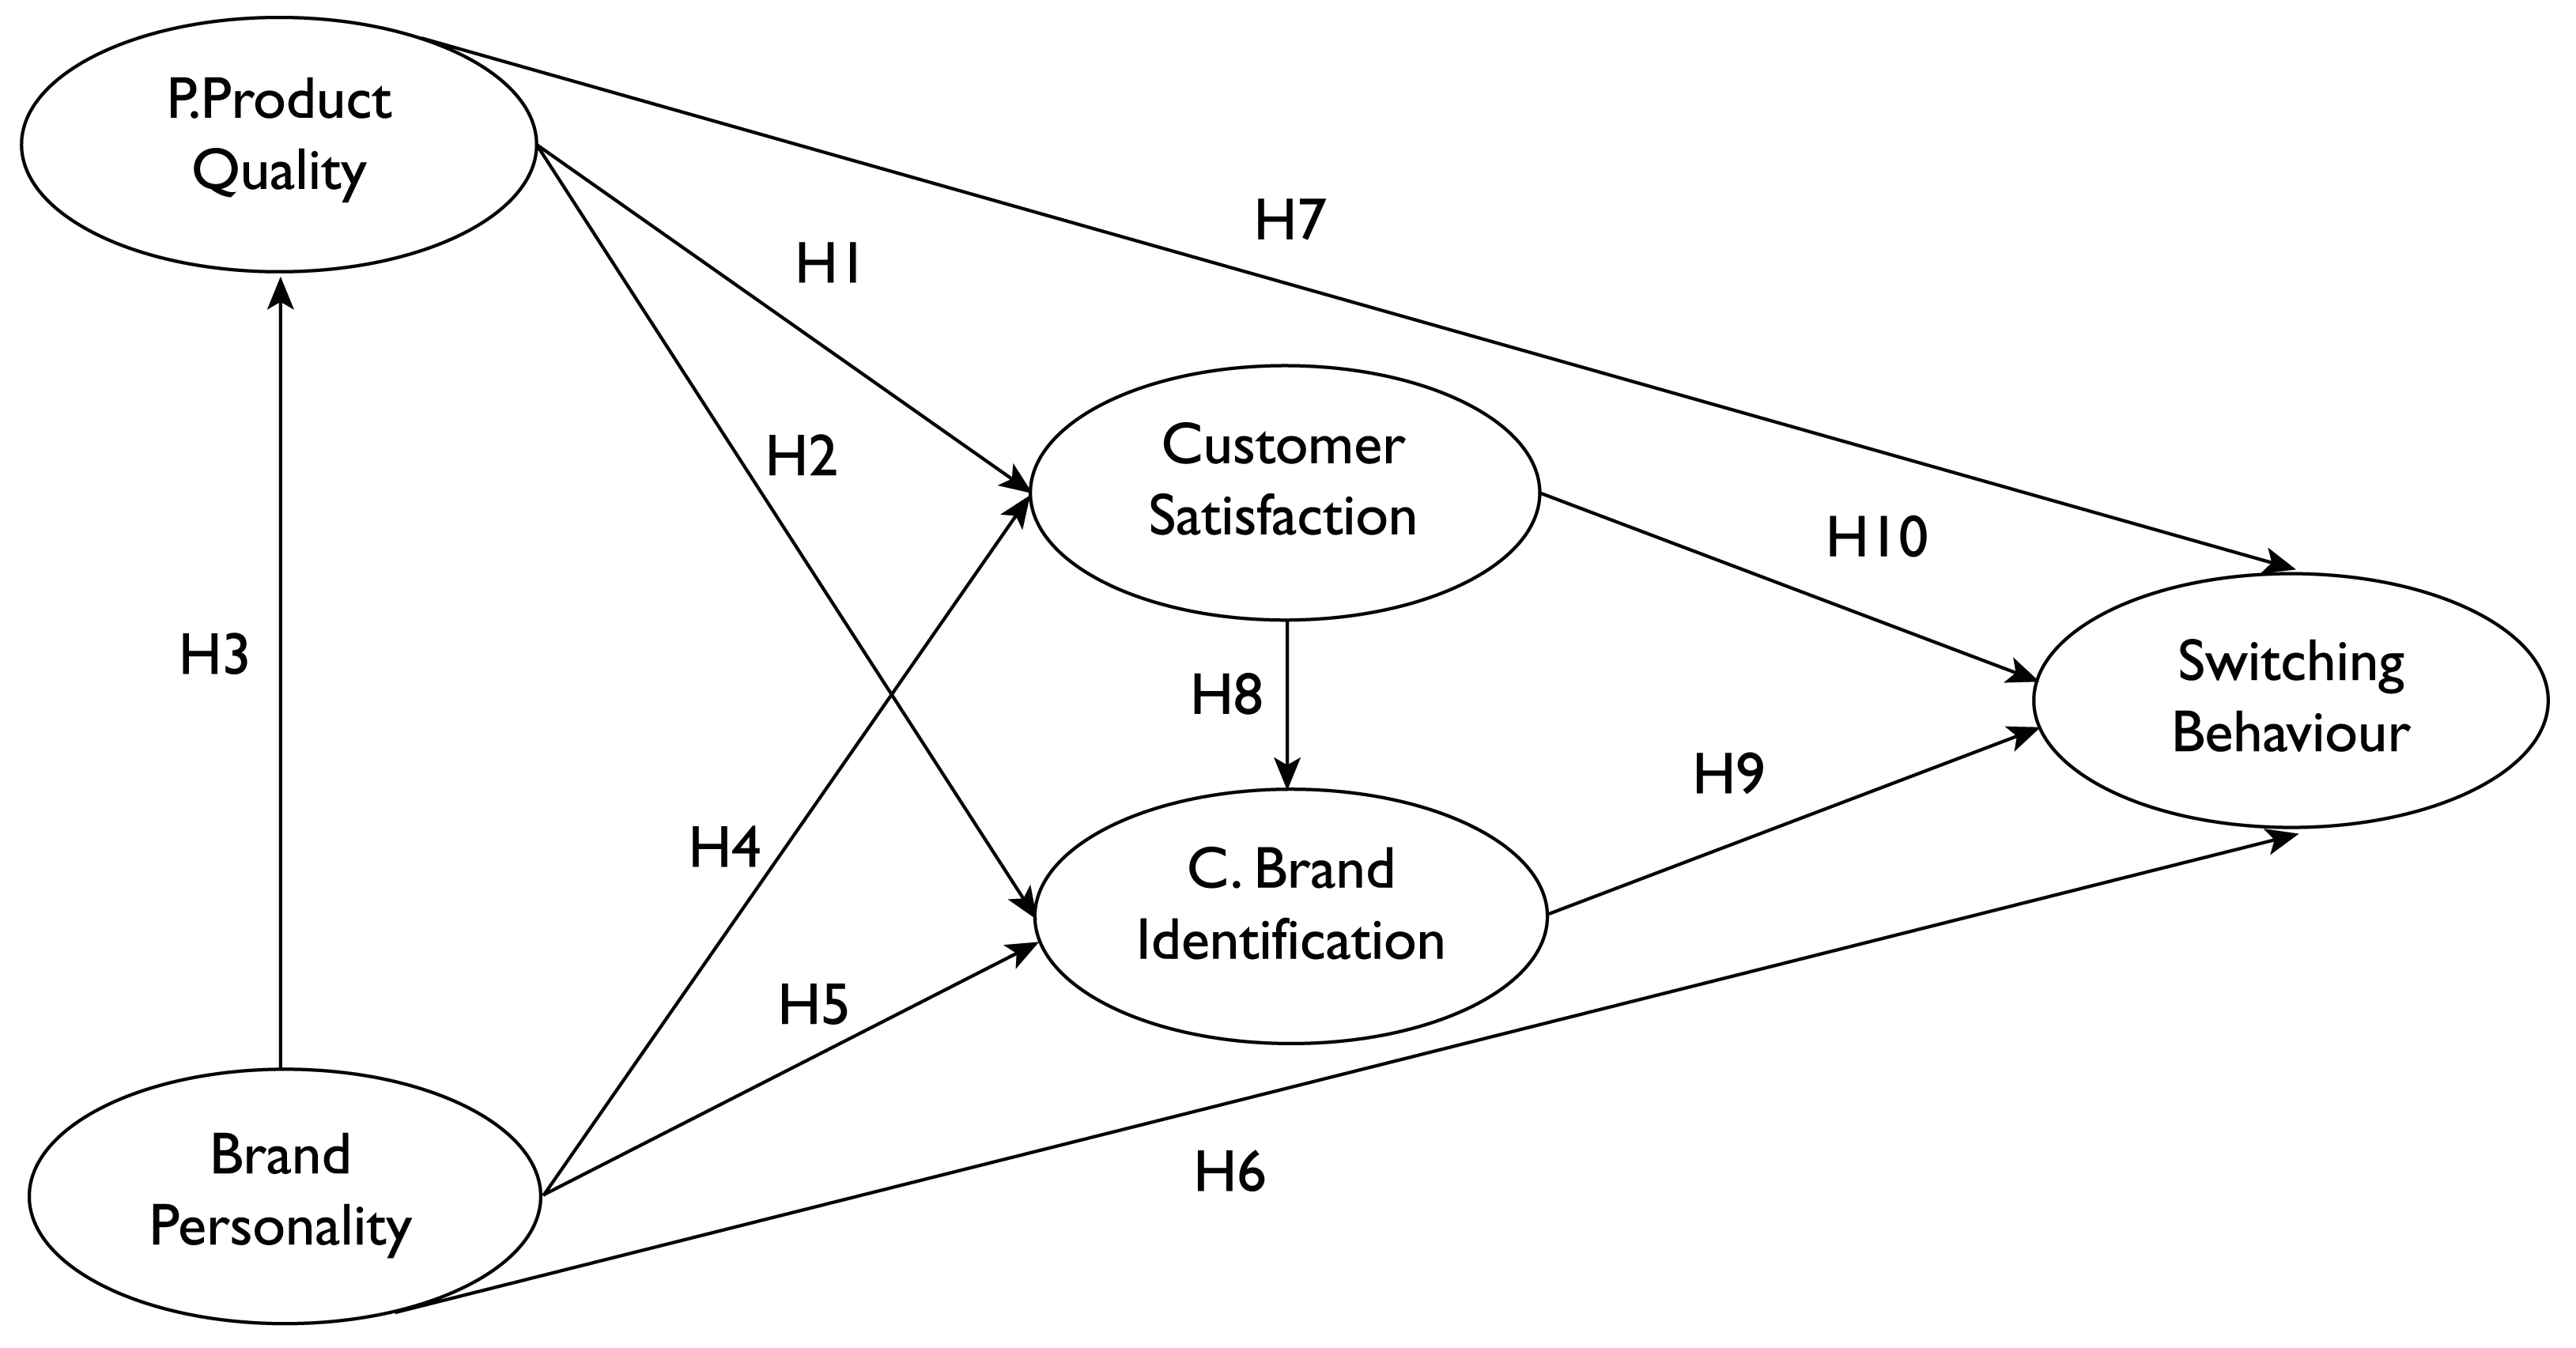
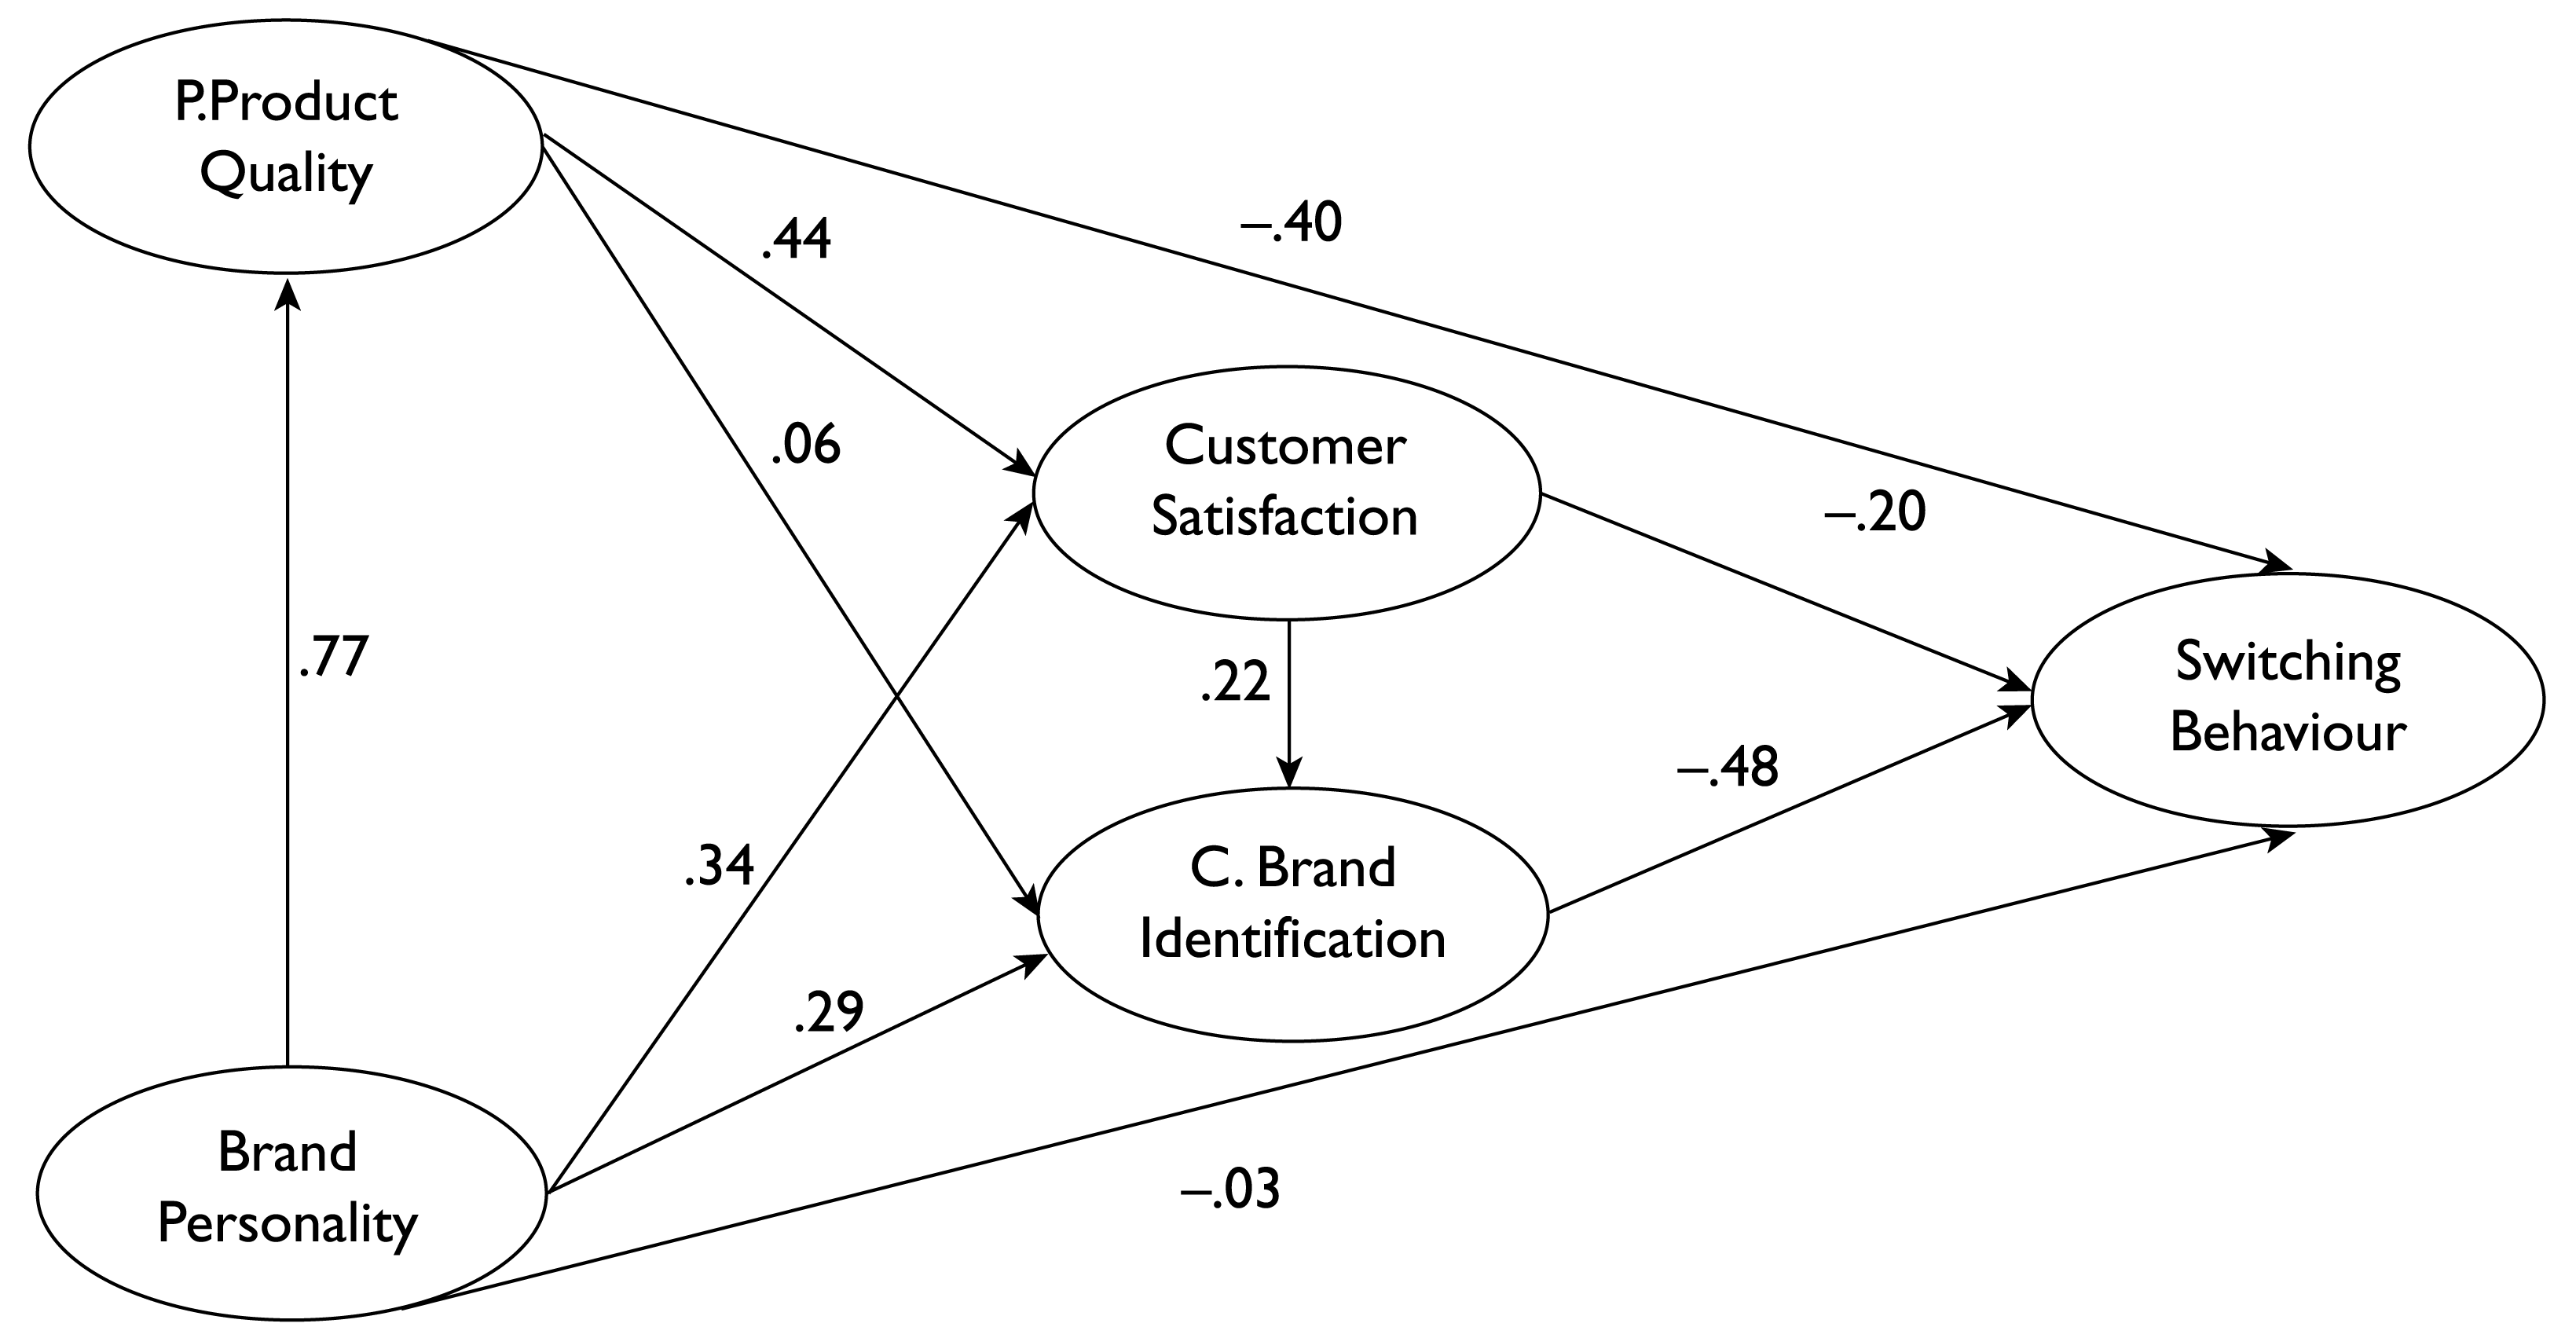
The present study’s conceptual framework (Figure 1) outlines the hypothesized relationship between perceived product quality, BP, customer satisfaction, consumer brand identification and switching behaviour. The hypothesized model implies that creating a credible BP might result in a greatly perceived product quality and greater CS and consumer brand identification, which in turn would end up preventing consumers from displaying switching behaviour.
Conceptual Background: Anthropomorphic Theory
Several studies have identified the important roles of BP on consumer behavioural outcomes, such as purchase intention (Wang, Yang, & Liu, 2009), perceived quality (Ha & Janda, 2014), commitment (Urška Tuškej, 2013) and brand trust (Ha & Janda, 2014). Anthropomorphism, as one of the significant theories associated with BP, is related to perceiving humanlike characteristics for non-human agents (Epley et al., 2008; Freling & Forbes, 2005b). Based on earlier studies, anthropomorphism is believed to invade the way people think through the objects around them that eventually affect the perceptions and behaviours of human (Epley et al., 2008).
Research Framework
In fact, BP is developed via anthropomorphism whereby customers tend to attribute human characteristics to their favourite products, services and stores (Aggarwal & Mcgill, 2012; Rauschnabel & Ahuvia, 2014) and even in expanding their association with the brands they are using (Fournier, 2003). Research has shown that anthropomorphism in an advertisement of a brand increases both brand associations and equity as a result of the positive reactions of customers (Keller, 1993). Freling and Forbes (2005a) stated that there are three significant reasons as to why brand is being evaluated by human beings through integrating their attributes with human characteristics. First, in terms of familiarity, non-human entities can be seen as more human based on the fact, second, in terms of comfort which is due to the reassurance of brand and finally, as an attempt to reduce risk or uncertainty (Jani & Han, 2014). They think that products, services and stores that have strong brand personalities can usually distinguish themselves from competitors and, therefore, gain positive response from customers.
This study proposes that strong BP can lead to favourable perceived product quality, strong consumer brand identification and satisfaction, which finally can have an impact on switching behaviour, and that perceived product quality leads to greater satisfaction as well as consumer brand identification, which consequently results in less switching behaviour.
Perceived Product Quality
Zeithaml (1988) defined quality as an actual superiority of product/services, whereas perceived product quality signifies the intangible and tangible perception of consumers towards a product and service. Perceived product quality is considered a prerequisite to consumer behavioural intention in both goods and services markets. The importance of quality is emphasized by many researchers as, ‘firms compete on quality, customers search for quality, and markets are transformed by quality’ (Golder, Mitra, & Moorman, 2012, p. 1). Producers have always struggled to produce high quality products in order to create good perception and experience among their consumers in order to compete with their competitors (Kemp, 2005; Kyoon Yoo & Ah Park, 2007; Raj & Roy, 2015) while maintaining good reputations among the existing customers, as the cost of retaining the existing customers can be less costly than the cost of acquiring new customers.
The positive perception of product quality is linked to customer’s preference, satisfaction and their purchase choices (Parasuraman, Zeithaml, & Berry, 1994). Both utilitarian and hedonic product features can provide positive experience for users. Mobile softwares such as downloadable applications, operating systems and many other features have turned the mobile devices into a user-friendly platform for customers to use as a personal computer (Corral, 2012). These improved software features which have increased the user utilitarian needs of customers are assumed to lead consumers to higher satisfaction, positive experience and loyalty (Penget al., 2014).
Customer satisfaction refers to customers’ expectation of a provided service or the overall evaluation of customers based on their experiences (Gerpott, Rams, & Schindler, 2001) which affects their post-purchase behaviour (Netemeyer et al., 2004). Perceived product quality and customer satisfaction are key features in various product settings, including smartphone devices. For instance, Sony’s continuous promoting and crucial efforts are focused on their commitment in respecting customer’s viewpoints to ensure high quality products that satisfy customer’s expectations (Schiffman et al., 2013). In total, perceived product quality has been regarded as one of the crucial antecedents of satisfaction (Baker & Crompton, 2000; Cronin, Brady, & Hult, 2000). Hence, we proposed that perceived product quality positively has an impact on CS.
Studies suggest that perceived product quality can predict consumer’s identification with a brand because customers regard brands as an instrument to achieve their functional needs (Katz, 1960). To the best of our knowledge, few studies have investigated the effect of perceived product quality on consumer brand identification. Therefore, our aim in this study is to shed light on these relationships and extend the literature. Thus, we hypothesize that perceived product quality positively has an impact on consumer brand identification.
Brand Personality
Even though the concept of BP has been around since the last three decades, marketing academics and practitioners still show tremendous interest in this concept (Freling, Crosno, & Henard, 2011). For instance, consumer researchers have studied how BP might result in consumer’s self-expression as well as association (Freling et al., 2011), and practitioners have given close attention to the utility of BP from product differentiation point of view (Freling & Forbes, 2005a). Moreover, scholars believe that if the consumer knows and likes the given BP, the process of shopping will be less complex, and also there will be high possibility of considering less time for information search (Freling & Forbes, 2005b). Such gain might accrue due to the strong BP that makes the brand standout and be differentiated from its competitors, which finally can create brand value in the mind of consumers (Freling et al., 2011).
According to Aaker (1997, p. 347), ‘human characteristics associated with the brand form brand personality’. Aaker developed a BP scale (BPS) that consists of five dimensions, that is, sincerity, competence, excitement, sophistication and ruggedness. Sincerity encompasses honesty and wholesomeness. Competence covers reliability, intelligence and success. Excitement includes traits such as daring, spirit, imagination and modernity. Sophistication embraces traits like elegance and charm, and ruggedness is categorized into love of the outdoors and toughness. To illustrate, BMW can be described as sophisticated and glamorous, whereas Marlboro can be associated with ruggedness and outdoorsy or, according to Aaker (1997), Vodka describes a cool brand, contemporary, 25-year-old (young) brand and Stoli is inclined to be described as an old man brand. Therefore, consumers, by using these brands, can associate themselves with certain characteristics (old, young, contemporary, upper class and up-to-date) to others and their own self and, perhaps, gain social recognition which could end up with the development of their identities (Supphellen & Grønhaug, 2003). Such advantages, which are gained by consumers through the brand, are termed as an added value in brand management literature and consumer research because these values are not physical attributes of the product, but are values that are added through marketing activities including any type of integrated marketing communication, such as advertisement, celebrities endorsement and model leaders (Supphellen & Grønhaug, 2003).
Ahn, Lee and Jeon (2009) suggested that since a brand can be distinguished among others by its unique personality, such unique personality enables customers to evaluate the brand and judge its quality more favourably (Ahn et al., 2009). Using Aaker’s BPS, Ramaseshan and Tsao (2007) found that among the five dimensions of BP, ‘excitement’ and ‘sophistication’ had the highest influence on perceived product quality, suggesting that besides price signals, guarantees and brand names, BP can be developed as a new path for marketers to enhance perceived product quality. Moreover, a study, which was conducted by Ha and Janda (2014), on Chinese automobile showed that positive beliefs of BP will result in positive evaluation of product brand in terms of quality; as a result, strong BP can be considered as a good predictor of perceived product quality. Likewise, selecting a brand with a specific personality enables customers to express their own identity (Urška Tuškej, 2013). Therefore, it is suggested that the higher match between customer’s personality and BP contributes to higher satisfaction and loyalty (Urška Tuškej, 2013). Therefore, on the basis of previous literature support, the following relationships are hypothesized: BP positively has an impact on perceived product quality; and BP positively has an impact on CS.
Prior research also has shown that customers tend to express their identity by purchasing brands which are associated with their personality traits (Aaker, 1997). For example, ‘I want to be categorized as high social class and considered as an up-to-date and young person, therefore, I buy BMW or Apple products’. Additionally, using brands with such personality and characteristics might have influence on self-concept. Several studies have provided evidence that customers develop positive attitudes towards brands which matched their personality and their identity (Fung et al., 2013). Therefore, consumers would more likely identify those brands which, in terms of personality, match with the sense of who they are because such an identity will help them to express and maintain themselves in the way they wish and desire to be and be seen as. This notion leads to a fifth research hypothesis: BP positively has an impact on consumer brand identification.
It has been admitted by scholars and practitioners that BP can be used as a strategy for product differentiation as it results in brand preference, greater emotional bound to brand and loyalty (Klabi & Debabi, 2011). Besides, previous studies have also identified that BP is a good predictor of perceived product quality (Ramaseshan & Tsao, 2007), brand associations (Freling & Forbes, 2005a), brand trust (Klabi & Debabi, 2011), brand commitment (Eisend & Stokburger-Sauer, 2013) and purchase intention (Ha & Janda, 2014). Therefore, on this basis, we can assume that if BP can influence consumers to develop brand preference, trust, positive product quality evaluation, purchase intention as well as loyalty and commitment, it would make sense to consider that there would be a negative relationship between BP and consumer switching behaviour. This leads to the hypothesis: BP has negative relationship with customer switching behaviour.
Customer Switching Behaviour
Switchers are customers who have no loyalty to any specific product or service (McCarthy et al., 1992). According to Liang, Ma and Qi (2013), switching behaviour results in ‘the loss of the future revenue stream from that customer, and the loss for a firm’s high-margin sector of its customer base’ (p. 1). Poorly perceived product quality contributes to dissatisfied customers who not only would stop being loyal to that product but also entice the other patrons away from that product (Gilbert et al., 2004). On the contrary, high perceived product quality can retain and attract both current and new customers and even draw customers of low quality competitors to their own favourite products (Babakus, Bienstock, & Van Scotter, 2004). Hence, the following hypothesis proposes: Perceived product quality has a negative relationship with switching behaviour.
As stated by Liang et al. (2013), CS is considered as a prerequisite of customer loyalty which has a positive impact on reducing switching behaviour. Moreover, CS is also believed to be an antecedent of identification as satisfied customers show positive identity towards the product or brand (Kuenzel & Halliday, 2008). Supporting social identity theory researchers (Arnett, German, & Hunt, 2003; Bhattacharya & Sen, 2003), in a study by Bhattacharya, Rao and Glynn (1995), it was shown that many satisfied members of art museum showed higher identification. Therefore, on the basis of previous literature support, the following relationship is hypothesized: CS positively has an impact on consumer brand identification.
The term consumer brand identification originated from social identity theory which initially was used in organizational behaviour, which recently has been used in marketing and consumer behaviour studies (Fung et al., 2013). From the social identity point of view, identification takes place when individuals see characteristics of themselves psychologically intertwined with characteristics of the group (Ashforth & Mael, 1989). From the perspective of consumer behaviour, ‘identification is an individual’s perceived oneness with or belongingness to an organization’ (Bhattacharya & Sen, 2003, p. 46). In order to identify in which situation and under what condition consumers tend to get into a serious and meaningful relationship with certain companies or brand, researchers proposed that this is a high possibility if the company is able to fulfil some important self-definitional consumer needs. To illustrate, ‘the driving comfort of BMW and having an iPhone or Samsung Galaxy S7 gives me the feeling of being seen to be in high social class group, hence such a product brand encourages me to purchase and remain loyal to it’. Since there is limited research on identifying the relationship between CBI (consumer brand identification) and switching behaviour, this study attempts to use parallel studies from different business research settings. For example, the study of Fung et al. (2013) demonstrated that if the consumer identifies a product or brand strongly, then such consumer brand identification will result in a favourable consumer’s outcome, such as brand loyalty, brand trust and perceived value. Consequently, the opposite term of loyalty is switching behaviour; therefore, if consumers identify the mobile brands strongly, then there might be less chance for consumer switching behaviour. On this basis, we proposed the following hypothesis: Consumer brand identification has negative relationship with customer switching behaviour.
However, one of the main factors affecting customer switching behaviour is customer dissatisfaction (Crosby & Stephens, 1987). CS with a product is considered an index for perceived product quality, influencing customer loyalty and further affecting customer intention to continue or terminate their usage (Gerpott et al., 2001). In a study by Chitturi, Raghunathan and Mahajan (2008), CS was found to be a significant predictor of re-purchase intention among mobile phone and laptop consumers. Research has shown that higher level of CS results in higher loyalty and less switching behaviour (Ball et al., 2004). In a study by Athanassopoulos (2000), CS showed positive influence in preventing bank customers’ switching behaviour. However, some other studies suggested that CS does not necessarily result in customer loyalty as it also depends on factors such as the number of substitutes and the cost of switching (Huang, Cheng, & Farn, 2007). Therefore, the effect of CS on switching behaviour has still remained uncertain, and more research is needed before definite conclusions can be made, that is, CS has negative relationship with customer switching behaviour.
Methodology and Instruments Development
Sampling and Data Collection Procedure
The proposed model of the current study was tested in the smartphone industry within the Malaysian context. Two predominated smartphone brands, Samsung and Apple, were selected due to being global brand as well as the leading brand in the Malaysian market. Data were collected using structured questionnaire from two public universities’ (University Putra Malaysia and University Technology, Malaysia) and two private universities’ (Sunway University and Monash University) students who were using the aforementioned smartphone brand. Even though some believe that student samples are not as reliable as experienced customers, in the current study the process of data collection was ensured. Besides, student subject has been used widely across the academic disciplines in prior studies (Bridges & Florsheim, 2008; Lim & Ang, 2008). On top of that we believe that due to the nature of the study, which attempts to get some insight into the mobile industry, student sample is an appropriate approach due to the following reasons. First, students have more knowledge regarding technology and applications of smartphones compared to the older generation in most circumstances (Peng et al., 2014). Second, students could be considered as a subpopulation of smartphone users (Martensen, 2007; Peng et al., 2014). The procedure of data collection began with an illustration of the significance of the study and the objectives. Respondents were then requested to answer the questions precisely. Since there were three main communities in Malaysia (Malay, Chinese and Indian), the questionnaires were translated from English to Malay, which is the national language of Malaysia. However, the option to answer in either English or Malay is given to qualified respondents. Considering that there is a need to conduct correct translations, two important methods of translation, which was recommended by Adler (1983), were considered. The first option is to have a back-translation, by which the English version of the questionnaire is translated into the Malay language and then translated back into the original language, while the second option is to have the translation done by an expert who is proficient in both languages and in the subject matter; in this study we employed the second method. A total of 413 completed questionnaires were collected, yielding the response rate of 89.7 per cent. Out of the 413 collected questionnaires, 381 questionnaires were used in the analysis, whilst 32 questionnaires were deleted from the data pool due to missing data, unengaged responses and low standard deviation. Table 2 portrays the demographic information of the current study’s participants. Sample sizes can be considered as effective between 30 and 500 (Sekaran & Bougie, 2016). Malhotra, Patil and Kim (2007) assumed that the consideration of sample size must be guided by resource constraints. According to Byrne and Kline (Byrne, 2009; Kline, 2011), an appropriate sample size to be considered for structural equation modelling (SEM) using AMOS is minimum 200 and not exceeding 500 (sample size of more than 500 makes the data very sensitive). This criteria is also supported by Tanaka (1987) who stated that the required sample size is between 200 and 500. However, sample size can also be determined based on the number of components to be included in the research study (Malhotra et al., 2007). According to Green (1991), a formulated ‘rule of thumb n ≥ 50 + 8(m) for multiple correlation and n ≥104 + m for the partial correlation’ can be applied. He estimated that n (minimum sample size) = 50 + 8(m), where m shows the number of endogenous and exogenous variables. Therefore, based on the above formula, the required sample size for this study is 90 and 148 (50 + 8(5) – 104 + 8(5)). This study attempted to justify its sampling procedure based on different points of views and as the sample size of the current study is 381, the requirement of the sampling method is met.
Measures
A pilot test was conducted with a sample size of 60 after removing all weaknesses which were identified during the content validity and face validity tests. The pilot test result was assessed and confirmed using reliability test (Cronbach’s alpha) and factor analysis (the participants of the pilot test were not incorporated in the final data). The revised questionnaire was administered on the respondents in the University Putra Malaysia, University Technology Malaysia, Sunway University and Monash University during the scheduled education hour. In order to describe the purpose of the study, brief writings providing instructions and explanation in broad terms were provided in each section of the survey questionnaire. Moreover, enough time was given to the participants and they were encouraged to complete the questionnaire with honesty. The data collection process for this study took several months from early December 2015 to March 2016.
The seven-point Likert scale, with all the points labelled (1 = standard deviation (SD) and 7 = strongly agree (SA)), was used for gathering data throughout this study due to two significant reasons. First, they are frequently employed in consumer research and marketing research, as they permit a degree of intensity and perception expressed. Second, they offer a direct measure of the respondent’s idea and opinion, hence facilitating the coding process. Moreover, it is adjustable for statistical analysis (Sekaran & Bougie, 2016).
Measurement Model Constructs

The research framework of this study is composed of five major factors and each variable is measured with multiple items which were obtained from the extant literature to enhance the content validity of the questionnaire (Churchill & Iacobucci, 2009; Hair, Bush, & Ortinau, 2006). BP items were adopted from Aaker (1997) using 42 items. Aaker (1997) developed BP with five dimensions, which are sincerity, excitement, sophistication, competence and ruggedness. However, since the concept of BP was developed and originated from American cultures, these dimensions can be altered to suit other cultures. As recommended by Aaker (1997), BP dimensions should be assessed based on different cultures to be ‘cross culturally generalizable’ (p. 355). Furthermore, the traits of BP may vary in some certain industries. For instance, the study of Rojas-Mendez, Erenchun-Podlech and Silva-Olave (2004), which was conducted for Ford BP, found that the ‘ruggedness’ dimension resulted with non-acceptable reliability and validity; as a result, it would be required to validate the components of BP across different industries and countries. Product quality, which in the context of this study means mobile device quality and mobile software quality, was adopted from Chau and Lai (2003), Peng et al. (2014) and Ranganathan and Ganapathy (2002) with 19 items; consumer brand identification adopted from Fung et al. (2013) and Mael and Ashforth (1992) with 8 items; CS from Lee, Lee and Yoo (2000); and switching behaviour with five items adopted from Malhotra and Kubowicz Malhotra (2013) with five items.
Finding and the Results of the Study
Descriptive Analysis on Sample Profile
54.7 per cent of the respondents were males, whilst 45.3 per cent were females. Furthermore, descriptive statistic demonstrates that most of the respondents (78.7 per cent) were 24–34 years old, 19.2 per cent were between 18 and 23 years old and only 2.1 per cent of them were older than 50 years. As the data shows, the findings of this study are influenced by single male and female respondents who are between 18 and 34 years of age. In terms of educational level, more than half of the respondents (83.8 per cent) were undergraduate and postgraduate students followed by 16.2 per cent who were A-level students. The study also shows that slightly more than half of the respondents (51.2 per cent) were Samsung mobile phone users, whereas 48.8 per cent of them were iPhone mobile phone brand users. Most of the respondents were Chinese (40.7 per cent), followed by Malays (27.8 per cent), Indians (16.3 per cent) and other ethnics (15.2 per cent). The data on the percentage distribution of respondents based on monthly incomes (Every 1 Malaysian Ringgit is equal to 0.22 US$) reveals that most of the respondents (53.0 per cent) were earning a monthly income between RM2001 and RM4000, followed by less than RM2000 monthly (29.7 per cent) and 17.3 per cent were earning more than RM4000 a month. To avoid bias results, this study attempted to have equal male and female respondents as the perception of males and females might be different in terms of switching behaviour.
Sample Profile

Reliability Test
Reliability Test
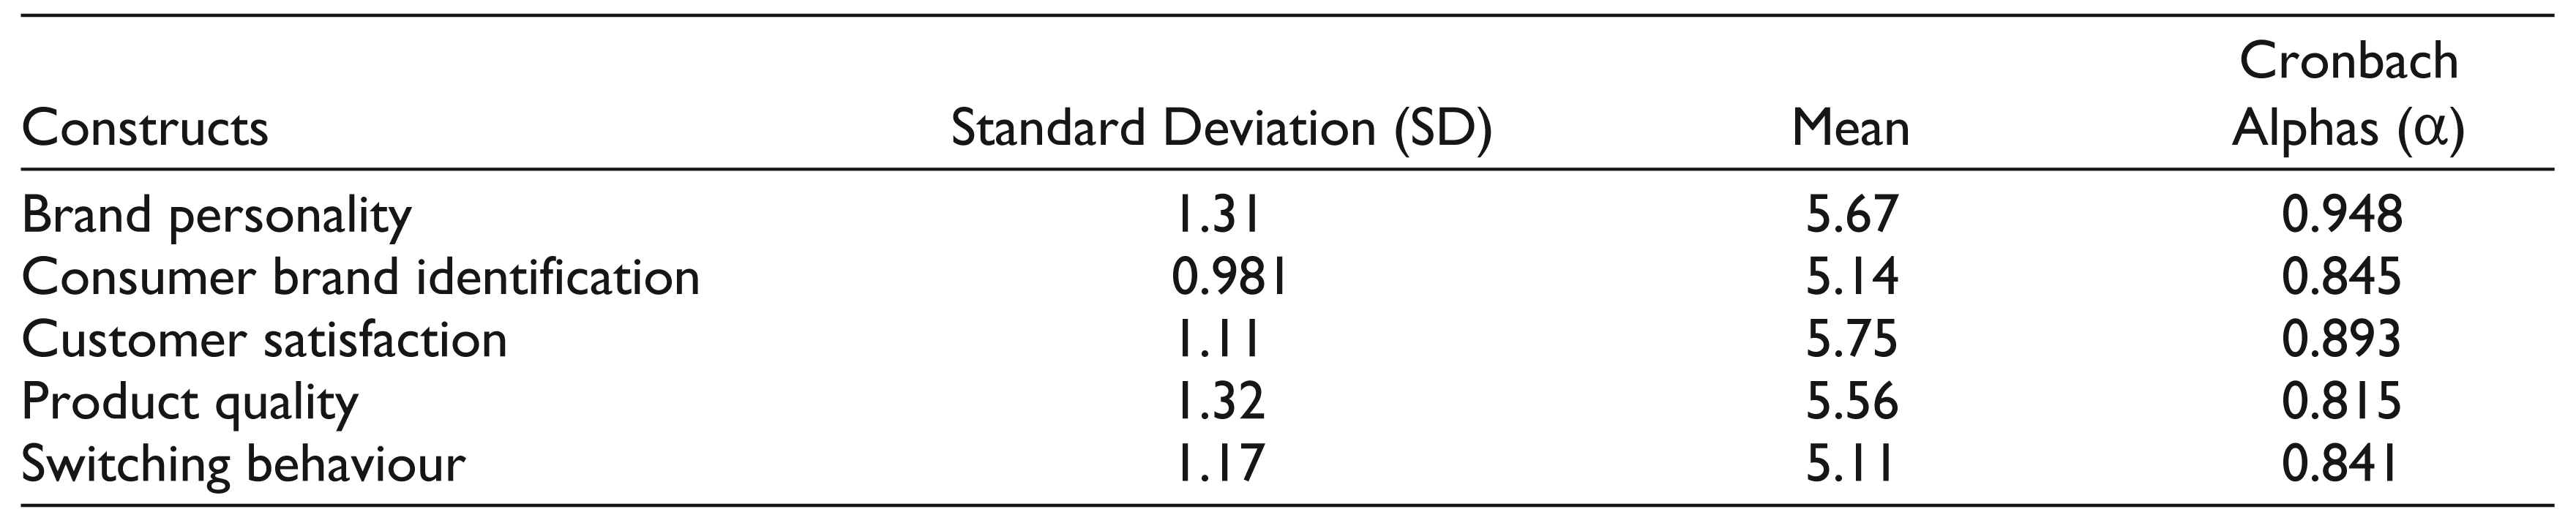
The variables were coded and reliability test was conducted on 82 questions. The measures of reliability show that Cronbach’s alpha ranged in value from 0 to 1, whereby the values from 0.60 to 0.70 can be considered as a reliable level (Hair et al., 2006). Table 3 represents the reliability test results (Cronbach alphas) of five constructs of the current study.
Dimension Reduction Analysis (Factor Analysis) and CFA
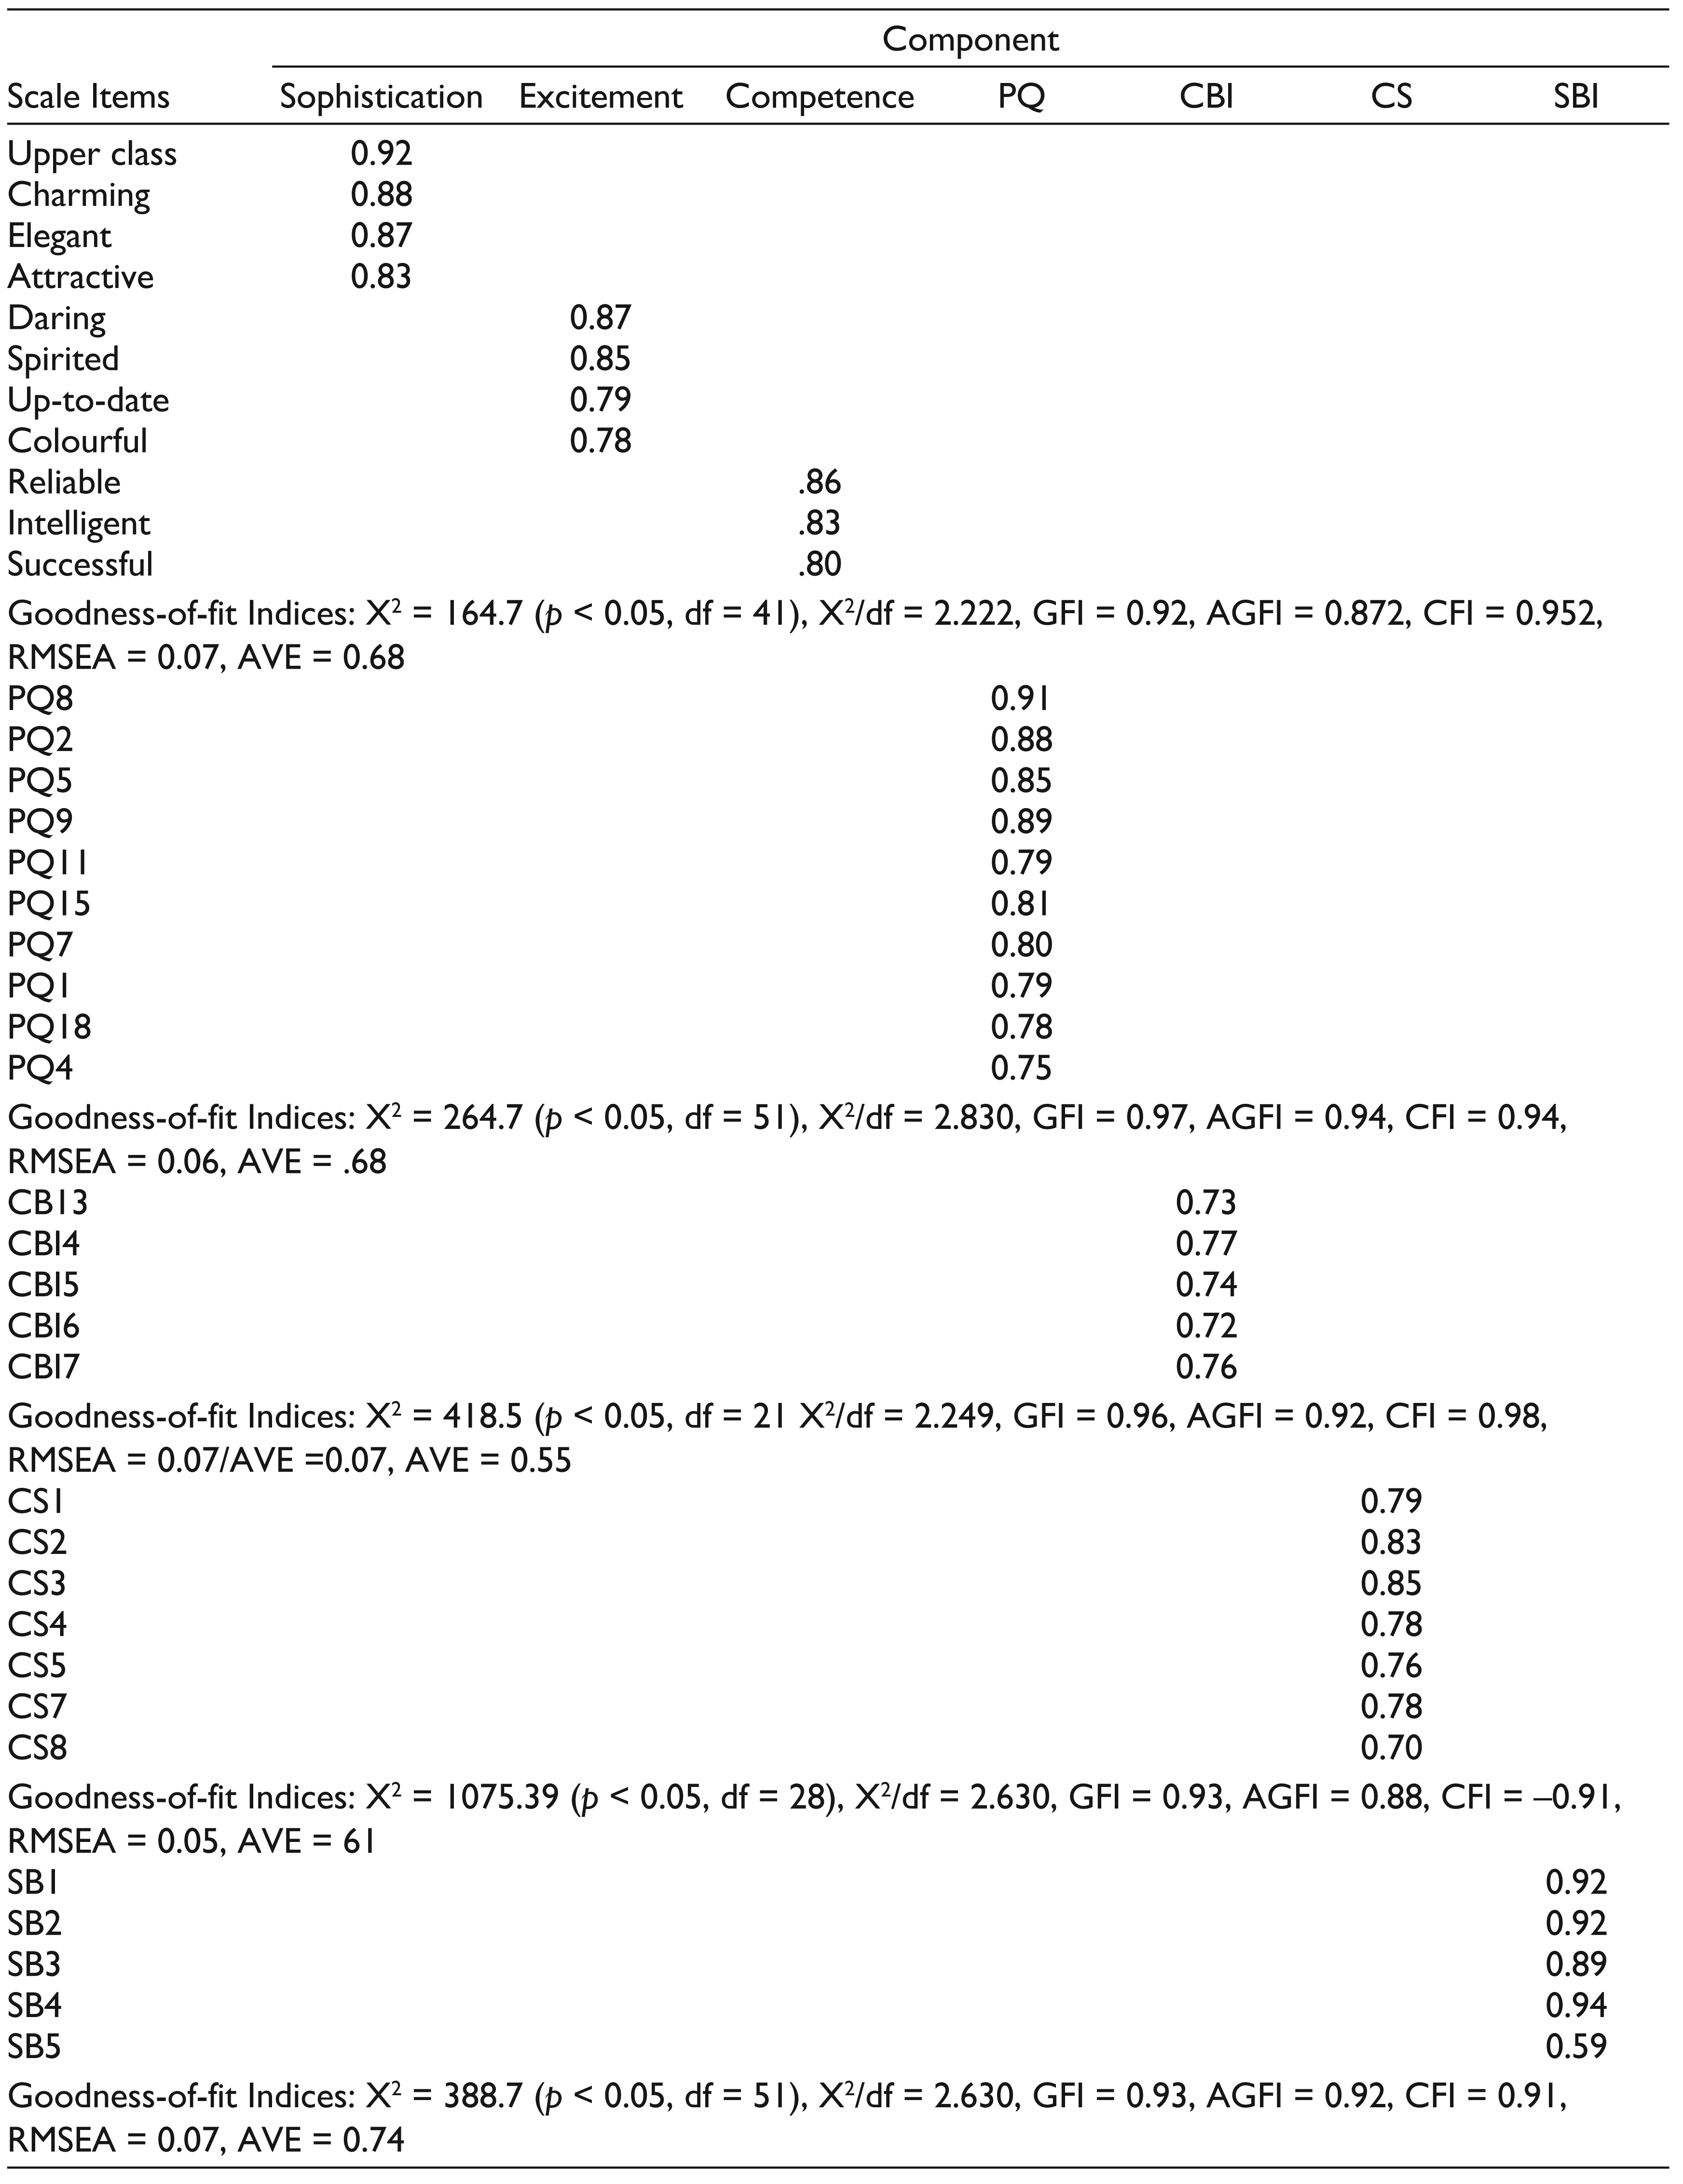
Factor analysis and confirmatory factor analysis (CFA) were employed as an approach through which the performance of the measurement model of all constructs was evaluated (Table 1 provided for more illustrations). Exploratory factor analysis (EFA) has been used to ensure that the questionnaire measures what it intends to measure by getting the support of SPSS 21. As a result, factor analysis was carried out on all statements in order to examine the dimensionality and to ensure that the questionnaires are able to measure the proposed factors adequately. In order to find out an item in its particular variable, the minimum factor loading is required. If its loading is equal or greater than 0.30, then it can be considered as the minimum factor loading (Hair et al., 2006). The most significant factor loading is greater than 0.50, but 0.40 is considered important (Hair et al., 2006). Therefore, items which have loadings greater than 0.50 are accepted as the general requirement for this study. Based on the factor analysis result, all of the factors have been loaded except for two dimensions of BP which are sincerity and ruggedness. According to past literature, even though Aaker’s (1997) framework of BP has been widely used by many researchers (Bhardwaj, Park, & Kim, 2011; Das, 2014; Deane, Smith, & Adams, 2003; Harris & Fleming, 2005; Murphy, Moscardo, & Benckendorff, 2007), the reliability of this scale is still questionable; specifically, the ‘ruggedness’ dimension, as it is suggested that this dimension has several meanings depending on the cultural varieties of different countries (Davies et al., 2001).
According to Aaker (1997), it could be argued that the first three dimensions of BP (i.e., sincerity, excitement and competence) relate to the ‘big five’ human personality, while two dimensions (sophistication and ruggedness) are different from any of the big five of human personalities. This pattern suggests that BP dimensions might operate in different ways for different reasons. For instance, since sincerity, excitement and competence tap an innate part of human personalities, ruggedness and sophistication tap a dimension that individuals desire to obtain, but do not necessarily have. Besides, the main critique concerns two topics: First, Aaker’s scale (Aaker, 1997) was developed in the USA only, and attempts to replicate the structure in other countries have failed, that is, it produced other dimensions and personality items (Aaker, 2001; Clemenz, Brettel, & Moeller, 2012). This implies that Aaker’s scale cannot be used outside the USA, which also means that it would be necessary to develop country-specific BPSs, which is a major inconvenience for both academic research and marketing practitioners. Second, Aaker included in her scale some items that obviously do not describe specific personality traits (such as age or gender), which implies a construct validity problem and has led other researchers to question if her scale actually measured the ‘personality’ of a brand (Azoulay & Kapferer, 2003; Clemenz et al., 2012). Moreover, the study of Supphellen and Grønhaug (2003), which tested Aaker’s BPSs in Russia, found many similarities and dissimilarities between Russian’s and Westerners’ BP perception. However, as in prior studies, we found some dissimilarities regarding the scales of BP that occurred within the Malaysian context and consumers could associate themselves with only three dimensions of BP, namely, excitement (Samsung and iPhone seems to be more related to being trendy, up-to-date, young), competence (both Samsung and iPhone are considered to be reliable, successful and market leader) and sophistication (which as aforementioned sophisticated brands are normally glamorous, charming and have an attractive design). As a result, these three dimensions of BP seem to be more pertinent in the mobile industry within the Malaysian context.
In the next step, CFA is used to verify the factor structure of the purified data set. As pointed out earlier, in order to examine and evaluate the suitability of our measurement model, we ran CFA by getting the support of SEM (AMOS) via maximum likelihood estimation, through which the normality of data distribution can be examined as well. The normality of the data can be assured through skewness as well as kurtosis. Whilst skewness is inclined to affect the analysis of the means, it is kurtosis that strongly impacts on the tests of variances and covariance (Byrne, 2009), which is the basis for SEM. According to Hair et al. (2006), a data set can be considered as normal if skewness and kurtosis is within the range of ±1; whereas, according to George and Mallery (2003), the skewness between –2 and +2 is considered as normally distributed data. Byrne et al. (2010) suggested using cut-off point values of ±2 for skewness and ±7 for the kurtosis. In the current study, the cut-off point values of ±2 for skewness and ±7 for kurtosis were considered to check the normality of the data set. The results of the present study clearly show that all the values for skewness and kurtosis fall within the suggested range of ±2 and ±7.
All constructs were validated through convergent validity, which can be achieved via average variance extracted analysis by considering the minimum cut-off point (0.5) and discriminant validity, which can achieved if the correlation between the exogenous variables does not exceed the cut-off point value of 0.85 (Byrne, 2009). The CFA for each construct was run separately and all constructs demonstrated satisfactory goodness-of-fit (Table 4). However, as suggested by the literature (Byrne, 2009), items with loadings of less than 0.60 and R2 less than 0.40 should be dropped from the construct. However, researchers can keep the items if they have valid reasons (Byrne, 2009).
Structural Equation Modelling
The SEM, using AMOS with maximum likelihood, was employed to examine the hypothesized relationship among the variables. Figure 1 illustrates the hypothesized relationship of the variables which were proposed in the current study. Different approaches of fit statistics were practiced in this study in order to evaluate the goodness-of-fit indices. Table 4 demonstrates the goodness-of-fit for each latent constructs separately, and Table 5 displays the overall model fit of the entire structure model. In the present study, the measure of model fit incorporates CFI (Comparative Fit Index > 0.90), GFI (Goodness-of-fit Index > 0.90), RMSEA (root mean square of error approximation, < 0.08) and Chisq (Chisq square/degree of freedom < 5.0), which are close to the level recommended by several researchers (Byrne, 2009).
PCA of BP, PQ, CBI, CS and SBI Items
Model Fit of Hypothesized Model
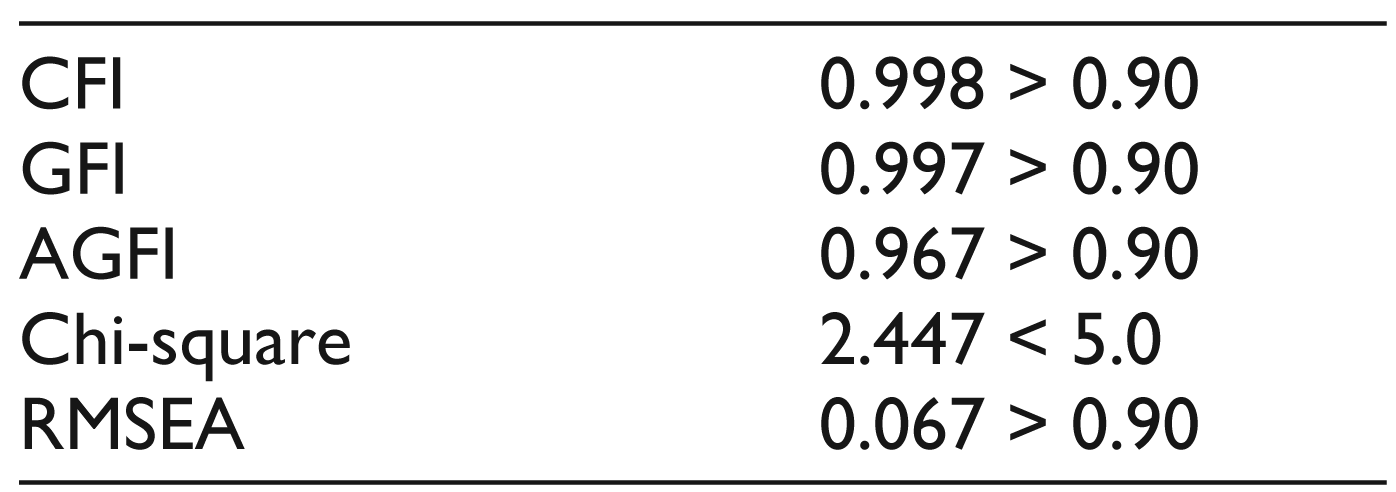
The result shows that the structural model in the first run did not fit well: Chi-square/df = 16.302: Chi-square = 146.9, df = 9, CFI = 0.884, GFI = 0.879, TLI = 0.806, AGFI = 0.718 and RMSEA = 0.141, which was greater than expected (≤ 0.08). The structural model items CS6 had a lower factor loading compared to the expected level which is 0.60, and, as a result, they became candidates for elimination. The model was re-specified, but the still did not fit: Chi-square/df = 10.2183: Chi-square = 20.4/ df = 2, CFI = 0.976, GFI = 0.974, TLI = 0.928, AGFI = 0.869 and RMSEA = 0.157, which was greater than the expected level (≤ 0.08); thus, the only way which was left open was to look into modification indices (MI). However, the covariance error between BP9 and BP10, which indicates items 9 and 10, are redundant and as a result the measurement errors, namely e9 and e10, are highly correlated because MI is greater than 15. Consequently, this measurement error is logically considered to be correlated (Awang, 2012; Byrne, 2009). The model was re-specified one more time and finally, the new model was a perfect fit: Chi-square/df = 12.4: Chi-square = 2.447/df = 62, CFI = 0.998, GFI = 0.997 TLI = 0.989, AGFI = 0.967 and RMSEA = 0.067.
Testing the Hypothesized Model
Perceived Product Quality, Brand Personality and Consumer Brand Identification
As mentioned earlier, 10 hypotheses were developed for the present study. The outcome of the hypothesized structural model reveals that 8 hypotheses were found to be statistically significant. As presented in Figure 2 and Table 6, perceived product quality has a positive impact on CS (CR = 2.957, β = 446, P < 0.05), and as a result, the positive relationship between PQ (product quality) and CS exists, hence H1 is supported. The relationship between brand personality as well as perceived product quality is also statistically supported; therefore, there is a positive relationship between brand personality and perceived product quality; consequently, H3 is supported (CR = 8.256, β = 766, P < 001***). The relationship between BP and CS is found to be significant (CR = 2.118, β = 337, P < 001***), thus H4 is supported.
Perceived Product Quality, Brand Personality, Customer Satisfaction and Consumer Brand Identification
The hypothesized relationship between perceived product quality and consumer brand identification is not supported (CR = 0.449, β = 0.061, P = 0.649), so as a result, hypothesis H2 is not significant. The outcome of the current study also reveals that BP has a positive impact on consumer brand identification (C.R = 2.428, β = 0.286, P < 0.05), hence H5 is supported. Besides, the relationship between customer satisfaction and consumer brand identification is statistically supported (CR = 2.432, β = 0.219, P = < 0.05), hence H8 is supported.
Perceived Product Quality, Brand Personality, Customer Satisfaction, Consumer Brand Identification and Switching behaviour
The hypothesized relationship between perceived product quality and switching behaviour is negatively significant, which means that even though the brand plays a very significant role in achieving customer satisfaction and brand identification, consumers might only consider the perceived quality of the product as an indicator of switching behaviour. Mobile customers and users may have lower tendency to switch to other products or brands as long as the quality of their mobile device and software meets their satisfaction. Consequently, H7 is negatively supported (CR = –4.464, β = –0.399, P = < 0.05). Furthermore, the hypothesized relationship between consumer brand identification and switching behaviour is found to be significant negatively (CR = –3.235, β = –0.484, P = < 0.05), that is, the stronger the consumer identification with brand, the lower the occurrence of switching behaviour; hence, H9 is negatively supported. The relation between brand personality and switching behaviour is also found to be insignificant, therefore H6 is rejected (CR = –0.247, β = –0.033, P = > 0.05). However, BP has an indirect impact on switching behaviour via customer satisfaction and consumer brand identification. The relationship between customer satisfaction and switching behaviour is significant (CR= –2.587, β = –0.199, P = < 0.05); as a result, H10 is negatively supported, which means that customers who are satisfied with their product brand are most likely to have low tendency to switch from their product. Consequently, CS, directly and indirectly via consumer brand identification, has a negative relationship with switching behaviour: CR = –4.464, β = –0.399, P = < 0.05.
Results of Structural Model
Overall Structure Model Result
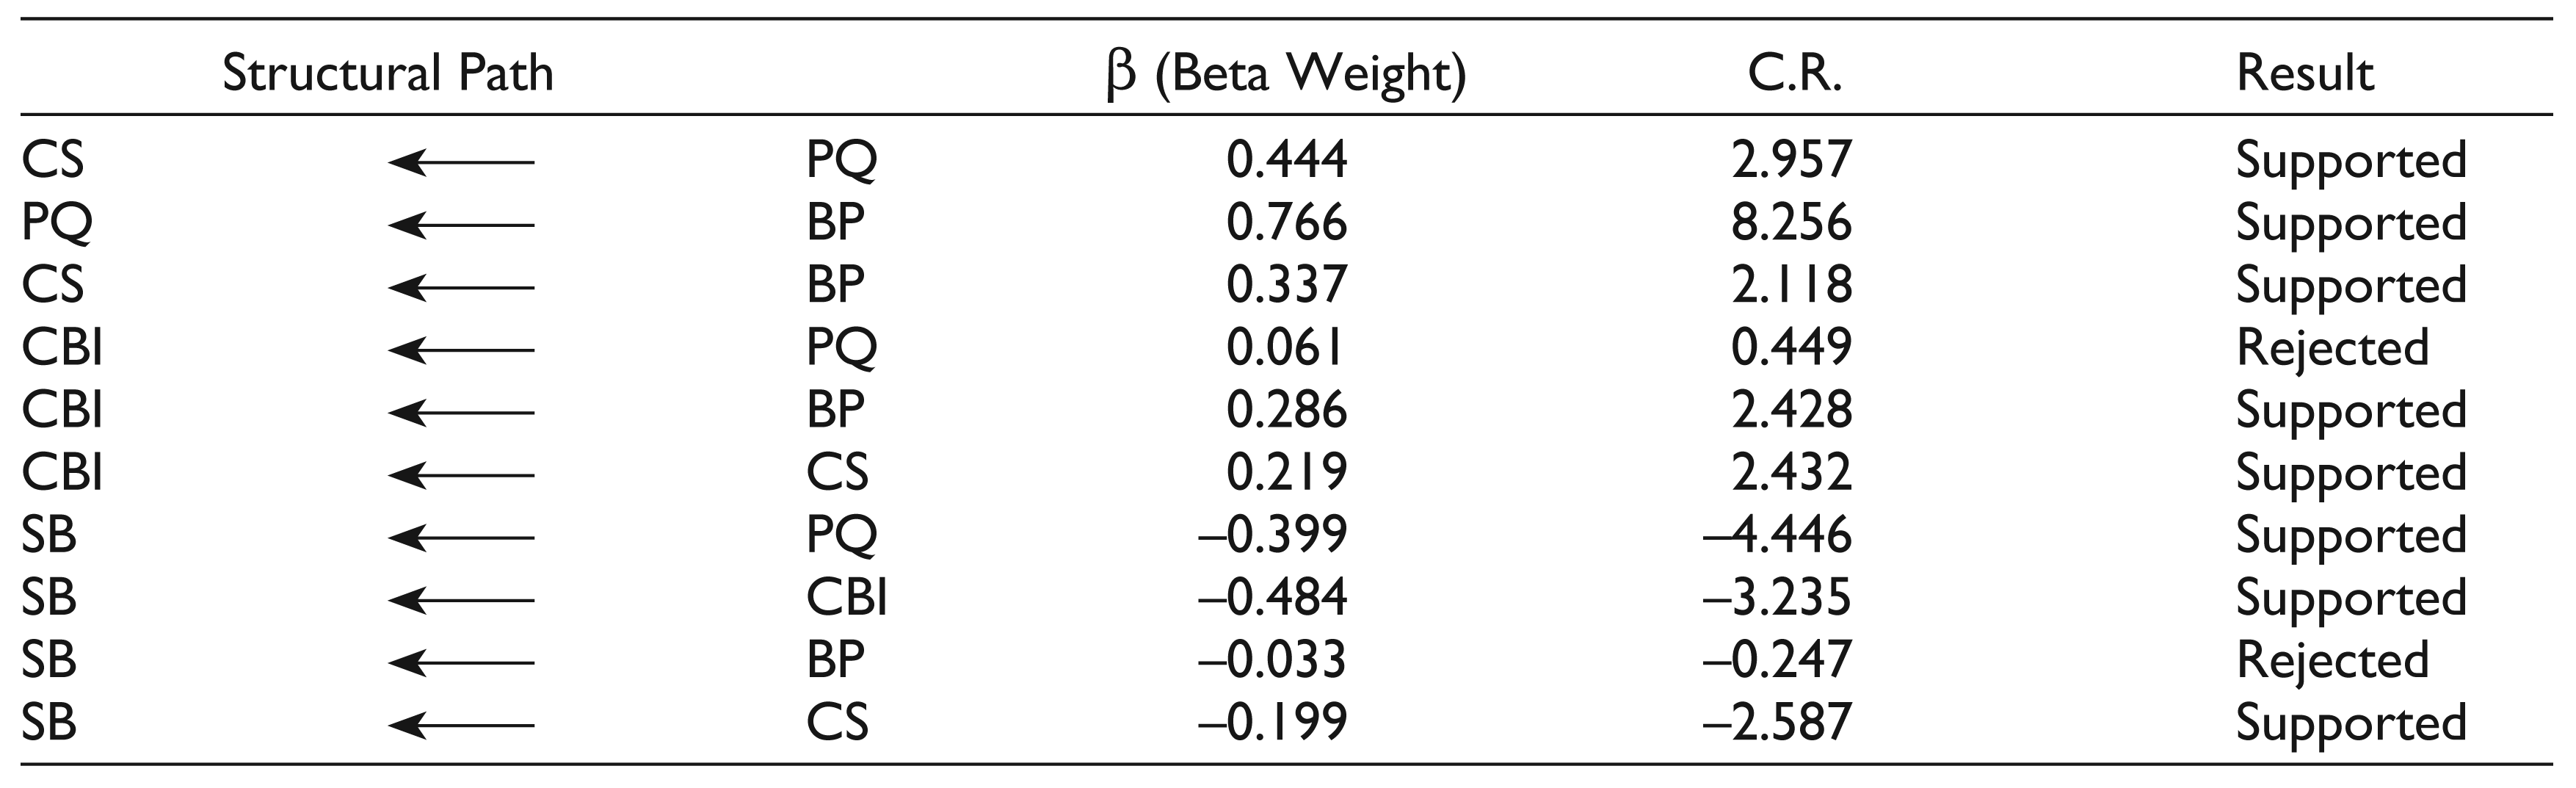
The overall outcome of the current study shows that BP does not directly affect switching behaviour; instead BP’s impact is indirectly via customer satisfaction and consumer brand identification. Besides, this study also finds that perceived product quality, directly and indirectly, is a good predictor of switching behaviour in a negative relationship manner.
Discussion
The main focus of this study is to identify and hypothesize the factors which play a major role in consumer switching behaviour. Therefore, this study attempts to extend the previous research on switch behaviour by paying closer attention on the role of brand personality, perceived product quality, and consumer brand identification within the Malaysian mobile industry context. The present study tested the relationship between brand personality, perceived product quality, consumer brand identification and consumer brand identification on switching behaviour. The study via EFA identified that only three traits (excitement, competence and sophistication) of the big five BP dimensions form the BP of the aforementioned industry, as, according to Aaker (1997), BP based on different contexts of study and cultural differences might result in different outcomes. Therefore, such findings (exploring what dimensions of BP are appreciated more by consumers) in the context of mobile industry will give an opportunity to brand managers and marketers to put more emphasis on the traits which more consumers can associate with. More interestingly, the study finds that BP has a positive and strong effect on perceived product quality. Consumers can evaluate the product more favourably, if they find the personality of their selected brand to resemble those they appreciate more. To illustrate, the Malaysian mobile users are interested in brands which are elegant, attractive and considered as upper class (sophistication), up-to-date, reliable (excitement), and successful and intelligent (competence). As a result, from a global business perspective, brand managers, in order to penetrate and position their product in Malaysia, should focus on these traits of BP rather than others.
As was predicted, BP plays a pivotal role in consumer’s switching behaviour via perceived product quality as well. The study reveals that BP is a great predictor of consumer positive evaluation towards a product quality (Ramaseshan & Tsao, 2007), which finally results in negative relation with consumer switching behaviour.
Furthermore, the study finds that BP does not have a negative direct relationship with consumer switching behaviour; instead it has an indirect effect via consumer brand identification. Even though BP plays an important role in many behavioural studies, such as commitment (Ha & Janda, 2014) and purchase intention (Wang et al., 2009), according to our study findings, even BP cannot prevent the consumer from displaying switching behaviour if the self-definitional needs of the consumers are not satisfied. According to social identity theory, consumers may identify strongly with those brands (CBI) which can satisfy the consumer’s self-definitional needs. Due to this reason, BP is seen to have an indirect impact on switching behaviour. The study also demonstrates that CS has a positive influence on consumer brand identification, which is also consistent with Kuenzel and Halliday (2008) study.
Finally, perceived product quality has a negative direct and indirect impact via CS on consumer switching behaviour. In fact, consumers have made positive evaluation on the quality of products as results of an incredible BP building that generates more satisfaction and at the same time keeps the consumer from switching to other product or brand.
Implication and Contribution
This study contributes to both theory and practice. Theoretically, this study extends the literature by paying closer attention on switching behaviour studies. To the best of our knowledge, this study is the first that by getting the support of anthropomorphic theory, conceptualized the BP concept and consumer brand identification in switching behaviour studies. Second, the present study provides evidence to proof what the main traits of BP are, which form the concept of BP in the mobile industry within the Malaysian context, that can lead to positive evaluation towards product quality and satisfaction, and finally impact negatively on switching behaviour. Third, this study also attempts to show how great BP can facilitate the process of CBI; strong CBI resulted in negative switching behaviour. Fourth, the study shows that perceived product quality does not necessarily lead to CBI, as the perceived quality should fulfil and satisfy the self-definitional needs of consumers in order to result in CBI.
Practically, in the competitive markets, the primary goal of firms is to retain their consumers; therefore, to some extent, it is suggested that BP plays a pivotal role in perceived product quality, satisfaction and CBI. This finding can be very useful for policymakers and global business strategists to take into their consideration that, in order to penetrate the Malaysian market, they have to place great emphasis on forming BP, mainly focusing on the excitement, competence and sophistication parts of personality as these traits can create a BP in such a way that have a very strong positive impact on consumer perceived quality, CBI and satisfaction, which in turn reduces the switching behaviour of consumers. Consequently, the conceptualized framework of this study can be a comprehensive guideline for domestic and international businesses in that for positioning their brands in Malaysia, they ought to consider such antecedents to position their brands successfully in order to not witness any consumer switching behaviour affecting their product.
Limitation and Future Research Direction
Even though the study has made numbers of contributions to the body of knowledge, there are still some limitations which should be acknowledged and be addressed for future study. First, the empirical outcome of this study demonstrates that there is no relationship between customer satisfaction and consumer brand identification. To examine the robustness of such an insignificant result, future research should re-examine and address this hypothesized relationship. Second, in order to validate the outcome of this study, future research is encouraged to examine this hypothesized model in different cultural, as well as industrial settings. Third, it will be very interesting for future study to test the impacts of BP’s dimensions on consumer brand identification, perceived product quality, and switching behaviour. This examination can add value to the findings and provide more insight into switching behaviour studies.
Conclusion
To conclude, this study was carried out to illustrate the role of brand personality and perceived product quality on switching behaviour studies. The findings of our study reveal that BP plays a key role in consumer’s evaluation of perceived product quality and consumer brand identification. Even though the current study paid close attention to only one category of product (mobile phones’ industry) in the Malaysian market, it is shown that in order to boost consumer’s perceived product quality, satisfaction and consumer brand identification, which finally will result in having negative relationship with consumer switching behaviour, marketers should dedicate more time to research development to find out how they can enhance the BP of their product.
Footnotes
Acknowledgements
The authors are grateful to the anonymous referees of the journal for their extremely useful and valuable comments and suggestions to improve the quality of the article. Usual disclaimers apply.