
Abstract
This study applies a data envelopment analysis (DEA) approach and a two-limit Tobit model to measure the technical efficiency of Thai manufacturing small and medium enterprises (SMEs) and examine firm-specific factors contributing to it by using firm-level industrial censuses data in 1997 and 2007. The empirical results reveal that the overall average technical efficiency is relatively low, which can potentially reduce their output contribution. Empirical results also indicate that firm size, firm age, skilled labour, location, type of manufacturing ownerships, cooperatives, foreign investment and exports are important firm-specific factors contributing to the technical efficiency of Thai manufacturing SMEs. Therefore, specific policies are required to improve the technical efficiency of SMEs and these include easier access to financial services, credit facilities, equity in terms of the political operation, educational system, extensive infrastructural development and technological upgrading, marketing and management.
Keywords
Introduction
Small and medium enterprises (SMEs) 1 play a pivotal role in accelerating Thai economic development. SMEs provide backward linkages for large enterprises through supply of goods, services, information and knowledge (Amornkitvikai & Charoenrat, 2015; Buranajarukorn, 2006; Charoenrat & Harvie, 2013, 2014; Charoenrat, Harvie & Amornkitvikai, 2013; Harvie & Charoenrat, 2015; Huang, 2003; OSMEP, 2009; Regnier, 2000). The number of Thai SMEs was 1,835,873 enterprises, representing 99 per cent of all enterprises in the country and employed more than seven million workers, accounting for 73 per cent of total employment during the period 1994 2 to 2009. The value of exports by SMEs was THB 1,311,493 million or 33.02 per cent of total exports on overage over the period 2000–2009 (Office of Small and Medium Enterprises Promotion, 2001–2009). The contribution of SMEs to GDP, at current prices, was approximately 38.84 per cent of total GDP over the period 1999–2009 (Office of Small and Medium Enterprises Promotion, 2001–2009). The average number of manufacturing SMEs was approximately 460,002, or 27.14 per cent of total SMEs over the period 1994–2009. The employment contribution of manufacturing SMEs was around 2,630,800 workers during 1994–2009 which, on average, is equivalent to about 27.13 per cent of total employment in the private sector in this period. The contribution of manufacturing SMEs to total SME GDP is about THB 748,749 million, or 28.68 per cent of total SME output in 1994–2009 (Office of Small and Medium Enterprises Promotion, 2001–2009).
Despite their obvious significance, Thai SMEs face a number of disadvantages that act as barriers to their development. These barriers comprise: financial constraints, lack of technical and innovation skills, lack of integration in domestic and international markets, lack of export knowledge among others (Amornkitvikai & Charoenrat, 2015; Charoenrat & Harvie, 2013, 2014; OSMEP, 2008, 2009; Punyasavatsut, 2007; Sarapaivanich, 2003). However, there is little evidence on Thailand’s manufacturing SMEs particularly in terms of their technical efficiency and its determinants. The major motivation of this study is to estimate and compare the technical efficiency of Thai manufacturing SMEs in 1997 and 2007.
The paper is structured as follows. The second section explains the methodology and a brief discussion of the concept of efficiency. The third section outlines data and key variables for data envelopment analysis (DEA) and a Tobit model. Econometric models and hypotheses tests are shown in the fourth and fifth sections, respectively. The empirical results are discussed in the sixth section. The seventh section presents the key outcomes from the model. The eighth section summarizes the average technical efficiency of Thai manufacturing SMEs. Policy implications and conclusions are presented in the ninth and tenth sections, respectively.
Review of Literature
An analysis of efficiency in enterprises widely estimates the efficiency of a firm and scale economy of an enterprise by employing the concept of the production function (Bawa & Kaur, 2014; Charoenrat & Harvie, 2014; Coelli et al., 2005; Kamarudin et al., 2014; Murillo-Zamorano, 2004; Tandon, Tandon & Malhotra, 2014). Yang (2006) investigated the scale efficiency and technical efficiency of local small- and medium-sized funded enterprises in Korea. This study used DEA to compare the efficiency of enterprises located in the capital and non-capital regions in an attempt to analyze the advantages and disadvantages of capital reallocation policy. It found that the region is meaningful for SMEs, because of resource allocation and regional economy restructuring. The results suggested that the efficiency indexes of large-sized enterprises are high and the efficiency of the capital and non-capital regions are different. Thus, it is concluded that the efficiency and proper distribution of equity in political operation, such as a balanced local development through promotion for local small- and medium-sized enterprises, is desirable for the whole country. The assessment of the effectiveness of government policy is an important issue for local Korean SMEs (Yang, 2006).
Krasachat (2000) measured technical efficiency in Thai agricultural production for the period 1972–1994. DEA is utilized to estimate overall technical, scale and pure technical efficiency of aggregate Thai agriculture production (farms), particularly crops such as rice, cotton, cassava, groundnuts, soybeans, moonbeams, sugar cane, corn and sorghum. The results showed that an efficiency level of some regions was low. There is a decline in overall technical, scale and pure efficiencies. It can be suggested that Thai farms need to increase their efficiency level. It is significant to improve the technical efficiency level by increasing farm size. Extension services should be applied in order to improve the technical efficiency of Thai farms, including technology and optimal farm management practices, modern varieties of plants, fertilizers, irrigation, mechanisation and chemicals. Furthermore, new land, the diversity of climate and natural resources might affect the technical efficiency level of Thai agricultural production (Krasachat, 2000).
Wiboonchutikula (2002) investigated trends in the SME sector in Thailand, focusing upon employment, export ability and subcontracting activity. The data used in this study was based on industrial census data for 1997 from the National Statistical Office (NSO) of Thailand. The author utilizes technical efficiency and total factor productivity (TFP) as measures to analyze the productivity of small- and medium-sized enterprises. A translog production function is used to estimate technical efficiency indices. This study presented that over the period 1987–1996, the SME share of overall employment declined from 60 per cent to 52 per cent. This was particularly noticeable for the small firm category, which is for firms with less than 10 employees. This perspective is explored further by considering small firm employment shares in three sub-periods with varying overall economic growth rates. It is shown that when overall economic growth is high, the share of small firms seems to contract, possibly because several small firms turn to medium sized and others are closed down because their owners can discover more remunerative work in larger firms. However, during slower growth rate periods the proportion of employment in small firms tends to increase, because the larger firms may hire less new employees or lay off employees (Wiboonchutikula, 2002).
Zahid and Mokhtar (2007) estimated the technical efficiency levels of Malaysian manufacturing SMEs. The authors utilized cross-sectional data of manufacturing industries conducted by the Department of Statistics of Malaysia in 2002. A Cobb–Douglas stochastic production frontier is applied in order to estimate the technical efficiency levels of Malaysian manufacturing SMEs. The results presented indicate that all coefficients in the stochastic frontier production function are positive and significant. This indicates that inputs have a positive relationship, and are significant, to manufacturing SMEs’ production levels. The average technical efficiency of overall manufacturing SMEs is 76.09 per cent. It can be indicated that Malaysian manufacturing SMEs have approximately 24 per cent inefficiency in their production process. It is suggested that the Malaysian government should play a role in improving the performance of manufacturing SMEs, such as through training programmes for employees and by means of financial assistance (Zahid & Mokhtar, 2007).
Objectives
The main objectives of this study are: (i) To estimate the level of technical efficiency of Thai manufacturing SMEs in 1997 and 2007. The estimation is performed by size of manufacturing SMEs (small and medium), by domestic market intensity, and by export intensity. It also examines firm-specific factors that could affect technical efficiency. (ii) To identify appropriate policies to improve the efficiency of Thailand’s manufacturing SMEs.
Rationale of this Study
The primary motivation of this study is to identify the under-performance of Thai manufacturing SMEs in terms of their output and technical efficiency, and investigate firm-specific factors that influence their relatively poor performance. Such an empirical analysis has not been conducted previously for Thai manufacturing SMEs. This article is the first empirical study to use DEA to estimate and compare the technical efficiency of Thai manufacturing SMEs in 1997 and 2007. The results obtained will be important in assisting the implementation of effective SME policies aimed at tackling the poor performance of Thai Manufacturing SMEs.
Methodology—Data Source, Sample Frame and Empirical Model
The performance of a firm can be measured by its technical and allocative efficiencies. 3 Technical efficiency can be estimated using either stochastic frontier analysis (SFA) or DEA (Bawa & Kaur, 2014; Charoenrat & Harvie, 2014; Coelli, 1996b; Coelli et al., 2005; Herrero & Pascoe, 2002; Kontodimopoulos et al., 2010). SFA is a parametric approach where the form of the production function is assumed to be known and is estimated statistically (Coelli, 1996a; Coelli et al., 2005). The advantages of SFA are that hypotheses can be tested with statistical rigour, and that relationships between inputs and outputs follow known functional forms (Admassie & Matambalya, 2002; Arunsawadiwong, 2007; Charoenrat et al., 2013; Coelli et al., 2005; Zahid & Mokhtar, 2007). On the other hand, DEA is a non-parametric approach that involves the use of linear programming to construct an efficiency frontier. It does not require assumptions concerning the form of the production function. Instead, the best practice production function is created empirically from observed inputs and outputs. DEA does not identify the difference between technical inefficiency and random error (Admassie & Matambalya, 2002; Arunsawadiwong, 2007; Bawa & Kaur, 2014; Coelli et al., 2005; Tandon et al., 2014; Vu, 2003; Zahid & Mokhtar, 2007). Therefore, DEA is used in this study because of its advantages over alternative methods.
Data Source
This study uses firm-level data from industrial censuses during 1997 and 2007 compiled by the NSO of Thailand. The scope of these censuses consists of enterprises engaged in manufacturing industry activities (Category D International Standard Industrial Classification of all Economic Activities, ISIC: Rev.3) (NSO, 2011a, 2011b). The total numbers of Thai manufacturing SMEs in 1997 and 2007 industrial censuses are 22,685 and 56,441, respectively. The key variables are output value added (Y), labour input (L), capital input (K). Output value added (Y) is defined as the value of gross output minus intermediate consumption. Labour input (L) includes the number of workers in the enterprise, including owner or partner, unpaid workers, skilled and unskilled labour. Capital input (K) is measured by the net value of fixed assets less depreciation at the end of the year.
Sample Frame and Empirical Model
The output-orientated variable return to scale (VRS) model assumes that firms are not operating at optimal scale efficiency due to government regulations, imperfect competition and financial restrictions (Amornkitvikai, 2011; Coelli et al., 2005; Cooper, Seiford & Tone, 2006). It is used assuming fixed input quantities and maximized output production. Thus, the output-orientated DEA model under the assumption of VRS can be expressed as follows (Amornkitvikai, 2011; Coelli et al., 2005; McDonald, 2009):

where ϕ is a scalar (an efficiency parameter). 1 ≤ ϕ < ∝ and ϕ – 1 represent the proportional increase in output (yi) that can be obtained by the ith firm, while holding input quantities (xi) constant (Amornkitvikai, 2011; Coelli et al., 2005);
The second-step of the two-stage DEA approach deals with firm-specific factors that could affect a firm’s technical efficiency. The two-stage method does not require prior assumptions concerning the direction of the influence of firm-specific factors (Amornkitvikai, 2011; Coelli et al., 2005; Hoff, 2007). Hence, a two-stage DEA approach consists of two steps (Alvarez & Crespi, 2003; Amornkitvikai, 2011; Coelli et al., 2005; Hoff, 2007; McDonald, 2009): (i) the first-step DEA involves solving a linear programming problem using traditional inputs and outputs and (ii) the second-step DEA involves the technical efficiency scores obtained from the first-step DEA being regressed upon firm-specific factors (Amornkitvikai, 2011; Coelli et al., 2005).
As an alternative to OLS regression, a Tobit model can be used, and is recommended in the second stage of the DEA approach (Amornkitvikai, 2011; Coelli et al., 2005; Kumbhakar & Lovell, 2000). For the Tobit model, hypothesis tests can be conducted to test for the statistical significance of firm-specific factors on a firm’s technical inefficiency (Alvarez & Crespi, 2003; Amornkitvikai, 2011; Coelli et al., 2005; Hoff, 2007; McDonald, 2009; Tandon et al., 2014). The technical inefficiency scores of the firm are used as the dependent variable, which can be obtained by subtracting the technical efficiency scores estimated from the output-orientated VRS model from unity (Amornkitvikai, 2011; Coelli et al., 2005). The set of firm-specific factors can be utilized as independent variables for the two-stage DEA model. The estimated technical inefficiency scores are bounded between zero and unity (Amornkitvikai, 2011; Coelli et al., 2005; Kumbhakar & Lovell, 2000). Applying OLS regression with a dependent variable whose values are bounded between zero and unity, however, may lead to bias and inconsistent estimators, since the OLS regression can predict technical inefficiency scores greater than unity (Amornkitvikai, 2011; Coelli et al., 2005; Kumbhakar & Lovell, 2000). Therefore, the maximum likelihood method for a two-limit Tobit model can be expressed as follows (Amornkitvikai, 2011, p. 194; Hoff, 2007; McDonald, 2009):
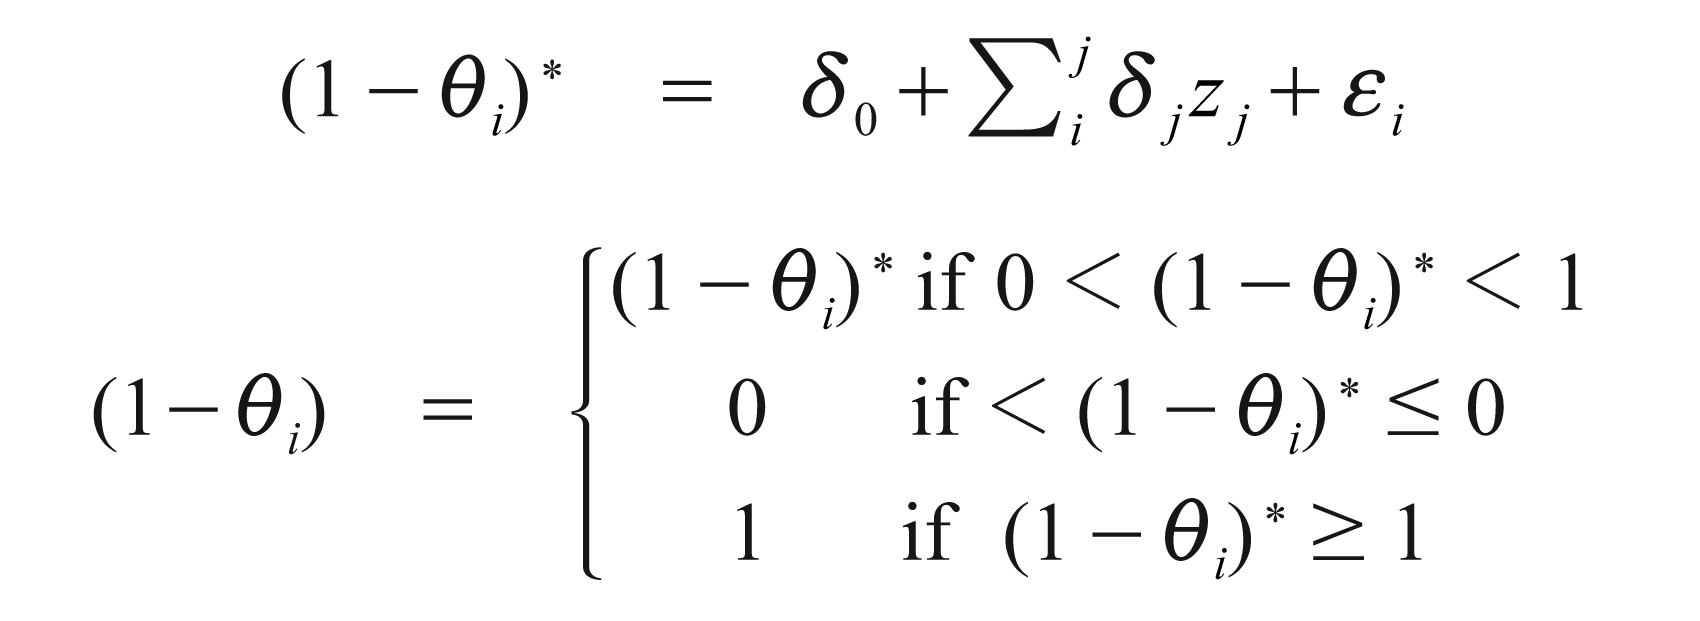
where (1 – οi)* represents the unobserved technical inefficiency scores for the ith firm; (1 – οi) denotes the observed technical inefficiency scores for the ith firm; δj is an unknown parameter to be estimated for each explanatory variable or firm-specific factor of the ith firm; zj is an explanatory variable or firm-specific factor of the ith firm; and εi is a random variable, which is assumed to be an independently and identically distributed normal variable with zero mean and variance
Hypotheses Tests
The hypothesis is tested in this section utilizing a Tobit model (DEA). It is insignificance of joint inefficiency variables. This test is conducted by using the generalized likelihood-ratio (LR) test, which can be expressed as:

where log[L(H0)] and log[L(H1)] are the values of a log-likelihood function for the Tobit model under the null hypothesis (H0) and the alternative hypothesis (H1).
From Table 1 the null hypothesis (H0) specifies that all estimated parameters of the explanatory variables in the Tobit model are equal to zero. This also indicates that the Tobit model is not a linear function in the model. The null hypothesis (H0) is strongly rejected at the 1 per cent level of significance for small- and medium-sized enterprises, and domestic and exporting SMEs in both 1997 and 2007, given the specifications of a two-limit Tobit model as specified by equation (2).
Statistics for Hypothesis Tests of the Two-stage DEA Model (a Two Limit Tobit Model) for Size of Manufacturing SMEs (Small and Medium), and Domestic and Exporting SMEs
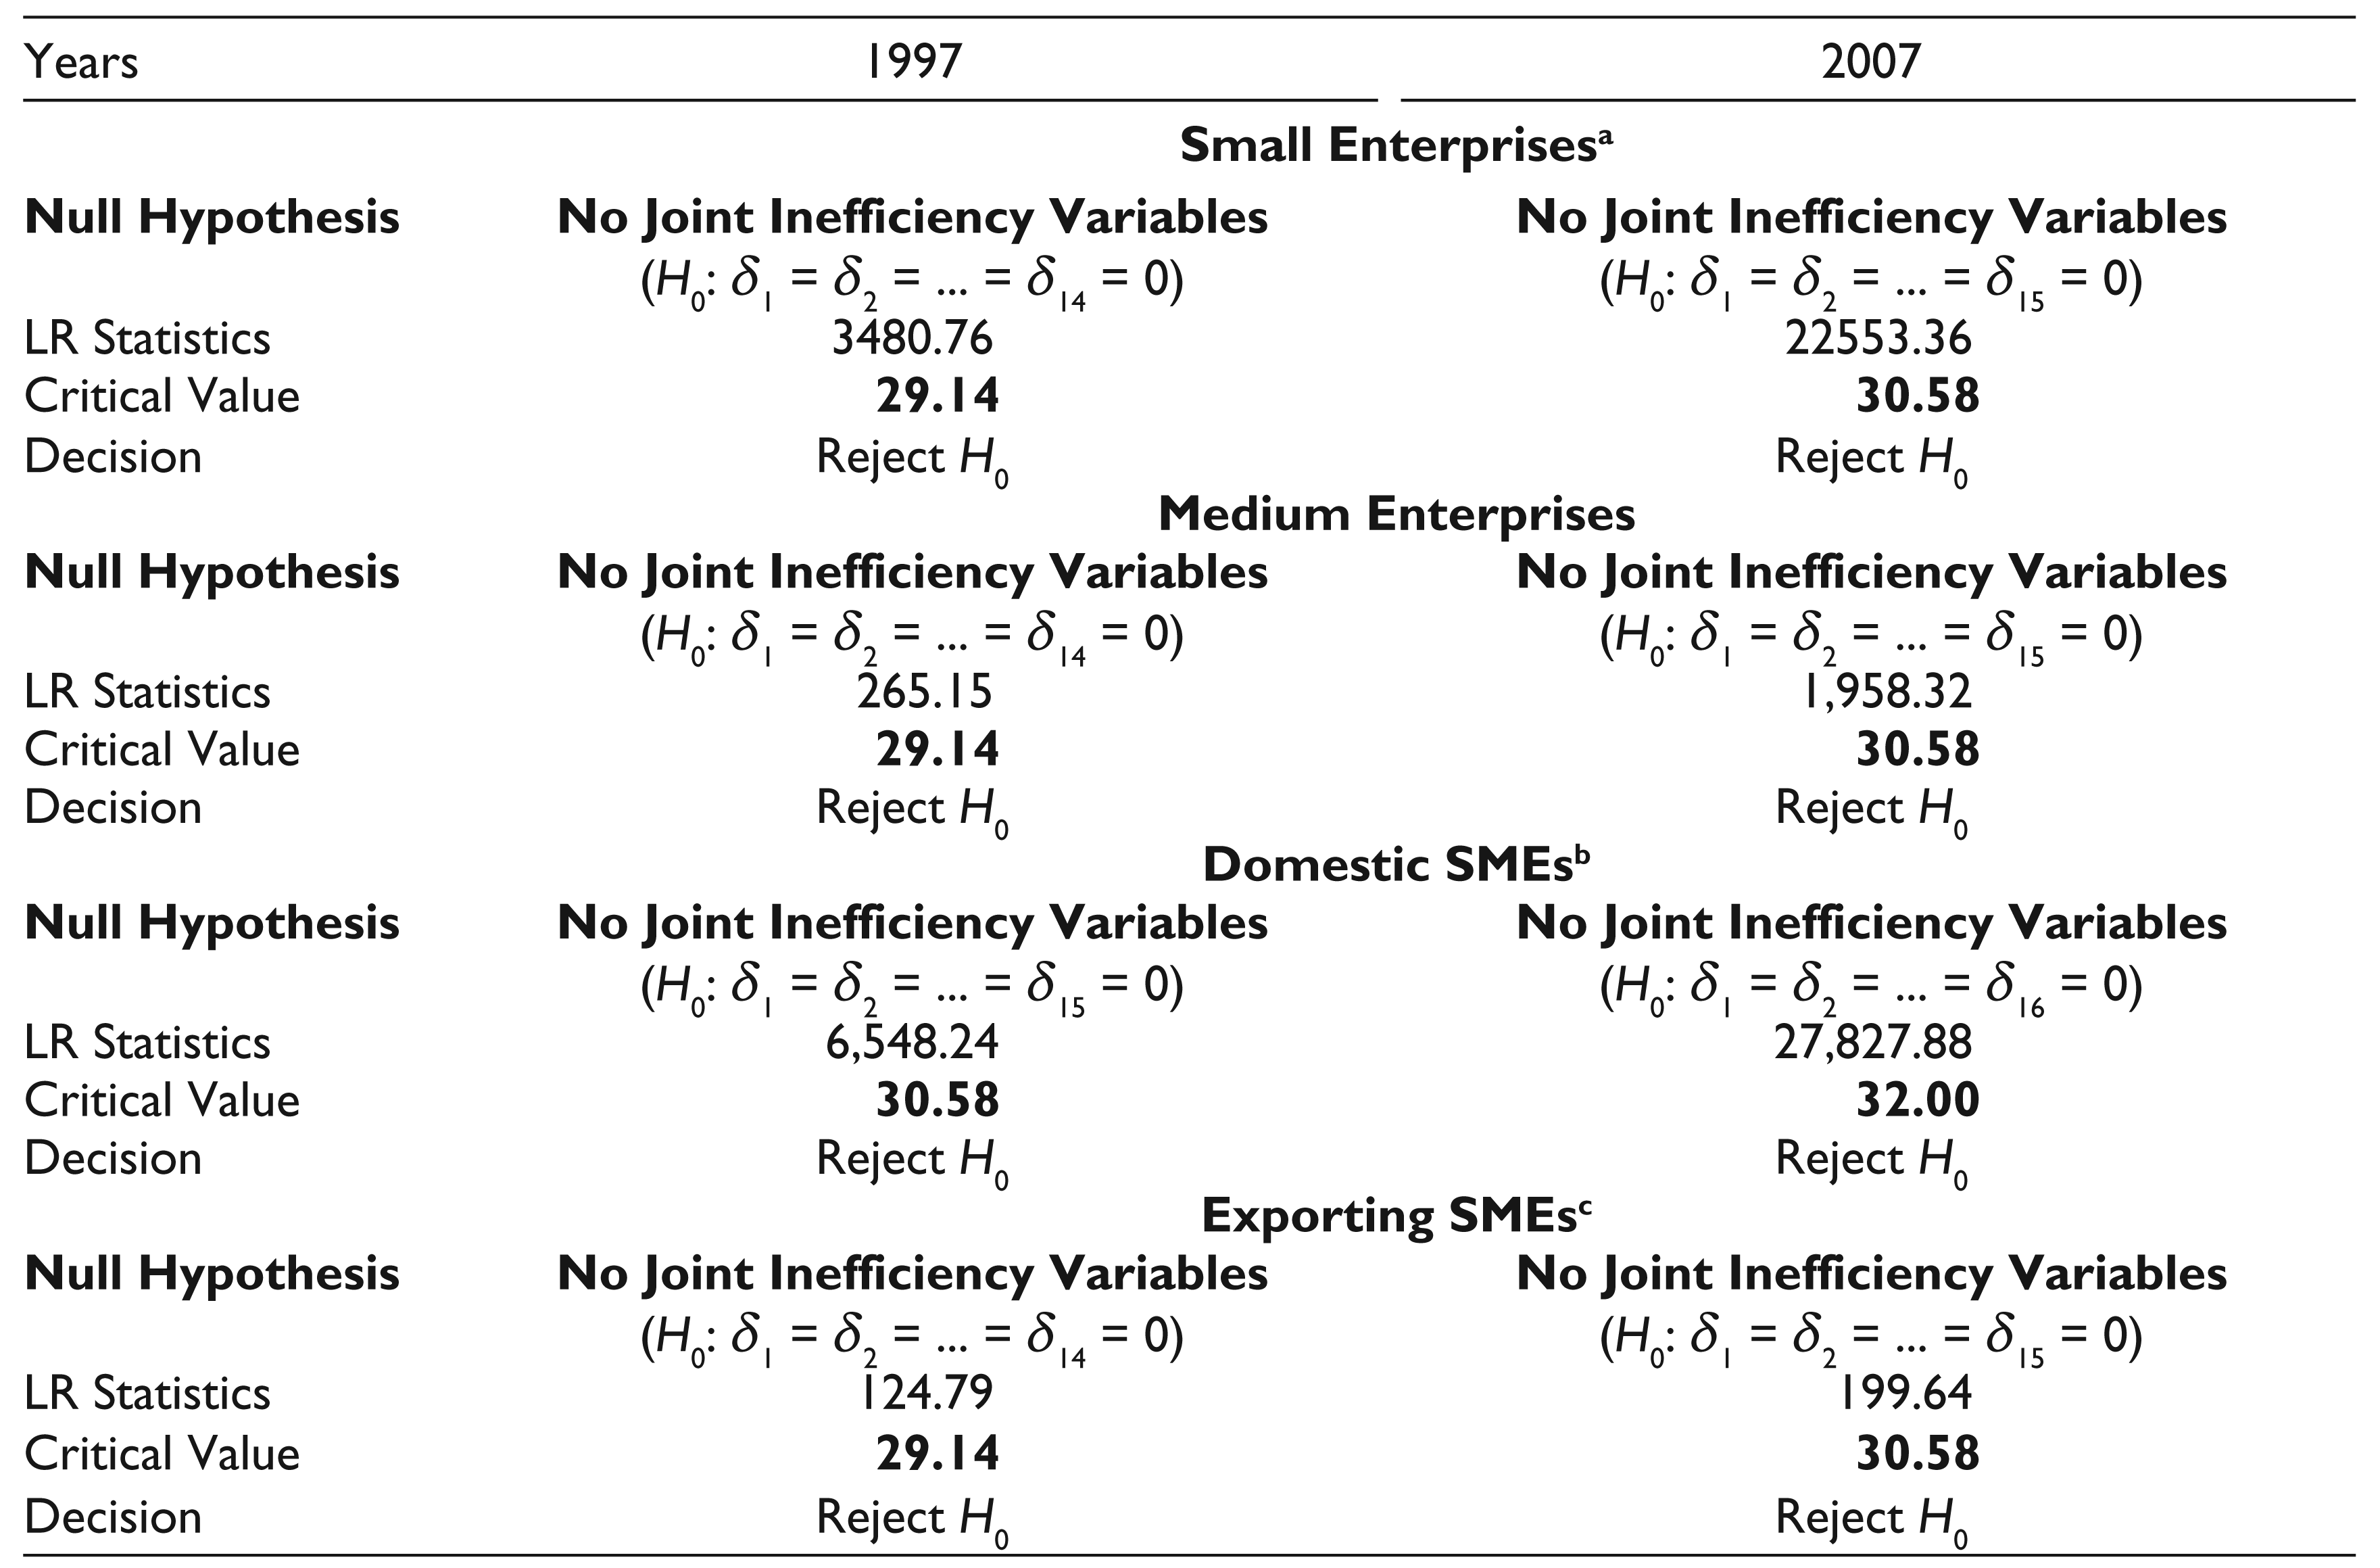
All critical values of the test statistic are presented at the 1 per cent level of significance, obtained from a chi-square distribution. aIn 1997 small and medium sized enterprises had 15 inefficiency variables, whereas there are 16 inefficiency variables in 2007. bDomestic SMEs had 15 inefficiency variables in 1997, whereas there are 16 inefficiency variables in 2007. cFor 1997 exporting SMEs had 14 inefficiency variables, whereas there are 15 inefficiency variables in 2007.
Analysis
This section provides empirical results obtained from the first step of the two-stage DEA approach for Thai manufacturing SMEs in the period 1997 and 2007 in two categories: by size of manufacturing SMEs (small and medium), by domestic market intensity, by export intensity. The estimates of the DEA model, as specified by equation (1), were estimated utilizing the computer program DEAP Version 2.1 developed by Coelli (1996b). The DEA results using DEAP 2.1 are reported in Table 2.
Results from the First Step of the Two-stage DEA Model
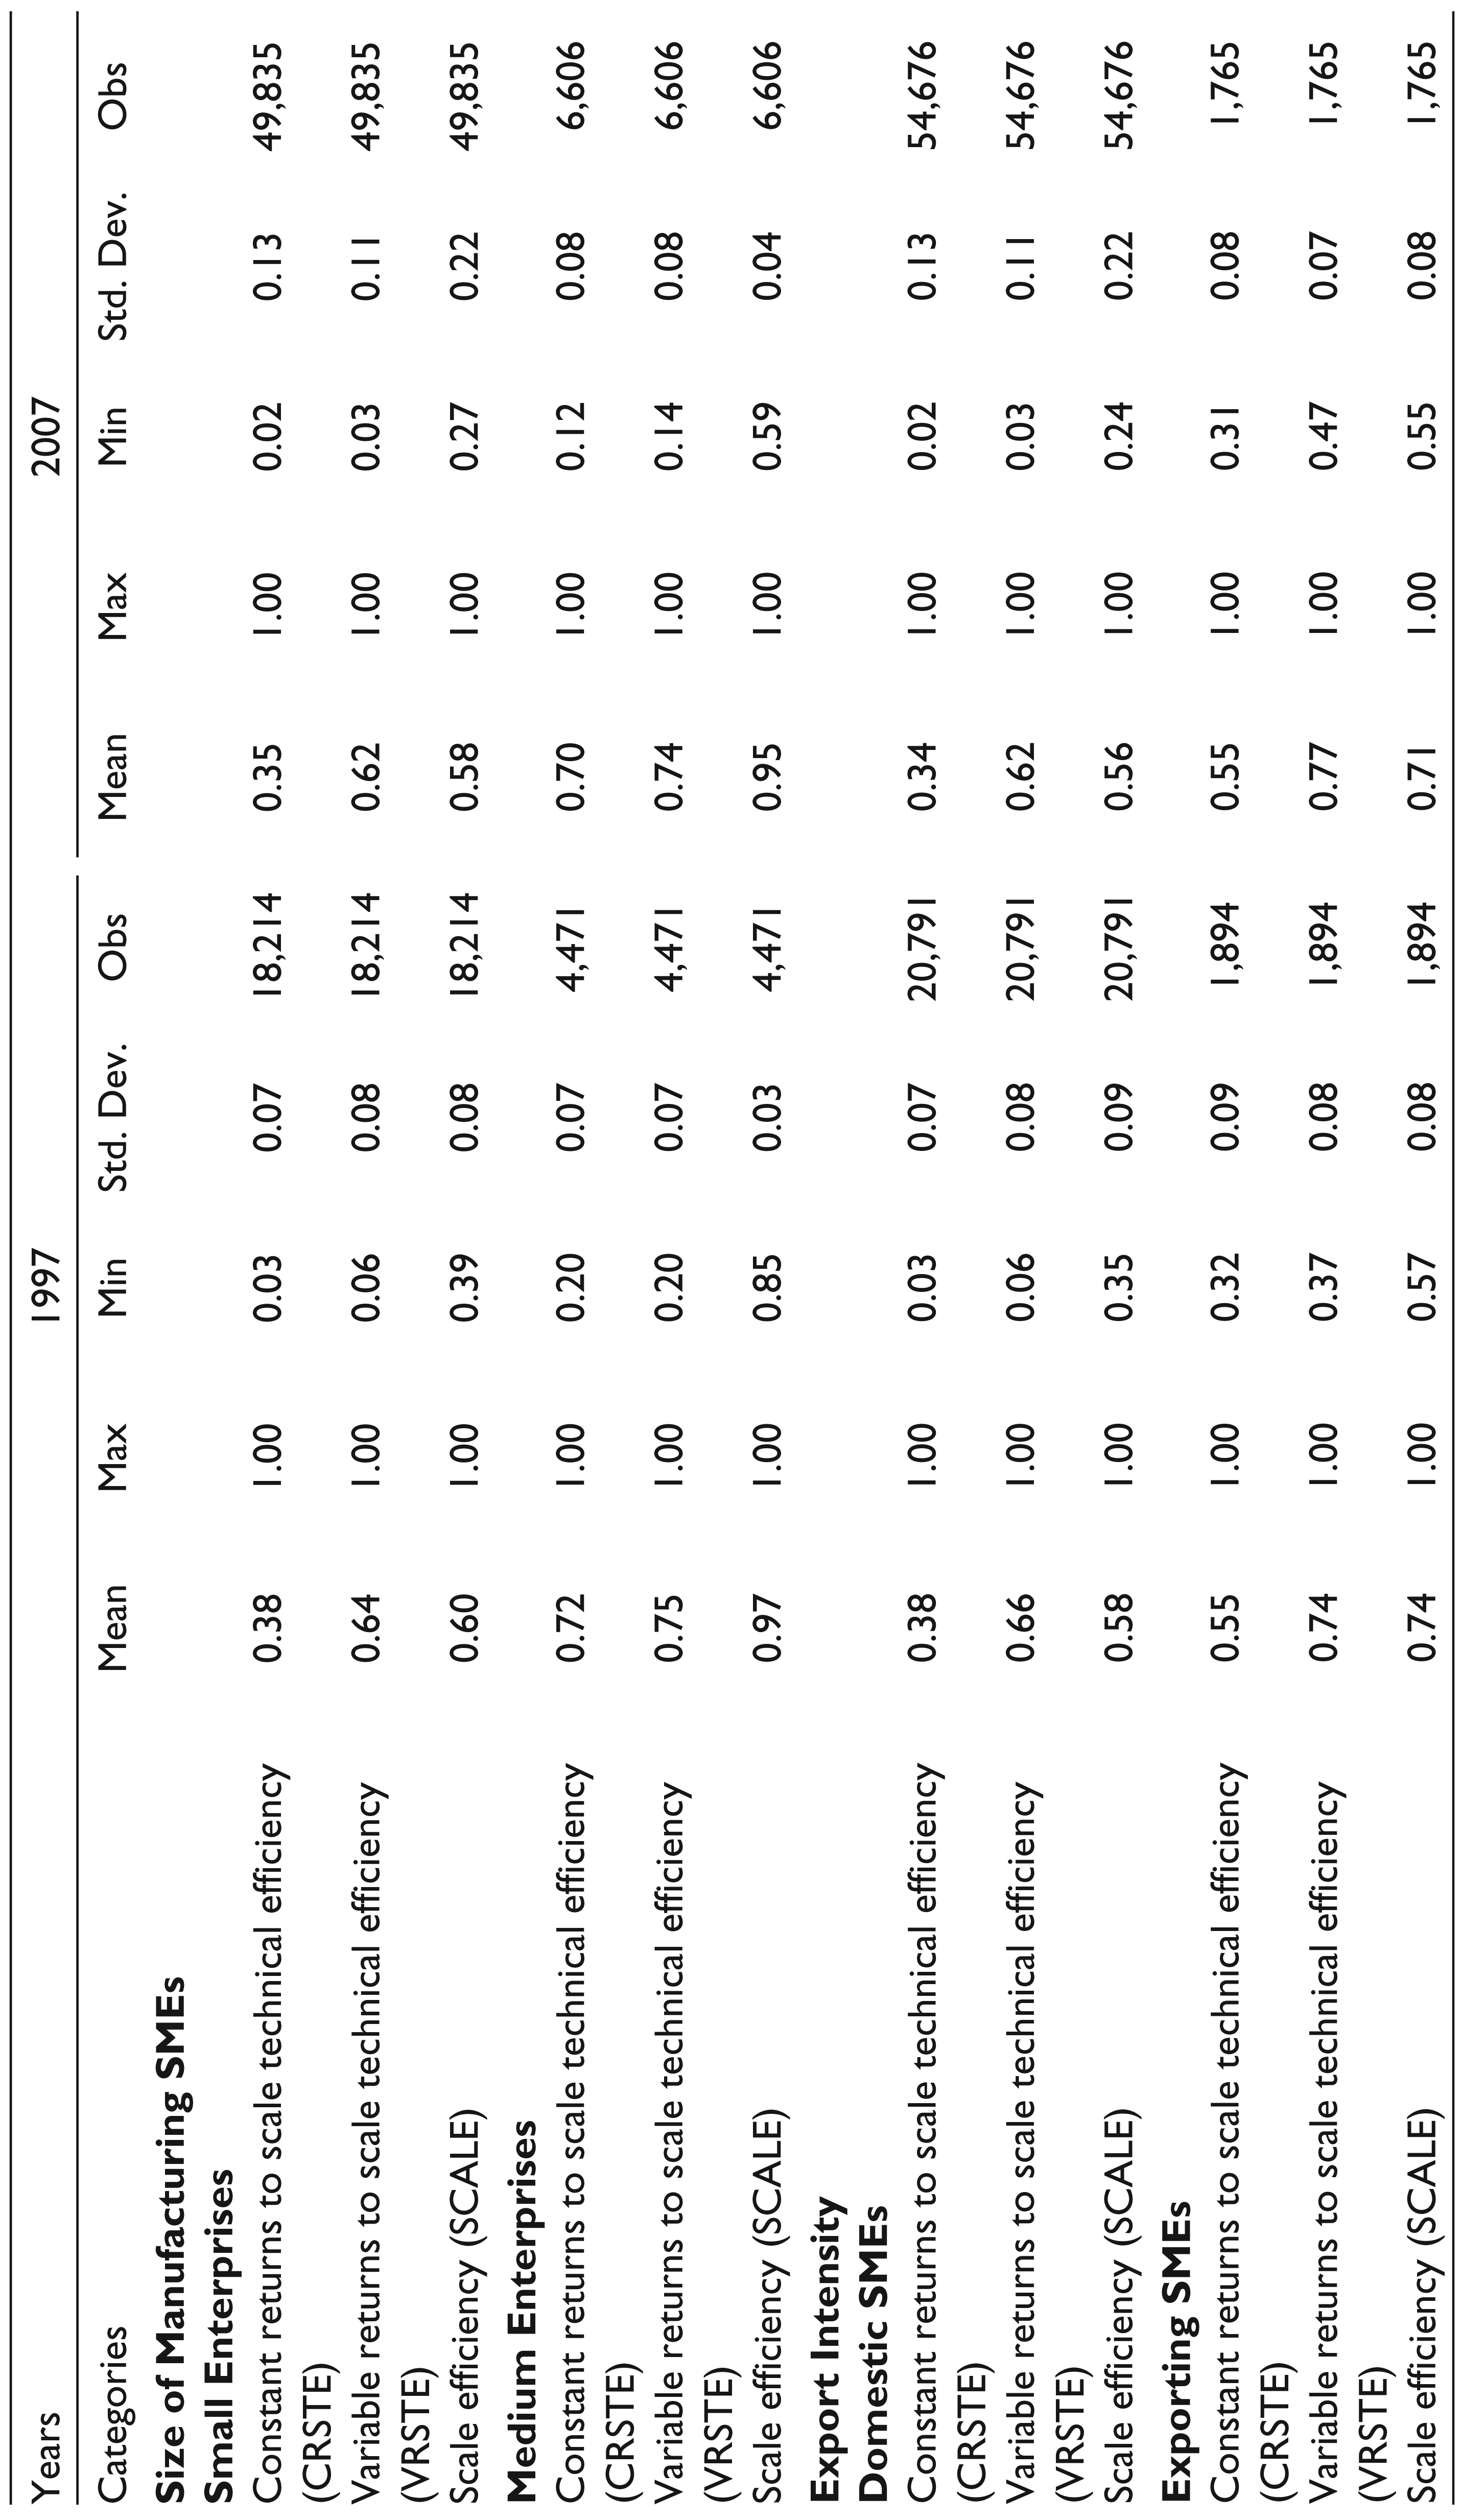
The output-orientated DEA model 4 under the assumption of VRS is utilized assuming fixed input quantities and maximized output production. Two inputs (capital and labour) and one output (value added), are also used to estimate the DEA technical efficiency scores. The technical efficiency scores are predicted by the output-orientated VRS DEA model, as defined by equation (1). The multi-stage DEA in DEAP Version 2.1 is the method used to measure VRS technical efficiency scores for the first-stage DEA approach (Amornkitvikai, 2011; Coelli, 1996b; Coelli et al., 2005). DEAP 2.1 provides three different types of technical efficiency scores: 1) constant returns to scale technical efficiency (CRSTE); 2) variable returns to scale technical efficiency (VRSTE); and 3) and scale efficiency.
Table 2 summarizes the average VRSTE scores by size of manufacturing SMEs (small and medium) in the periods 1997 and 2007. In terms of the size of manufacturing SMEs, small manufacturing SMEs in 2007 had 62 per cent mean VRS technical efficiency, showing a decrease of 2 per cent from 1997. Medium-sized manufacturing SMEs had 75 per cent mean VRS technical efficiency in 1997. In 2007, the average VRS technical efficiency of medium manufacturing SMEs decreased to 74 per cent (see Table 2). From Table 2, the mean VRS technical efficiency of domestic manufacturing SMEs was 66 per cent in 1997. In 2007, the average VRS technical efficiency of domestic manufacturing SMEs declined to 62 per cent. In 1997, exporting manufacturing SMEs had 74 per cent mean VRS technical efficiency. In 2007, the mean VRS technical efficiency of exporting manufacturing SMEs increased to 77 per cent (see Table 2).
Results from Estimates of Technical Efficiency Scores for the First-step of the Two-stage DEA Approach by Size of Manufacturing SMEs (Small and Medium), Domestic and Exporting SMEs
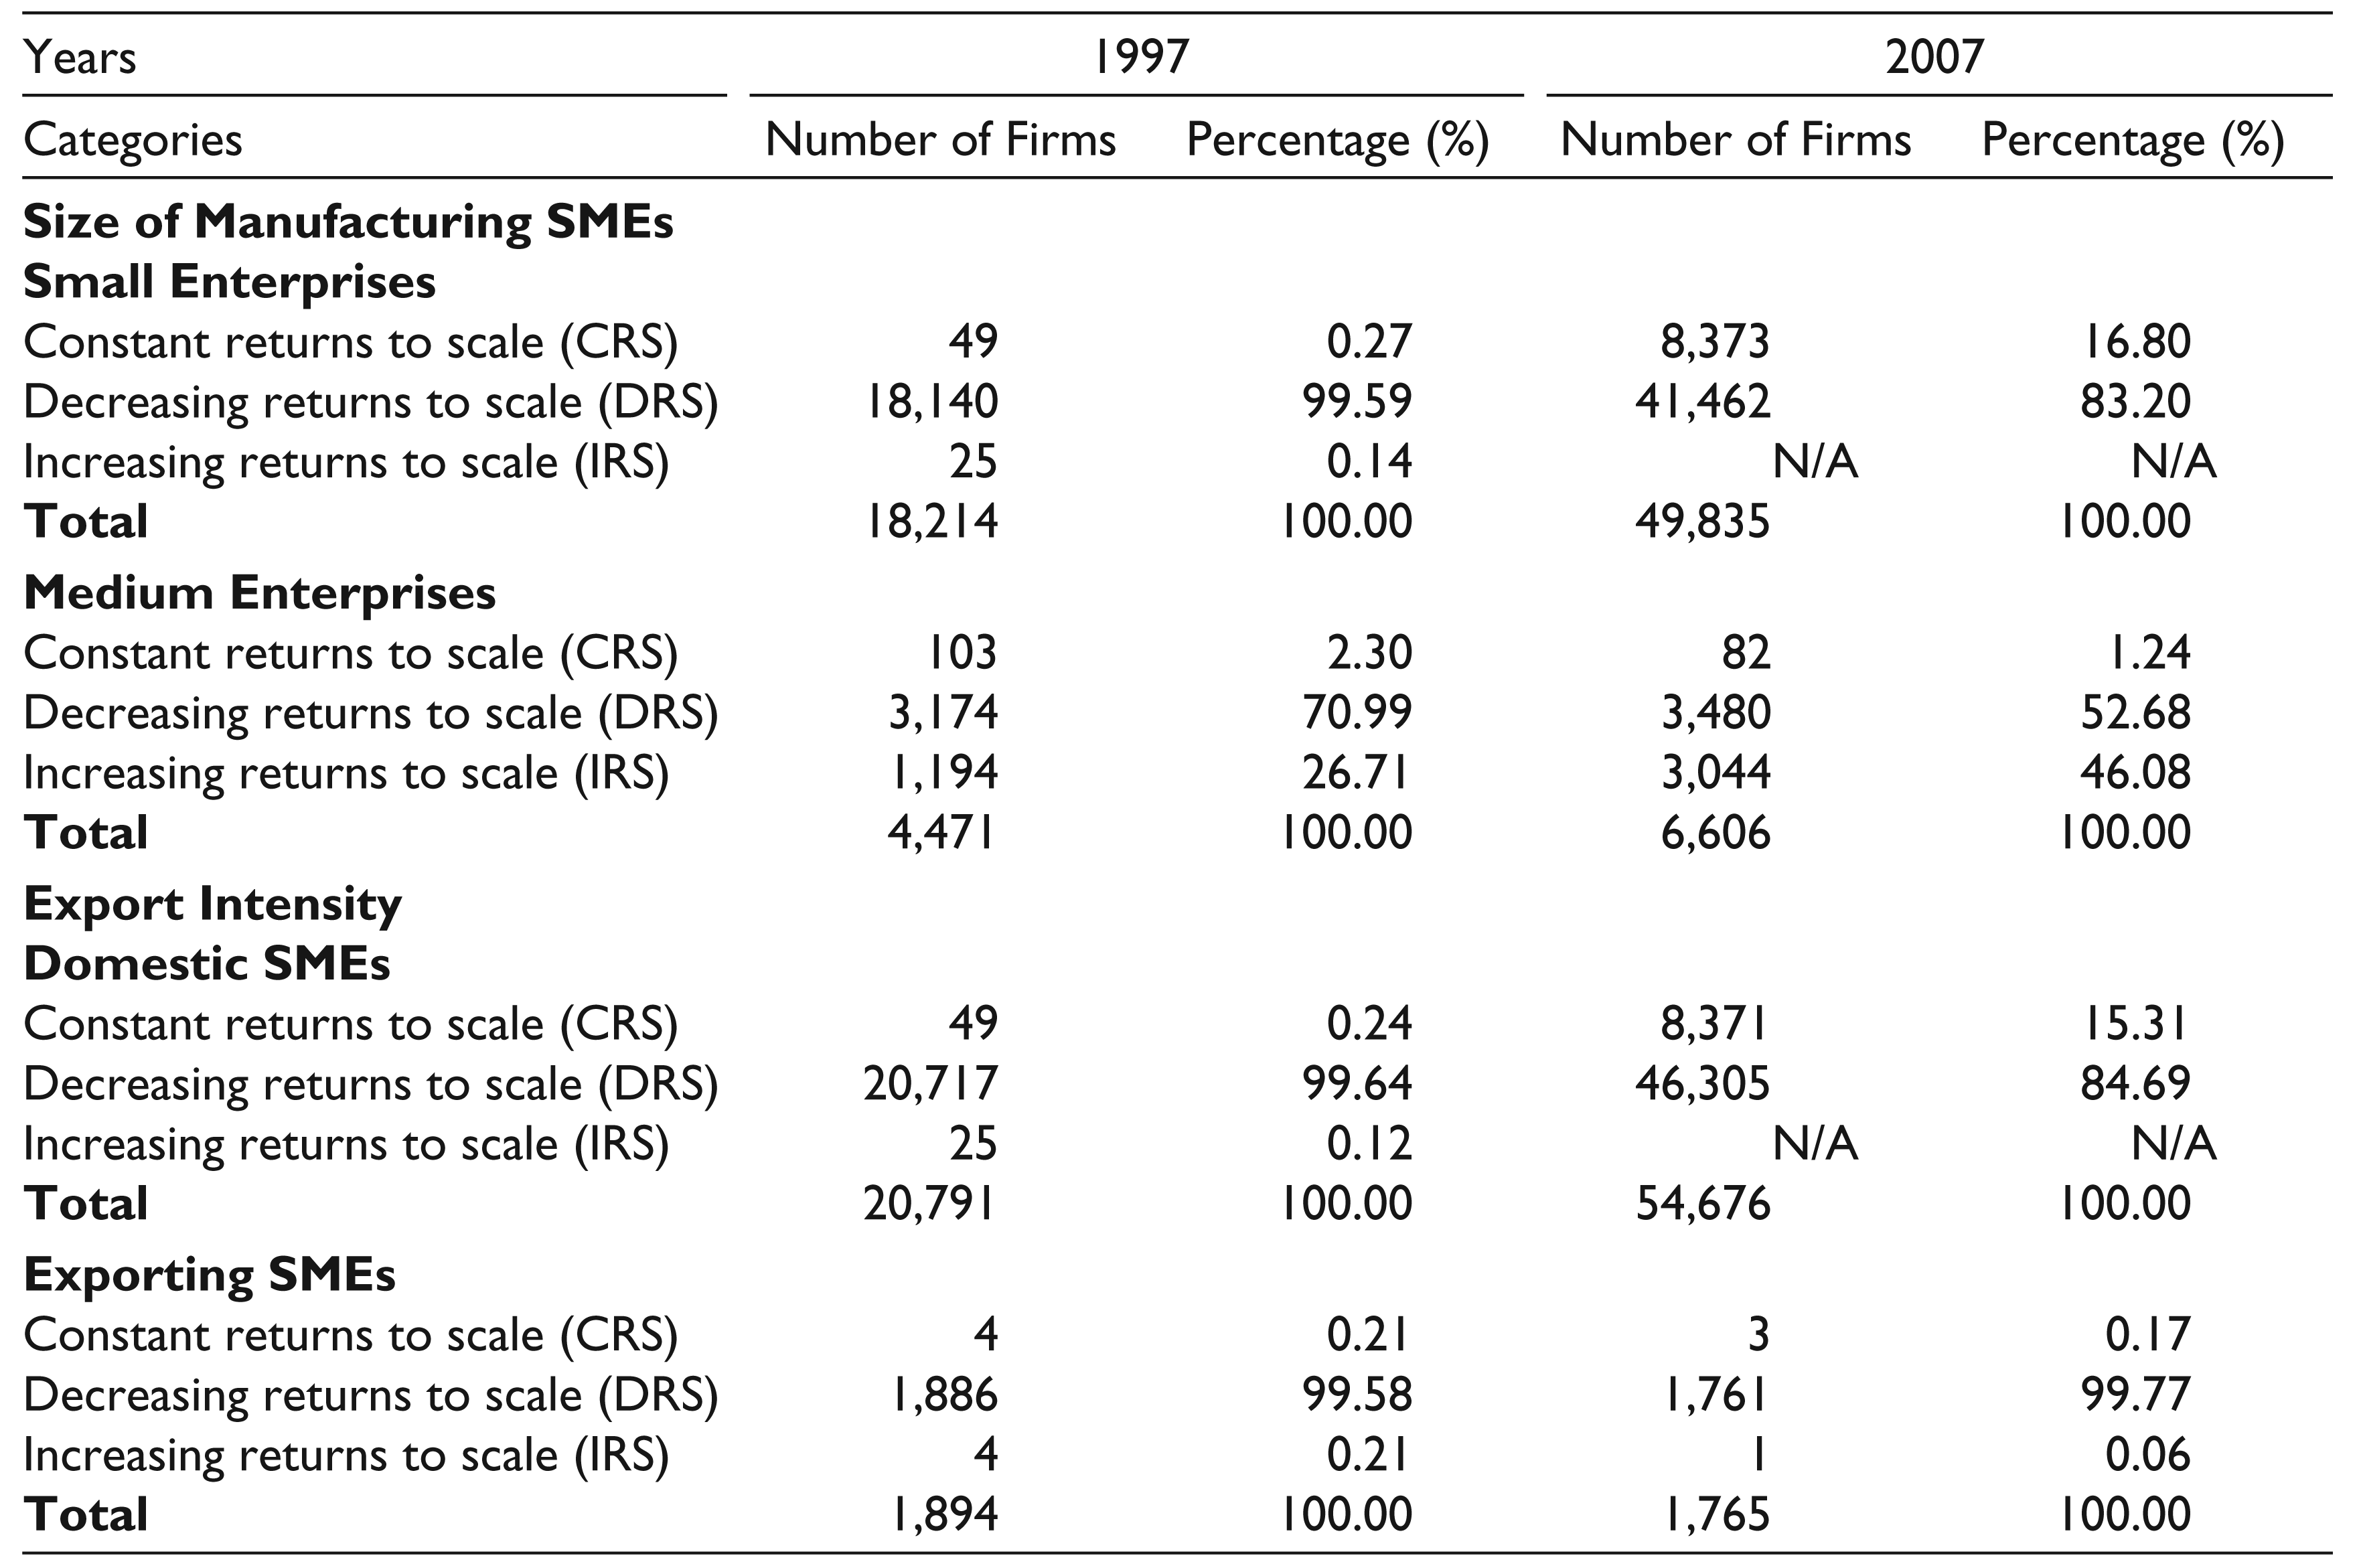
Furthermore, DEAP Version 2.1 provides three types of returns to scale: 5 (i) constant returns to scale (CRS); (ii) decreasing returns to scale (DRS); and (iii) increasing returns to scale (IRS). From Table 3, it can be observed that small manufacturing SMEs also operated under decreasing returns to scale (DRS) in 1997 and 2007, accounting for 99.59 per cent and 83.20 per cent of all firms, respectively. In 2007, medium-sized manufacturing SMEs revealed modest decreasing returns to scale (DRS) at 52.68 per cent of the total firms, whereas about 70.59 per cent of medium-sized manufacturing SMEs in 1997 operated under decreasing returns to scale (DRS) (see Table 3). In Table 3, domestic manufacturing SMEs reveal highly decreasing returns to scale (DRS) in the period 1997 and 2007, representing 99.64 per cent and 84.69 per cent of total firms, respectively. Exporting manufacturing SMEs in 1997 and 2007 also exhibit highly decreasing returns to scale (DRS), accounting for 99.58 per cent and 99.77 per cent of total firms, respectively (see Table 3).
Number and Percentage of Size of Manufacturing SMEs (Small and Medium), Domestic and Exporting SMEs, Classified by Types of Returns to Scale
Results for the Simple Average and Weighted Average Technical Efficiency Levels of Thai Manufacturing SMEs (Using DEA)
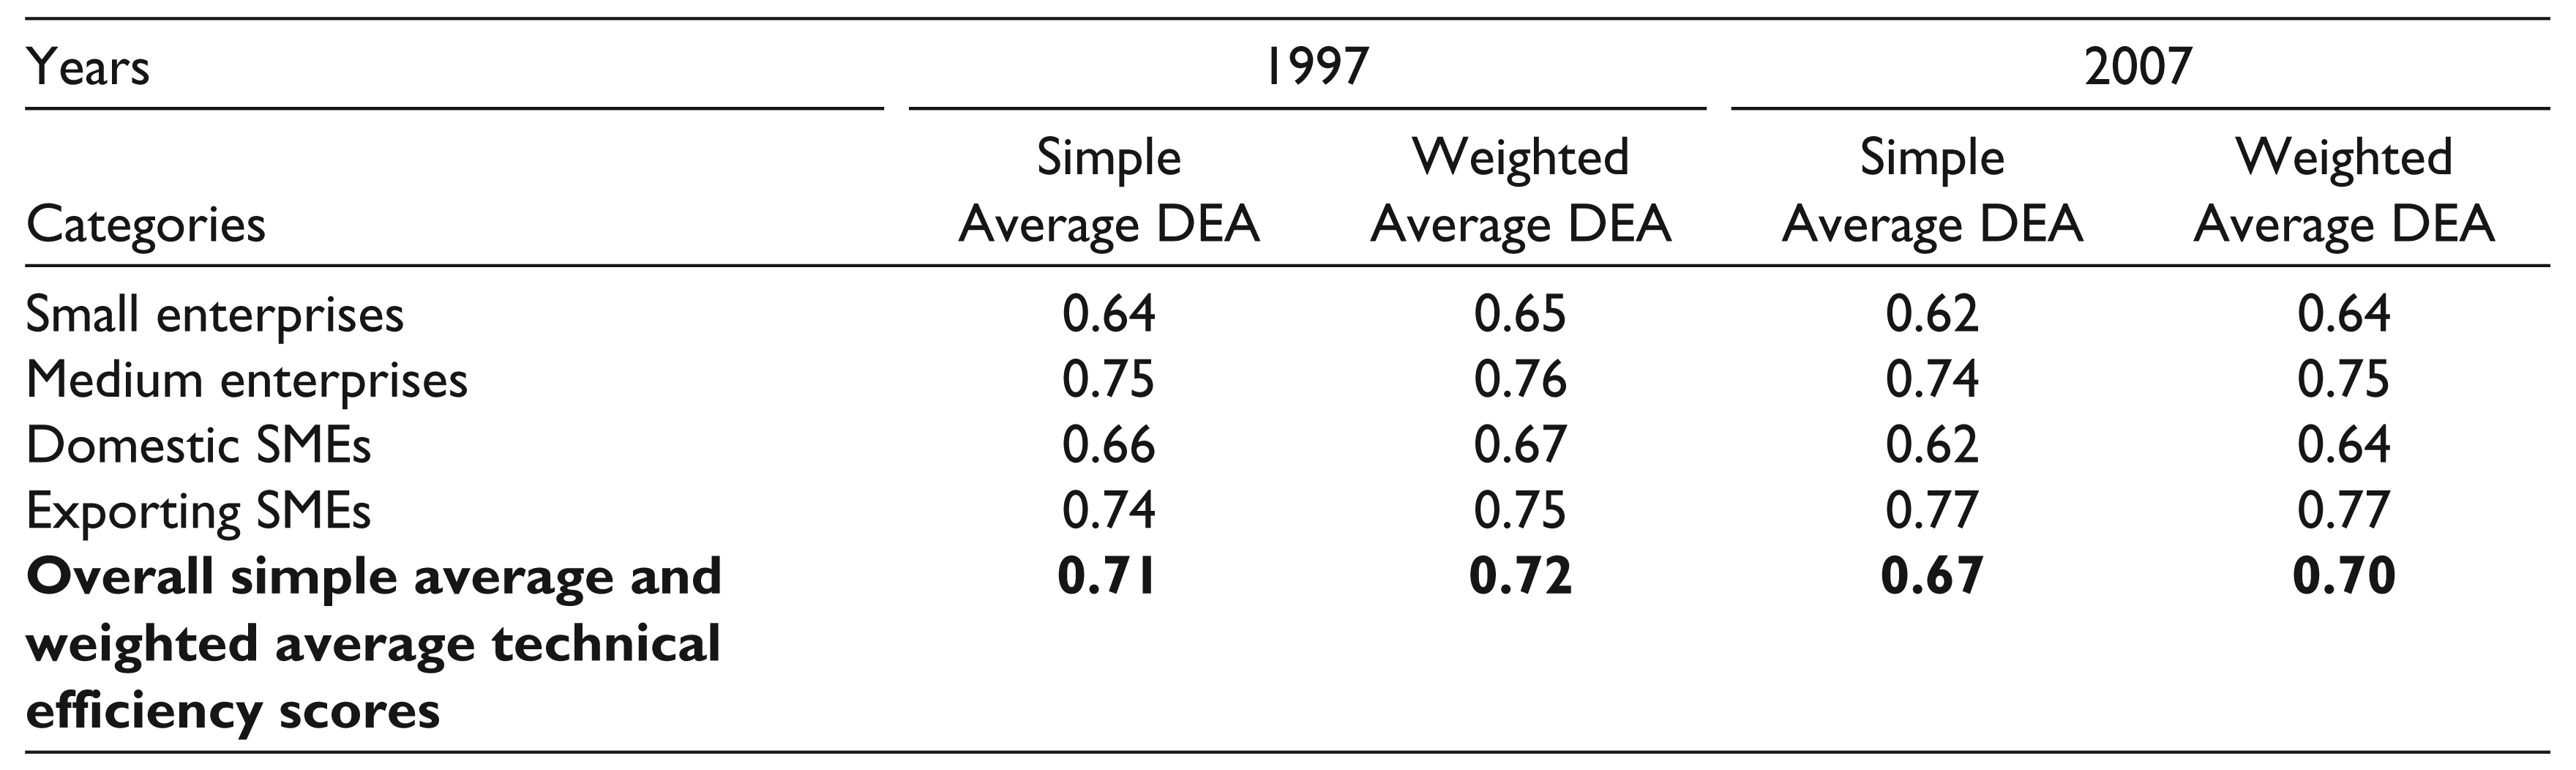
Table 4 presents and compares the simple 6 average and the weighted 7 average technical efficiency scores of Thai manufacturing SMEs for the periods 1997 and 2007. From Table 4 it can be observed that the weighted average technical efficiency in three SME categories, including small-sized SMEs, medium-sized SMEs and domestic SMEs decreased in 2007 compared to 1997, with the only exception being exporting SMEs. Hence, only exporting SMEs have achieved an improvement in technical efficiency. The overall weighted average technical efficiency ranges from 72 per cent in 1997 to 70 per cent in 2007, indicating a deterioration of technical efficiency of Thai manufacturing SMEs. Thus Thai manufacturing SMEs experienced a high level of technical inefficiency in both 1997 and 2007, and by 2007 they experienced no improvement in technical efficiency in comparison with 1997 with the exception of exporting SMEs.
The Simple Average and Weighted Average Technical Efficiency Levels of Thai Manufacturing SMEs (Utilizing DEA)
Results from the Second-step of the Two-stage DEA Approach (Utilizing a Two-limit Tobit Model)
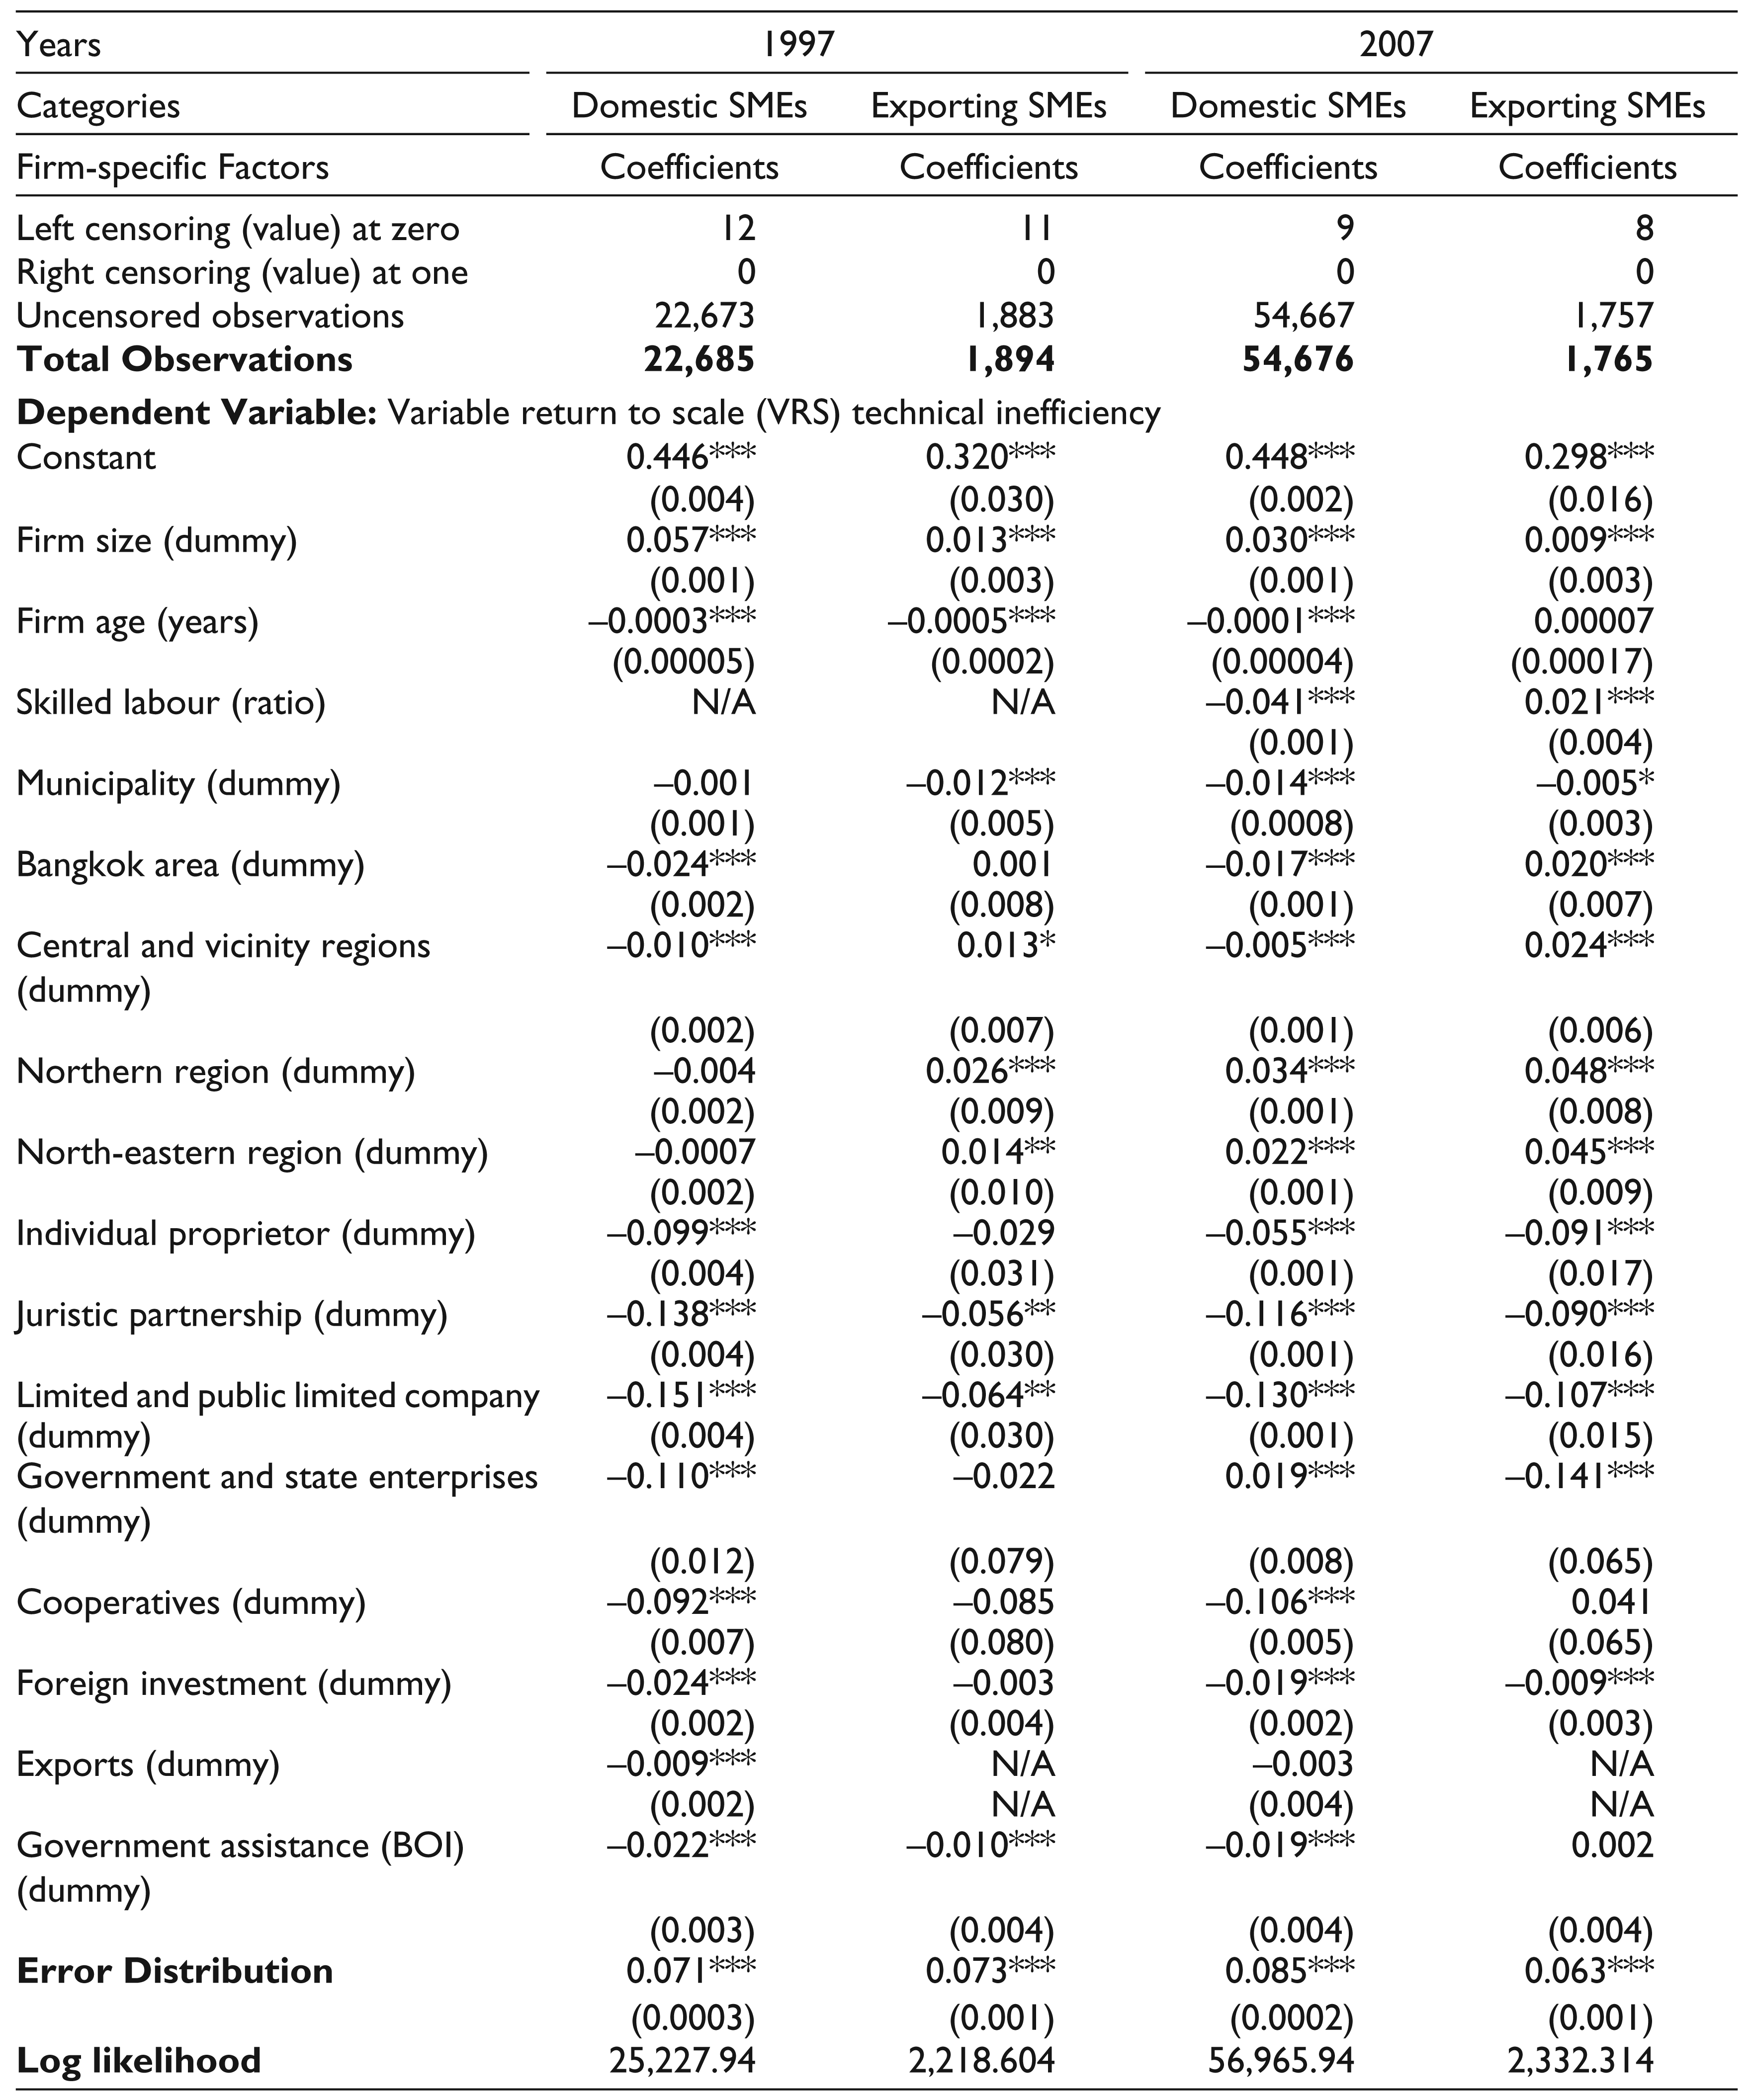
The estimated results of the two-stage DEA approach (a two-limit Tobit model), in terms of the signs of the coefficients and their significance, for equation (2), are presented in Tables 5 and 6, respectively. All negative coefficient signs of a Tobit model represent the relationship relative to technical inefficiency. Thus, negative signs must be converted to positive for technical efficiency.
Maximum Likelihood Estimates of the Parameters for the Two-stage DEA Approach (a Tobit Model) by Aggregate Manufacturing SMEs and Size of Manufacturing SMEs (Small and Medium)

Firm-specific Factors Affecting Technical Inefficiency
Firm Size
The estimated coefficients for firm size in 1997 and 2007 have positive signs for all manufacturing SME categories and they are highly significant at the 1 per cent level. From these results, it can be implied that medium-sized SMEs were more technically efficient than small-sized SMEs in both 1997 and 2007. This result is consistent with other empirical studies which show that the size of a firm has a significantly positive relationship with its technical efficiency (Admassie & Matambalya, 2002; Amornkitvikai & Harvie, 2010, 2011; Charoenrat & Harvie, 2011; Kim, 2003; Lundvall & Battese, 2000; Park, Shin & Kim, 2009; Tran, Grafton & Kompas, 2008; Yang, 2006).
Firm Age
Firm age is another firm-specific factor contributing to technical efficiency. Empirical studies have shown that firm age has a positive effect on technical efficiency (Amornkitvikai & Harvie, 2010; Batra & Tan, 2003; Charoenrat & Harvie, 2011; Park et al., 2009; Phan, 2004; Tran et al., 2008). In 1997, the estimates of the coefficients for firm age have negative signs for all SME categories. The coefficients of small- and medium-sized enterprises, domestic and exporting SMEs, are highly significant at the 1 per cent level. These results indicate that firm age has a positive impact upon technical efficiency in these SME categories. In 2007, estimated coefficients for firm age are negative for small- and medium-sized enterprises, and domestic SMEs. The coefficients of small- and medium-sized enterprises, domestic SMEs are highly significant at the 1 per cent level. From this, it can be specified that firm age has a positive impact on technical efficiency. However, the estimated coefficient for exporting SMEs in 2007 is positive, but it is not statistically significant.
Skilled Labour:
In 2007, the estimates of the coefficients for skilled labour, represented by the ratio of skilled labour to total workers, are negative for small enterprises and domestic SMEs. The coefficients for small enterprises and domestic SMEs are highly significant at the 1 per cent level. This specifies that skilled labour has a positive association with a firm’s technical efficiency. Skilled labour is one of the important firm-specific factors contributing to a firm’s technical efficiency (Admassie & Matambalya, 2002; Amornkitvikai & Harvie, 2010; Charoenrat & Harvie, 2011; Zahid & Mokhtar, 2007). However, the estimated coefficients for skilled labour present an unexpected positive sign for medium-sized SMEs and exporting SMEs. The coefficient for medium-sized SMEs is statistically significant at the 10 per cent level, while the coefficient for exporting SMEs is statistically significant at the 1 per cent level. This result indicates that skilled labour has a potentially negative impact on the technical efficiency of medium-sized SMEs and exporting SMEs in 2007. While this is not what would be expected it could reflect the fact that such enterprises are working with out of date or labour intensive technology, where additional skilled labour simply exacerbates existing production and technology inefficiencies.
Municipality:
Empirical studies reveal that location in a municipal area has a positive relationship with technical efficiency (Charoenrat & Harvie, 2011; Krasachat, 2000; Le & Harvie, 2010; Li & Hu, 2002; Park et al., 2009; Yang, 2006). In 1997, results for the dummy variable for municipality contain negative signs for small enterprises, domestic and exporting SMEs, and they are strongly significant at the 1 per cent level, while that for domestic SMEs is not statistically significant. Hence, it can be stated that municipality has a positive impact on technical efficiency in these SME categories. However, the estimated coefficient for medium enterprises in 1997 exhibits a positive sign. The coefficient of medium enterprises is statistically significant at the 5 per cent level. This indicates that municipality is negatively related to the technical efficiency of medium enterprises.
In 2007, results concerning the dummy variable for municipality present a negative sign in all manufacturing SME categories, except medium enterprises. The coefficients for small enterprises and domestic SMEs are strongly significant at the 1 per cent level, while the coefficient for exporting SMEs is statistically significant at the 10 per cent level. From these results, it is implied that municipality has a positive relationship with technical efficiency. However, the estimated coefficients for medium-sized SMEs in 2007 show a positive sign, but it is insignificant.
Bangkok Area
The Bangkok area is recognized as the major economic centre of the country (Office of Small and Medium Enterprises Promotion, 2001–2009). In 1997, the estimated coefficients for Bangkok are negative for almost all SME categories, except for exporting SMEs. The coefficients for small- and medium-sized enterprises, and domestic SMEs are highly significant at the 1 per cent level. From these results, it can be concluded that the Bangkok area has a positive correlation with technical efficiency. However, the coefficient for exporting SMEs is positive, but it is not statistically significant. In 2007, estimates of the coefficients for Bangkok have negative signs in almost all manufacturing SME categories, with the exceptions of medium-sized SMEs and exporting SMEs. The coefficients for aggregate manufacturing, small-sized SMEs and domestic SMEs are strongly significant at the 1 per cent level. This indicates that the Bangkok area has a positive impact on the technical efficiency in these SME categories. However, there is a positive coefficient for medium-sized SMEs and exporting SMEs in 2007, but only exporting SMEs is statistically significant at the 1 per cent level. This implies that the Bangkok area has a negative impact upon the technical efficiency of exporting SMEs.
Central and Vicinity Regions
The central and vicinity regions contain many of Thailand’s large businesses (OSMEP, 2008). In 1997, the results for the estimated coefficients for this dummy variable show mixed results, with negative signs for small enterprises and domestic SMEs, and positive signs for medium enterprises and exporting SMEs. The negative coefficients for small enterprises and domestic SMEs specify that the central and vicinity regions are positively related with technical efficiency. However, the positive coefficient for exporting SMEs indicates that the central and vicinity regions have a negative relationship with technical efficiency. In 2007, estimates of the coefficients for central and vicinity regions are found to be negative for small-sized SMEs and domestic SMEs. The coefficients for small-sized SMEs and domestic SMEs, are strongly significant at the 1 per cent level. This indicates that the central and vicinity regions have a positive association with technical efficiency. However, there are positive coefficients for medium-sized SMEs and exporting SMEs. The coefficient for exporting SMEs is statistically significant at the 1 per cent level and medium-sized SMEs at the 5 per cent level. These results indicate that location in the central and vicinity regions has a negative impact on the technical efficiency of medium-sized and exporting SMEs.
Northern Region
In 1997, estimates of the coefficients for the northern region indicate a negative sign for small enterprises and domestic SMEs. The coefficient for small enterprises is statistically significant at the 5 per cent level, while the coefficient for domestic SMEs is not statistically significant. This specifies that location in the northern region has a positive relationship with the technical efficiency of SMEs in these categories. However, there are positive signs for the northern region for medium-sized enterprises and exporting SMEs in 1997, and they are strongly significant at the 1 per cent level. From this result, it can be specified that location in the northern region has a negative impact upon the technical efficiency of medium enterprises and exporting SMEs. In 2007, the estimated coefficients for the northern region have positive signs in all SME categories, and they are strongly significant at the 1 per cent level. The positive coefficients imply that location in the northern region is negatively related to technical efficiency across all manufacturing SME categories in 2007.
North-eastern Region
The north-eastern region had the second highest number of SMEs in Thailand, having 514,498 SMEs equivalent to 27.41 per cent of all SMEs on average during 1994–2008. This region contains 18 of the 77 provinces of Thailand and has the highest population in the country (the Office of Small and Medium Enterprises Promotion, 2001–2008). In 1997, estimates of the coefficients for the north-eastern area have positive signs for medium-sized enterprises and exporting SMEs. The coefficient for medium-sized enterprises is highly significant at the 1 per cent level, and the coefficient for exporting SMEs is statistically significant at the 5 per cent level. The positive signs specify that location in the north-eastern area has a negative correlation with technical efficiency.
However, there are negative signs for the north-eastern region for small enterprises and domestic SMEs in 1997, but they are not statistically significant. In 2007, the estimated coefficients for the north-eastern region exhibit a positive sign for all manufacturing SME categories, and they are strongly significant at the 1 per cent level, while that for medium-sized SMEs is insignificant. From these results, it is indicated that location in the north-eastern region is negatively related to technical efficiency. Thus, it can be concluded that location in the north-eastern region is generally negatively related with SME technical efficiency, implying major locational problems for manufacturing SMEs in this region in both 1997 and 2007.
Individual Proprietor Ownership
Many studies highlight the advantages of being an individual proprietorship (Buranajarukorn, 2006; Cooper & Dunkelberg, 2006; Fernández & Nieto, 2006; Ha, 2006; Ward & Dolan, 1998): (i) the proprietor is in complete control within the parameters of the law and decision-making power over a business; (ii) it is an easy and inexpensive form of starting a business. For individual proprietor ownership in 1997 and 2007, coefficient estimates have negative signs for all manufacturing SME categories, and they are highly significant at the 1 per cent level. From these results, it can be suggested that individual proprietor ownership in 1997 and 2007 is highly positively related to technical efficiency in all SME categories.
Juristic Partnership Ownership
As compared to an individual proprietorship a juristic partnership has the benefits of allowing the owner to draw on resources and expertise of co-partners. It can be easily formed by an oral agreement between two or more people. Within a juristic partnership, partners share risk and management and solve barriers to doing business (Cooper & Dunkelberg, 2006; Fernández & Nieto, 2006; Ha, 2006). The estimated coefficients for juristic partnership ownership in the period 1997 and 2007 have negative signs for all SME categories, and they are highly significant at the 1 per cent level, with the coefficient for exporting SMEs in 1997 being significant at the 5 per cent level. These results signify that juristic partnership ownership has a positive relationship with technical efficiency in all SME categories in both 1997 and 2007.
Limited and Public Limited Companies
A number of studies emphasize the advantages of limited and public limited companies (Cooper & Dunkelberg, 2006; Fernández & Nieto, 2006; Ha, 2006): (i) it has a legal existence which separates management from shareholders; (ii) it can continue despite the resignation or bankruptcy of management and its members; (iii) members can draw up their own contract that allows flexibility in responsibility and management. Estimates of the coefficients for limited and public limited company ownership in 1997 and 2007 have negative signs for all SME categories. The negative coefficients of these categories are strongly significant at the 1 per cent level with that for exporting SMEs in 1997 statistically significant at the 5 per cent level. This can be interpreted to mean that limited and public limited company ownership in both 1997 and 2007 are highly positively related to technical efficiency in all SME categories.
Government and State Ownership
In 1997, the estimated coefficients for government and state ownership have negative signs in nine categories, including small- and medium-sized enterprises, domestic and exporting SMEs. They are strongly significant at the 1 per cent level except for exporting SMEs which is not statistically significant. This indicates that government and state ownership has a positive effect on technical efficiency. In 2007, estimated coefficients for government and state enterprises are negative in small-sized enterprises and exporting SMEs. The coefficient for exporting SMEs is statistically significant at the 1 per cent level. From these results, government and state ownership has a positive correlation with technical efficiency. However, there are positive coefficients for medium enterprises and domestic SMEs, and they are highly significant at the 1 per cent level. This suggests that there is a negative relationship between government and state ownership and technical efficiency in these categories.
Maximum Likelihood Estimates of the Parameters for the Two-stage DEA Approach (a Tobit Model) by Domestic and Exporting SMEs
Cooperative Ownership
A number of studies state the benefits of cooperative ownership as follows (Cooper & Dunkelberg, 2006; Ha, 2006; Thuvachote, 2007): (i) it serves the interest of members rather than the capital invested; (ii) shareholders have an equal vote at general meetings regardless of their shareholding or involvement in the cooperative; and (iii) it can be considered as one of the most stable forms of business. The results for the estimated coefficients indicate negative signs in 1997 for small- and medium-sized enterprises, domestic and exporting SMEs. The coefficients for these categories are strongly significant at the 1 per cent level, while the coefficient for exporting SMEs is not statistically significant. This indicates that cooperative ownership has a positive correlation with technical efficiency in these SME categories. In 2007, estimates of the coefficients for cooperative ownership are found to be negative for small- and medium-sized enterprises and domestic SMEs. The coefficients for these categories are strongly statistically significant at the 1 per cent level while the coefficients for exporting enterprises are insignificant. This indicates that cooperatives have a positive association with technical efficiency in most of these SME categories. However, the coefficient for exporting shows a positive sign, but they are not statistically significant.
Foreign Investment
Many studies have found that foreign investment (via foreign ownership) has a positive correlation with technical efficiency (Bottasso & Sembenelli, 2004; Fukuyama, Guerra & Weber, 1999; Goldar, Renganathan & Banga, 2003). In 1997, results concerning the dummy variable for foreign investment are negative in all SME categories. When the level of significance of the negative coefficient is taken into consideration, the coefficients for small- and medium-sized enterprises and domestic SMEs, are highly significant at the 1 per cent level, while the coefficient for exporting SMEs is not statistically significant. These results suggest that foreign investment is generally positively related to technical efficiency. A firm that has cooperation with a foreign partner can benefit from superior technology, managerial knowledge and good corporate governance (Kimura & Kiyota, 2007). In 2007, coefficient estimates for foreign investment present a negative sign in all SME categories. The coefficients for SMEs, domestic and exporting SMEs are highly significant at the 1 per cent level. This specifies that there is a statistically positive association between foreign investment and SME technical efficiency.
Exports
In 1997, the coefficients for exports are negative for small-sized SMEs and domestic SMEs. These negative coefficients are significant at the 1 per cent level. These results signify that there is a positive relationship between exports and technical efficiency for these classifications of SMEs in 1997. Positive signs imply that exports are potentially negatively related to technical efficiency. Many empirical studies have found that exporting has a positive association with technical efficiency (Amornkitvikai & Harvie, 2010; Bigsten et al., 2002; Granér & Isaksson, 2009; Kim, 2003; Rankin, 2001). However, there is an unexpected positive sign for medium-sized SMEs, but it is not statistically significant. In 2007, the estimated coefficients for exports are negative in almost all SME categories but only statistically significant for small-sized SMEs. This specifies that exports only had a positive and statistically significant relationship with technical efficiency in the small-sized SME category. There is a positive sign for medium-sized SMEs in both 1997 and 2007 but these are not statistically significant.
Government Assistance
In 1997, the results for the estimated coefficients for government assistance indicate a negative sign for all manufacturing SME categories. The negative coefficients for small- and medium-sized enterprises, domestic and exporting SMEs are highly significant at the 1 per cent level. This result implies that government assistance (via the Broad of Investment [BOI]) was positively related to technical efficiency in these SME categories in 1997. A number of empirical studies have found that government assistance has a positive and significant impact upon a firm’s technical efficiency (Le & Harvie, 2010; Tran et al., 2008; Vu, 2003). In 2007, estimates of the coefficients for government assistance have negative signs for both small and medium sized SMEs and domestic SMEs. The coefficients for SMEs and domestic SMEs are highly significant at the 1 per cent level. This indicates that government assistance has a positive association with technical efficiency. However, there is a positive sign in exporting SMEs, but it is not statistically significant.
Conclusion and Implications
Thai SMEs have played a crucial role in the Thai economy in terms of business numbers, employment and economic growth over the period 1994–2009 (OSMEP, 2007, 2008, 2009). They contribute significantly to the social and economic development of the country (Brimble, Oldfield & Monsakul, 2002; OSMEP, 2009; Regnier, 2000; Sahakijpicharn, 2007; Wiboonchutikula, 2002).
This study used the two-stage DEA (a Tobit model) to predict and compare the technical efficiency of Thai manufacturing SMEs, using cross-sectional industrial census data covering the periods 1997 and 2007, classified into two aspects: by size of manufacturing SMEs (small and medium) and by export intensity. These categories of manufacturing SMEs were estimated individually to estimate technical efficiency and examine whether technical efficiency is positively or negatively related to firm-specific factors, including firm size, firm age, skilled labour, location (municipal and non-municipal areas), regional area, type of ownership, foreign investment, exports and government assistance.
The empirical evidence from the first-stage DEA emphasizes that the average technical efficiency of all categories of Thai manufacturing SMEs in both 1997 and 2007 are relatively low. It was also indicated that Thai manufacturing SMEs experienced no technical efficiency improvement in the period 2007. Thus, the Thai government should formulate policies to promote and support SMEs, such as managerial and technical assistance, training programmes and provide financial assistance to avoid management risks and financial problems, promote efficiency in logistics management and in marketing facilities (Amornkitvikai & Harvie, 2010; Harvie & Lee, 2005; OSMEP, 2007).
Firm-specific factors found to have a positive and significant relationship with the technical efficiency of Thai manufacturing SMEs in the periods 1997 and 2007 are: firm size, firm age, skilled labour, location in a municipal and Bangkok areas, type of manufacturing ownership (individual proprietor, juristic partnership, public and limited company), cooperative, foreign investment and exports. Therefore, specific policy implications will need to focus upon: (i) increasing the size of firms through better access to adequate inputs, such as financial services and facilities conducive to enhancing the performance of manufacturing SMEs; (ii) create an enabling environment for fostering manufacturing SME growth; (iii) providing an appropriate distribution of equity in terms of the political operation and extensive infrastructural development; (iv) building networks of SMEs within and across the regions of the nation as well as internationally; (v) improving entrepreneurial enthusiasm and capacity; (vi) encouraging good networking with foreign investment; and (vii) creating higher value added in manufacturing SMEs to meet market demands.
Footnotes
Acknowledgements
The authors are grateful to the anonymous referees of the journal for their extremely useful suggestions to improve the quality of the article. The usual disclaimers apply.