



Abstract
The objective of this article is to examine the direct path from lean manufacturing (LM) to production line productivity using second-order analysis in a structural equation model (SEM). Data were collected from 236 large manufacturers using a cross-sectional survey. The findings confirmed the positive direct effect of LM practices on production line productivity. The outcome of importance-performance map analysis (IPMA) revealed that the productivity can be leveraged when manufacturing firms are able to produce more than one product model per day with the support of a kanban system to authorize production and material movements. LM supported by a small number of high-performance suppliers leads to improved production line productivity. This study contributes to closing existing gaps of studies investigating the effect of LM on productivity. Practitioners will benefit by understanding the vital constructs of LM practices to improve the overall productivity of a production line.
Introduction
Lean manufacturing (LM) is widely used to eliminate activities and procedures which do not add value to a final product. Manufacturing firms should ensure that any substance discarded after primary use (e.g., waiting time, cycle time and inventory) is eliminated from manufacturing processes in the production flow (Helleno, de Moraes & Simon, 2017). There are seven cardinal wastes which result in non-value-added activities that should be eliminated through the implementation of LM: over-production, over-processing, defects, inventory, waiting (delay), unnecessary motion and transportation (Ohno, 1988). Waste is not only found in manufacturing processes. Scholars have also described non-value-added activities in terms of unused creativity and underutilized human capital (intelligence and intellect). It was named as behavioural waste (Womack & Jones, 2003). The non-value-added activities become more complicated when it involves across companies along its supply chain networks (Shah & Ward, 2007). The outcomes of the LM benefit organizations in terms of outstanding performance (Belekoukias, Garza-Reyes & Kumar, 2014; Nawanir, Lim & Othman, 2016; Panwar, Nepal, Jain, Rathore & Lyons, 2017).
Das, Venkatadri and Pandey (2014) have found evidence that LM was successfully employed to improve coil manufacturing productivity in a single case study. The LM concept may have been expanded to other manufacturing and production areas and plants. A lack of multiple case studies has limited the generalization of findings to represent other manufacturing sectors, because each company has different resources. In regard to the size of the firms, multinational companies typically have a higher degree of LM implementation than national firms (Cezar Lucato, Araujo Calarge, Loureiro Junior & Damasceno Calado, 2014).
It is clear that one of the major deficiencies in the manufacturing sector is a lack of technical efficiency (Charoenrat & Harvie, 2017; Margono, Sharma, Sylwester & Al-Qalawi, 2011; Nawanir, Lim & Othman, 2013). Efficiency is one of the central objectives of a manufacturing system (Gupta, Acharya & Patwardhan, 2013). According to van Dijk and Szirmai (2006), technical inefficiency is related to the inability of a plant to achieve maximum possible outputs from any combinations of resources. Therefore, it is related to poor productivity. LM has a role to play here, as it aims at eliminating non-value-added activities while maximizing utilization of value-added activities (Abdel-Razek, Elshakour & Abdel-Hamid, 2007; Gupta et al., 2013). Hence, it potentially has an impact on the ways in which firms combine resources to enhance technical efficiency. Subsequently, it could improve productivity (Chavez, Gimenez, Fynes, Wiengarten & Yu, 2013; Khanchanapong et al., 2014).
There remains a critical question regarding how LM improves productivity. A number of investigations have been conducted (Jasti & Kodali, 2016; Panwar et al., 2017). However, few investigations have provided evidence for LM implications in terms of on productivity. Therefore, in-depth investigations are still substantially required (Chavez et al., 2013; Panwar et al., 2017). The present study investigates the effect of LM practices (individually and collectively) on productivity.
The article has the following structure. First, this section introduces the motivation of study, followed by a review on the existing literature. Subsequently, methods and findings will be presented. In the next section, the results will be discussed. The article ends with implications, limitations and suggestions for future research.
Review of Literature
There is a consensus among scholars that the main objective of LM is to enhance organizational performance by the elimination all types of waste. Hence, LM primarily focuses on eliminating the consumption of resources that add no value to products or processes (Daultani, Chaudhuri & Kumar, 2015). For LM to perform well in eliminating waste, certain fundamental practices must be in place. The success of LM strongly depends on the implementation of the practices. There is no single agreement regarding the practices constituting under LM. Common practices from the previous studies were compiled and regrouped based on their similarity to nine related practices. The practices are flexible resources (Jasti & Kodali, 2016; Khanchanapong et al., 2014); cellular layouts (Godinho Filho, Ganga & Gunasekaran, 2016; Zahraee, 2016); pull system (Godinho Filho et al., 2016; Sharma, Dixit & Qadri, 2015); small lot production (Belekoukias et al., 2014; Jasti & Kodali, 2016); quick setups (Zahraee, 2016); uniform production level (Khanchanapong et al., 2014; Marodin & Saurin, 2013); quality control (Chen & Tan, 2011; Jasti & Kodali, 2014); TPM (Belekoukias et al., 2014; Sharma et al., 2015); and supplier networks (Godinho Filho et al., 2016; Jasti & Kodali, 2016). Even though this study does not cover some of the practices discussed in previous studies as separated components, many have been incorporated into related practices.
As the dependent variable of the study, productivity has been defined as the ratio between two variables: system outputs and inputs. The high ratio indicates high efficiency of the use of inputs (e.g., workers, costs, materials, technology, etc.) to produce outputs. Productivity is a measure of how effectively resources are used to produce various goods (Taj & Berro, 2006). Productivity is improved by producing more with the same or fewer resources. In this study, several factors related to the input minimization are considered as determiners of production line productivity, such as fewer interruptions from machine breakdowns, reduced inputs, and more efficient setup processes (Lieberman & Demeester, 1999) and production processes (Agus & Hajinoor, 2012), improvement in worker flexibility (Abdel-Razek et al., 2007; Rogers, 2008) and higher labour flexibility (Rogers, 2008).
Several studies concerning implications of LM on productivity have been conducted. Studies such as those of Bonavia and Marin-Garcia (2011) and Anand and Kodali (2009) found that productivity was significantly affected by LM practices. Furlan, Dal Pont and Vinelli (2011a) and So and Sun (2010) revealed that by implementing LM as a daily practice, overall productivity could be increased. According to Rogers (2008) and Dal Pont, Furlan and Vinelli (2008), once flexibility increases, the labour productivity and machine utilization are also expected to increase. In addition, Agus and Hajinoor (2012) stated that reducing lead time and storage space may increase productivity.
Objectives of the Study
The main objective of this article is to examine the direct path from LM to the production line productivity using second-order analysis in a structural equation model (SEM). Subsequently, this article attempts to investigate the most critical practices and activities of LM for the enhancement of production line productivity through the importance-performance map analysis (IPMA).
Methodology
This was a cross-sectional study, with organizations as the unit of analysis. The measurement was developed based on an extensive review of LM literature published from 1993 to 2014. The variables of the study were perceptually measured by using six-point Likert scale from 1 (strongly disagree) to 6 (strongly agree). In order to diminish the effect of temporary deviations in the variable, productivity was measured based upon accomplishments within the last 3 years. Data were collected by using a questionnaire with close-ended ordered choice questions. Large manufacturers were selected as population of the study because they implement LM more often than do small and medium companies (Fullerton & McWatters, 2001; Shah & Ward, 2003, 2007; Susilawati, Tan, Bell & Sarwar, 2011). Based on 3091 large companies (i.e., having more than 100 employees) listed in the BPS-Statistics Indonesia (2010), using the stratified random sampling procedure, 1000 companies were mailed a questionnaire. The targeted group of respondents was divided into strata, and the respondents were randomly selected from each stratum from the population (Fernando & Wah, 2017).
A total of 262 responses were returned. However, because this study focused on the discrete process industries, only 236 responses were considered usable after data screening. It leads to an effective response rate of 23.60 per cent. The companies represent a wide variety of industries, including electrical machinery and equipment (8.90%); machinery and equipment (11.86%); instrumentation (9.32%); motor vehicles, trailers, semi-trailers and other transport equipment (12.71%); electronics (6.36%); tanning and dressing of leather (5.08%); textiles (28.81%); and wood, products of wood (including furniture) and plaiting materials (16.95%). Based on the usable responses, 158 (66.85%) respondents were production managers, 44 (18.64%) were heads of production departments and 21 (8.90%) were production directors. A total of 13 (5.51%) respondents were appointed in other middle management positions under the production department.
Convergent Validity
Discriminant Validity: Heterotrait-Monotrait Ratio
Summary of Hypotheses Testing of Initial PLS Path Model
Analysis
Construct Validity
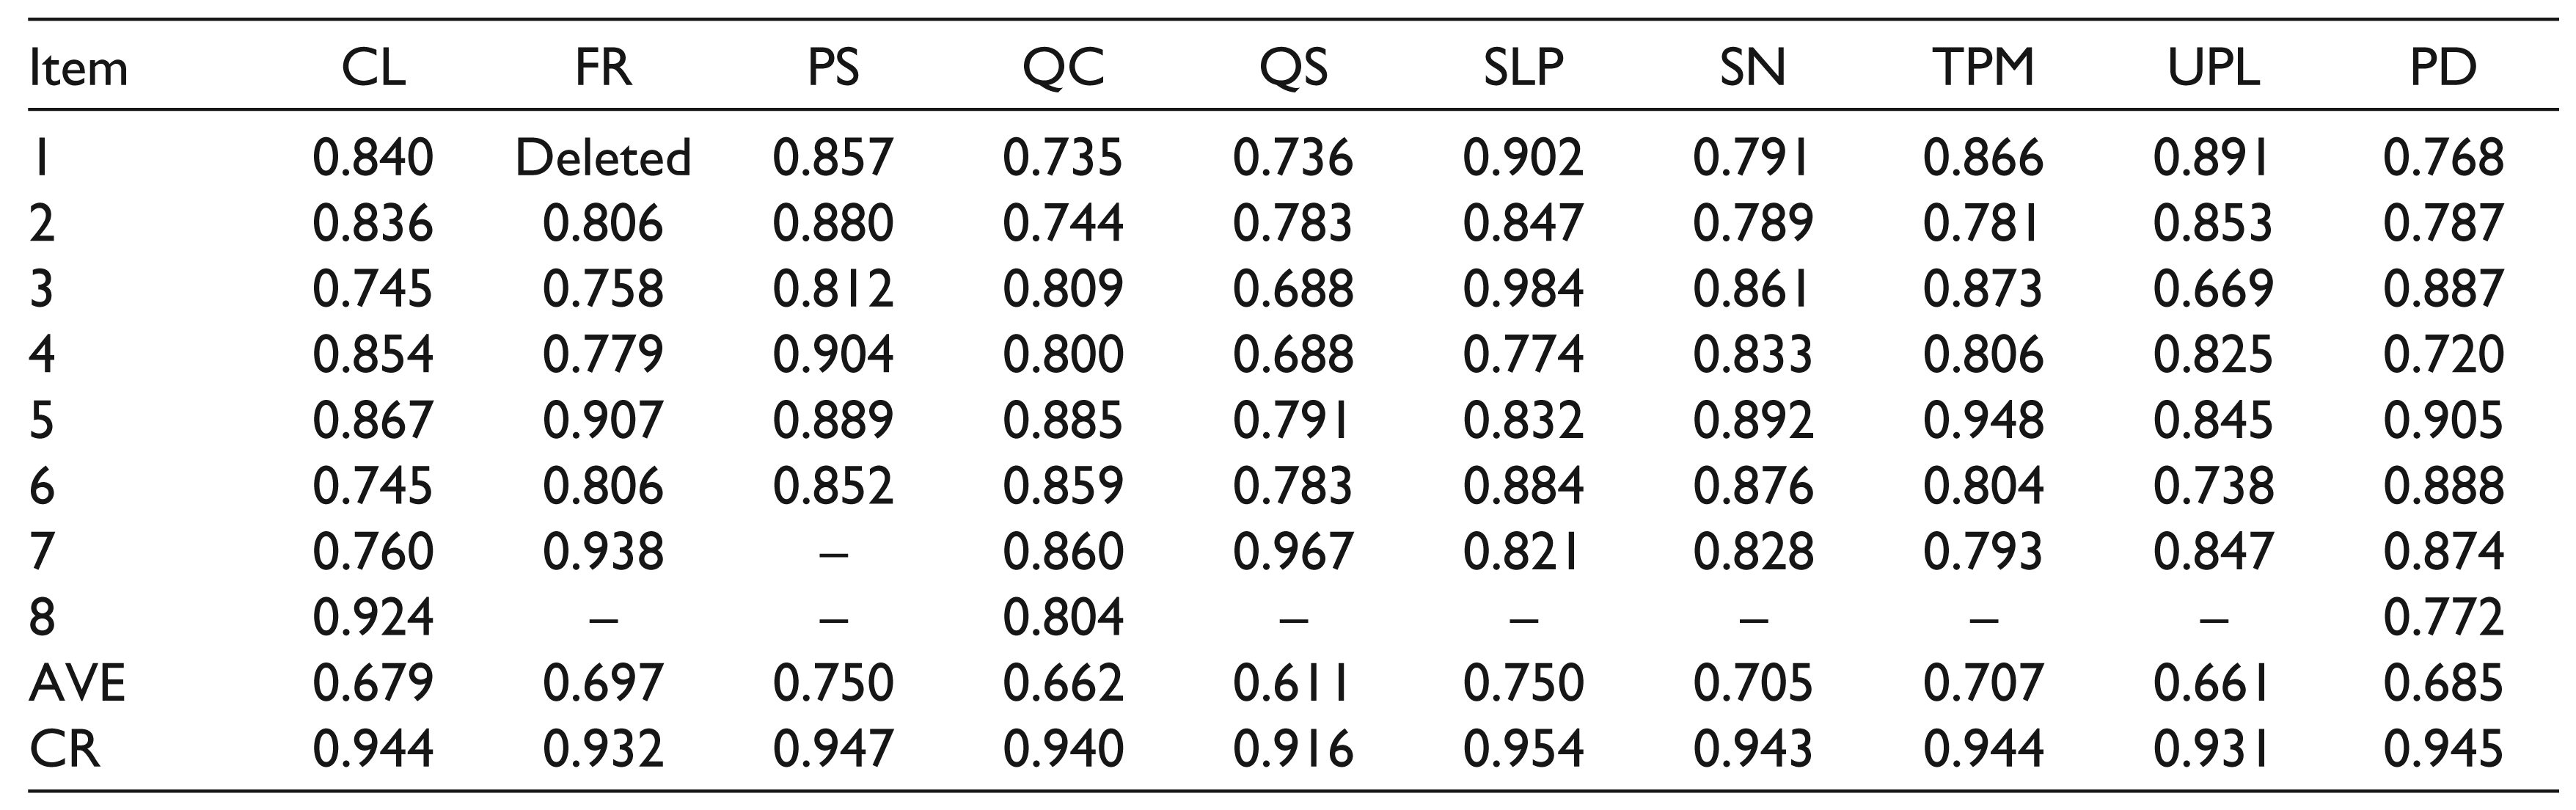
To test the construct validity, this study was guided by Hair, Hult, Ringle and Sarstedt (2017) method. The present study is confirmatory in nature and intended to confirm and test the relationship between LM practices and productivity; thus, the consistent Partial Least Square (PLSc) approach was applied. Construct validity ensures that a set of measurable variables actually represents the construct that is intended to measure (Hair et al., 2017). Convergent validity, composite reliability (CR) and discriminant validity have been frequently reported as indicators of construct validity. The assessment results of convergent validity and CR are given in Table 1. From this analysis, FR1 was deleted due to low outer loading. The table indicates that all the outer loadings are greater than 0.6, while the values of average variance extracted (AVEs) are greater than 0.5, and CR values are more than 0.7. Therefore, convergent validity and CR of constructs are considered satisfactory.
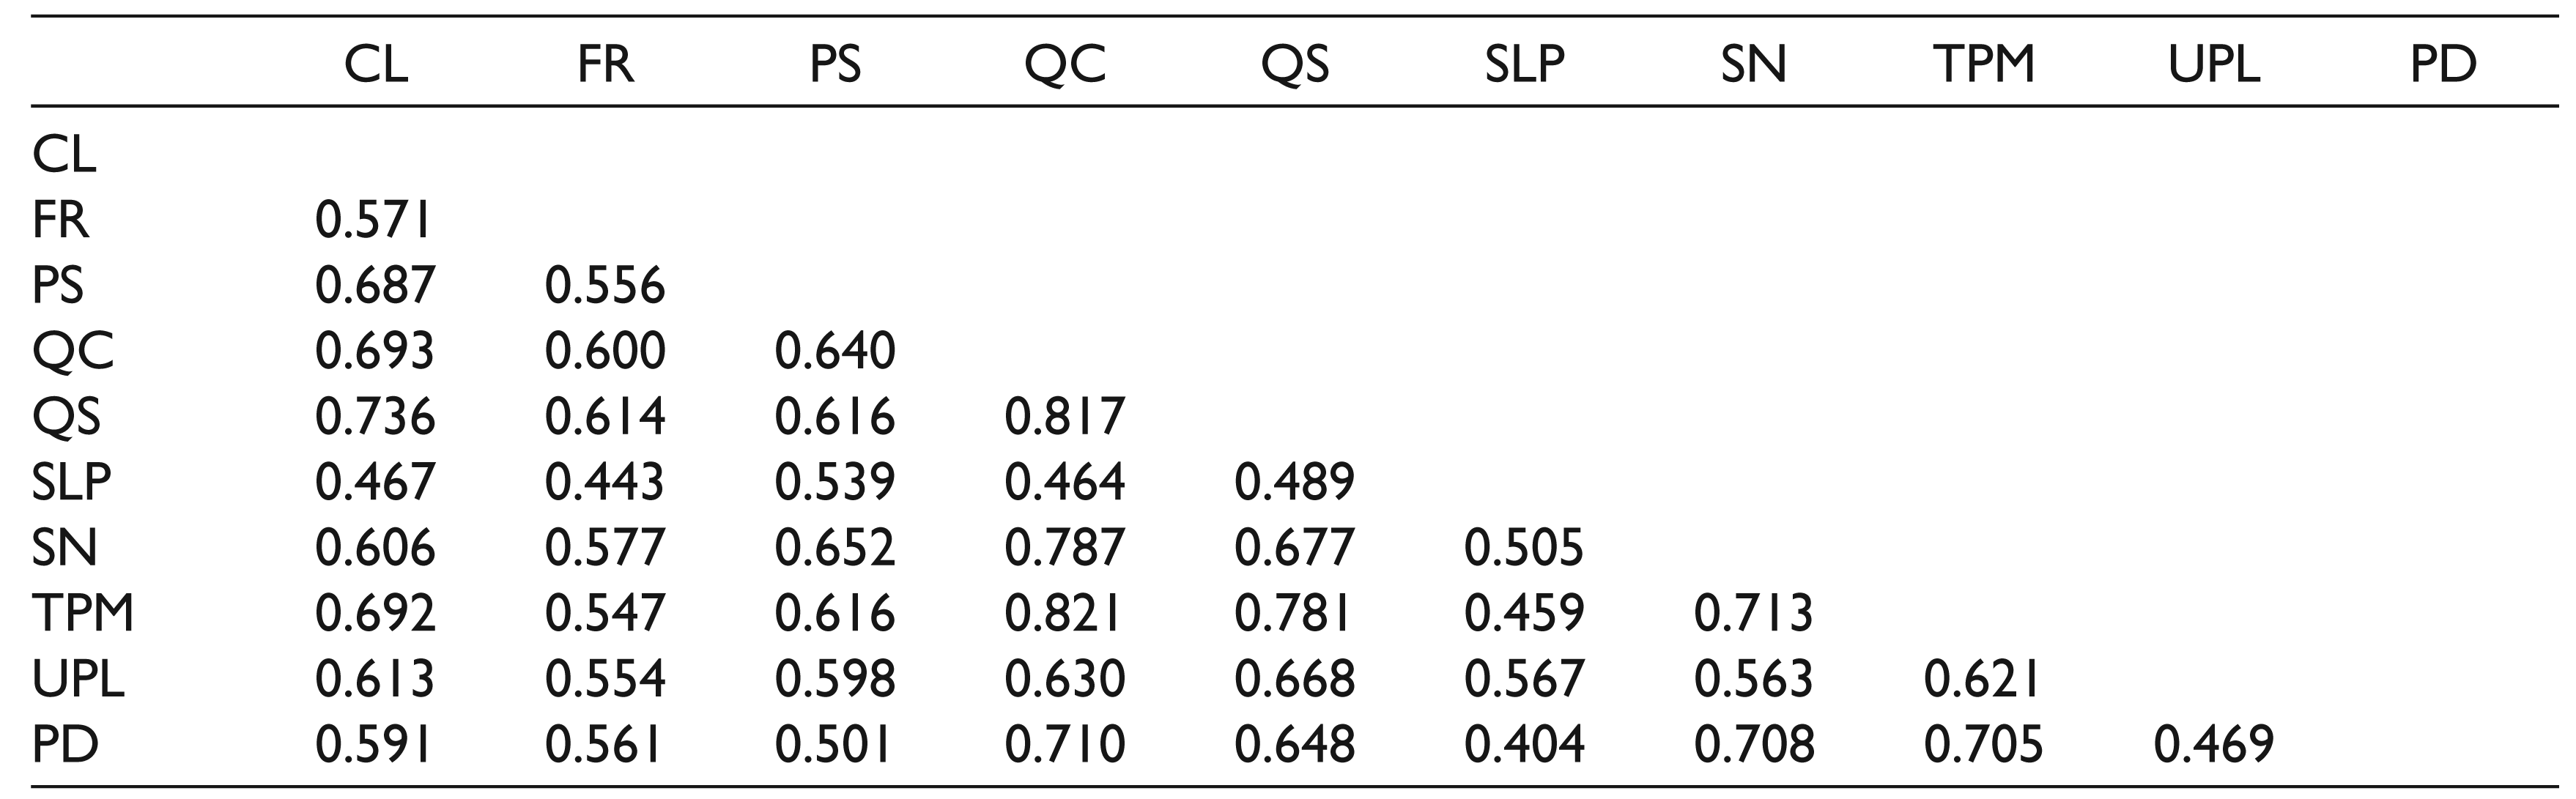
In addition to convergent validity and CR, discriminant validity was also assessed to ensure that a construct is truly distinct from other constructs (Hair et al., 2017). A common approach was the criterion of Fornell and Larcker (1981) in which the square root of AVE should be greater than its highest correlation with any other constructs. Assessments using the Fornell and Larcker criterion indicate adequate discriminant validity. However, according to Hair et al. (2016), this criterion performs very poorly, especially when indicator loadings of the constructs differ only slightly. As a remedy, a more reliable criterion, the heterotrait-monotrait (HTMT) ratio suggested by Henseler, Ringle and Sarstedt (2015), should be applied. As per Hair et al. (2017), HTMT is an average heterotrait-heteromethod correlations (i.e., the mean of all correlations of indicators across constructs measuring different constructs) relative to the average monotrait-heteromethod correlation (i.e., mean of all correlations of indicators measuring the same constructs). The result of HTMT statistics is shown in Table 2. The table indicates that the highest HTMT statistics is 0.821, which is lower than the threshold value of 0.850. Additionally, based on the consistent PLS bootstrapping, the HTMT confidence interval does not contain zero. Thus, discriminant validity is satisfactory. In conclusion, the measurement model has adequate construct validity.
Hypothesis Testing
Generally, this study hypothesized that each practice of LM positively affects productivity. In other words, a higher degree of implementation of each LM practice leads to higher productivity. Based on the correlation analysis, there are positive associations between each practice of LM and productivity, with r-values ranging from 0.386 to 0.673. In addition, the table also indicates the positive correlations among the LM practices, with r-values range from 0.420 to 0.775. With regard to the correlations among the independent variables, four correlation coefficients are greater than 0.70. High correlation among the independent variables is the first indication of substantial multicollinearity in multiple regression analysis (Hair, Black, Babin & Anderson, 2014; Nawanir et al., 2013).
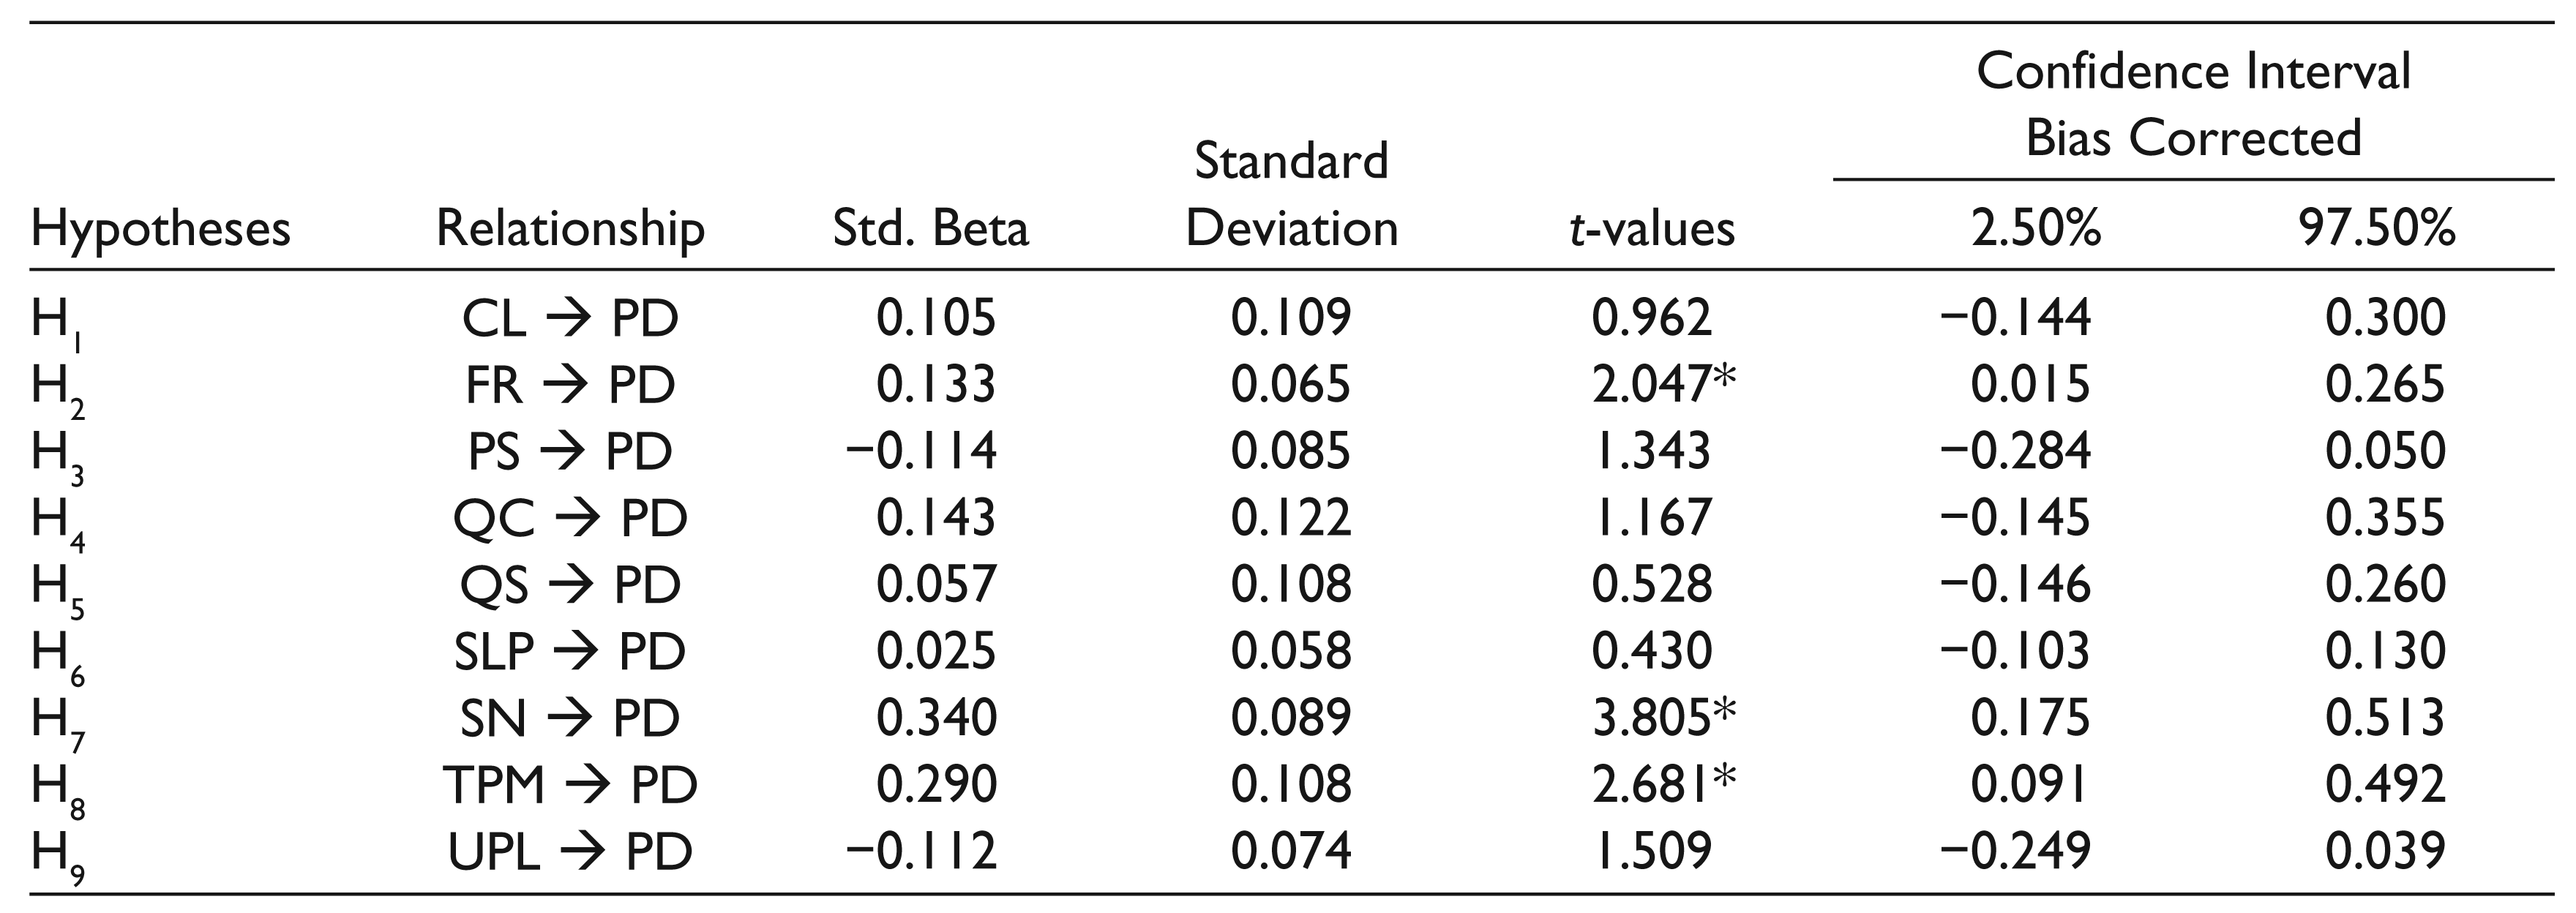
Through a multiple regression analysis using the consistent PLS bootstrapping in the SmartPLS 3, the hypotheses were tested. As shown in Table 3, only three relationships have significant t-values at p < 0.05 (t > 1.645) with non-zero confidence intervals. This implies that only three practices of LM (i.e., flexible resources, supplier network and TPM) contributed significantly to productivity. Based on the table, standardized betas of two relationships (i.e., between pull system and productivity, and between uniform production level and productivity), which are significant at p < 0.10 (t > 1.28), take on the negative sign; whereas common sense, theory and correlation coefficient suggest positive relationships. This contradicted sign may also indicate a multicollinearity issue in multiple regression analysis (Hair et al., 2014; Nawanir et al., 2013).
To ensure the presence of multicollinearity, tolerance and variance inflation factor (VIF) were assessed. According to Nawanir et al. (2013) and Hair et al. (2014), tolerance values of less than 0.40 and VIF of greater than 2.50 are adequate to indicate a serious multicollinearity. Based on the assessment, five variables, namely, cellular layout (tolerance = 0.353, VIF = 2.833), quality control (tolerance = 0.194, VIF = 5.150), quick setup (tolerance = 0.241, VIF = 4.141), supplier network (tolerance = 0.322, VIF = 3.105) and TPM (tolerance = 0.267, VIF = 3.740), indicated that there is fairly high multicollinearity in the multiple regression model because more than 75 per cent of the variables’ variances are explained by other independent variables. According to Hair et al. (2014), multicollinearity creates shared variance between the independent variables. This may decrease the ability to predict a dependent variable and determine the contributions of each independent variable.
One of the remedial methods to address the multicollinearity issue is constructing higher-order constructs or hierarchical component models (Hair et al., 2017). In order to develop a higher-order construct, the model should be supported by theory and literature. In the area of LM, several studies such as those by Callen, Morel and Fader (2005), Furlan et al. (2011a), Furlan, Vinelli and Dal Pont (2011b), Nawanir et al. (2016) and Shah and Ward (2003, 2007) investigated the complementarity idea among the LM practices. The studies argued that the bundles of LM practices portray the high inter-correlation among the practices and are thus inseparable. In other words, they are mutually supportive in nature. These studies tend to support the complementarity theory stating that adoption of one practice may enhance the contribution of others (Lee, Venkatraman, Tanriverdi & Iyer, 2010; Milgrom & Roberts, 1995). This implies that applying the LM practices simultaneously may significantly affect performance rather than applying LM in separated practices. This is why a single practice has a limited ability to enhance competitive advantage (Ahmad, Schroeder & Sinha, 2003), while complementarity practices may positively affect performance to a greater extent. Hence, the bundle of LM practices tends to work together, synergistically and mutually supportive each other.
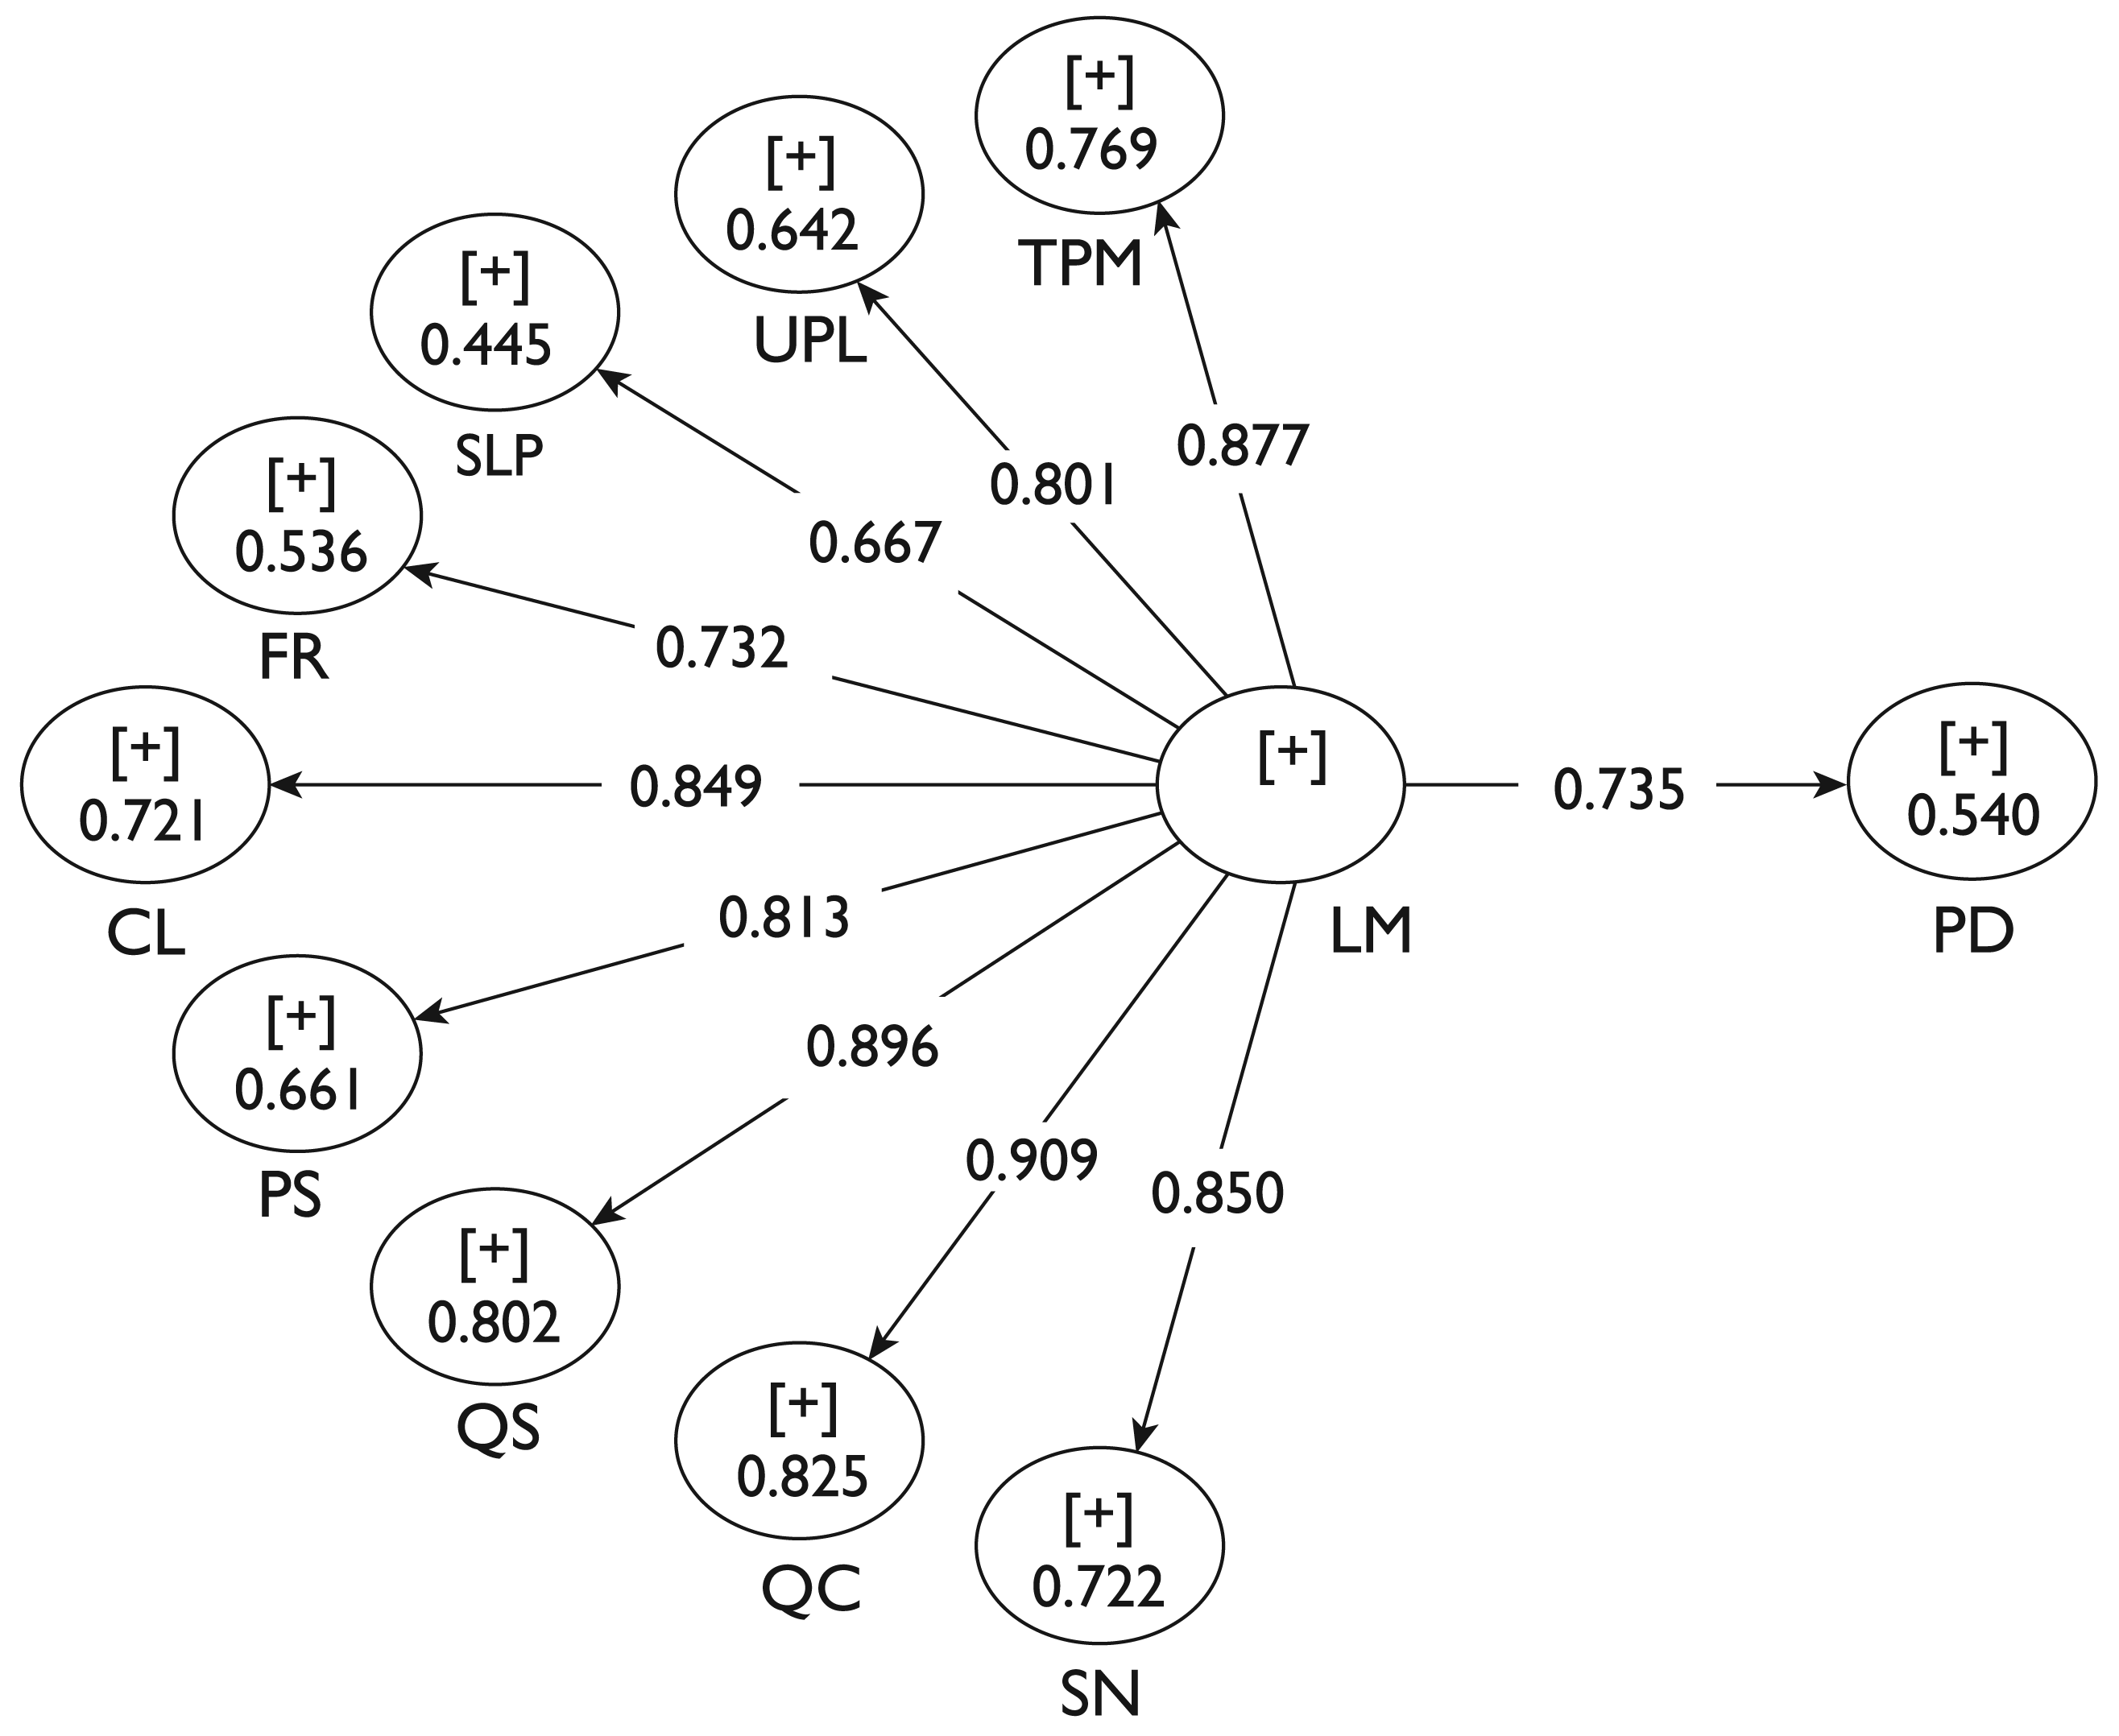
Supported by the complementarity theory and the empirical studies, a second-order model of LM practices was developed. Figure 1 describes the hypothesized path model assessed in the present study. As a second-order construct, LM consists of nine LM practices in correlation with each other. A repeated indicator approach was deployed in which all the indicators of first-order constructs were assigned as indicators of the second-order construct (Hair et al., 2017). Assessment on the convergent validity and CR of the second-order construct shows that all the outer loadings of the first-order construct are at an acceptable level, ranging between 0.667 and 0.909. In addition, AVE and CR are 0.681 and 0.950, respectively. Hence, the construct validity of the second-order model is satisfactory.
Based on Figure 1, instead of relating the nine practices with productivity, the new model depicts the relationship between LM (a second-order construct) and productivity. Thus, the positive relationship between LM and productivity was postulated. A consistent PLS bootstrapping was applied to test the hypothesis. A bootstrap procedure was employed based on 5000 bootstrap samples to derive a 95 per cent bias-corrected bootstrap confidence interval for hypothesis testing (Preacher & Kelley, 2011). The results indicate that β-value of the relationship between LM and productivity is 0.735 with a significant t-value (i.e., 17.935). The β-value has a confidence interval ranging between 0.640 and 0.801. As the range does not contain zero, the hypothesis stating that β-value equals to zero can be rejected. The standardized β-value shows that if LM goes up by one standard deviation, productivity will increase by 0.735. The relationship supports the hypothesis (i.e., LM has a positive relationship with productivity). Furthermore, through a blindfolding procedure, predictive relevance (Q2) indicating the ability of the model to predict endogenous variable was assessed. The result was obtained through the variable score, from which cross-validated redundancy is extracted. Q2 shows an outstanding relevance of 0.337 for productivity, which is greater than 0. This may indicate that the model has predictive relevance (Hair et al., 2017).
Latent Variable Index Values and Performance of the Target Construct PD

Indicators’ Importance and Performance of LM to the Targeted Construct PD

Importance-Performance Map Analysis
In attempting to enrich the analysis results of the present study, an IPMA (Ringle & Sarstedt, 2016) was applied. According to Ringle and Sarstedt (2016), IPMA considers the performance level of latent and manifest variables in a PLS-SEM analysis. Thus, instead of the importance of latent and manifest variable as usually presented (i.e., path coefficient), applying IPMA also provides insight into the importance of the variables to the target construct. Consequently, IPMA allows for prioritizing the variables to improve the targeted variable. In addition, analysing into the indicator level helps the researchers in identifying the most critical activities for the enhancement of the dependent variable. In short, IPMA is useful and particularly important in prioritizing the managerial actions.
Following the guidelines provided by Ringle and Sarstedt (2016), the latent variable (LV) index values and performance the constructs’ importance-performance is exhibited in Table 4. This analysis reveals that small lot production is less important and offers slower performance than the other constructs. Other constructs tend to be equally important for the targeted construct productivity, in which TPM and quality control are the most important constructs of LM, offering higher performance than other constructs. In line with their importance, the high outer loadings of the first-order constructs on the second-order construct LM demonstrate the mutually supportive nature of the relationships (i.e., complementarity) among the LM practices.
More importantly, the indicators’ importance-performance is presented in Table 5. Based on the table, the IPMA reveals some manifest variables exhibiting large importance but has relatively low performance, such as UPL1: ‘We produce more than one product model from day to day’ (importance = 0.017, performance = 66.610); SN6: ‘We rely on a small number of high-performance suppliers’ (importance = 0.018, performance = 68.644); and PS5: ‘We use kanban system to authorize material movements’ (importance = 0.017, performance = 68.98). Additionally, the summary of analysis presented in Table 5 also shows that the importance levels of the indicators of the LM constructs are closely interrelated, ranging between 0.013 and 0.019. Performance ranges from 54.237 to 82.797.
Discussion
The objective of this study is to investigate the effect of LM implementation on production line productivity. Initially, nine hypotheses were tested, relating each practice with productivity using consistent PLS bootstrapping (multiple regression analysis). However, out of the nine hypotheses, only three were supported. Six hypotheses were not significantly related with the productivity. An in-depth investigation was done leading to an inference that the insignificant results were due to the presence of multicollinearity in the multiple regression analysis. It creates a shared variance between the independent variables. Consequently, the ability to predict the dependent variable is decreased, and the contributions of each independent variable are difficult to determine.
To overcome this issue, a second-order model of LM was constructed with the support of the complementarity theory. Assessment on this model led towards the conclusion that LM practices are interrelated with each other. In other words, all the LM practices are mutually supportive in their implementation, in which the adoption of one practice tends to be supported by the implementation of others. Related to these findings, consensus has formed among scholars that to succeed in implementing LM; its practices should be applied holistically, because all the practices are interdependent (Dal Pont et al., 2008; Furlan et al., 2011a, 2011b; Khanchanapong et al., 2014; Shah & Ward, 2003). In other words, adoption of one practice may be related to the adoption of other practices. This implies that adoption of the practices separately tends to drive the company into the failure of the LM implementation. This perhaps is one of the causes why the implementation of LM succeeds in one plant and fails in another. On the top of that, Furlan et al. (2011a, 2011b) offered the idea of complementarity practices due to the synergistic effects of LM practices. A set of practices are complementary when implementation of one augments the marginal returns of others and vice versa (Furlan et al., 2011a; Nawanir et al., 2016).
More importantly, this study also found that the LM practices have complementary (or synergic) effects on productivity. In other words, there is a collective contribution of all the LM practices to enhance productivity of the production line. According to Callen et al. (2005), the implementation of LM in a holistic manner would lead to the higher productivity. This is rationalized by the principle taken by the LM that is to eliminate all types of waste in the production system. This is in line with postulation from Taj and Berro (2006) stating that a useful best practice for productivity improvement is the elimination of waste.
The impact of LM practices on productivity is schematically shown in Figure 2. The figure indicates that each practice of LM contributes to productivity of production lines. Ground on the literature, this is possible because the implementation of LM shall contribute to the better efficiency and utilization of machines and labours; shorter lead time (Chen & Tan, 2011; Fullerton & Wempe, 2009); reduced defect and rework (Nawanir et al., 2013; Taj & Morosan, 2011); lower inventory levels (Chen & Tan, 2011; Taj & Morosan, 2011); more flexible machines/equipment and worker (Chen & Tan, 2011; Mackelprang & Nair, 2010); more efficient production processes (Matsui, 2007); fewer interruptions by the machine breakdown (Chen & Tan, 2011; Taj & Morosan, 2011); and JIT delivery from suppliers (Khanchanapong et al., 2014; Nawanir et al., 2013). This accumulation may have a significant impact on productivity.
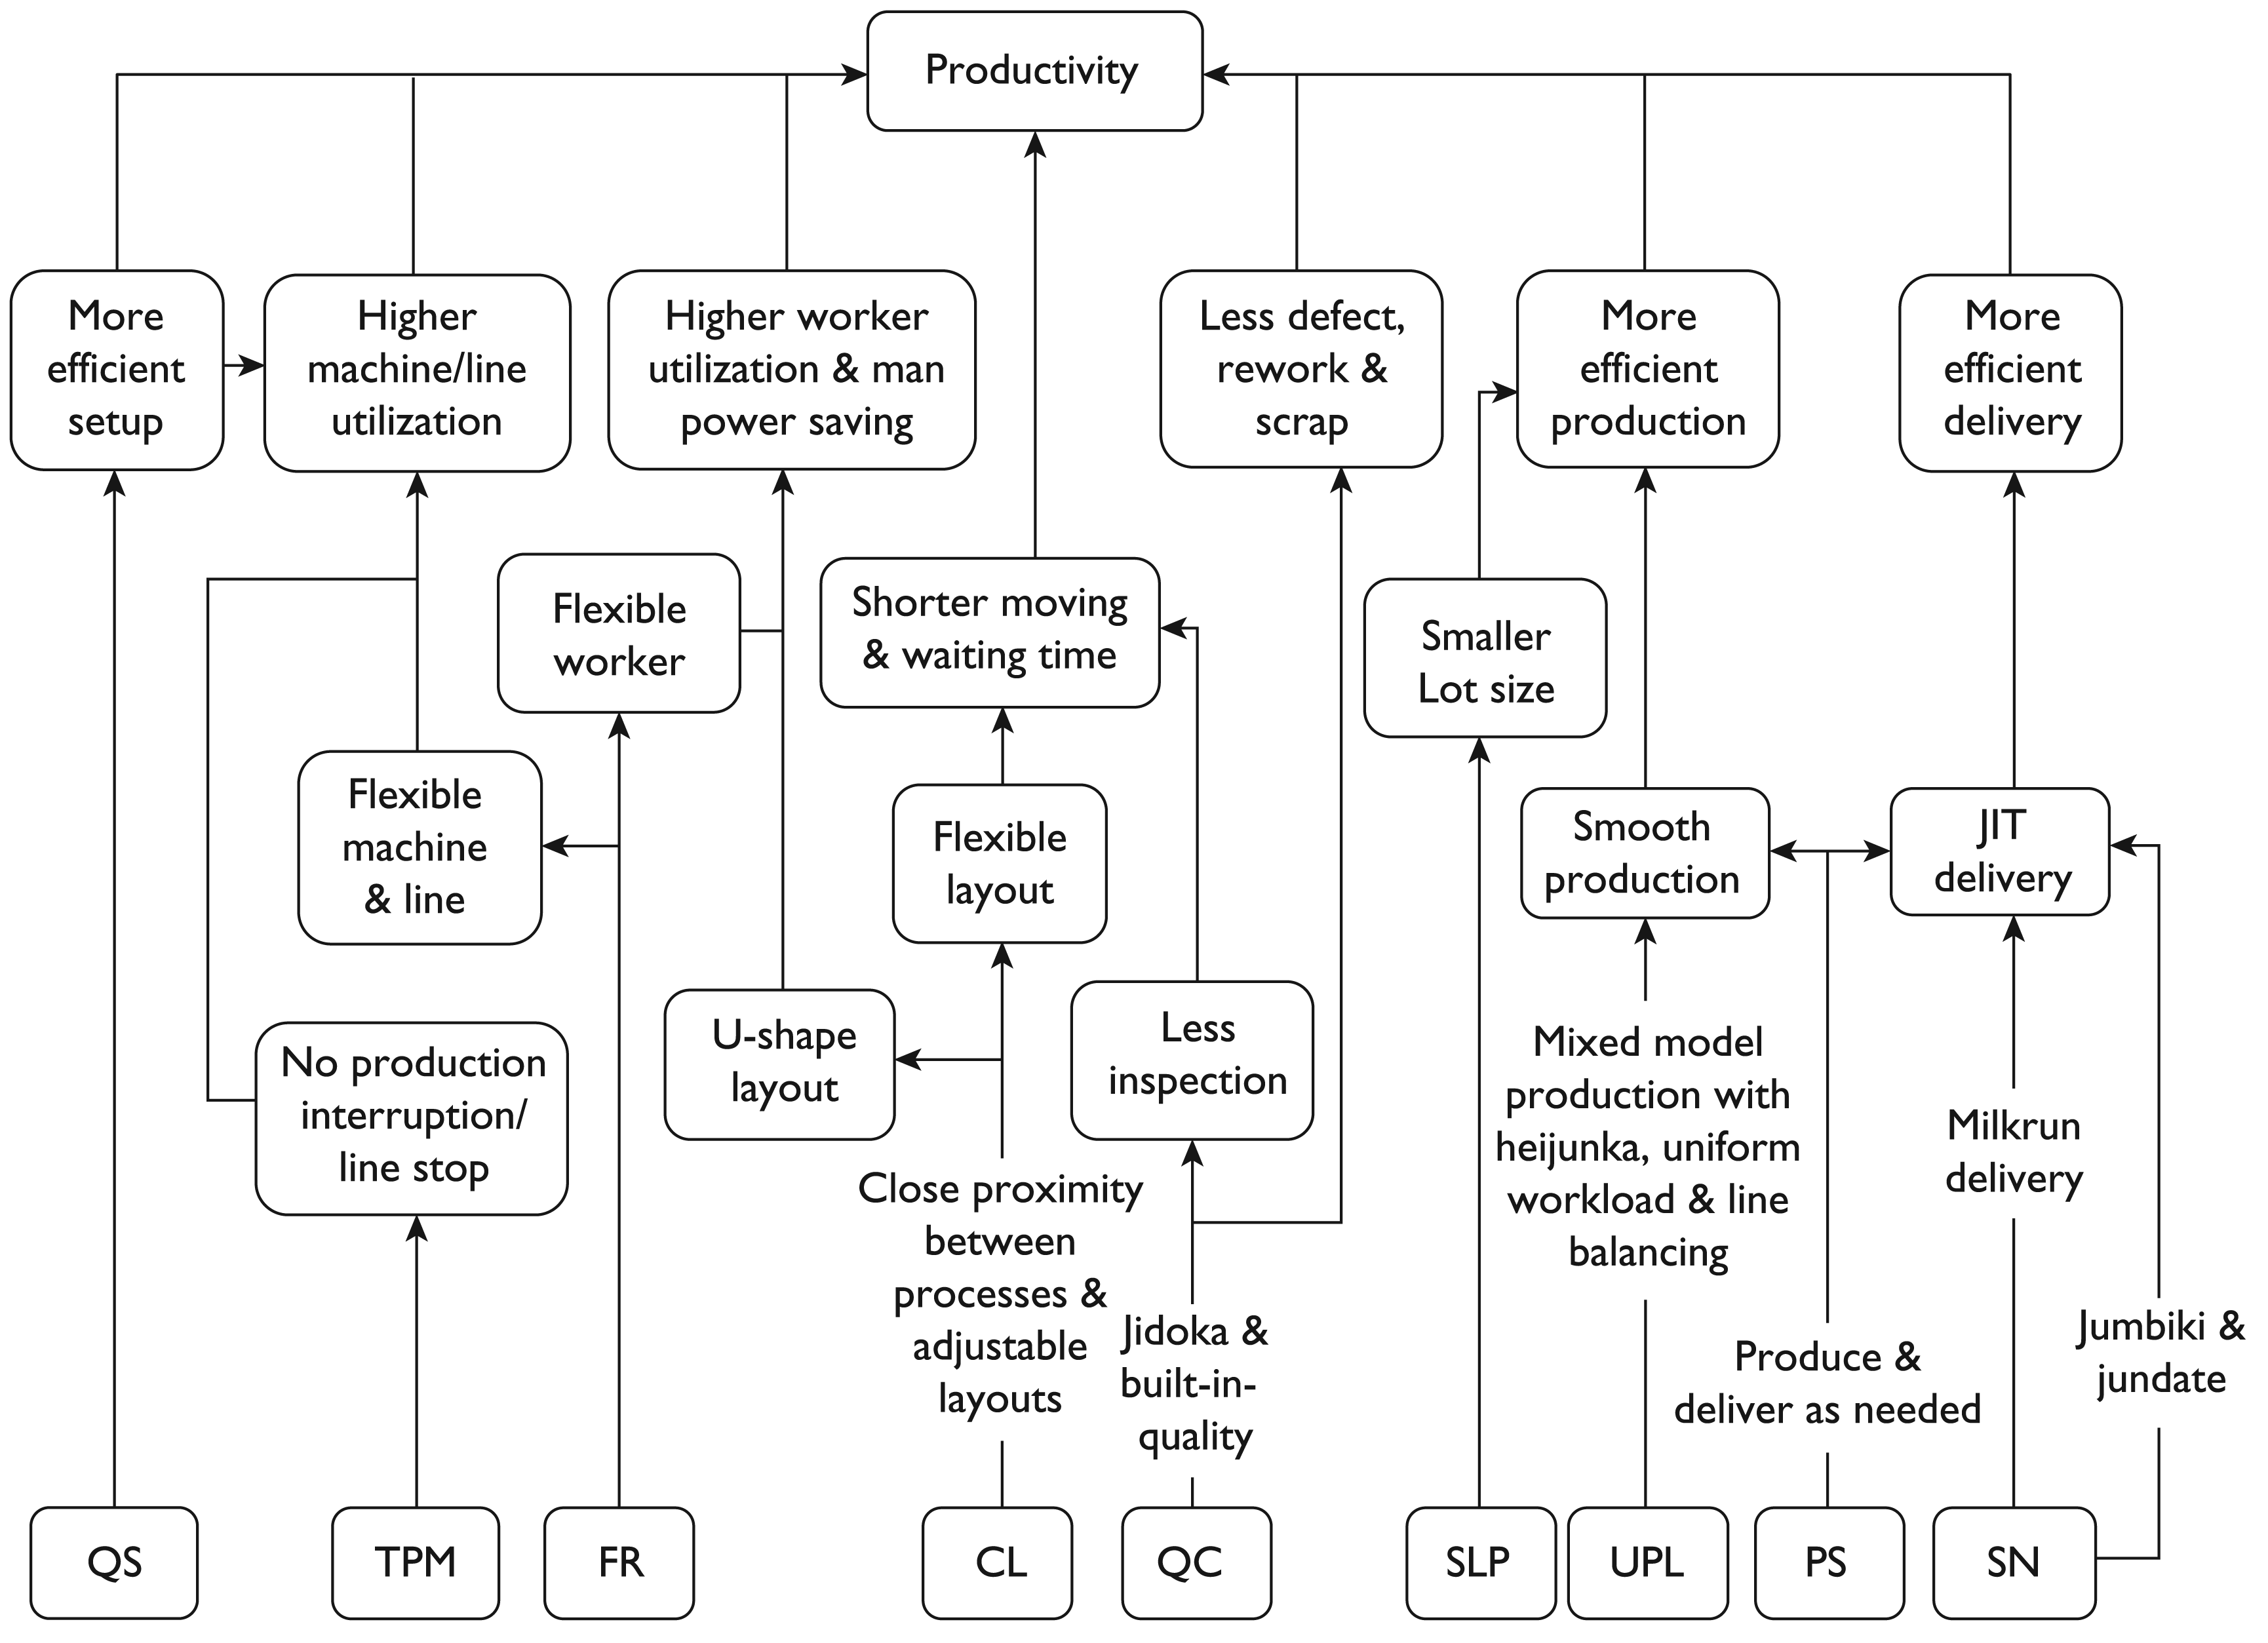
Looking into the IPMA, the study revealed the importance-performance of the LM practices and their indicators to the targeted construct productivity. The analysis suggested the prioritization of improvement to augment productivity of the production line. At the construct level, as the importance of the constructs is closely resembled, in line with outer loadings and correlations among the constructs, the IPMA results tend to suggest implementation of all LM practices simultaneously. Though one of the constructs (i.e., small lot production) has lower importance and performance, this construct is considered essential to support the implementation of other constructs, such as pull system, quality control, uniform production level and supplier networks. More importantly, analysis of the indicator level suggests area improvement, especially for those with high importance but low performance (Ringle & Sarstedt, 2016). The variables and their improvement are as follows:
UPL1: ‘We produce more than one product model from day to day.’ This suggests that performance improvement should be done through the implementation of mixed model production in which several different models of the products are produced daily. In other words, at least some quantity of each item is produced every day. Daily production should be prepared in the same ratio as monthly demand. Ultimately, uniform production level and smooth production with high productivity shall be achieved. SN6: ‘We rely on a small number of high-performance suppliers.’ This suggests maintaining a long-term relationship with a small number of suppliers that have been proven credible, certified for quality, and offer high performance. Through this improvement, JIT delivery can be realized, in which suppliers can deliver the parts and materials upon the JIT basis. Thus, the performance of the construct SN could be increased, leading to high-quality incoming materials, reduced delivery lead time and increased productivity. PS5: ‘We use kanban system to authorize material movements.’ This tends to suggest that production and material movement should only be performed based upon the customer demand. In other words, pull system should be applied. Applying the kanban system into a pull system assists to enhance the production smoothing. Consequently, more efficient production process and high productivity of the production line can be accomplished.
More importantly, the analysis summary presented in Table 5 also demonstrates that the importance of the indicators of the LM constructs is closely resembled with each other. The importance ranges between 0.013 and 0.019. Furthermore, strong correlations among the indicators within the construct indicated by high outer loading were observed in this study. These imply that all the indicators are equally important and mutually supportive in augmenting productivity of the production line. This may support complementarity among the indicators in formulating the constructs.
Conclusion and Implications
This study led to a conclusion that in order to leverage the productivity, LM must be implemented holistically, not piecemeal. Applying LM practices in isolation or in a limited subset could be unsuccessful in achieving the desired performance, it even causes failures. Complementarity theory suggests that contribution of an LM practice to company’s performance depends on its complementary practices. The theory advocates that adoption of one practice positively influences the marginal return of another practice and vice versa so that the complement practices tend to be adopted concurrently because of a mutually supportive nature of the practices. As such, failure in implementing one practice negatively affects the implementation of others. This leads to the disappointment of comprehensive efforts in presenting a desired performance. Sometimes, adopting a single practice may be unsuccessful in achieving the preferred improvement development, or even cause failures (Milgrom & Roberts, 1995). Therefore, complementarity practice must be positively correlated (Khanchanapong et al., 2014). This idea is consistent with RBV, in that individual practice (resource) has inadequate capacity to enhance the competitive advantage in isolation; it could reduce the effect of others (Barney, 1995). Due to the complementarity nature of LM practices, any of them cannot be able to convey the maximum return without supports from others. As such, combining all the LM practices and implement them simultaneously as a system is a requirement.
As previous studies (Margono et al., 2011; Prabowo & Cabanda, 2011) have highlighted a lack of technical efficiency as a major weakness encountered by the manufacturing sectors in Indonesia, it is expected that the findings in the present study shall suggest the area of improvement to help the companies to overcome the emerging issue. First, this study tends to suggest the holistic implementation of LM. By then, it shall assist the manufacturers to eliminate most of the waste (i.e., non-valued added activities) within the entire supply chain networks. This may lead to improvements in terms of the technical efficiency and effectiveness. Consequently, productivity may be increased significantly. Secondly, in order to improve productivity, manufacturing companies in Indonesia should focus on three main activities, namely, the implementation of mixed model production to ensure smooth production and uniform production level; long-term relationships with a small number of suppliers that have been proven credible, are certified for quality, and offer high performance; and the use of kanban to maintain the discipline of pull system in authorizing the production and material movement. Improvement in the three main areas will increase the performance of their constructs (i.e., uniform production level, supplier networks and pull system). Eventually, the contribution of LM on the productivity will be considerably increased.
Limitation and Suggestion for Future Research
This study suffers from certain limitations. It would be useful to consider these when interpreting the findings and before taking any actions from the outcomes of the research. There are two important factors to be addressed in this section, namely, contextual and methodological factors. LM and its benefits on performance indicators (such as productivity) could be influenced by a number of contextual factors, such as type of production process, size of company, type of product, technology used, etc. As is typical when data used in a study are from a particular context, the findings are probably irrelevant in other contexts. Indeed, it would be advantageous to scrutinize LM implementation and its effects by considering these contextual factors. Conducting the study in the different context might be beneficial.
In terms of methodological factors, the data pertaining to all the variables were collected using mail-based survey methodology. Single respondent represented the whole company. Even though the respondents were key persons in LM implementation, a number of factors might be influenced the answer, such as experiences, knowledge, self-perception and even personal condition. Therefore, although the data passed the validity and reliability assessment, and there was no issue of non-response bias and common method variance in the data, respondents’ answers may have differed from that intended. Thus, future studies should consider collecting data from multiple respondents from one company. In addition, future studies are also suggested to combine perceptual and objective measures to provide a more convincing conclusion. The objective measures could be obtained from company documents, such as operational reports, annual reports and other sources.
Footnotes
Acknowledgements
The authors are grateful to the anonymous referees of the journal for their extremely useful suggestions to improve the quality of the article. Usual disclaimers apply.