
Abstract
Using innovation data derived from the Indonesia Innovation Survey (IIS) 2011, this study investigates the nature and importance of innovation barriers faced by Indonesian manufacturing firms and examines the impact of innovation barriers on product, process, organization and marketing innovation and on innovation performance. Undertaking factor analysis, the study finds that the innovation barriers can be categorized as market and institution barriers, employee and organization attitude barriers, finance and risk barriers, and knowledge and cooperation barriers. Applying logit and tobit regression models, this study shows that barriers related to employee and organization attitude have positive influence on innovation and innovation performance. In contrast, the last two barriers have negative effects on innovation and innovation performance. Financial and risk constraints are perceived by the firms to be the most important barriers. Innovative and non-innovative firms perceive innovation barriers related to lack of information on technology, staff resistance to change, managers resistance to change and organization rigidity, differently.
Introduction
The fact that success in innovation plays an important role in competitiveness is undeniable. In the case of firms in developing countries, to achieve innovation success, the firms often face substantial institutional, resource and capability constraints (Fu, Li, Xiong, & Chesbrough, 2015). Any factors that hamper, delay or block innovation are known as innovation barriers (Hueske & Guenther, 2015). Sandberg and Stenroos (2014, p. 1297) define an innovation barrier as ‘an issue that either prevents or hampers innovative activities in the firm’. Hence, identifying the barriers encountered during the innovation process is essential to provide important insights for firms’ decision makers in overcoming these barriers (D’Este, Iammarino, Sanova, & Tunzelmann, 2012). Ability to identify barriers means ‘the firm’s awareness of the difficulties involved as a result of engagement in innovation activities’ (D’Este et al., 2012, p. 482). Despite the fact that research interest in innovation barriers has been growing, such research is more limited and less organized than research on innovation drivers (Hölzl & Janger, 2013).
Several innovation survey-based innovation barrier studies in developing countries have been conducted. For example, studies have examined Brazil (Kuhl & da Cunha, 2013), Cyprus (e.g., Hadjimanolis, 1999), China (Fu et al., 2015; Savitskaya, Salmi, & Torkkeli, 2010; Xie, Zeng, & Tam, 2010; Zhu, Wittmann, & Peng, 2012), Malaysia (Shiang & Nagaraj, 2011) and Turkey (Demirbas, Hussain, & Matlay, 2011). Surprisingly, to date there is no empirical analysis of innovation barriers in the context of Indonesian firms derived from the Indonesia Innovation Survey (IIS). Therefore, investigating this issue is essential to explore innovation barriers experienced by Indonesian firms and enriches the innovation barriers literature in the context of developing countries. Practically, findings from this study can be used to assist policymakers in formulating relevant innovation policies and strategies to overcome the factors that hinder innovation activities in Indonesian manufacturing firms.
In the case of Indonesia, existing studies have linked innovation barriers to a range of development issues. However, the studies tend to be case studies of specific industries. For example, financial constraint was the most important barrier that hindered Indonesian furniture SMEs (Small and medium enterprises) in accessing knowledge for use in innovation (Van Geenhuizen & Indarti, 2005) and was also the main constraint faced by the majority of Indonesian SME owners in general (OECD, 2010). Knowledge and skills related barriers also hamper technological development in Indonesia. Indonesian firms suffer from a lack of technological development as a result of low R&D budgets and inadequate education, both of which drive Indonesian firms to rely on foreign firms for enhancement of their technological capabilities (Okamoto & Sjoholm, 2001). A case study from the Indonesian turbine industry shows that knowledge and skill barriers hamper the technology transfer process of imported technology (Soekarno, Damayanti, & Wibowo, 2009). Constraints related to lack of scientific cooperation among Indonesian technology producers, few internal R&D activities and lack of technology absorptive capacity also hamper Indonesian firms from performing innovation activities (Lakitan, 2013). Managerial constraints hinder the development of the Indonesian aircraft industry and affect the technological accomplishment and performance of the industry (McKendrick, 1992). Institutional problems such as corruption also hinder Indonesia’s development (Hofman, Rodrick-Jones, & Thee, 2004). Challenges also arise when Indonesia attracts foreign firms to invest in the country. These challenges include a relatively poor business environment, the low quality of national institutions, the lower level of education of the labour force and poor infrastructure (Lipsey & Sjoholm, 2011).
The following section presents a literature review of research related to the classification of innovation barriers, the relationship between innovation barriers and firm innovativeness and the impact of innovation barriers on innovation and innovation performance. The next section is objective of the study. This is followed by a description of the methods, data collection and statistical analysis used in this study. The next section presents results of descriptive and empirical statistics. The last section contains conclusion and implications of the study.
Objectives of the Study
The objectives of this study are to investigate Indonesian manufacturing firms’ perceptions of innovation barriers, the nature of any factors that hamper innovation in Indonesian manufacturing firms and the impact of innovation barriers on innovation and innovation performance. Therefore, this study addresses the following research questions:
To what extent do Indonesian manufacturing firms perceive innovation barriers? What is the nature of innovation barriers encountered by Indonesian manufacturing firms? To what extent do innovation barriers affect innovation and innovation performance in Indonesian manufacturing firms?
Review of Literature
Classification of Innovation Barriers
Previous scholars have classified constraints related to innovation activities in various ways: internal (endogenous) versus external (exogenous) barriers (Piatier, 1984), revealed versus deterring barriers (D’Este et al., 2012), the EOGI (External environment, Organization, Group & Individual) barrier model (Hueske & Guenther, 2015) and the five categories of innovation barriers classified in the 3rd edition of the Oslo Manual (OECD & Eurostat, 2005). The most common classification of obstacles to innovation is internal versus external innovation barriers. Internal barriers can be subdivided into lack of internal funds; lack of technical expertise or management time; culture and systems (Rush & Bessant, 1992); firms’ resources and capabilities (Hewitt-Dundas, 2006) and human nature-related barriers such as employee resistance to innovation (Zwick, 2002). External barriers can be subdivided into supply, which includes constraints in obtaining technological information, raw materials and financing; demand, including constraints related to customers, perceptions of innovation risks and domestic and international market issues; and environmental factors such as government regulations and policies (Hadjimanolis, 1999).
The classification of revealed and deterred barriers is proposed by D’Este et al. (2012). The term revealed barriers refers to ‘the firm’s awareness of the difficulties involved with engagement in innovation activities and points to a “disclosing” or “learning” outcome based on direct experience’. The term deterred barriers refers to barriers that are ‘seen by firms as being insurmountable’ (D’Este et al., 2012, p. 482). When innovators face revealed barriers in innovation activities, this does not prevent them from performing the innovation activities and increases their consciousness and knowledge through the direct experience gained in overcoming the barriers. Previous studies that support this view find that the greater the firm’s involvement in innovation activities, the greater the importance attached to the barriers to innovation. These studies also show a positive association between the perception of innovation barriers and the propensity for innovation (Baldwin & Lin, 2002; Galia & Legros, 2004; Hadjimanolis, 1999; Iammarino, Sanna-Randaccio, & Sanova, 2009). Further evidence for the positive association between innovation obstacles and propensity for innovation comes from innovation survey studies such as Community Innovation Survey (CIS), which find that the association cannot be interpreted as preventing innovation but rather as a sign of how successful the firm is in overcoming the barriers (Baldwin & Lin, 2002; Tourigny & Le, 2004). However, deterring effects exist when there is a reverse causality between the perception of innovation barriers and innovation. In such cases, innovation activity is significantly reduced by obstacles (e.g., Mohnen & Röller, 2005; Savignac, 2006; Tiwari, Mohnen, Palm, & van der Loeff, 2007).
Based on a systematic review of 188 empirical studies, Hueske and Guenther (2015) developed the EOGI barrier model which consists of the external environment, the organization, the group and individuals. The external environment includes external stakeholders such as investors, potential employees, suppliers, competitors, customers, the state and the society. At the organizational level, the factors reflect managerial levels of dynamic capabilities that include strategy, structure, size, resources, organizational learning and organizational culture. At the group level, team structure, team climate, team processes, the characteristics of team members and leadership style are the relevant factors. The individual level consists of both managers’ and employees’ attitudes and abilities.
Innovation Barriers and Its Definition
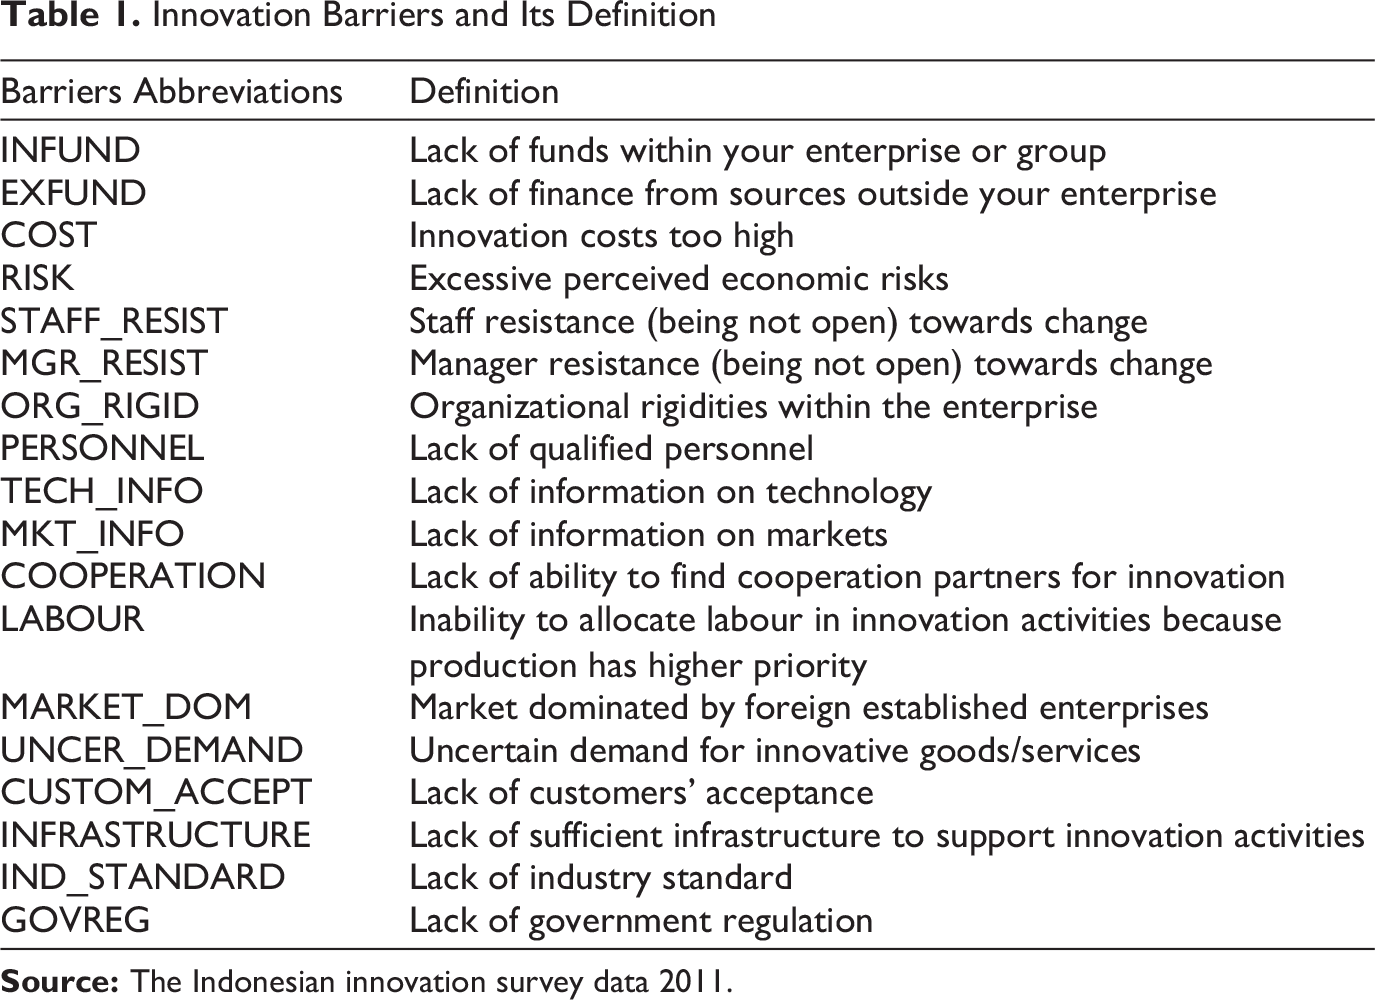
To date, there is no single study that empirically investigates the importance of and classification of perceived innovation barriers in the context of Indonesian firms. Therefore, this study aims to investigate this underexplored issue using innovation data from the IIS 2011. Table 1 presents 18 diverse types of innovation barriers derived from the IIS 2011.
Perception Innovation Barriers
The study presented here investigates the perception of innovation barriers in Indonesian manufacturing firms that are innovative firms versus those that are non-innovative. The findings are expected to reveal how innovative and non-innovative firms perceive innovation constraints differently. Previous studies have shown that perceptions about innovation constraints differ between firms that perform innovation activities and firms that do not and between firms that more innovative and less innovative (Baldwin & Lin, 2002; Galia & Legros, 2004; Iammarino et al., 2009).
Using Canadian manufacturing firm data, Baldwin and Lin (2002) examine innovation constraints between innovators and non-innovators and between adopters and non-adopters of advanced technologies. Their study reveals that a greater proportion of innovators and adopters of advanced technologies report impediments than do non-innovators and non-adopters of advanced technologies. Iammarino et al. (2009) report a similar phenomenon and their study supports a positive association between the perception of innovation barriers and the propensity for innovation.
In the case of developing countries, previous studies also reveal similar findings that the higher the firms’ innovativeness, the higher the level of innovation barriers importance. For example, Hadjimanolis (1999) found that the higher the importance of the external barriers perceived by owners/managers of Cypriot SMEs, the higher is the firms’ innovativeness. Malaysian innovative firms also perceive innovation barriers more important than non-innovative firms (Shiang & Nagaraj, 2011). The reason behind such findings may be that innovative firms when they are facing important barriers, they able to find ways to overcome them, while non-innovative firms tend to underestimate or not be aware of them (Hadjimanolis, 1999). Based on this, hence, it is expected that Indonesian manufacturing firms that engage and do not engage in innovation activities perceive the importance of innovation barriers differently.
Innovation Barriers and Their Impact on Innovation
The majority of innovation barrier literature discusses the influence of financial constraints on innovation performance (Canepa & Stoneman, 2002, 2008; Efthyvoulou & Vahter, 2012; Mohnen, Palm, Loeff, Schim, & Tiwari, 2008; Savignac, 2006) and the factors influencing perceptions of constraints (Baldwin & Lin, 2002; Galia & Legros, 2004; Iammarino et al., 2009). Surprisingly, there is little investigation of the relationship between innovation barriers and different types of innovation, with the exception of studies conducted by Madrid-Guijarro, Garcia, and Auken (2009) and Silva, Leitao, and Raposo (2008). An attempt to link innovation barriers and innovation in Spanish firms was conducted by Madrid-Guijarro et al. (2009), who found that barriers have different impacts on product, process and management innovation. Process and management innovation are negatively affected by insufficient financial and human resources, while barriers related to the external environment positively affect these two types of innovation. A wide range of innovation barriers also have been linked to the propensity of firms to pursue product or process innovation (Silva et al., 2008). These authors find that constraints related to the high cost of innovation, a lack of financing sources, a lack of skilled personnel and a lack of customers who are responsive to new products significantly affect the propensity for product and process innovation (Silva et al., 2008). Based on these results, it is expected that this study will reveal that diverse types of barriers faced by Indonesian manufacturing firms have different impacts on the four types of innovation adopted by the firms.
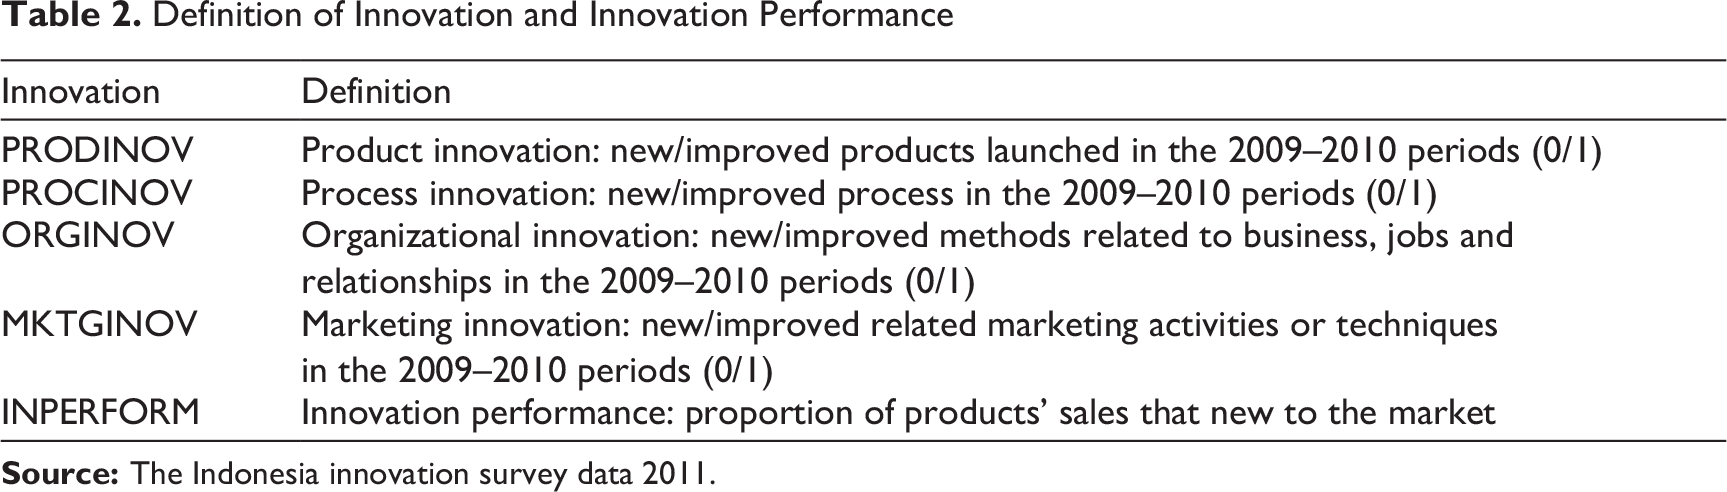
Table 2 presents definitions of innovation and innovation performance from the IIS 2011. There are four types of innovation, including product, process, organizational and marketing. Product and process innovation can be labelled as traditional innovation or technological innovation, and organizational and marketing innovation can be termed as wider innovation or non-technological innovation (refer to Battisti & Stoneman, 2010 for innovation classification).
Innovation Barrier and Innovation Performance
Studies that discuss the influence of innovation barriers on innovation performance as measured by proportion of sales that represent innovative product new to the market are rare, with the exception of a study conducted by Hewitt-Dundas (2006). She finds that different innovation barriers affect innovation performance differently during two periods of an innovation survey (1993–1996 and 1996–1999) in Ireland. Lack of market opportunities in the first innovation survey period significantly affects innovation success in the later period. Lack of information on new technologies significantly influences innovation sales in both periods of the survey. These results support those of Dasgupta, Gupta, and Sahay (2011, p. 258), who argue that ‘the creation, development and application of technology can form the basis for the success of firms’. Changes in the significance of certain obstacles, such as degree of risk of innovation and managerial expertise, between the two periods also affect innovation success. Therefore, it is predicted that different innovation barriers faced by Indonesian firms will impact innovation performance differently.
Definition of Innovation and Innovation Performance
Data and Methods
Data
The empirical analysis in this study is derived from the second IIS 2011 that covers 2009–2010. The surveyed firms are classified based on the International Standard Industrial Classification (ISIC) Rev. 3.1. Multistage random sampling is used to collect data from 1,500 firms via questionnaire and a total of 1,375 questionnaires were successfully collected. Of the returned questionnaires, 1,179 were usable. Direct or face-to-face interviews of R&D or production managers were also conducted. The IIS 2011 used the Oslo Manual (OECD & Eurostat, 2005) as the guideline for collecting and interpreting innovation data. The IIS 2011 surveyed only medium-sized (20–99 employees) and large (more than 99 employees) Indonesian manufacturing firms. Nearly 77 per cent of the surveyed firms are medium-sized firms, while the remaining 23 per cent are large firms.
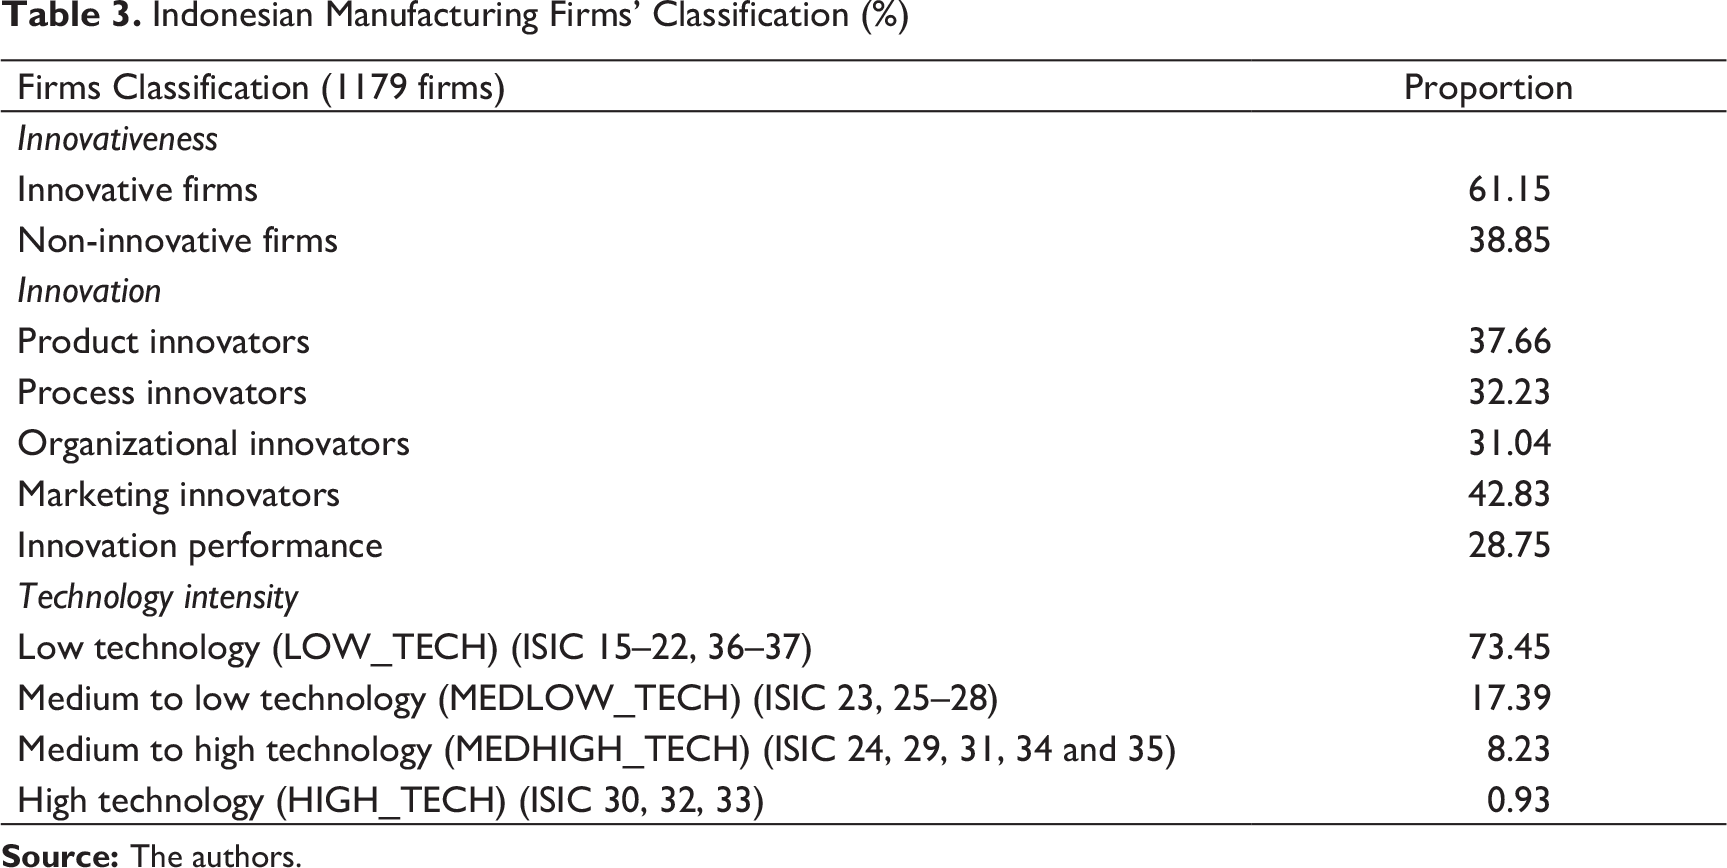
Based on the 3rd Oslo Manual guideline, the IIS 2011 defined innovation as ‘the implementation of a new or significantly improved product (goods or services) or process, a new marketing method or a new organisational method in business practices, workplace organisation or external relations’ (OECD & Eurostat, 2005, p. 46). Therefore, based on this definition that covers a broad range of possible innovations, the IIS 2011 then defines an innovative firm as a firm that performed any product, process, organizational or marketing innovation during 2009–2010. Table 3 shows that innovative firms accounted for 61.15 per cent of those surveyed, while non-innovative firms accounted for approximately 39 per cent. Among the innovative firms, marketing innovation was the most prevalent form of innovation at nearly 43 per cent, followed by product innovation at approximately 38 per cent, process innovation at 32 per cent and organizational innovation at 31 per cent. Low-technology firms dominate the surveyed firms, representing 73 per cent, in contrast to less than 1 per cent that are high-tech firms.
Indonesian Manufacturing Firms’ Classification (%)
Variables
Dependent variables consist of the four types of innovation and innovation performance. Independent variables are the types of innovation barriers. Firm resources such as size, age, export activity, labour quality as measured by formal education and technology intensity are also included.
Methods
A t-test is used in this study ‘for evaluating the difference between two groups of sample respondents on a single dependent variable’ (Cooksey, 2007, p. 194). In this case, the two groups are innovative and non-innovative firms. Factor analysis (principal component analysis) is also used in order to identify and combine innovation barrier variables in ‘a weighted fashion to form components which account for the maximum amount of variability in the variables’ scores’ (Cooksey, 2007, p. 138). Logistic regression is performed to handle predictions of and modelling responses to the dependent variables, the four types of innovation. Firms that perform any of the four types of innovation are coded 1, otherwise they are coded 0. Finally, tobit regression is used to test the influence of innovation barriers on innovation performance. Innovation performance is indicated by the proportion of sales of innovative products new to the market and values are positive.
Results
Descriptive Statistics
Table 4 reports the descriptive statistics results. On average, the proportion of Indonesian manufacturing firms that adopted any type of innovation is greater than 30 per cent. The most frequent form of innovation is marketing innovation (MKTGINOV) (42.8%), while the least frequent is organizational innovation (ORGINOV) (31%). The fact that the firms more frequently perform marketing innovation is typical in developing countries that focus on the market rather than on the technology (Wamae, 2009).
Descriptive Statistics
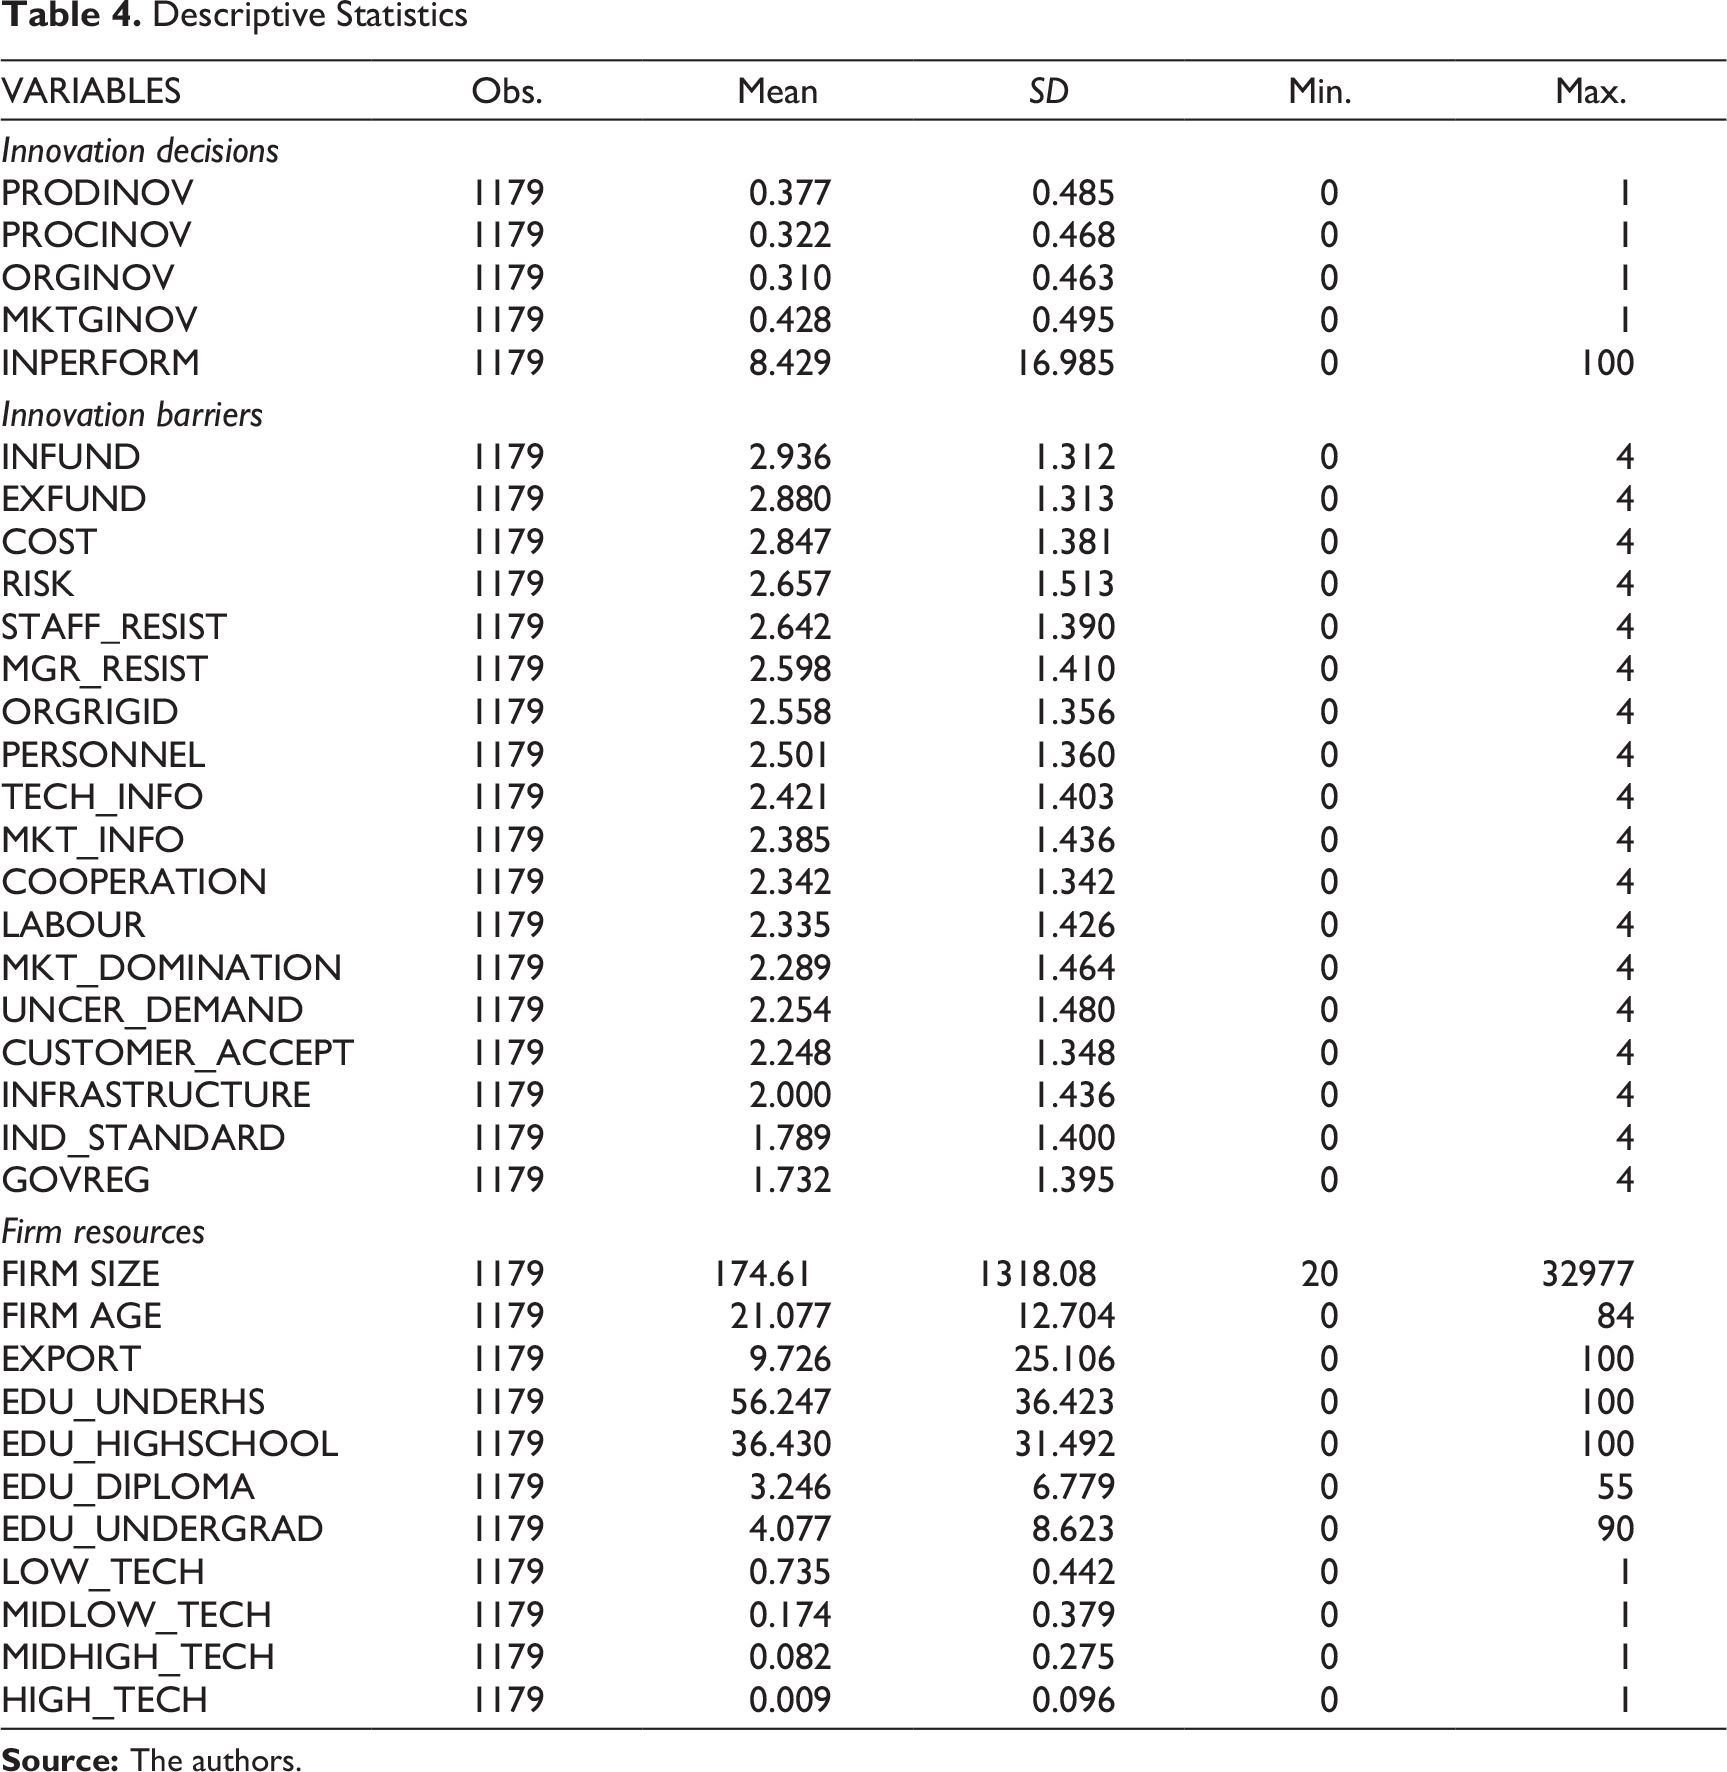
The range for the innovation barrier variable scores is from 0 (not important) to 4 (very important). On average, for all firms, the score for barriers related to financing and risk, including COST, RISK and INFUND, scored nearly 3, which are among the top three mean scores compared to other types of barriers. This finding confirms previous studies that reveal financial constraints are more important than other constraints in developed countries. For example, barriers related to financial are more importance than other internal and external barriers on innovation projects not starting, being delayed or postponed among firms in European countries (Canepa & Stoneman, 2002).
The top barriers related to financial factors in this study are also similar to previous studies in developing countries’ context. For instance, Cypriot owners/managers perceive that lack of financing of innovation as the top barriers hamper small firms in Cyprus (Hadjimanolis, 1999). Based on the Malaysia National Survey of Innovation, C. H. K. Lee and Lee (2006) and Shiang and Nagaraj (2011) find that Malaysian manufacturing firms perceive that financing is more important factor than other factors that hampering innovation activities.
In contrast, the mean scores for obstacles related to organizational rigidities, ORG_RIGID, and managers’ resistance to change, MGR_RESIST, are the lowest at 1.789 and 1.732, respectively.
Considering firm resources, the mean of firm size as indicated by number of employees is approximately 175 people. Of surveyed firms, mature firms that have been in business for more than 20 years dominate in the IIS 2011. Exporters, on average, export approximately 10 per cent of their products. Labour education is lacking. Approximately 56 per cent of employees do not have high school degrees, indicating a low level of education of the firms’ human resources. In contrast, less than 5 per cent of employees hold undergraduate degrees. In terms of technology intensity, there is a big difference between the means for low- and high-technology firms, with values of 0.735 versus 0.009, respectively.
Mean Rankings of Innovation Barriers
Table 5 presents the mean rankings of the importance of innovation barriers by firms’ innovativeness. The table shows that innovators and non-innovators vary significantly on four barriers: lack of information on technology (TECH_INFO), staff resistance to change (STAFF_RESIST), managers’ resistance to change (MGR_RESIST) and organization rigidity (ORG_RIGID). On a marginally significant level, non-innovative firms perceive TECH_INFO to be more important than innovative firms.
T-Test of Innovation Barriers between Non-innovators and Innovators Firms (1179)
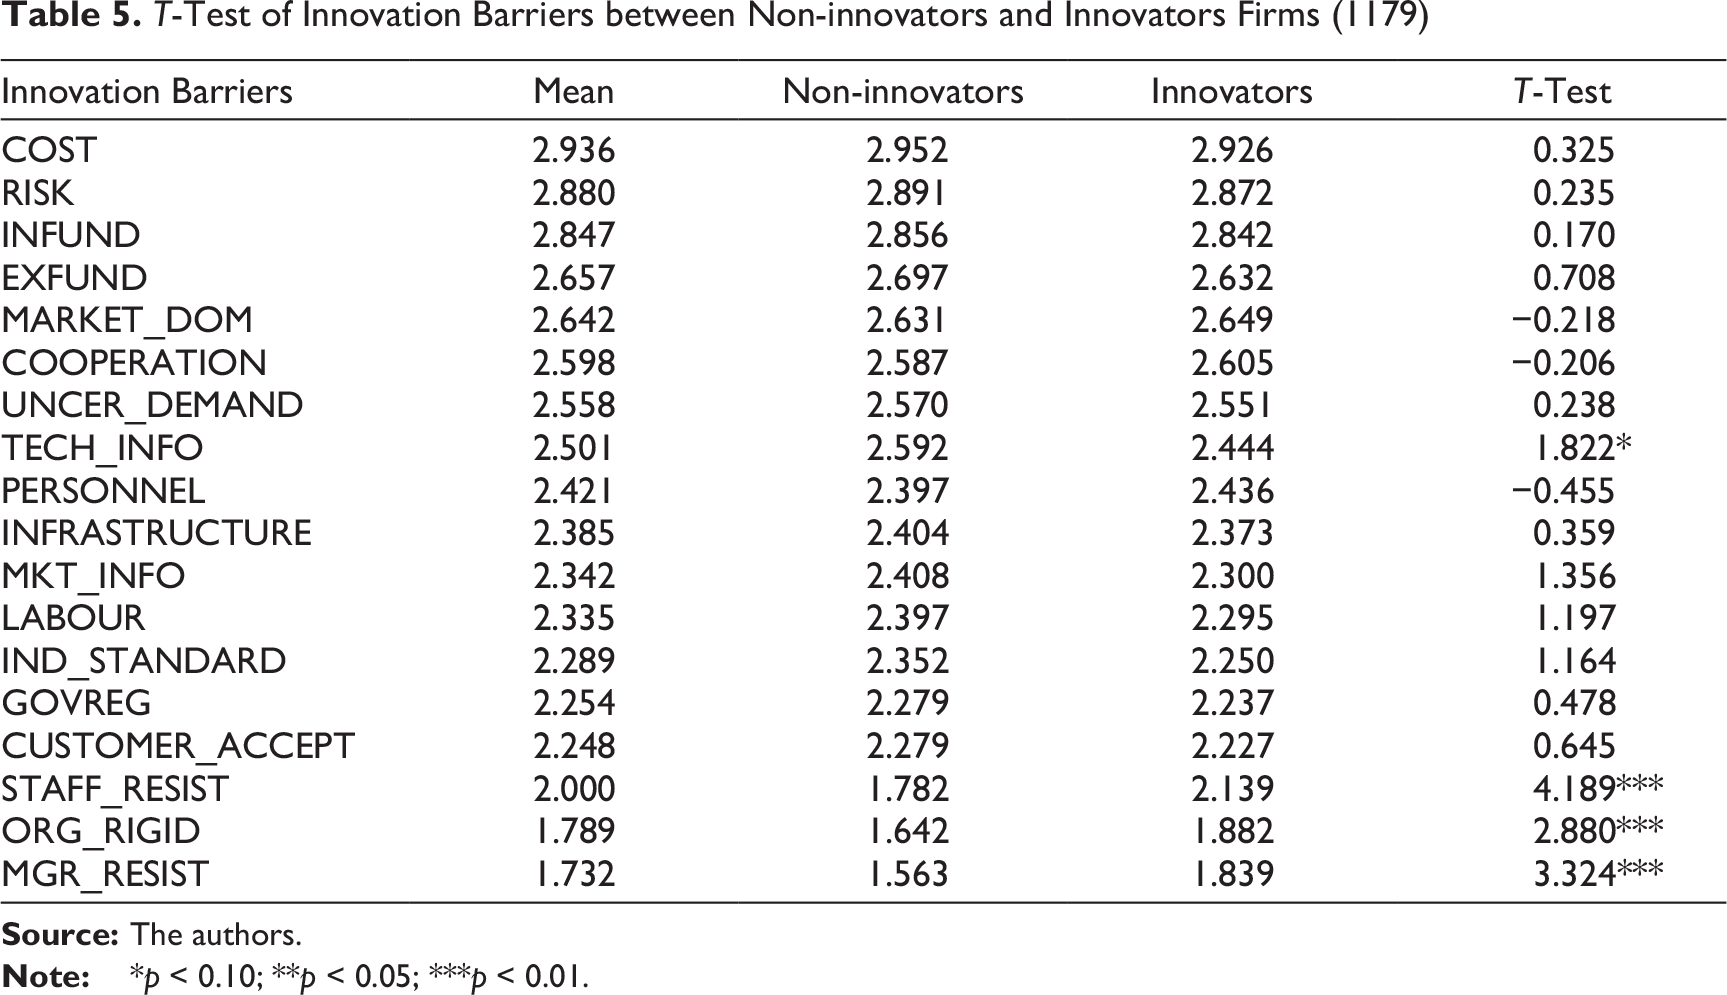
A highly significant result is that innovators perceive the three obstacles related to employee and organization attitude as more important than non-innovators. This indicates that internal barriers perceive to be more important than external barriers. According to Zwick (2002, p. 542), ‘employee resistance against innovations is an important barrier against necessary innovation and a source of irritation in industrial relations’.
This may lead to the conclusion that awareness of innovation barriers among innovative versus non-innovative firms is different. This finding confirms previous innovation barrier studies (Baldwin & Lin, 2002; Galia & Legros, 2004; Tourigny & Le, 2004).
Correlation Analysis
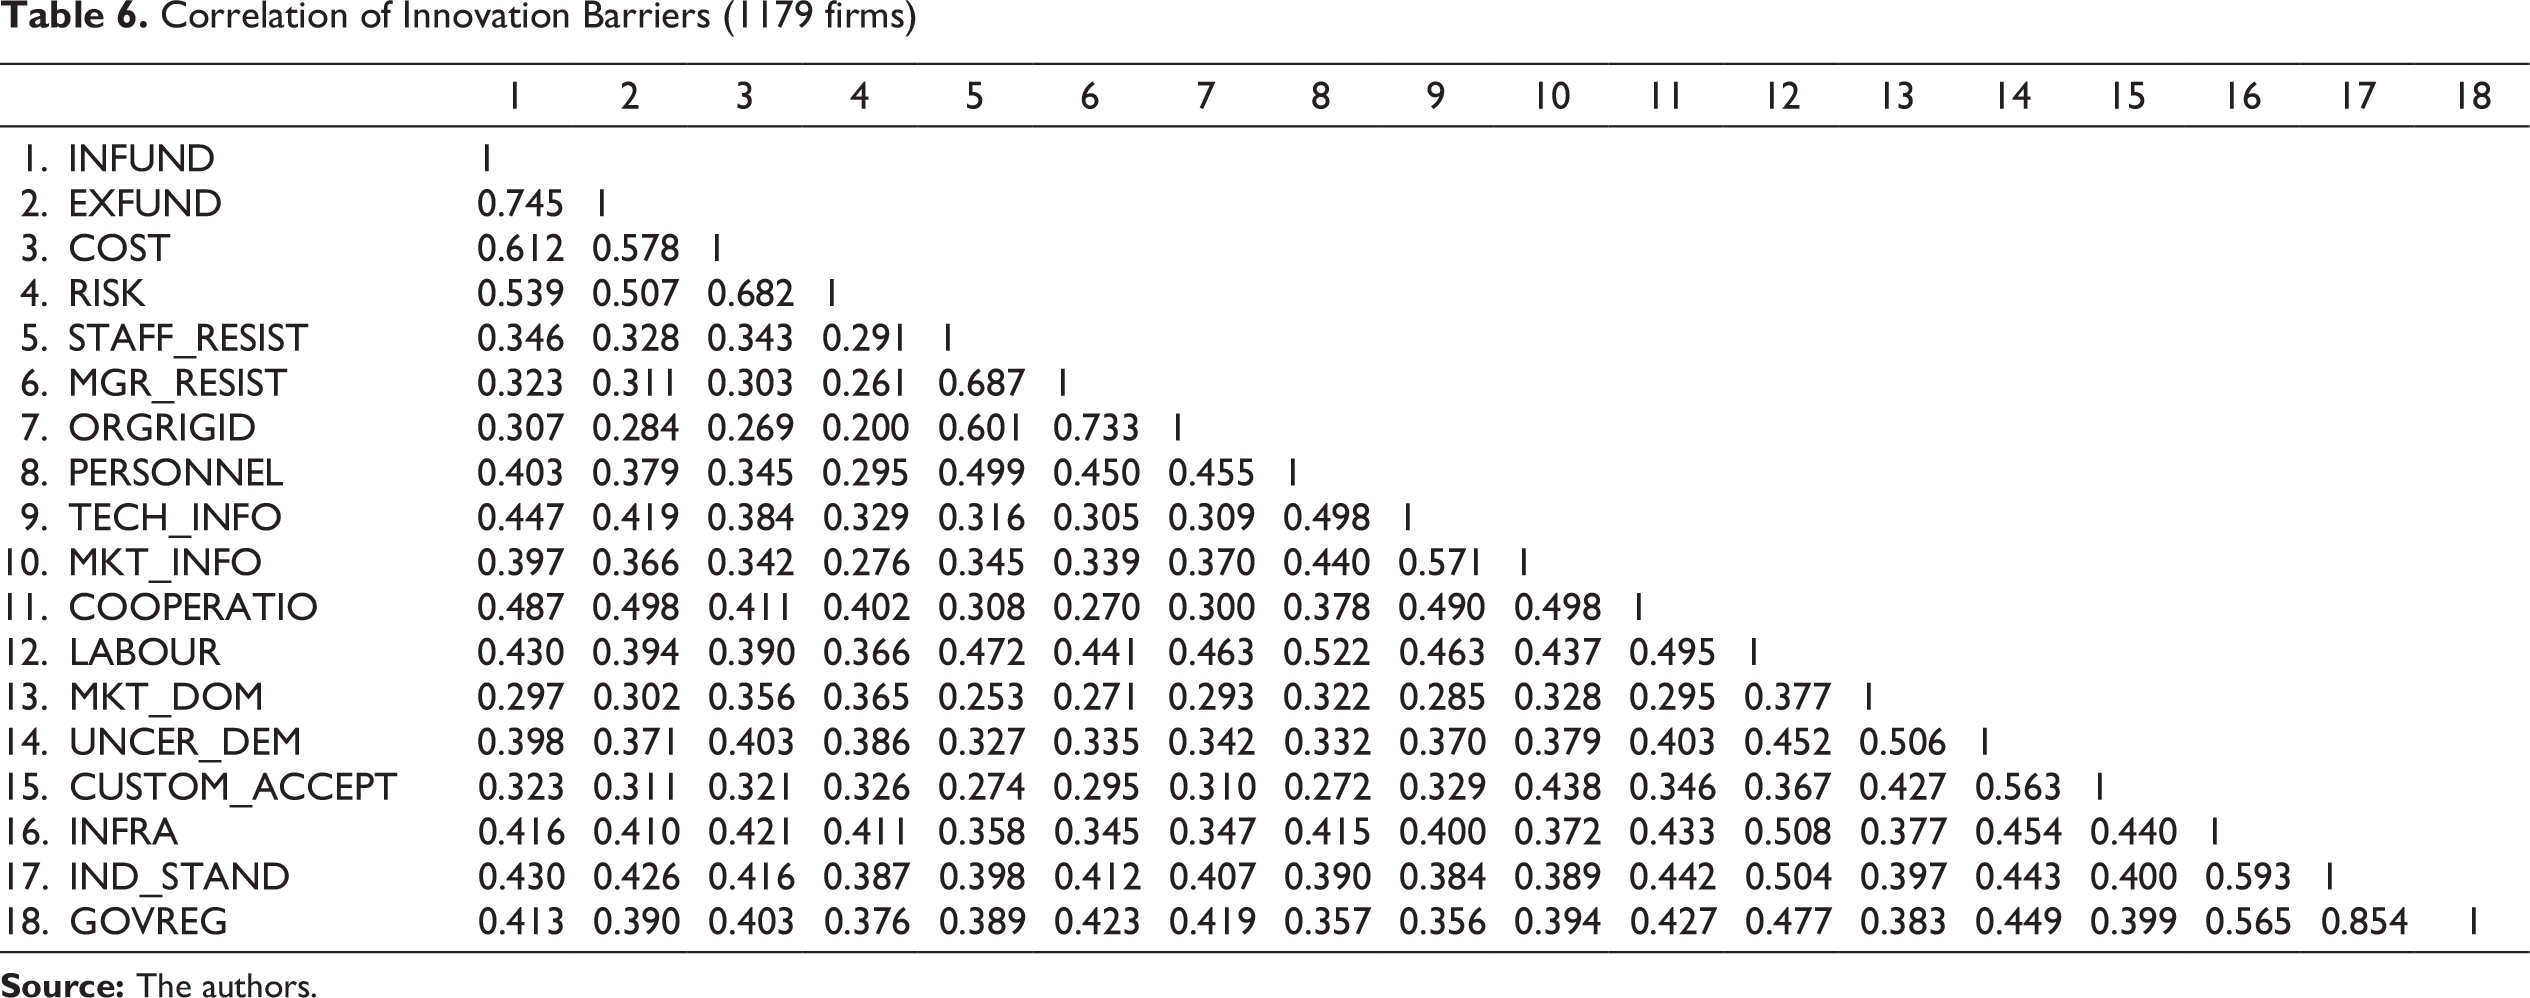
Correlations between innovation barrier variables are presented in Table 6 and show positive relationships among the variables.
Factor Analysis
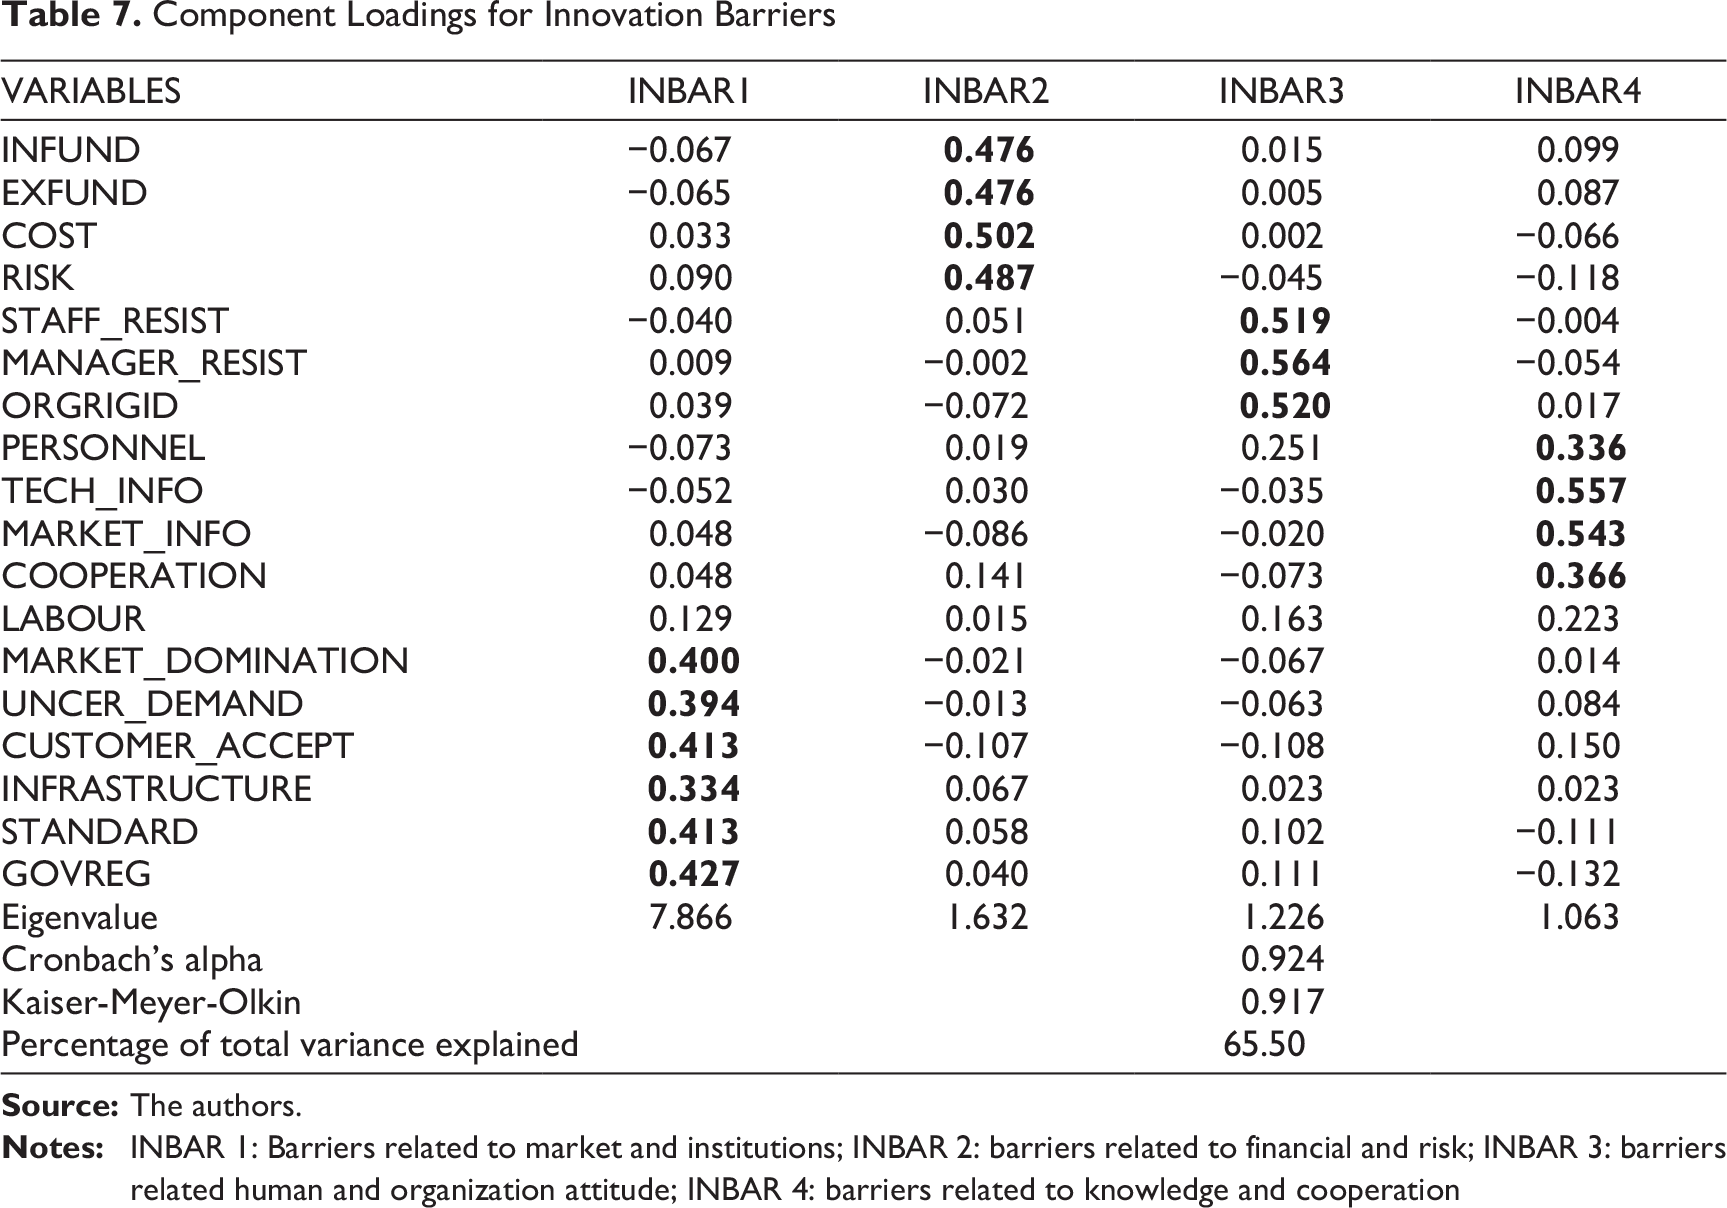
Table 7 displays the results of varimax rotated factor analysis of the 18 innovation barrier variables. Factor loadings above 0.3 were used for factor grouping. The Bartlett test of sphericity: 12,000, significance = 0.000. The Kaiser–Meyer–Olkin measure of sampling adequacy is 0.917, which is well above the acceptable range of greater than 0.50 (Hair, Black, Babin, & Anderson, 2014). The scale reliability value for each factor (coefficient alpha) is 0.924. The barriers used in principal components analysis are grouped into four categories: market and institution; financing and risk; employee and organization attitude; and knowledge and cooperation.
Factor 1, market and institution barriers, consists of six items including market domination by foreign established enterprises; uncertain demand for innovative goods and services; lack of customer acceptance; lack of sufficient infrastructure to support innovation activities; lack of industry standards from government; and lack of regulation from government. This group of innovation barriers is associated with the external environment of firms. Based on factor analysis, previous studies have also classified constraints related to the external environment (Hadjimanolis, 1999; Madrid-Guijarro et al., 2009).
Factor 2 consists of financial and risk barriers, including lack of internal and external funding, the high cost of innovation and perception of excessive economic risk. Obstacles related to financing are some of the most common barriers faced by firms, as shown in previous studies (e.g., Canepa & Stoneman, 2008; Efthyvoulou & Vahter, 2012; Ferrando & Ruggieri, 2015; Mohnen et al., 2008).
Factor 3 consists of innovation barriers related to employee and organization attitudes that includes staff and manager resistance to innovation and organizational rigidity. This type of barrier also has been discussed in previous studies (e.g., Hewitt-Dundas, 2006; Madrid-Guijarro et al., 2009; Zwick, 2002). Factor 4 is associated with knowledge and cooperation and consists of the lack of qualified personnel; lack of information on technology and market; and a lack of cooperation activities.
Logistics Regression
Logistics regression is used to measure the impact of the four groups of innovation barriers generated from factor analysis on different types of innovation, including product innovation new to the market (radical innovation) and product innovation new to the firm (incremental innovation). Table 8 presents the logistic regression results and includes of six models. Barriers related to market and institution as well as employee and organization attitudes tend to have positive associations with innovation. However, only employee and organization attitudes towards change positively and significantly affect all types of innovation, except organizational innovation. This result may also indicate that employee and organization attitude-related barriers do not prevent Indonesian firms from performing innovation as awareness of the barriers may provide learning and experience during the process of overcoming these barriers while performing innovation activities (refer to D’Este et al., 2012 for review). Further interpretation on this finding is that Indonesian firms that perform any product, process or marketing innovation experience barriers related to employee and organization attitude towards change as they engage in innovation activities. However, this barrier does not stop the firms from innovating as the firms are able to overcome these obstacles.
Correlation of Innovation Barriers (1179 firms)
In contrast, barriers related to financial and risk factors and knowledge and cooperation factors are more likely to have negative associations with innovation. Financial and risk barriers negatively and significantly affect all types of innovation except marketing innovation. Similar findings also can be found in the majority studies that focus on the impact of financial constraint on innovation activities in both developed and developing countries. For example, financial factors affect more severe in higher technology sectors and for smaller firms (Canepa & Stoneman, 2008). Financial barriers have more negative affect on innovation performance in the production sector than in the service sector (Efthyvoulou & Vahter, 2012). Significant and negative effects of financial constraint on labour productivity in the majority of sectors across European countries also found in Ferrando and Ruggieri’s (2015) study.
Component Loadings for Innovation Barriers
Logistic and Tobit Regressions Outputs
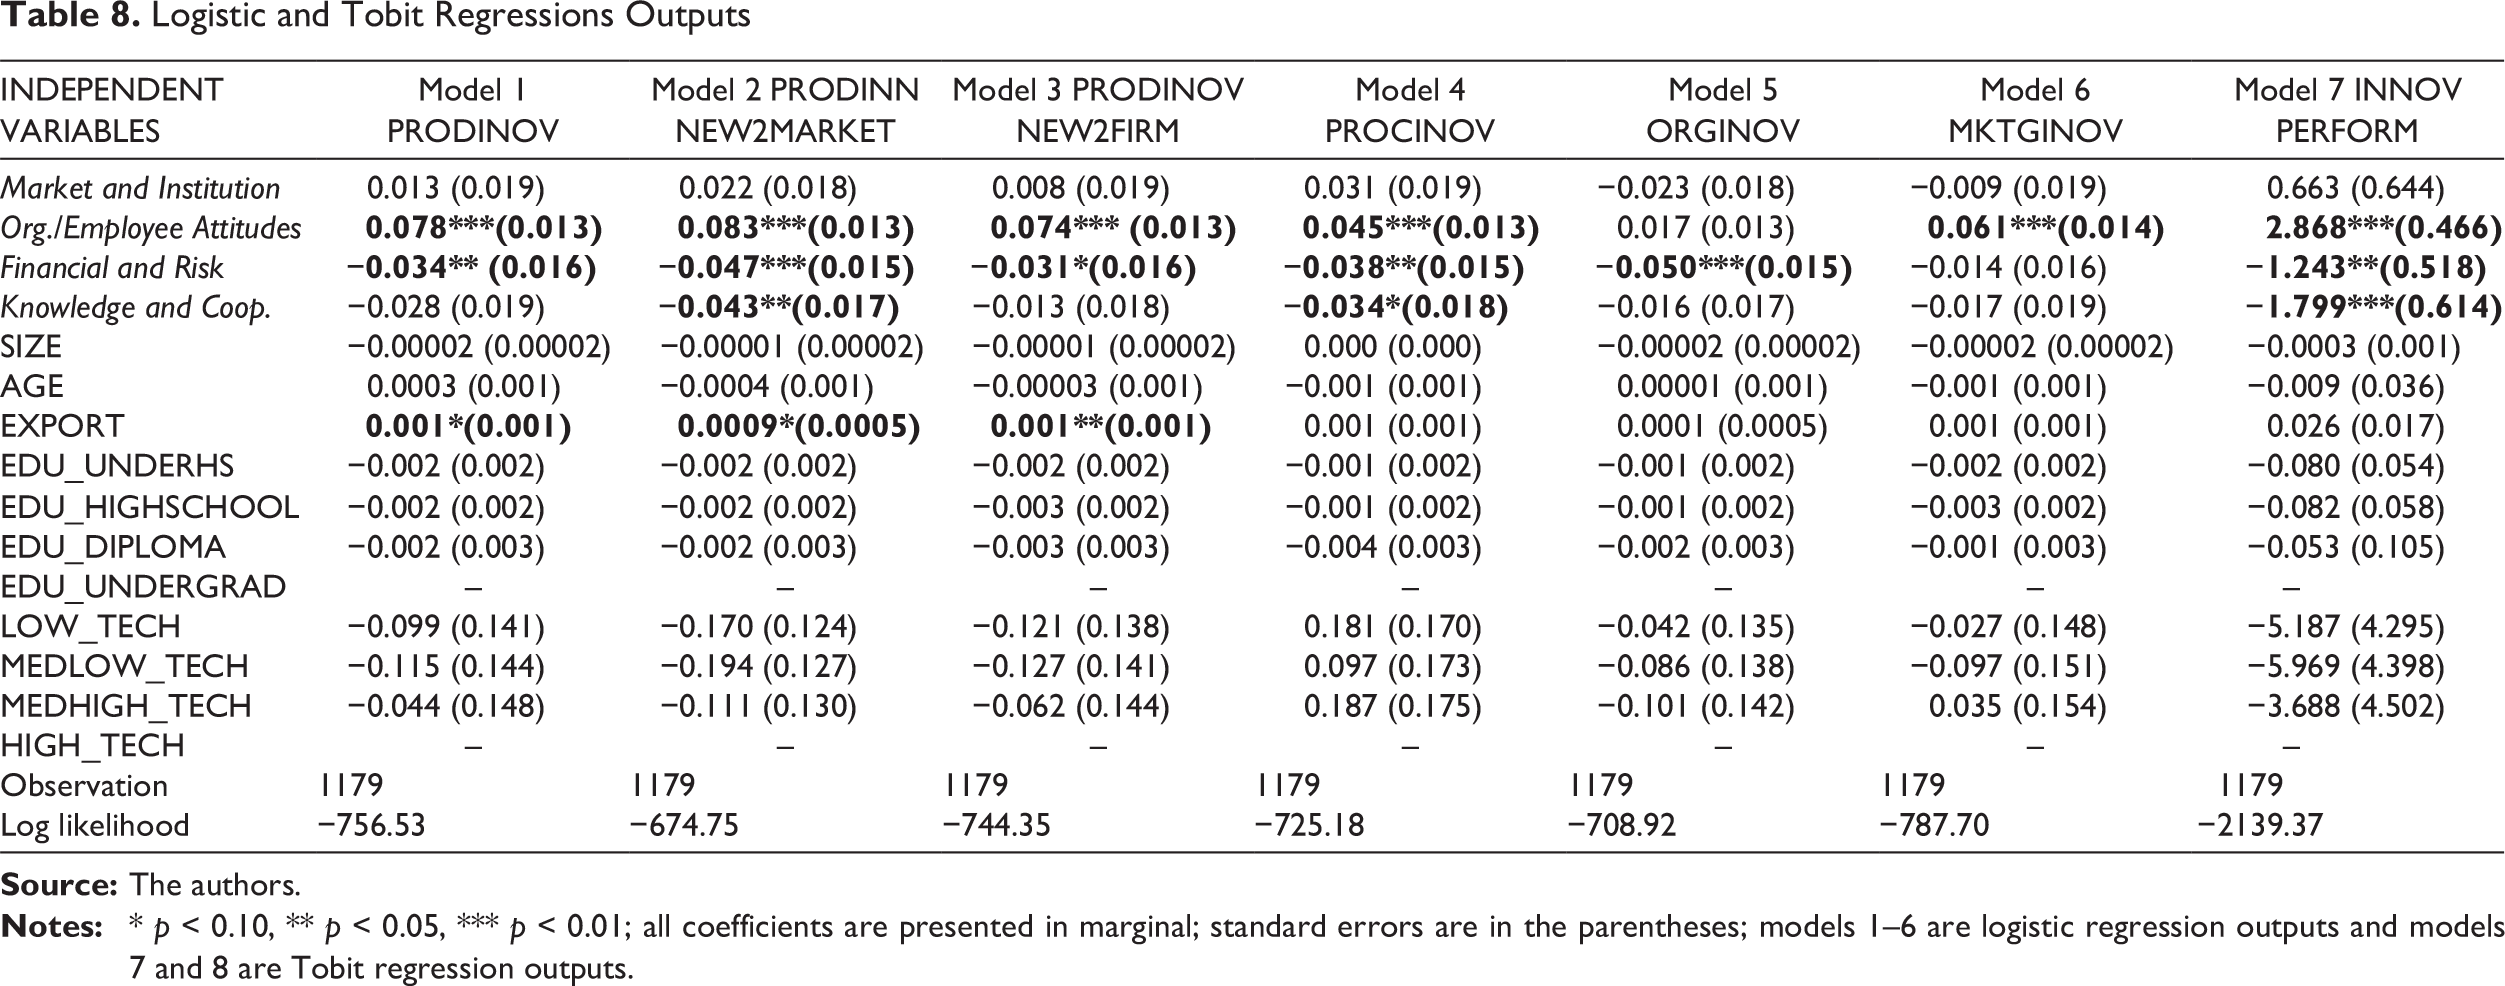
Knowledge and cooperation barriers negatively and significantly impact product innovation new to the market and process innovation. These negative associations may indicate the existence of deterred barriers (refer to D’Este et al., 2012 for review). In this case, Indonesian firms are more likely not to perform product innovation that is new to the market or process innovation if they face knowledge and cooperation-related barriers. Based on this finding, it can be concluded that different innovation barriers affect innovation differently. This supports the previous studies conducted by Madrid-Guijarro et al. (2009) and Silva et al. (2008).
Tobit Regression
Model 7 in Table 8 presents tobit regression results for the relationship between the four groups of innovation barriers and innovation performance. In line with the relationship between innovation barriers and innovation, revealed and deterred barriers also exist in the relationship between innovation barriers and innovation performance. Barriers related to employee and organization attitudes towards change have significant and positive influence on innovation performance. This may indicate that after Indonesian firms perform innovation, they face such barriers but this does not prevent them from becoming more innovative firms.
On the contrary, financial and risk barriers and knowledge and cooperation barriers are negatively associated with innovation performance. Both groups of barriers negatively and significantly influence innovation performance. This may indicate that after the Indonesian firms perform innovation, the two groups of barriers play a greater role in preventing the firms from becoming more innovative firms.
Only in firms that are exporters there is a positive association between firm resources and both innovation and innovation performance. This may indicate that exporters are also innovators. In contrast, the rest of the firm resources are more likely to be negatively correlated to innovation and innovation performance.
Conclusion and Implications
This study aims to investigate the importance of innovation barriers perceived by Indonesian manufacturing firms; the nature of innovation barriers faced by Indonesian manufacturing firms; and the impact of these barriers on innovation and innovation performance using innovation data from the IIS 2011. To date, there are no existing studies that empirically investigate innovation barriers in Indonesian manufacturing firms using innovation survey data. Hence, this study fills this gap. This study is important because understanding the nature of barriers to innovation supports the development and promotion of policies to overcome the barriers.
The first major finding from this study is the perception of innovation barriers among innovative and non-innovative firms. It is expected that innovative and non-innovative firms perceive innovation barriers differently. This study shows that of 18 innovation barriers, only four constraints are significantly perceived differently by innovative and non-innovative firms. Surprisingly, non-innovators only perceive an innovation barrier, namely lack of information on technology, as being more important than do innovators. A lack of adequate resources and capabilities possession may drive non-innovative firms that are not able to meet the technological challenges.
While the innovators perceive three barriers related to employee and organization attitude such as staff resistance towards change, manager resistance towards change and organization rigidity to be more important than do non-innovators. In this case, such attitudes may be related to a syndrome so-called ‘not invented here’. This finding is in line with previous innovation barrier studies that find a positive association between firms’ perceptions of obstacles and their propensity for innovation (Iammarino et al., 2009). Other studies (Baldwin & Lin, 2002; Galia & Legros, 2004) also find that innovative firms report more frequent obstacles to innovation.
The literature shows that employee resistance against innovation is not necessarily related to the firms and it relies on innovation characteristics and institutional rules (Zwick, 2002). For example, if the objective of innovations introduced to increase the employees’ performance and not the quality of the products and services, then firms will encounter higher internal resistance (Zwick, 2002). Relevant programmes that can be implemented by firms to overcome barriers related to employee and organizational attitude barriers include regular training, workshops and seminars to increase the level of employees’ understanding of change and innovation. Furthermore, Zwick (2002) suggests that employment guarantees and bonus payment before the innovation implemented successfully can be implemented to reduce internal resistance.
The second main finding of this study is that naturally innovation barriers faced by Indonesian manufacturing firms can be grouped into: market and institution; employee and organization attitude; financial and risk; and knowledge and cooperation. These groups of barriers are slightly different compared to factor analysis results from previous innovation barrier studies. For example, four factors emerged from Hadjimanolis’ (1999) study such as government market regulation policies; problems with inputs (especially physical ones, labour and finance); access to technology providers; and government’s environment, labour and consumer protection policies, while three factors such as external environment, human resources and risk found in Madrid-Guijarro’s et al. (2009) study.
The next major finding is that the four groups of innovation barriers influence innovation and innovation performance differently. Market and institution barriers have no significant impact on innovation and innovation performance, while employee and organizational barriers significantly and positively affect all types of innovation, except organizational innovation, as well as innovation performance. A positive and significant association between employee and organizational barriers and innovation and innovation performance may be caused by a phenomenon known as revealed barriers. In this case, the barriers provide learning opportunities and experience when the firms engage in innovation activities, but the barriers do not prevent the firms from innovating because they can overcome the barriers. Previous scholars suggest that obstacles to innovation in innovation surveys, or CIS data, should not be interpreted as preventing innovation, but rather as an indicator of how successful firms are at overcoming them (Baldwin & Lin, 2002; Tourigny & Le, 2004). According to Iammarino Piva, Vivarelli, and Tunzelmann (2012), policies to address this issue should be directed at the micro-level and be related to better management of innovation activity in order to minimize the impact of innovation barriers.
The last two barrier groups are more likely to have negative impacts on innovation and innovation performance. Financial and risk barriers significantly and negatively influence all adopted innovation, except marketing innovation, and innovation performance. The logic behind this finding may be implementation of traditional or technological innovation such as product (including product innovation new to the market and firms) and process innovation requires higher financial investment than adoption of wider or non-technological innovation such as marketing innovation. This supports the finding that reveals barriers related to financial and risk factors are the most important among other innovation barriers in the context of firms in developed and developing economies.
Knowledge and cooperation barriers negatively and significantly affect product innovation new to the market (radical innovation), process innovation and innovation performance. The reason may be the higher level of innovation novelty produced by the firms, the better level of required knowledge and cooperation.
The negative association between the last two groups of barriers and innovation may indicate the existence of deterred barriers, which tend to prevent firms from innovating. Government involvement to support programmes such as R&D credit and tax incentives may be useful in overcoming barriers related to financial and risk factors. In addition, a linkage between firms and financial intermediaries, such as banks and venture capital financing, can also be created by government to support innovation activities. At the firm level, any programmes to enhance employees’ skills and knowledge may be effective in overcoming barriers related to knowledge and cooperation. For example, implementation of organizational learning and knowledge management is essential for innovation (Dasgupta & Gupta, 2009). Furthermore, an emerging open innovation strategy can also be adopted to overcome knowledge and cooperation barriers.
This study extends previous studies that identify differences in perceptions of innovation barriers between innovative and non-innovative firms. The study also adds to the knowledge of the nature of innovation barriers and the impact of innovation barriers on innovation and innovation performance in the context a developing country, Indonesia. In general, the findings support previous innovation barrier studies in the contexts of both developed and developing countries.
Finally, the limitations of this study need to be acknowledged. First, this research is a cross-sectional study that portrays innovation barriers in one period of investigation. Future studies should address this limitation by using panel data from innovation surveys from which the changes and dynamics of innovation barriers can be detected. Second, the data derived from the IIS 2011 only cover Indonesian manufacturing firms. Future studies should include innovation data from both manufacturing and service firms. Third, the impact of industry sectors on innovation barriers is absent in this study. Future studies should address this issue because different industry sectors may perceive innovation barriers differently.
Declaration of Conflicting Interests
The authors declared no potential conflicts of interest with respect to the research, authorship and/or publication of this article.
Funding
We acknowledge financial support for the research from Indonesia Endowment Fund for Education (LPDP).
Footnotes
Acknowledgements
The authors acknowledge innovation data used in the study received from Centre for Science & Technology Development Studies (PAPPIPTEK), Indonesian Institute of Sciences (LIPI). The authors are grateful to the anonymous referees of the journal for their extremely useful suggestions to improve the quality of the article. Usual disclaimers apply.