
Abstract
This article, using weekly data for the period 2002 through 2013, investigates the presence of both contrarian and momentum profits and their sources in the Bangladesh stock market. It follows the methodology of Lo and MacKinlay (Review of Financial Studies, 1990, 3(2), 175–205) to form portfolios with a weighted relative strength scheme (WRSS). The methodology of Jegadeesh and Titman (Review of Financial Studies, 1995, 8(4), 973–993) is used to decompose the contrarian/momentum profits into three elements: compensation for cross-sectional risk, lead–lag effect in time series with respect to the common factor and the time-series pattern of stock returns. Results provide the evidence of significant contrarian profits for the holding period of one through eight weeks. There is a stronger presence of contrarian profits during 2002–2008 sub-period. The time-series pattern is found to be the main source of contrarian profits, suggesting that idiosyncratic (firm-specific) information is the main contributor to contrarian profits. Interestingly, the influence of idiosyncratic information on such profits has gradually decreased since 2008. Contrarian profits are robust to market sentiment and other systematic risk factors.
Keywords
Introduction
Research in the 1980s (e.g., DeBondt & Thaler, 1985, 1987; French, 1980; Keim, 1983; Lo & MacKinlay, 1988) indicates that stock returns are predicable to some extent. During the 1980s and 1990s, academicians have also confirmed the existence of various forms of return regularities in stock returns. Among these, the two most notable regularities are contrarian and momentum profits. Contrarian profits arise when the previous period’s best (worst) performing stocks systematically become worst (best) performing stocks in the next period. On the other hand, momentum profits arise when the previous period’s best performing stocks consistently do well in the next period. Thus, contrarian and momentum profits may arise due to the overreaction and underreaction of stock prices to new information, respectively.
DeBondt and Thaler (1985, 1987) are the first two studies to provide evidence of contrarian profits in the US market in the long-run investment horizon. Thus, investors may benefit from buying past losers and selling past winners. Jegadeesh (1990) and Chopra, Lakonishok, and Ritter (1992) also provide evidence in favour of short- and long-term contrarian profits. Jegadeesh and Titman (1993, 2001) show the presence of momentum profits in the US market in the short- and medium-term investment horizon. Some of the recent studies also document the presence of momentum profits in the developed markets (Asness, Moskowitz, & Pederson, 2013; Avramov, Chordia, Jostova, & Philipov, 2007; Fama & French, 2012; Novy-Marx, 2012). Momentum profits are so prevalent that some of the later research has focused on the possible presence of such profits in other asset classes. Moskowitz, Ooi, and Pedersen (2012) report momentum profits in other kinds of assets such as equity indexes, currency, commodities and bond futures. Asness et al. (2013) also report momentum profits in stocks as well as in other asset classes.
Daniel, Hirshleifer, and Subrahmanyam (hereafter DHS, 1998) and Hong and Stein (hereafter HS, 1999) provide the behavioural dynamics of the relationship between stock market over- and underreaction and resultant momentum and contrarian profits. HS believe that there are two types of investors—well-informed investors and technical analysts. The latter type of investors uses past stock price and volume information to take investment decisions. Since informed investors are up to date about new information, they react to new information before technical analysts do. That is, on arrival of new information, both types of investors react in the same direction, which results in stock prices to move in a sequence: underreaction to information (momentum profits) initially and overreaction (contrarian profits) later. On the other hand, DHS relate overreaction to short-term momentum and long-term contrarian profits in a different way. They assume that investors have their own information and value their stock selection skills very highly. This overconfidence leads these investors to overreact to new information, which drives the price away from the true value. As these investors are more and more successful, they become more overconfident. In the long run, investors realize the bubble in stock prices and the market makes necessary corrections. Thus, the presence of behavioural phenomenon such as overconfidence may lead to momentum profits initially and contrarian profits in longer investment horizons.
This article focuses on the presence of contrarian and momentum profits, their sources, robustness of results with regard to various market risk factors and the changes in the behaviour of the sources of such profits over the period January 2002 through August 2013. It follows the methodology of Lo and MacKinlay (1990) to form portfolios with a weighted relative strength scheme (WRSS). Then, we use the methodology of Jegadeesh and Titman (1995) to decompose the contrarian/momentum profits into three elements: compensation for cross-sectional risk, lead–lag effect with respect to the common factor and the time-series pattern of stock returns. Dhaka Stock Exchange (DSE), the largest exchange in Bangladesh, started its operations on 28 April 1954. Thus, contrary to many other frontier markets, DSE has a long history. Web-based trading was introduced on 10 June 2012. Now, it has an automated clearing and settlement system. Stock trades of category A firms (i.e., the firms with regular dividends and annual general meeting) are settled on a T+2 basis. As of 30 December 2014, the market capitalization stood at US$42.33 billion. On average, the daily volume of trade in 2014 was approximately US$61 million. The market experienced a severe crash in December 2010. More than 50 per cent of the peak value was lost between December 2010 and February 2012. The market capitalization to GDP ratio in 2014 was only 28 per cent mainly due to the prolonged impact on the market since the crash in 2010. Bangladesh has been experiencing a growth rate of more than 6 per cent in the last 5 years, which indicates a bright future of the economy as well as the market.
Predictable behaviour is an ominous sign for a frontier market such as Bangladesh because these markets are dominated by less informed retail investors. Since institutional investors are able to exploit any profit opportunity first, retail investors—who comprise about 90 per cent of this market—ultimately lose. Hence, momentum or contrarian phenomenon may result in a significant dent in the wealth and confidence of small investors as well as that of the whole market. Obviously, in order to ensure the proper functioning of the stock market—one of the most effective channels of investment in a modern-day economy—small investors’ interests must be protected. If not so, the market will simply fail to develop over time, resulting in an ultimate serious setback in investment and production of the economy.
Although there is a huge literature on the presence of contrarian and momentum profits in the developed markets, academicians have largely ignored frontier and emerging markets in this regard. Since the early 1990s, academicians have focused on frontier markets although they are basically interested in the issues related to efficiency, return predictability, volatility, market integration and diversification benefits. Encouragingly, research on the behavioural explanation of market inefficiencies in the context of emerging and frontier markets started in the last decade. In recent years, many papers (mentioned in literature review) have also investigated the sources of contrarian and momentum returns in emerging and frontier markets. There are only few studies such as Chowdhury, Hassan, and Kabir (2007) and Hossan and Park (2013) that have used trade-based strategies to investigate the presence of momentum and contrarian profits in the Bangladesh stock market. Chowdhury, Hassan, and Kabir (2007) report return reversals—that is, overreactions—in stock prices in short investment horizon. They do not attempt to find the sources for contrarian/momentum profits.
Hossan and Park (2013) investigate the presence and sources of momentum profits in the Bangladesh stock market. However, their findings suffer from some serious limitations: (a) they do not consider firm sizes, but large and small cannot be treated alike and (b) they do not use SMB (small minus big) and sentiment proxy in order to check the robustness of the findings. Chowdhury, Rahman, and Sharmin (2014) show that in Bangladesh stock market, sentiment influences stock returns and thus sentiment should be incorporated in asset pricing models. Bangladesh market is believed to be dominated by retail investors who are more susceptible to sentiment and findings of these two studies could be different if sentiment is considered. Finally, unlike these two studies, our article focuses on very short-term horizon of 1 week up to medium-term horizon of 8 weeks. This study will really help those traders who have a very short-term investment horizon. Moreover, stronger robustness check makes findings of this study more reliable than other studies on Bangladesh.
Since there are only few studies on momentum and contrarian profits in the Bangladesh market and these profits are present elsewhere in the world, we need to investigate these two profits in more depth. Definitely institutional investors in general and foreign investors in particular need to know more about these return regularities. Even if these profits are found, these may not exist after introducing market-relevant risk factors. The profits can be related to the factors such as the state of market, credit ratings, industry affiliation and even own past return history (time-series momentum). Our study is just a step forward in this direction. Apart from testing for the presence of contrarian and momentum profits and robustness of their presence, this article attempts to find another important aspect the profits—the source of such profits. Sources of such profits would definitely help the regulators and policymakers to pinpoint out on how to improve the overall efficiency of the market. The presence of contrarian and momentum profits should motivate the arbitrageurs to utilize the opportunity, which would make the market efficient over time. A detailed study can also help interested foreign investors to make investment strategies in this regard. Other foreign investors may be conservative. For example, if a less informed, conservative foreign investor knows that there are contrarian profits for small size firms and large firms are free from such profits, it might just avoid small firms and invest in more transparent large firms.
The rest of the article is structured as follows. We provide a brief survey of the relevant literature in the second section. The third section discusses data and methodology used in the study. The fourth section analyses the results. The fifth section concludes the article.
Review of Literature
In their seminal paper, DeBondt and Thaler (1985) report that past winners (losers) ultimately turn into losers (winners) in the long investment horizons. This finding creates a huge enthusiasm for the academicians to do similar or related studies. DeBondt and Thaler (1987), Jegadeesh (1990), Chopra et al. (1992) and Jones (1993) also report the presence of contrarian profits in stock returns. Academicians became interested in the late 1990s to know the reasons for such return regularities. Jegadeesh and Titman (1995) argue that contrarian profits occur due to overreaction to firm-specific information. Thus, they look for the behavioural explanation for contrarian profits. On the other hand, results of Boudoukh, Richardson, and Whitelaw (1994) and Conrad, Gultekin, and Kaul (1997) show that microstructure is the main cause of observed contrarian returns. Wongchoti and Pyun (2005) verify if all the relevant risk is accounted for and still report the presence of risk-adjusted contrarian profits.
After the discovery of contrarian returns in the long-term investment horizon, many financial economists also focus on short-run investment outcomes. Jegadeesh and Titman (1993) first show the presence of momentum profits in the US market in the short term. Many other papers also give evidence of momentum returns in the short- and medium-term investment horizon and these papers mainly focus on the reasons for such return regularity. Later research shows that momentum profits are related to the state of the market, size of firms, industry, investor behaviour, analyst attention, credit ratings, volume of trade and the volatility of growth.
Conrad and Kaul (1998) claim that the cross-sectional variation in the mean returns of individual securities included in trading strategies plays an important role in their momentum profitability in the short run. Moskowitz and Grinblatt (1999) suggest that momentum in industry momentum explains observed momentum profits and if industry momentum is controlled for, overall momentum profit is significantly less. On the other hand, if portfolio is constructed based on industry momentum, overall momentum profit is much higher even after relevant risk factors are considered.
Since size is an important risk factor, some studies attempt to address momentum profits with respect to firm size. Holding size effect as fixed, Hong, Lim, and Stein (2000) find that firms with low analyst attention are more susceptible to momentum phenomena. Avramov et al. (2007) show a strong relationship between momentum and credit rating. They detect significantly large momentum profits for low-credit rated firms, but not for high-credit rated ones. Fama and French (2012) report that except for Japan, there are momentum profits in the North America, Europe, Japan and Asia Pacific markets and spreads in average momentum profits decrease from smaller to bigger stocks. Novy-Marx (2012) finds that strategies based on intermediate horizon past performance (7 to 12 months prior to portfolio formation) produce momentum profits for the largest, most liquid stocks. Using both simulated and real data, Sagi and Seasholes (2007) attempt to link observable firm attributes to momentum profits and find that momentum strategies that consider firm with high revenue growth volatility, low costs and valuable growth options significantly outperform traditional momentum strategies.
More recently, some papers attempt to relate momentum profits to behavioural and cultural issues of investors. For example, Chui, Titman, and Wei (2010) argue that momentum can be explained by individualism and cultural or psychological factors. Daniel et al. (1998), Cooper, Gutierrez, and Hameed (2004) and Huang (2006) focus on the relationship between momentum profits and state of the market and they attribute the presence of momentum profits only to the occurrence of ‘up’ market. On the other hand, Griffin, Ji, and Martin (2003) suggest that momentum profits exist regardless of states.
Some papers focus on the relationship between momentum profits and less known causes. Lee and Swaminathan (2000) show that past volume information helps to explain intermediate-horizon underreaction and long-horizon overreaction effects. George and Hwang (2004) report that readily available 52-week high price and the current stock price information can explain a large portion of momentum profits. They also suggest that short-term momentum and long-term reversals are not related phenomena. Asness et al. (2013) consider value effect and momentum jointly and report consistent value and momentum return premia across eight diverse markets and asset classes.
Momentum studies primarily rely on the relative performance of the stocks in the cross section, whereas time-series momentum is a timing strategy using each asset’s own past returns. Most of the contrarian and momentum studies available in the literature are cross sectional. The benefit of time-series momentum strategy is its easy applicability for different asset types. Moskowitz et al. (2012) document significant time-series momentum in equity indexes, currency, commodity and bond futures. They also report that momentum profits persist for short- and medium-term horizons of 1 to 12 months and it partially reverses over longer horizons.
Many papers have focused on the presence and sources of momentum and contrarian profits in international markets. Rouwenhorst (1998) finds that momentum profits are present in all 12 sample countries with an average duration of about 1 year and return continuation is negatively related to firm size. He also claims that exposure to common factors is the main reason for the correlation found between international momentum returns and those of the USA. Using data of 22 mature and 18 emerging markets, Naranjo and Porter (2007) confirm the presence of momentum profits in both types of markets. McInish, Ding, Pyun, and Wongchoti (2008) show that reversal of stock prices happens for all the Pacific-Basin markets except Taiwan and Korea.
Since Bangladesh is a frontier market, the focus needs to be shifted on the findings of momentum and contrarian profits in emerging and frontier stock markets. Two largest emerging stock markets in the world today are China and India and thus academicians’ first attempt is to detect contrarian and momentum profits in these two markets. The evidence generally supports the presence of contrarian profits in the Chinese markets. Kang, Liu, and Ni (2002) find short-term contrarian and medium-term momentum profits for the Chinese stock market. They also report that negative serial correlation contributes to momentum profits. Li, Qiu, and Wu (2010) find contrarian profits in Chinese stock market of approximately 12 per cent per annum in the short horizon of 1 to 3 months. Xu and Qiu (2012) also report short- and medium-term contrarian profits of up to 2.2 per cent per month in the Chinese stock market and main source of such profits is the lead–lag effect. Some studies focus on other prominent emerging and frontier markets. Hameed and Ting (2000) examine the effect of trading volume on contrarian profits in Malaysian market and find that contrarian profits are higher for actively traded firms than for thinly traded firms. In a similar study, Ding, McInish, and Wongchoti (2008) show that high-volume firms are more likely to experience price reversals than low-volume ones in the Asia-Pacific markets. Cakici, Fabozzi, and Tan (2013) in a study of 18 emerging stock markets report the presence of momentum profits in all but four Eastern European countries.
Since Bangladesh is one of the markets in the South Asia, it is relevant to focus on the findings of other prominent stock markets in this region. Several studies have focused on the momentum and contrarian effects in the Indian stock returns. Shegal and Balakrishnan (2002) and Balakrishnan (2012) report strong presence of short-term momentum and long-term return reversal in Indian market. Ansari and Khan (2012) and Shegal and Jain (2011) find a strong presence of momentum profit in the Indian stock market in the investment horizon of 3 and 6 months, respectively. However, Locke and Gupta (2009) and Chowdhury (2010) report the presence of contrarian profits in short-term investment horizon and the influence of size to explain such profits. Garg and Varshney (2015) provide evidence that momentum profits are robust in the prominent sectors of the Indian stock market over the period of 2000–2013. In a very recent paper, Jana (2016) shows that sentiment—which is a behavioural phenomenon like momentum—has a causal relationship with the returns of Sensex (an index of 30 large Indian companies listed in the Bombay Stock Exchange). However, sentiment cannot explain the returns of S&P CNX Nifty (an index of 50 large Indian companies listed in the National Stock Exchange). Narayan, Ahmed, Sharma, and Prabheesh (2014) use sectorial momentum trading strategies based on past moving averages and show that such strategies may produce risk-adjusted positive returns. They argue that such profits occur due to the gradual diffusion of information from the market to the sectors.
There are relatively fewer studies on momentum in other South Asian stock markets. Pathirawasam and Kral (2011) cover the period 1995–2008 to examine the presence of 3- and 6-month holding period momentum and report the presence of momentum profits in Colombo Stock Exchange. As far as Pakistan stock market is concerned, investors can earn profits in Karachi Stock Exchange (KSE) by holding a zero-investment momentum portfolio (Rahman & Mohsin, 2012; Shah & Shah, 2015). Ejaz and Polak (2014) suggest the presence of profitable momentum opportunities in the KSE even in shorter horizon of 3 weeks.
Thus, findings on emerging and frontier markets provide the evidence of the presence of contrarian profits in short- and medium-term investments in general. On the other hand, in developed markets, we have already observed the evidence of momentum profits in the short- and medium-term and contrarian in the long-term investment horizon. Such a difference in findings between developed and emerging may be related to the differences in market characteristics and fundamentals. Emerging markets are different from mature markets in terms of liquidity, corporate governance, quality of analysts, participation of institutional investors, role of media and so on. Morck, Yeung, and Yu (2000) add political influence and private property rights as two big issues that make stocks in respective emerging markets to move more in the same directions than in developed markets.
Even though Bangladesh belongs to the South Asian region, it does not mean that the findings of these markets in the region can easily be applied to Bangladesh market. Specially, Indian market is clearly different from other markets in the region as it is much more advanced than other markets in terms of history, sophistication, depth, global investor interest and institutional participation. Almost all the related studies have been done on the Indian stock market. On the other hand, there are a handful of studies on other markets in the region. Thus, we cannot really take it for granted that the findings will be similar for Bangladesh. Most importantly, the exact relationship between the momentum profits and investment horizons and the magnitude are expected to differ from market to market in the region. For example, just knowing the presence of momentum in Bangladesh may not tell us the true story unless we know the magnitude of such relationship. Despite all these facts, we consider the very short-term strategy, whereas other papers consider longer term strategies such as 3 months and above. That is, we still need to explore the dynamics of very short-term investment strategies.
In the backdrop of overwhelming evidence of momentum and contrarian profits in mature, emerging and frontier stock markets, this article is going to answer the following five research questions:
Are there any contrarian and momentum profits in the Bangladesh stock market? Are the contrarian and momentum profits still present after market risk factors are introduced in the model? What are the sources of such profits? How does firm size affect contrarian and momentum profits? How does the market learn over time?
In line with the extant evidence in emerging and frontier markets, we expect that there are contrarian profits in the Bangladesh stock market. Previous studies show that the firm returns are not strongly related to market risk factors such as beta. Thus, market risk factors may not be able to explain contrarian and momentum profits, if any. As far as the source is concerned, firm-specific information should be the main source of profits due to the absence of strong disclosure framework and corporate governance. The fourth research question is related to the size of firms. It can be hypothesized that large firms are more transparent, and if it is true, we should detect more contrarian/momentum profits for small- and medium-size firms. Finally, market efficiency is a continuous process and a frontier market cannot become efficient overnight. It is reasonable to expect that the Bangladesh has been becoming more efficient over the period of study.
Data and Methodology
Data
Weekly individual stock price index and market capitalization data on DSE are collected from Thomson Datastream. Since the interest in a frontier market such as Bangladesh is a relatively recent phenomenon, early data are kind of messy with many missing values. Data cleaning is obviously a big issue and we drop some firms from the raw dataset provided by Datastream. We pick only those stocks that have been relatively regularly traded and have survived for the whole study period. 1 After screening the data, we have the final dataset of 178 firms to use for the study. This article considers the period from January 2002 through August 2013. For size-related analysis, we use only 137 firms because more actively traded firms are required (especially for small firms). We calculate stock returns by taking natural log of (this week’s stock return index/last week’s stock return index) and then multiplying it by 100.
Methodology
Construction of Portfolios
The first thing to be done is the formation of riskless (zero total weight) portfolios. We use the WRSS of Lo and MacKinlay (1990) for this purpose. We construct portfolios based on the performance in the predetermined number of past months. Then, we track the portfolio performance for the same number of months. That is, if formation period is 2 weeks, then the holding period is also 2 weeks and so on. There are five trading strategies with formation and holding period of 1, 2, 4, 6 and 8 weeks. We need to find the stocks that did better and worse than the market return (i.e., average return). This portfolio construction strategy suggests that the stocks with positive (negative) return over the formation period are bought (sold). The stocks with better performances are termed ‘winners’, whereas the stocks with worse performance are termed ‘losers’. The weight of a stock in the portfolio depends on the magnitude of performance during the formation period. For example, a stock with larger positive (negative) return than the market has bigger positive (negative) weight. Every stock maintains the same given weight during the tracking period. During each study period, each stock in the portfolio is assigned with the weight of

where ri,t–1 is the return of stock i at time t − 1, N is the number of stocks at period t − 1 and

We create the portfolios considering the performance of the past j weeks where j = 1, 2, 4, 6 and 8 weeks. In the finance literature, it is termed as formation or ranking period. The performance of the portfolio is evaluated during the next 1, 2, 4, 6 and 8 weeks. This duration is called the evaluation or holding or tracking period. Thus, there are five trading strategies ( j = 1, k = 1; j = 2, k = 2; j = 4, k = 4; j = 6, k = 6; and j = 8, k = 8) that involve short- to medium-term trading horizons. Once the portfolio is made, the cumulative return for every holding period is calculated. Every portfolio’s ( j = 1, k = 1; j = 2, k = 2; …) momentum/contrarian profit during the evaluation period is given by

where J = L (loser portfolio), W (winner portfolio), C (contrarian portfolio), wi,t is the weight of respective stocks in the portfolio and Nj is the number of stocks in the portfolio during the ranking (formation) period. The weight of individual stocks does not change during the evaluation (holding) period.
Systematic Risk and Contrarian and Momentum Profits
The WRSS, winner and loser portfolio return may change because of change of risk over time. Thus, for the robustness check of results, we consider a model somewhat close to Fama–French three factor model. We cannot use book-to-market value-based risk factor (HML in Fama–French terminology) because of unavailability of reliable data. Moreover, in a very recent study, Fama and French (2014) show in a model of five factors that HML is the most redundant factor to explain the average US returns for 1963–2013. Since market capitalization and return data are reliable and available, SMB and market return are used for the robustness check of momentum and contrarian profits. In a recent study, Chowdhury et al. (2014) report the importance of sentiment factors in asset pricing models for Bangladesh. Thus, TRIN ratio, also known as Arms Index, is used as a proxy for market sentiment. For robustness check for contrarian/momentum profit, we estimate the following model:

where πJ,t is weekly WRSS, winner and loser portfolio returns.
Decomposition of contrarian/momentum profits
The decomposition of momentum and contrarian profits given by Jegadeesh and Titman (1995) is as follows:


where πm and πc are momentum and contrarian profit, respectively, and
Jegadeesh and Titman (1995) develop the following framework to find the sources of momentum and contrarian profits. They estimate

where ri,t is the return of individual stock i at time t; ft is the market return (equally weighted) at time t, which happens to be the common factor for all the stocks; ft–k is the market return (equally weighted) during t−k period; k is the observation period; and b0,i and b1,i are the estimated parameters. From this factor model, we can estimate the following components of contrarian/momentum profits.
Cross-sectional risk component:

Lead–lag effect component:

Time-series pattern component:

where μi is the intercept of the regression for an individual stock; b0,i and
Equations (7)–(9), together with Equations (5a) and (5b), provide us with three components of contrarian/momentum phenomenon: (a) profits related to the cross-sectional variance of expected returns, (b) profits related to the time difference in reacting to a common factor and (c) profits related to the stock price adjustment to idiosyncratic (firm-specific) information, respectively.
This study uses combination of two techniques widely available in literature. However, there are other methods to detect the presence of contrarian and momentum profits. One of the methods uses market-adjusted cumulative income for certain duration to choose winner and loser portfolios. Then, cumulative abnormal returns (CARs) of these portfolios for desired length of tracking period are estimated. Our technique is much better in the sense that the WRSS portfolio weight is zero by construction and as such risk is also zero and hence any significant portfolio return is considered to be contrarian and momentum effects. The CAR is a powerful technique when an event can be identified and returns before and after the event need to be compared. Clearly, we do not have any distinctly identified event in our case and as such our technique is better. Finally, the time-series momentum strategy is another technique where an asset’s own past returns are used for making momentum profits. This technique can be used to detect such profits for any asset classes. We focus on only one type of asset—stocks. Hence, this strategy is not appropriate for this study. Since this study is one of the few on Bangladesh market and the cross-sectional technique is the most popular one, we choose to herd. As a significant contribution to the cross-sectional technique, we have finally added time-series momentum profits to our model in order to confirm if cross-sectional momentum profits still exist after own past (time-series) momentum profits have been accounted for.
Analysis
Descriptive Statistics of Bangladesh Stock Market Returns
Table 1 exhibits the descriptive statistics of equal-weighted returns of Bangladeshi stocks during the periods 2002–2013, 2002–2008 and 2009–2013. Mean and median returns across these three periods are similar. As suggested by standard deviation, market was more volatile during 2009–2013 than during 2002–2008. 2 This is also supported by the larger range of returns during the period 2009–2013. This is also the period when the market reached the top and subsequently crashed.
Descriptive Statistics of Weekly Returns

Presence of Contrarian/Momentum Profits
Table 2 presents the returns from WRSS portfolios for 1–1, 2–2, 4–4, 6–6 and 8–8 trading strategies. Loser portfolio continues to produce significantly negative returns for all strategies. Since individual stocks in a loser portfolio have negative weight by construction and portfolio returns are negative in sign in all the investment horizons, this phenomenon is a strong indication of contrarian profits. This finding can be discussed in more detail. If a stock has negative weight based on formation period returns and produces negative return again in holding period, then its contribution to the portfolio return should be positive. If the weight is negative but return in holding period is positive, then its contribution to the portfolio is negative. Thus, significant loser portfolio return is an indication of contrarian profits. For winner portfolios, there are no significant returns in short investment horizon of up to 4 weeks. For relatively longer investment horizons of 6 and 8 weeks, there is evidence of momentum profits. That is, past winner stocks continue to do better. However, the winner and loser portfolio returns could be related to market risk factors since these are not zero-weight portfolios.
Portfolio Returns for Short- and Medium-term Trading Strategies
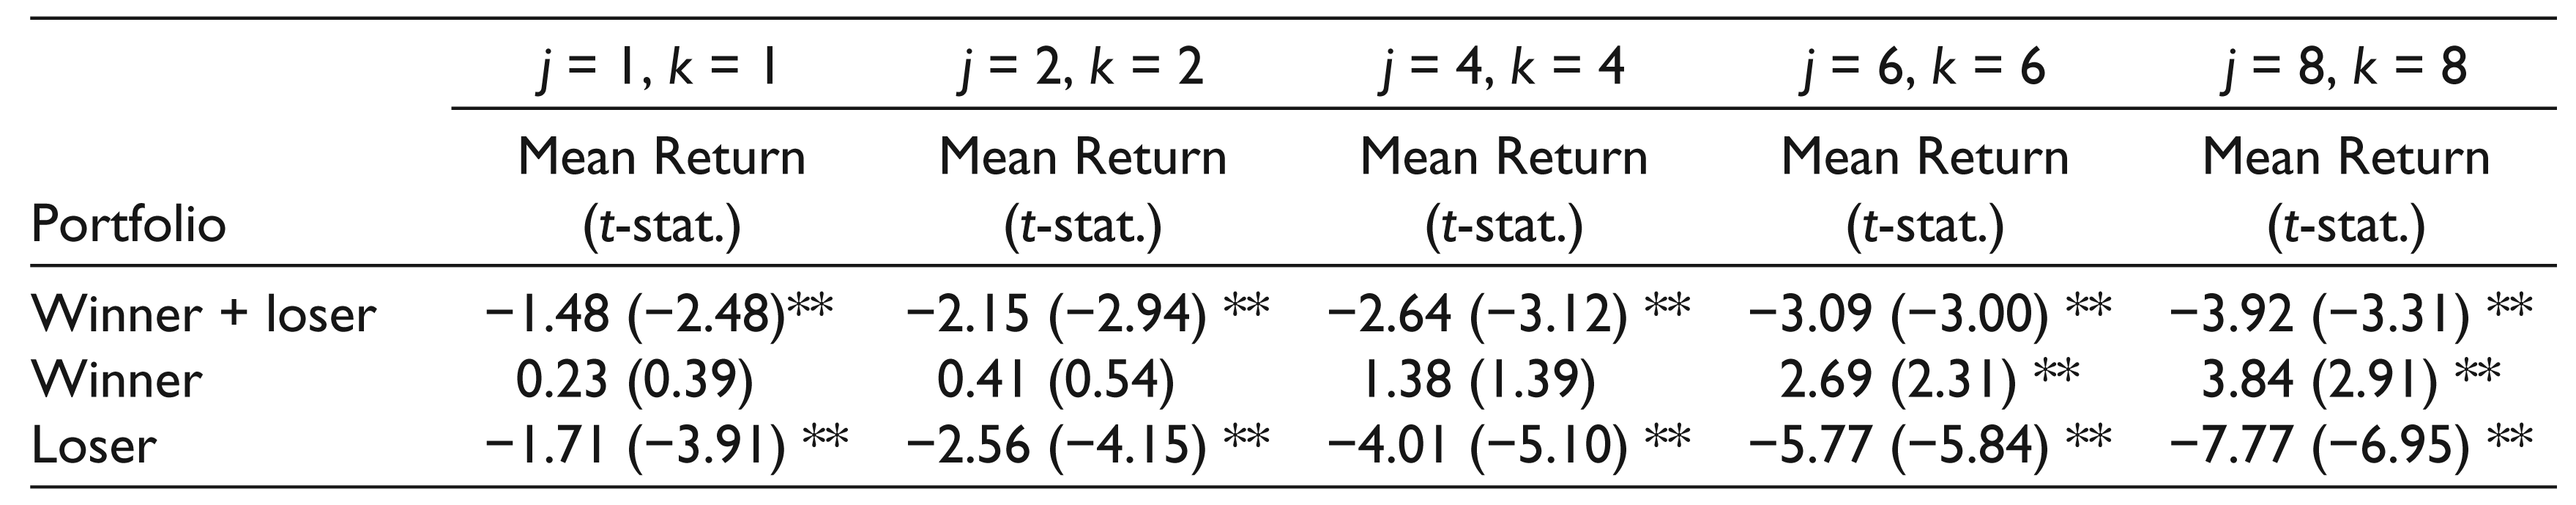
On the other hand, a WRSS portfolio has the weight of zero by construction and is supposed to produce no such profits. But, all the strategies used in the study show significantly negative profits for the WRSS portfolio, suggesting the presence of contrarian profits in the market. From the trading point of view, an investor needs to sell (short) the losing portfolio and buy the winner portfolio to reverse overall loss to profit. In case of a weekly strategy, an investor can make an average profit of 1.48 per cent per week. The presence of contrarian profits may be related to the tendency of the investors to overreact to information. Since uninformed retail traders, the dominant type of investors in this market, tend to trade based on rumours and sentiment and possibly have the tendency to herd, their trade behaviour is not stable. This creates waves in stock prices, resulting in contrarian profits. The presence of contrarian profits is also supported by the finding of Chowdhury et al. (2007) for the Bangladesh market, Locke and Gupta (2009) and Chowdhury (2010) for the Indian market and Kang et al. (2002) and Li et al. (2010) for the Chinese market.
On the other hand, our finding of contrarian profits goes against Ansari and Khan (2012), Balakrishnan (2012) and Shegal and Jain (2011) who find momentum profits in the short- and medium-term investment horizons. Findings for Sri Lanka and Pakistan also show the presence of momentum profits (Rahman & Mohsin, 2012; Shah & Shah, 2015). It is noteworthy that we have used weekly data, whereas other studies have used monthly returns data. However, Jegadeesh and Titman (1995) report over- reaction in the US market and lead–lag effect to be the main reason for this. To put the phenomenon in a different way, less informed, less sophisticated retail traders in the Bangladesh market systematically overreact to information in the current period and go for subsequent correction in the later period. Our findings are different from most of the findings on developed markets, where momentum profits have been reported in the short- and medium-term investment horizon (refer, e.g., Conrad & Kaul, 1993; Grinblatt, 1999; Jegadeesh & Titman, 1993).
In Table 3, we divide the whole study period into two sub-periods—2002–2008 and 2009–2013. 3 For the first sub-period, results are very similar to that reported in Table 2. Significant presence of contrarian profits is evident in all the five strategies. Also, the winner portfolio tends to produce no profits up to 6-week holding period. The magnitude of WRSS portfolio returns is very high, which we have also observed in Table 2. In a 1-week strategy, an investor on average can make 2.50 per cent return per week. A change in the profit outcome is clearly observed for the WRSS portfolio during 2009–2013. The WRSS portfolio does not produce significant profit in 1- and 2-week strategy. Profits for 4- and 6-week strategies are weakly significant at 10 per cent level. Only 8-week strategy produces significant profit at 5 per cent level. Thus, WRSS portfolio returns are much milder for the period 2009–2013 in contrast to the period 2002–2008. However, in both periods, loser portfolio produces significant negative returns, an indication of contrarian profits. The difference of behaviour of WRSS portfolios may be related to the market crash in 2010. This will be discussed in more details later.
Portfolio Returns for Short- and Medium-term Trading Strategies for Two Sub-periods

Table 4 exhibits profits from all the five trading strategies for five distinct periods. During 2002–2003, WRSS returns are high but weakly significant at 10 per cent level. During 2004–2005 and 2006–2007, WRSS portfolios provide significant contrarian profits up to investment horizon of 4 weeks. There are no WRSS profits in 2008–2010 and 2011–2013 periods. Contrarian profits are more evident in earlier periods and this phenomenon mainly occurs in the horizon of 1 to 4 weeks. During the period from January 2011 through August 2013, none of the portfolios shows any profit. It is a big difference from the findings in the earlier periods. However, it is hard to believe that the market has suddenly become very efficient. The behaviour of these portfolios is probably linked to the fact that the market crashed in December 2010, and since then, the market has been behaving in a different way. Since the crash, market has been on a downward slide for a long period of time, which probably results in the disappearance of contrarian profits.
Portfolio Returns for Short- and Medium-term Strategies for 2-year Sub-periods

The Effect of Firm Size on Contrarian/Momentum Profits
Contrarian and momentum profits may be related to the size of firms. The behaviour of stock returns is likely to be related to firm size for a number of reasons. First, large firms are less risky and more transparent in terms of dissemination of information. Second, large firms enjoy more attention from analysts, domestic and foreign institutional investors, and large domestic retail investors. Third, large firms are more liquid than small ones. In the wake of weak regulatory framework and financial reporting system—which may be the case for many frontier markets—investors rely more on gossips and other informal forms of information to invest in small firms. Often, based on unreliable information, the uninformed retail investors buy stocks of small firms in the hope of higher profits and ultimately suffer. Thus, it is important to investigate the presence of contrarian and momentum profits based on firm sizes. Table 5 presents contrarian and momentum profits for small-, medium- and large-size firms.
Portfolio Returns for Short- and Medium-term Trading Strategies for Size Firms

For all the strategies and firm sizes, loser portfolios produce significantly negative profits. Thus, if this return is not related to risk factors, an investor can profit from short selling the loser portfolio. Only winner portfolios for medium- and large-size firms show the tendency to provide momentum profits. The WRSS portfolio returns for small firms are clearly much larger than that for medium and large firms. The WRSS returns for large firms are the smallest among three size portfolios. This is a clear indication of distinct behaviour of large firms as against medium and small firms.
Robustness Check for the Presence of Contrarian and Momentum Profits
Since results show that contrarian profits are present in the returns of WRSS, winner and loser portfolios and these returns could be related to market risk factors, it is now required to test the robustness of the results. Robustness check involves three factors: market return, SMB and sentiment (TRIN). As mentioned earlier, due to unavailability of reliable data, HML (high minus low), the other important factor in Fama–French framework cannot be used. The results of robustness check are presented in Table 6. Only profits from 1-week strategy are checked for robustness. For 2002–2013 and 2002–2008 period, WRSS and loser portfolios still produce significant profits, after relevant risk is accounted for. As evident from very low R2, regression can hardly explain the returns of WRSS portfolios. Moreover, constants are still significantly negative. Therefore, contrarian profits do exist in the Bangladesh stock market. Winner portfolio returns are highly explained by market risk factors. Loser portfolio returns are explained by the regression, but it seems that significant returns still remain even after market risk is accounted for.
Contrarian/Momentum Profits and Market Risk Factors

Sources of Contrarian/Momentum Profits
Table 7 shows the contribution of the sources of contrarian and momentum profits for the whole period as well as for the sub-periods. This table also shows how contributions of sources of such profits change with respect to firm size. Every sub-period shows that the time-series pattern is the most important source of momentum/contrarian profits. This source is related to the error terms of Equation (6). Thus, it occurs from the mispricing due to firm-specific information. This is not an unexpected result since the Bangladesh stock market is a frontier market where reliable firm-specific information may not be available, especially for small firms. Moreover, the Bangladesh market is dominated mostly by individual investors who do not know how to process information and thus they create noise when they trade. Hossan and Park (2013) also report that the firm-specific information is the main source of momentum profits for Bangladesh stock market. Nonetheless, it is encouraging that the contribution from this source is gradually going down from −3.53 in 2002–2003 to −0.89 in 2011–2013. It indicates that market is gradually improving as investors are processing firm-specific information more accurately.
Panels B, C and D of Table 7 also provide sources of contrarian profits for small-, medium- and large-size firms. For 2002–2013, 2002–2008 and 2009–2013 periods, firm-specific information dominates as the most important source of contrarian profits. This finding matches with Jegadeesh and Titman (1995) where they find firm-specific component to be the most important source of contrarian profits. Results are also in line with the contrarian evidence provided by McInish et al. (2008) for the Asian markets. Using same methodology, they also claim that the price reversals are caused by overreaction to firm-specific information. Contrarian evidence is even stronger for small-size firms in the Bangladesh market. The impact of lead–lag relationship on small firms’ contrarian profits is also comparatively stronger. Since large firms are supposed to be informationally more efficient, small firms should adjust to new information slower than large ones, creating lead–lag effects. Last five columns of the table present the sources of momentum profits for shorter sub-periods. The dominance of firm-specific information on small firms is strong for every sub-period. More specifically, during periods 2008–2010 and 2011–2013, the effect of firm-specific information is mild on medium- and large-size firms, whereas this effect on small firms continues to be strong. Thus, small firms seem to be the main contributor of contrarian/momentum profits in the Bangladesh stock market.
Sources of Momentum/Contrarian Profits for Different Periods

Effect of Time-Series Momentum on Cross-Sectional Momentum
Time-series momentum is measured from own past and future returns, whereas cross-sectional momentum is measured from the past and future returns of cross section of stocks in the market. Thus, we can use index returns and individual firm returns to measure time-series and cross-sectional momentum profits. As shown by Moskowitz et al. (2012), these two types of momentum could be related. 4 The most important point is whether or not cross-sectional momentum (i. e., WRSS portfolio profits) exists after time-series momentum is accounted for in the momentum model. We use 4-week formation period and 1-week holding period for both types of momentum strategies. Since the presence of time-series momentum is not our main issue, we only focus on this trading strategy ( j = 4, k = 1) to investigate the contribution of time-series momentum to cross-sectional momentum profits. 5
Table 8 shows how time-series momentum is related to cross-sectional momentum/contrarian profits. The strategy of j = 4, k = 1 is used for this examination. Results in Panel A show strong and positive influence of time-series momentum on cross-sectional momentum profits. The influence of time-series momentum is particularly strong during the period 2009–2013 and 2009–2013. Significant intercept terms indicate strong presence of contrarian profits in weekly returns even after time-series momentum (in our case contrarian) has been taken into account. Panel B is similar to Panel A except for introducing other risk factors—SMB, market return and TRIN—into the model. Results in Panel A and Panel B are similar—intercept terms in all the periods are statistically significant, suggesting that additional risk factors and time-series momentum cannot explain the cross-sectional contrarian profits.
Effect of Time-series Momentum on Cross-sectional Momentum

Conclusion
This article studies the presence and sources of contrarian and momentum profits in the Bangladesh stock market for the period from January 2002 through August 2013. The WRSS of Lo and MacKinlay (1990) is used to find the presence of contrarian and momentum profits and the methodology of Jegadeesh and Titman (1995) is used to find the components of such profits. Contrarian profits are present in Bangladesh stock market in short horizon of 1 to 8 weeks. Thus, to reap the benefit from such profit opportunities, an investor has to sell (short) and buy a past loser portfolio and a winner portfolio, respectively. Short-term contrarian profits exist even after market risk factors and market sentiment are accounted for. Magnitude of contrarian profits for small- and medium-size firms is much larger than that for large firms. After the stock market crash of December 2010, this opportunity for contrarian profits has simply vanished. The continuous downward movement of stock prices ever since the crash could be the reason for this. Therefore, the latest phenomenon of the absence of momentum or contrarian profits does not mean that the market has become efficient. As far as sources are concerned, firm-specific information has been the main source of contrarian profits. When compared to small- and medium-size firms, usually large firms are less prone to contrarian profits resulting from firm-specific information. This could happen due to the dominant involvement of uninformed individual investors and their tendency for noise trading. Nonetheless, its impact on such profits has also diminished after the crash of 2010.
It has already been discussed how a trader may devise a trading strategy to take advantage of the presence of contrarian profits in the Bangladesh stock market. The findings also have other implications for academicians, policymakers and regulators. Academicians may use other techniques to detect contrarian and momentum profits. They can use data of other frequencies as well. Specially, transactions cost is an important issue. Future availability of transactions costs data may show us the true picture of the intensity of contrarian profits. Since stock market is a major engine for economic growth of an economy, policymakers are definitely concerned about the optimal functioning of this in the long run. Any form of inefficiency such as the presence of contrarian profits is a major issue. Policymakers and regulators such as SEC must work together to make sure that such profits are not the outcome of market manipulation. It is reasonable to believe that if the scope of manipulation is not there, market forces will automatically drive contrarian profit opportunities away from the market. Otherwise, detection of manipulation could be an important issue for the regulators.
This study is a significant attempt as far as the market efficiency is concerned. It is not possible to consider all the issues relevant to contrarian profits mainly due to the non-availability of required data. As more data will be available in the years to come, future studies may shed more light on such profits. For example, future studies can consider behavioural and proprietary data for their research. Even, future studies can use different methods such as time-series momentum strategies to address same or other research questions in stocks and other assets.
Declaration of Conflicting Interests
The authors declared no potential conflicts of interest with respect to the research, authorship and/or publication of this article.
Funding
The authors received no financial support for the research, authorship and/or publication of this article.
Footnotes
Acknowledgements
The authors are grateful to the anonymous referees of the journal for their extremely useful suggestions to improve the quality of the article. Usual disclaimers apply.