
Abstract
Good reputation carries a significant value for organization. Although firms make every effort to earn respect among stakeholders, it is difficult on the part of stakeholders to judge firm’s quality. Myriad signals confuse rather than assisting them in framing perceptions about a firm. Hence, market demands some conspicuous clues like firm size to assess its worthiness. Since little is known about how corporate reputation is affected by firm size, the study attempts to examine the role of firm size in building reputation of Indian companies. The dataset comprises of 403 Indian companies over 10 year time frame, that is, from 1 April 2002 to 31 March 2012. Results of panel regression reveal firm size as a crucial antecedent of corporate reputation. Significant differences are discovered in the firm size of highly reputed and low reputed firms. The study adds up to the research on determinants of corporate reputation that firm size can serve as a surrogate clue in times of information glut obscure in the market. The study offers significant repercussions for stakeholders who can make informed judgements by interpreting firm size as a signal of firm’s competencies.
Introduction
Corporate reputation has emerged as an indispensible tool for organizations to survive competition (Barney, 1991). A firm maintaining a good name in the market pockets many advantages like employee retention, customer satisfaction, lower negotiating and transactional costs and charging price premiums (Eberl & Schwaiger, 2005; Podolny, 1993; Rogerson, 1983; Schwaiger, 2004) that ultimately enhance its performance (Barney, 1991; Chahal & Kumari, 2014). Negotiating with a reputed firm inculcates a sense of confidence among stakeholders. The increased reliance on intangible assets and covert resources like corporate reputation has emerged due to some changes occurring in the economic environment. First, competition at global frontiers has inspired corporate managers to maintain a good name in the market (Dunbar & Schwalbach, 2000). Second, corporate scandals like Enron (in the USA) and Satyam (in India) have questioned reliance on financial figures and stakeholders now go beyond these financial numbers to form perception about a firm. Third, stakeholder theory posits that catering to the needs of shareholders is not sufficient and that building a good corporate reputation requires a greater base catering multiple stakeholders (Hammond & Slocum, 1996).
Despite carrying a significant value for organizational success, it is not easy for the corporate audience to assess a firm’s reputation. Multiple audiences rely on multiple clues to construe quality of the offering. Firms make every effort to portray their superiority over competitors. They send signals to build positive perceptions among corporate audience. Existence of myriad firms each signaling their own competence baffles the receptors, who often opt for surrogates like firm size and firm age to assess quality (Aharoni & Nachum, 2002). Unapprised stakeholders face difficulty in apprehending firm reputation from various complicated market and strategy signals, thereby resorting to some visible clues to make informed judgements. Myriad signals like responsible behaviour, good governance, R&D intensity, diversification, market risk, media exposure, dividend yield, ownership pattern and differentiation (Fombrun & Shanley, 1990) instead of helping, confuse the public who search for some conspicuous and easily apprehendable clues like firm size to assess worthiness of an organization.
The literature postulates two contradictory views delineating the role of firm size in building a favourable perception. Few scholars believe that large size of a firm means access to more resources which can be utilized in reputation-building activities (Fombrun & Shanley, 1990), whereas others attach public scrutiny to large visible firms (Delgado-Garcia, Quevedo-Puente, & Diez-Esteban, 2013). Majority of the research holds that large firms have capabilities to offer better quality products/services and greater growth opportunities. A growing strand of literature linking firm size to reputation exhibits size as a proxy of high quality and reputation (Aharoni & Nachum, 2002). Large firms portray characteristics that demarcate them from small firms. Easy access to resources motivates managers of large firms to indulge into corporate social responsibility (hereafter CSR) that is a prime driver of corporate reputation (Brammer & Millington, 2005; Brammer, Millington, & Pavelin, 2009; Brammer & Pavelin, 2006). Wider scale of operations imparts visibility to large firms and public becomes well cognisant with them. Stakeholders tend to perceive visible and familiar firms propitiously. Stakeholders feel more confident in dealing with such firms. Large firm size can rationally be linked to 3R’s: access to more resources, high remembrance rate and better reputation.
Firm size has widely been taken as a control variable mediating the relation between corporate reputation and financial performance (Brammer & Millington, 2005; Brammer & Pavelin, 2006; Brammer et al., 2009; Fombrun & Shanley, 1990). But research lacks examination of direct inkling between firm size and corporate reputation. The current study is a modest attempt to fill this gap in the literature. The role of firm size in framing perception among corporate audience is undertaken in a different economic setting, India, which offers a unique background for testing the significance of firm size as a signal in the reputation formation process. An emerging economy like India is idiosyncratic due to low levels of transparency, poor governance, low investor confidence, corporate failures and fly-by-night entrepreneurs. It is interesting to examine the role of firm attributes like large firm size to be viewed as a clue to assess firm quality and build favourable impression on corporate audience.
The main objective of the study is to analyse the association between size of the firm and its reputation in an emerging economy like India. Hardly any study has directly deciphered the impact of firm size on corporate reputation in Indian context. The findings of the study add to the literature on determinants of corporate reputation that apart from financial performance which has caught much attention in research as a dominant factor affecting the reputation building process; the results hereby reveal that a large firm size also helps in generating favourable perception about the firm. The findings of the study clearly depict the existence of positive impact of firm size on corporate reputation which suggests that possession of large resources seems to be a conspicuous signal for the stakeholders who perceive large-sized firms favourably. Thus the study reveals an interesting observation in Indian context that the Indian stakeholders do value such signals which serve as a basis for decision making.
Measurement of Corporate Reputation
Corporate reputation is a cognitive assessment of firm’s credibility (Fombrun, 1996). Due to difficulty in quantifying reputation of companies, most of the researchers have confined its measurement to survey-based methods. Limited applicability, existence of financial halo and presence of subjectivity in survey-based methods (Brown & Perry, 1994; Fombrun, 1996; Fryxell & Wang, 1994) have modified the way reputation is captured. Researchers now rely on proxies of corporate reputation to evaluate companies. Two such proxies have been used in the current study to measure reputation of Indian companies (a) using price earning ratio as proxy of firm reputation as deployed by Catuogno, Allini, and Pulcinelli (2013) and (b) awards/certifications received for CSR activities (Kansal, Joshi, & Batra, 2014).
A reputed company exhibits high valuation multiples. Price earning ratio is one such multiple which portrays companies’ capabilities to corporate audience. ‘With the exception of those in Belgium, international CEO’s are more likely than those in the USA to use price earning ratio to measure corporate reputation’ (Ranchhod & Gurau, 2007). The study attempts to capture corporate reputation using price earning ratio as proxy as the two are highly correlated and a company depicting a high price earning ratio is expected to have value for shareholders.
Similarly being recognized for socially responsible acts by institutions is applauded by public and it brings laurels to the company. It earns a good name in the market and builds brand equity (Singh & Verma, 2017). The literature supports the notion that responsible companies are more reputed (Brammer & Millington, 2005; Brammer & Pavelin, 2006; Brammer et al., 2009). Hence it is argued that portraying CSR and being awarded for it adds to a companies’ name. Gardberg and Fombrun (2006) claim that companies awarded for CSR make their place in news stories and media, which develops a positive perception about them among stakeholders. Extending the work of Kansal et al. (2014) the study intends to measure corporate reputation on 11 CSR categories.
The study is unique in the sense that it uses a different technique to capture reputation and conducts research in an emerging economy, that is, India to analyse the contribution of firm size as a signal to frame perception about firm’s reputation. In the following sections, literature review is discussed which is followed by the objectives of the study. Next, a brief glance of the research methodology adopted in the current study is done. The empirical test of the hypotheses is conducted by applying suitable techniques which is followed by discussion and conclusion. The study also sets out the managerial implications and scope for future research.
Literature Review
Assessing a company and framing perceptions about it is the most obscure and challenging chore. The most prominent signals that stakeholders use to assess firm quality are past performance, social responsibility, management quality, market risk and capacity to innovate (Chung, Eneroth, & Schneeweis, 1999; Fombrun & Shanley, 1990). Profuse research exploring the factors affecting the reputation building process reveals that public rely on multiple clues to form perception about a firm (Brammer & Millington, 2005; Brammer & Pavelin, 2006; Brammer et al., 2009; Fombrun & Shanley, 1990). It is argued that too many signals confuse rather than assisting stakeholders judge firm credentials accurately. In such a dilemma, stakeholders resort to surrogates like firm size and firm age to assess its quality (Aharoni & Nachum, 2002). Research on corporate reputation and firm performance has widely used firm size as a control variable (Brammer & Millington, 2005; Brammer & Pavelin, 2006; Brammer et al., 2009; Cefis, 2010; Corsino, Espa, & Micciolo, 2011).
Larger firms tend to be more visible, have wider resource base which builds positive impression among corporate audience, thereby enabling superior performance than smaller firms (Antonovich & Laster, 1998; Chung et al., 1999). A large body of literature claims the benefits accruing to large firms in terms of lower volatility in profits (Parsons & Titman, 2009); lower probability of insolvency (Shumway, 2001); more competitive advantage (Barney, 1991); more familiarity and high remembrance rates among stakeholders (Delgado-Garcia et al., 2013; Fombrun & Shanley, 1990). All these advantages translate into better reputation. Despite a growing body of literature supporting the role of firm size in building firm reputation, there exists a dearth of studies directly examining as to how firm size can contribute to building favourable impression among corporate audience.
Few studies unravelling the significance of firm size in construing firm quality offer equivocal findings on it. Larger firms obtain better reputation rankings in surveys conducted by Fortune (in the USA) and The Economist (in the UK) based on greater visibility and familiarity owing to a large resource base (Chung et al., 1999). While few studies like McGuire, Sundgren, and Schneeweis (1988); McGuire, Schneeweis, and Branch (1990); Fombrun and Shanley (1990); Nanda, Schneeweis, and Eneroth (1996); Shefrin and Statman (1994, 1995); Dunbar and Schwalbach (2000); and Cordeiro and Schwalbach (2000) reveal firm size as a crucial determinant of corporate reputation, Brammer and Millington (2005); Brammer and Pavelin (2006); Brammer et al. (2009); and Newburry and Soleimani (2011) fail to empirically capture a significant impact of firm size on corporate reputation. Due to the existence of ambiguity on the liaison between firm size and corporate reputation and a dearth of literature studies examining this strand in Indian context, the current study endeavours to affirm the impeccable importance of firm size as a crucial antecedent of corporate reputation.
Indian economy provides an interesting background to conduct research on fathoming firm size as a determinant of corporate reputation. Low level of transparency, poor governance mechanisms, lower investor protection and high-profile corporate scandals leave the corporate audience to rely on their own judgements to interpret firm quality and develop perceptions about them. An effort has been made through the current study to make stakeholders cognisant of firm size as a surrogate to assess firm quality. An easily accessible clue might help stakeholders to frame perceptions about a firm.
The presence of uncertainty about the firm motivates stakeholders to search for clues and the heuristic systematic model asserts that public relies on heuristic clues to assess firm quality (Eagly & Chaiken, 1993). The size of seller may signal competency, quality and a large firm may procure better reputation than a small firm (Aharoni & Nachum, 2002; Doney & Cannon, 1997). It can be argued that larger firms tend to have access to more resources and more resources and capabilities bring in a competitive advantage as posited by resource-based perspective (Barney, 1991); hence large firm size can be acclaimed as a signal to better performance and growth via upgrading reputation (Antonovich & Laster, 1998). Theory supports a positive influence of firm size on corporate reputation, thereby implying that larger firms procure enhanced market standing. In this light, following hypothesis is framed:
H1: There is a significant positive impact of firm size on corporate reputation.
Research Methodology and Data Collection
The study intends to examine the relation between firm size and corporate reputation, and for this top 500 Indian companies constituting BSE (Bombay Stock Exchange) 500 index have been analysed. Data on awards/certifications received for CSR activities are extracted by conducting content analysis of annual reports that are downloaded individually for each company. ACE equity database provides access to both financial and non-financial information of Indian companies, which is used as a source to extract data on control variables. The study relates to the period from 1 April 2002 to 31 March 2012, just prior to the enactment of New Companies Act, 2013. The final sample of the study got reduced to 403 companies due to unavailability of data. The variables for the current study have been categorized into three sub-headings:
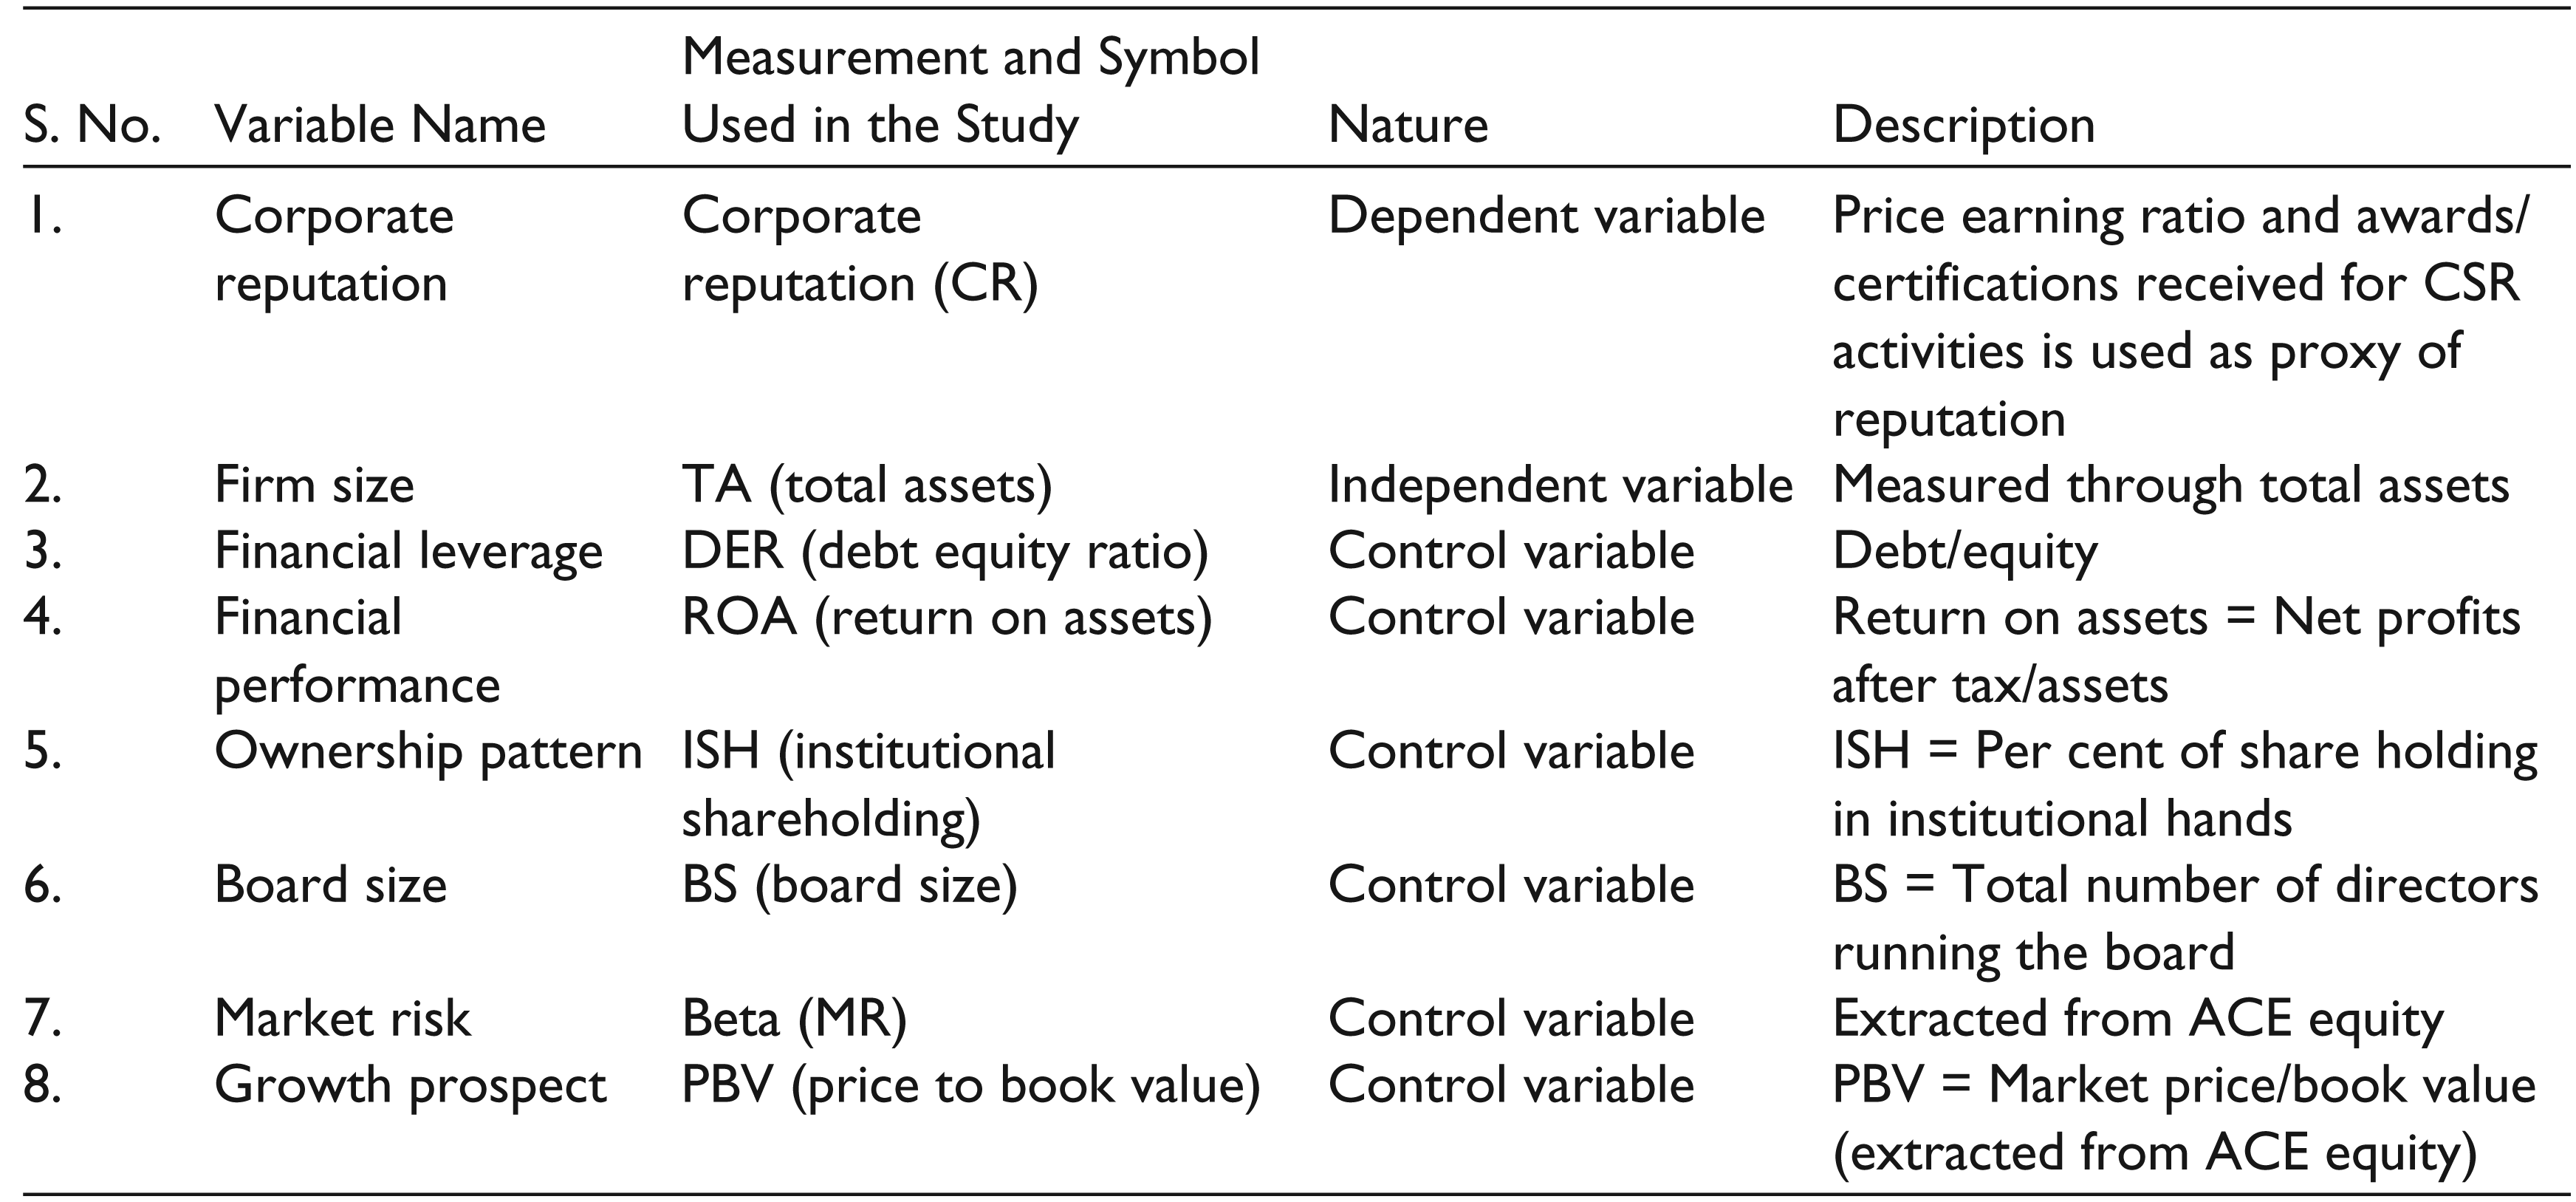
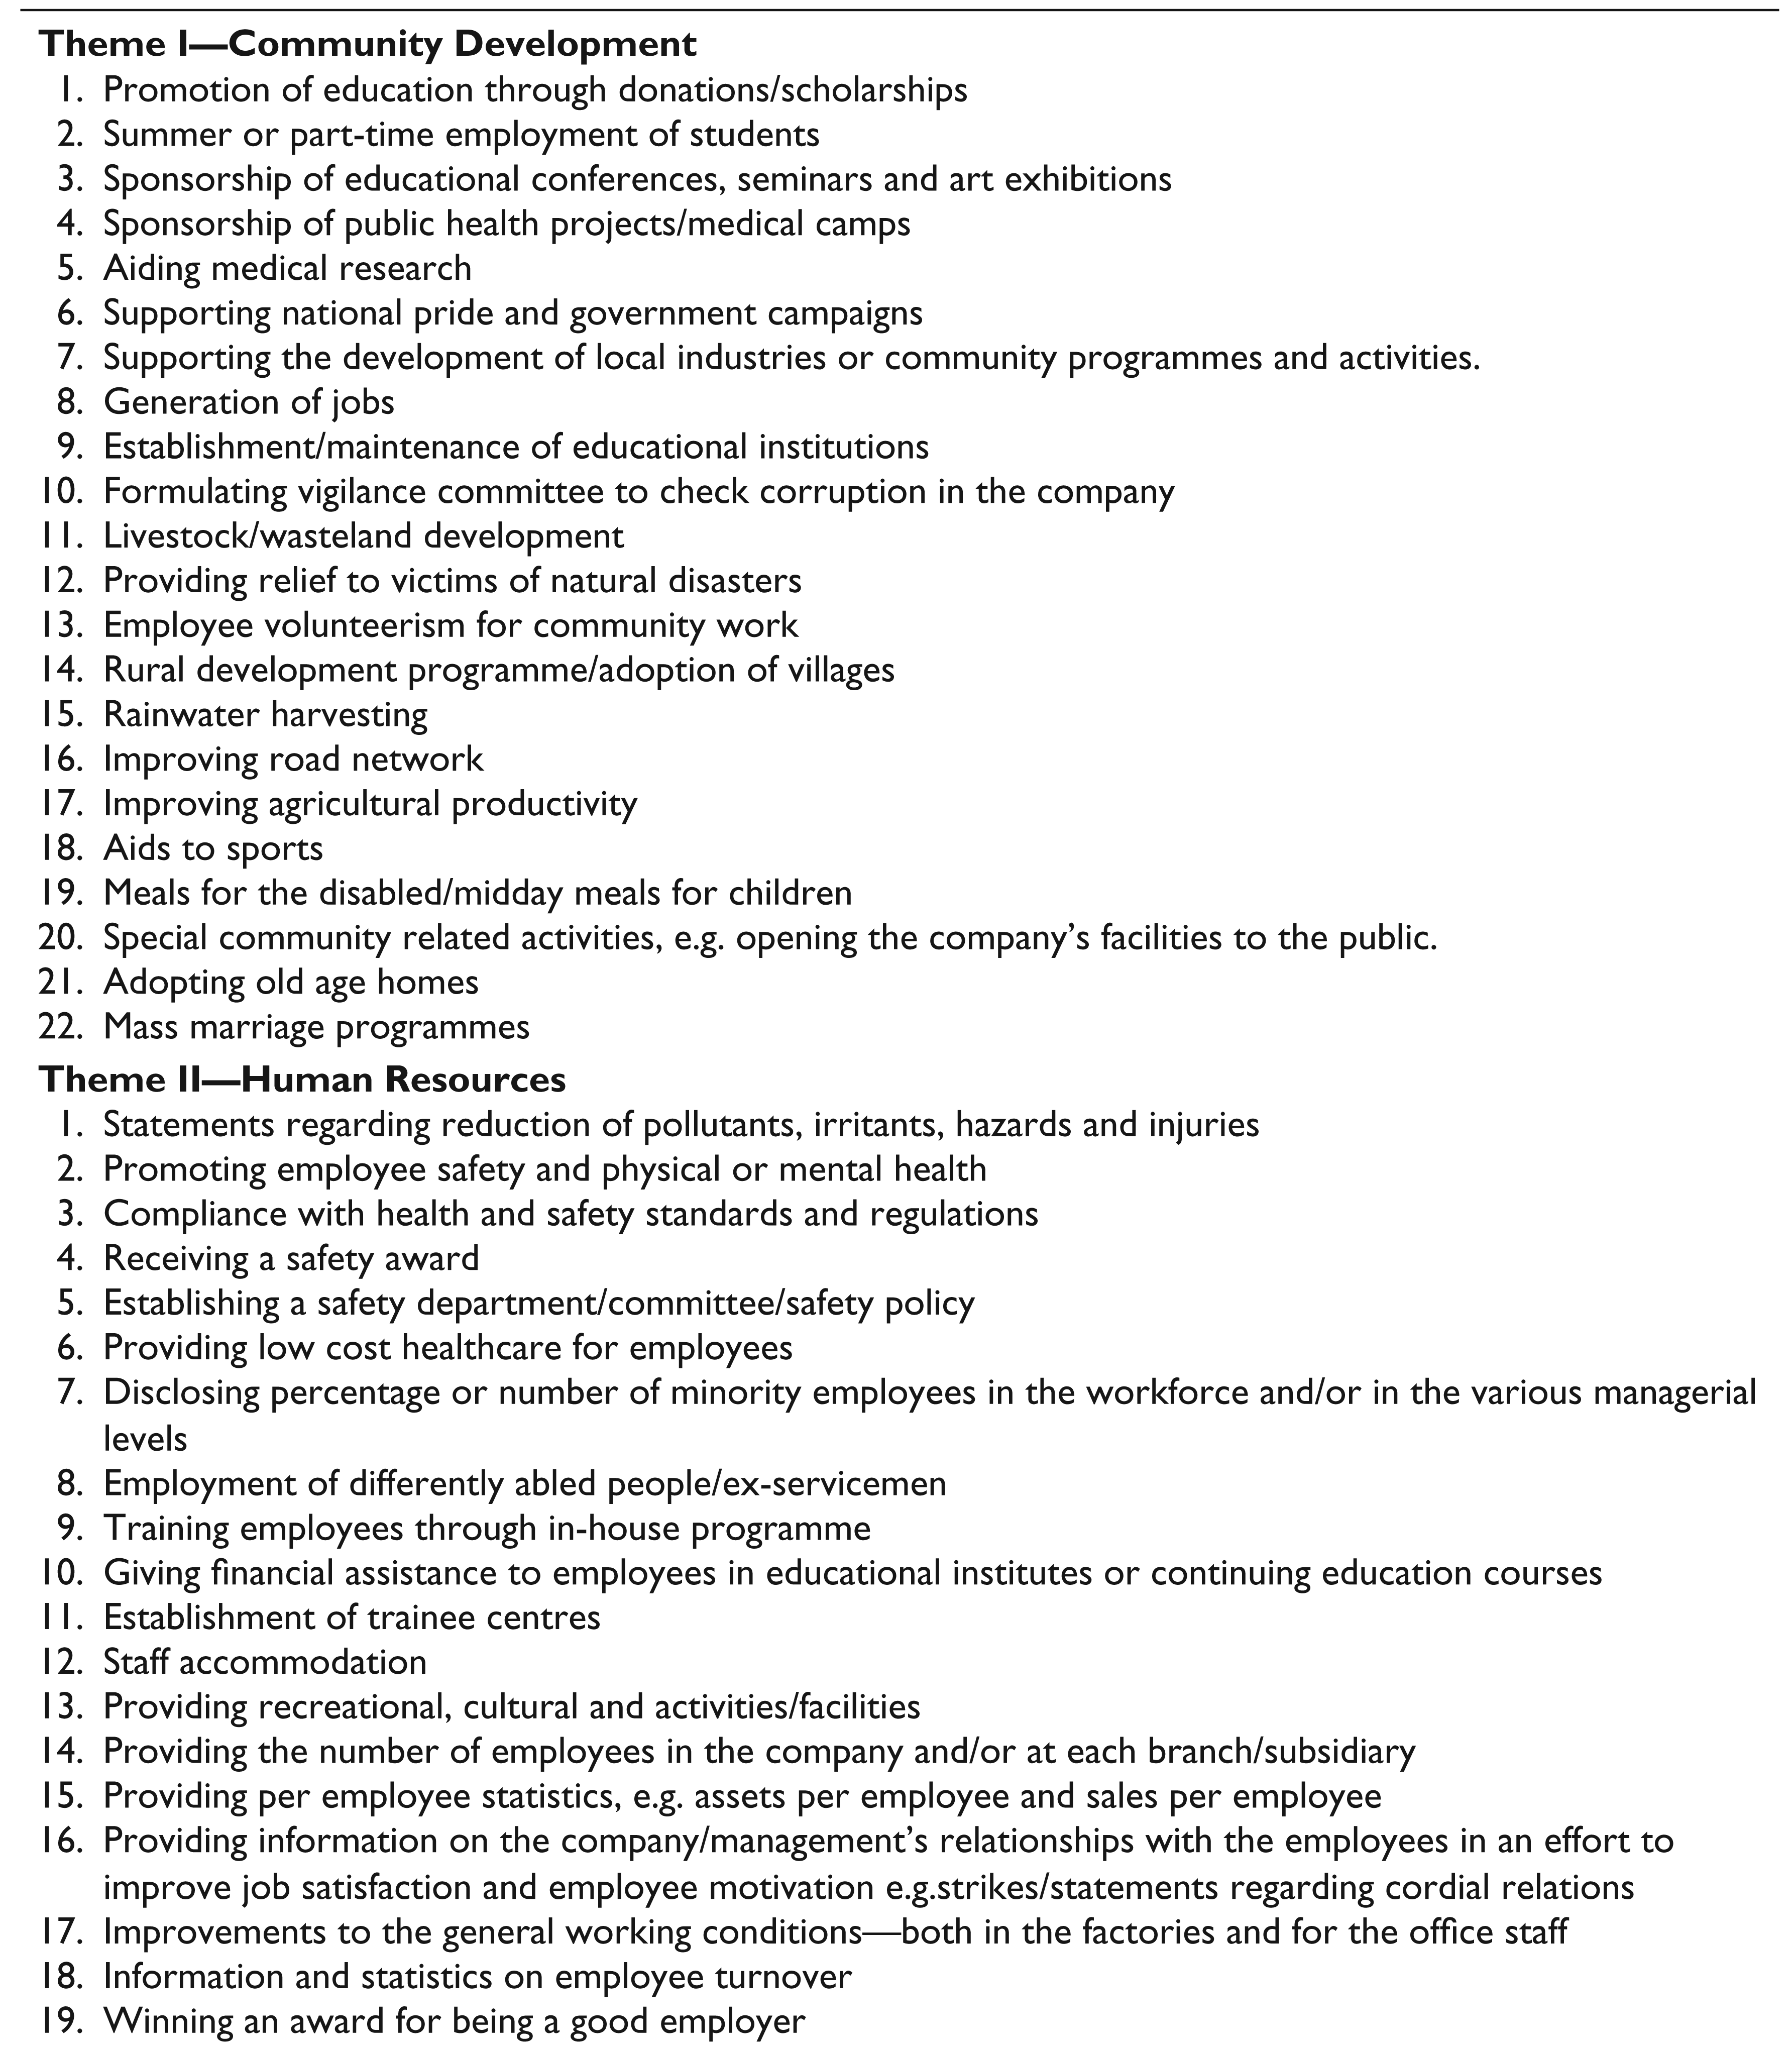
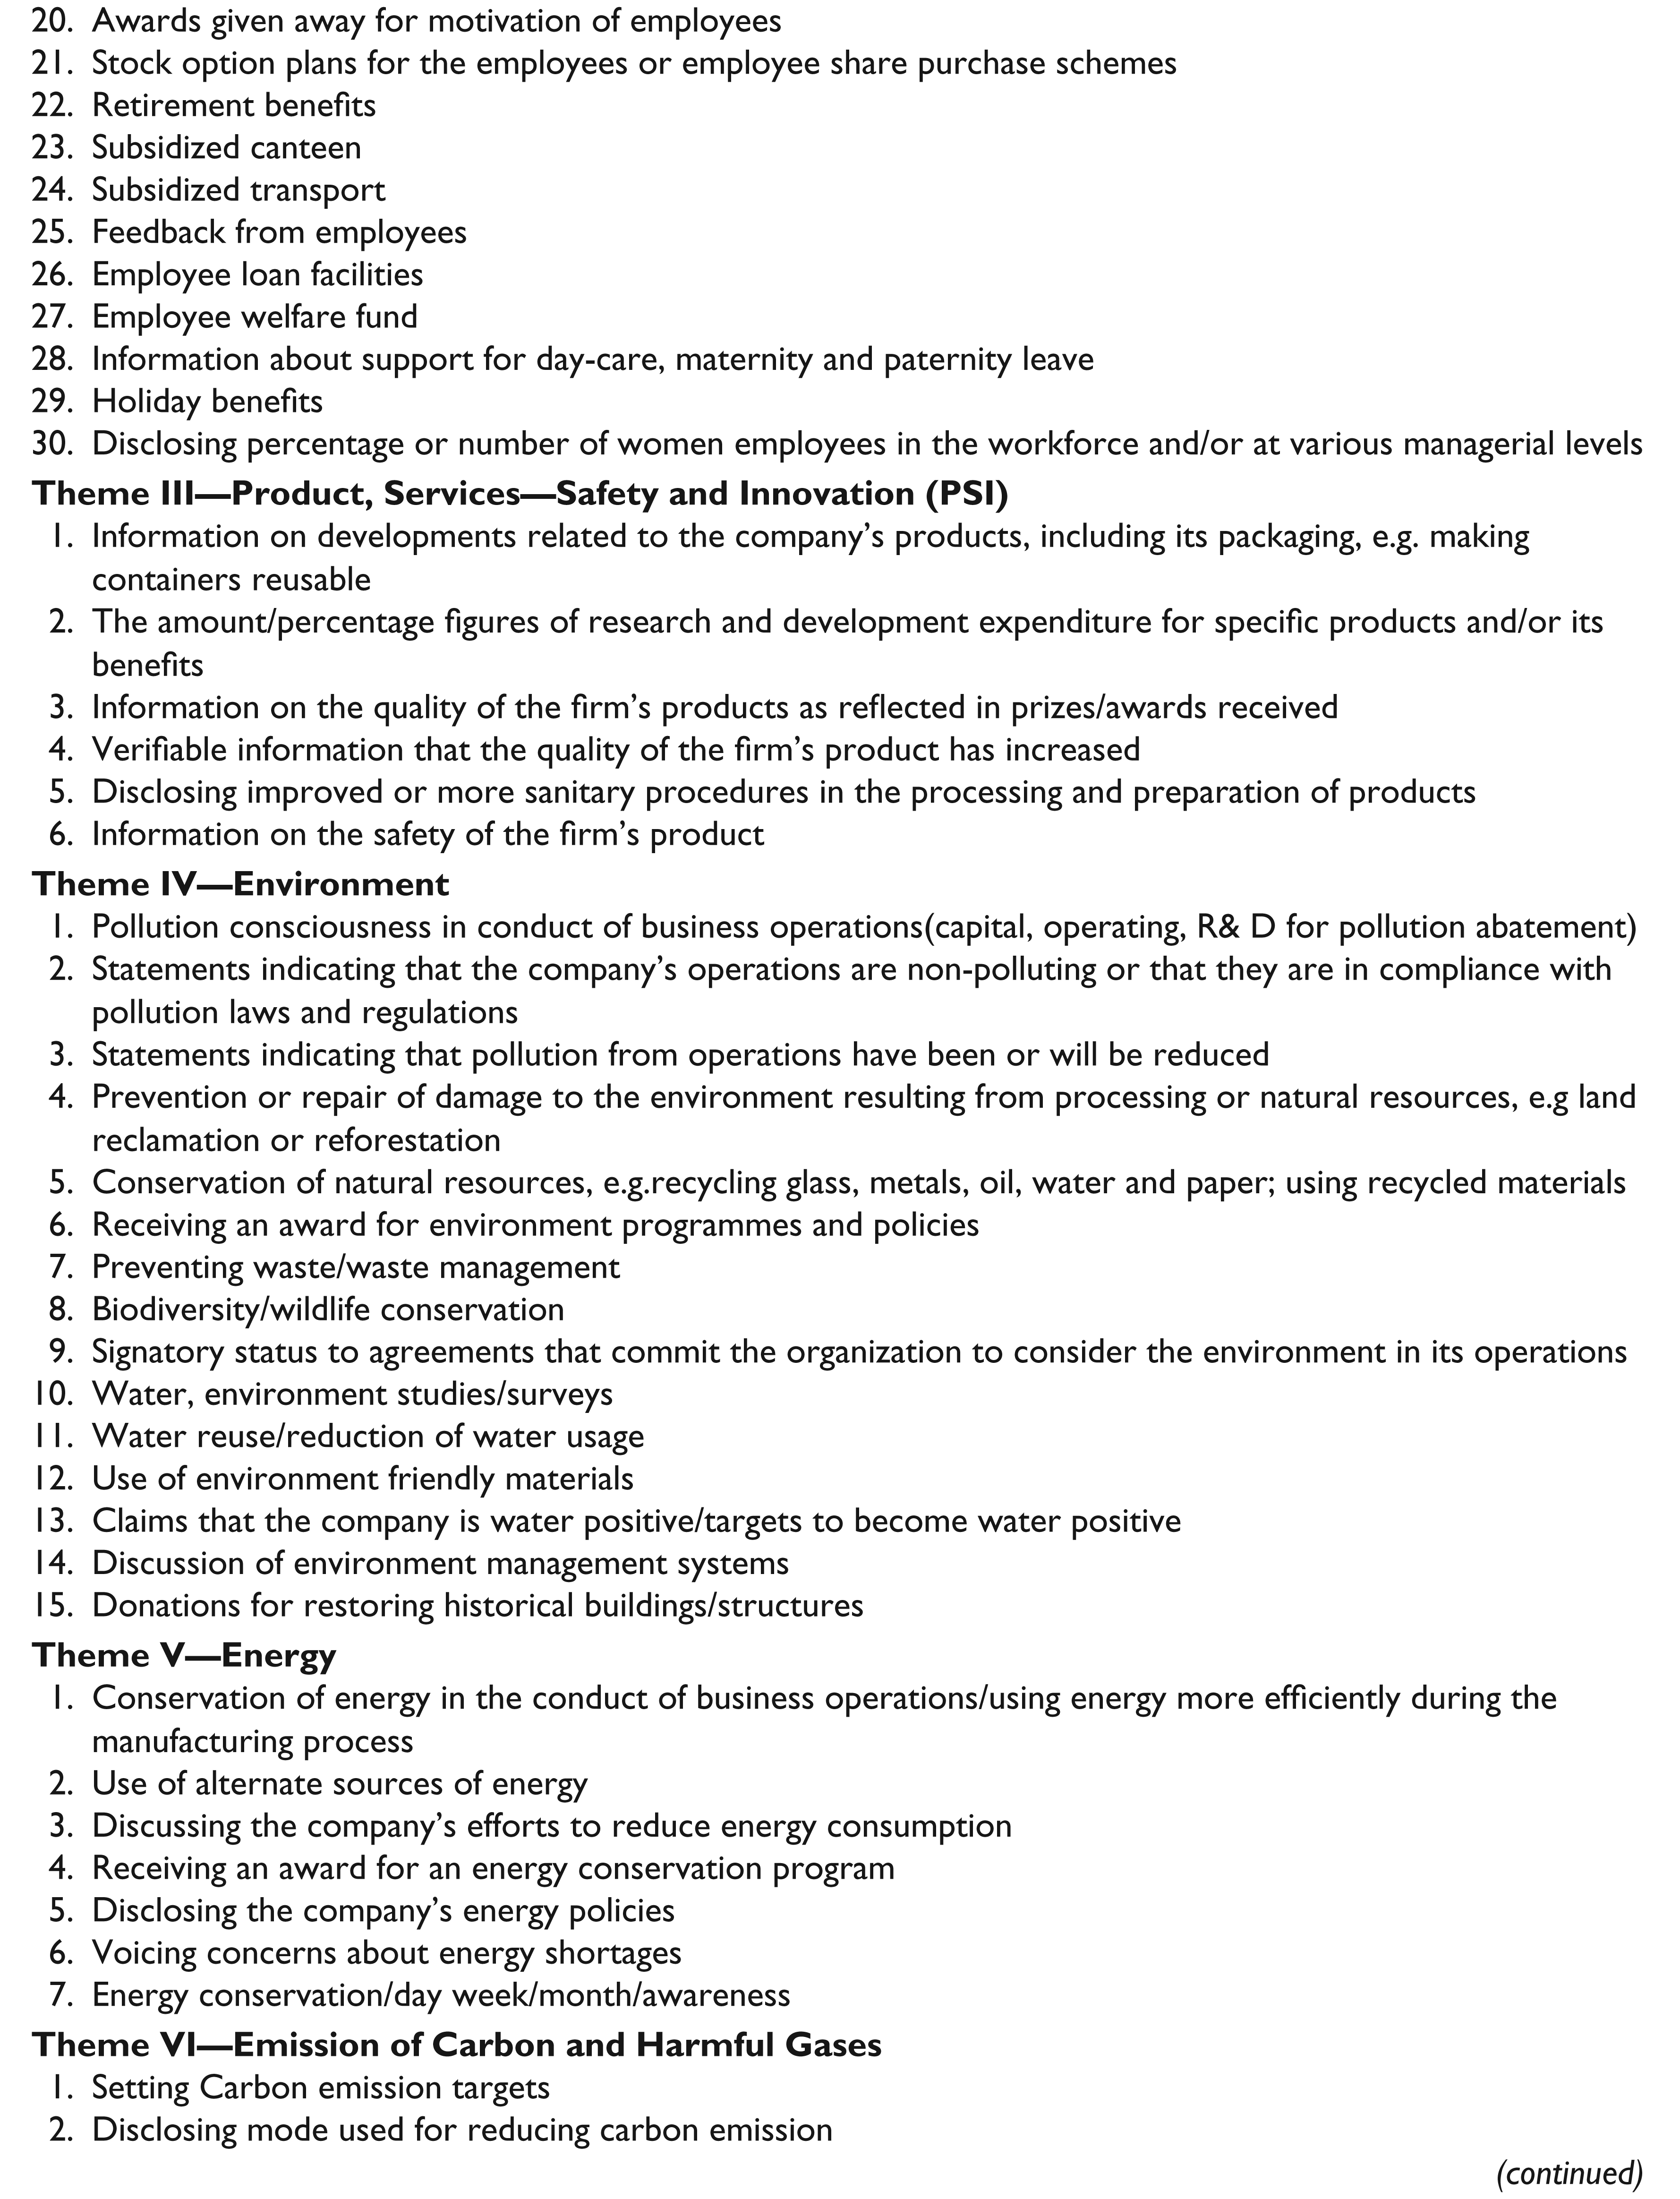
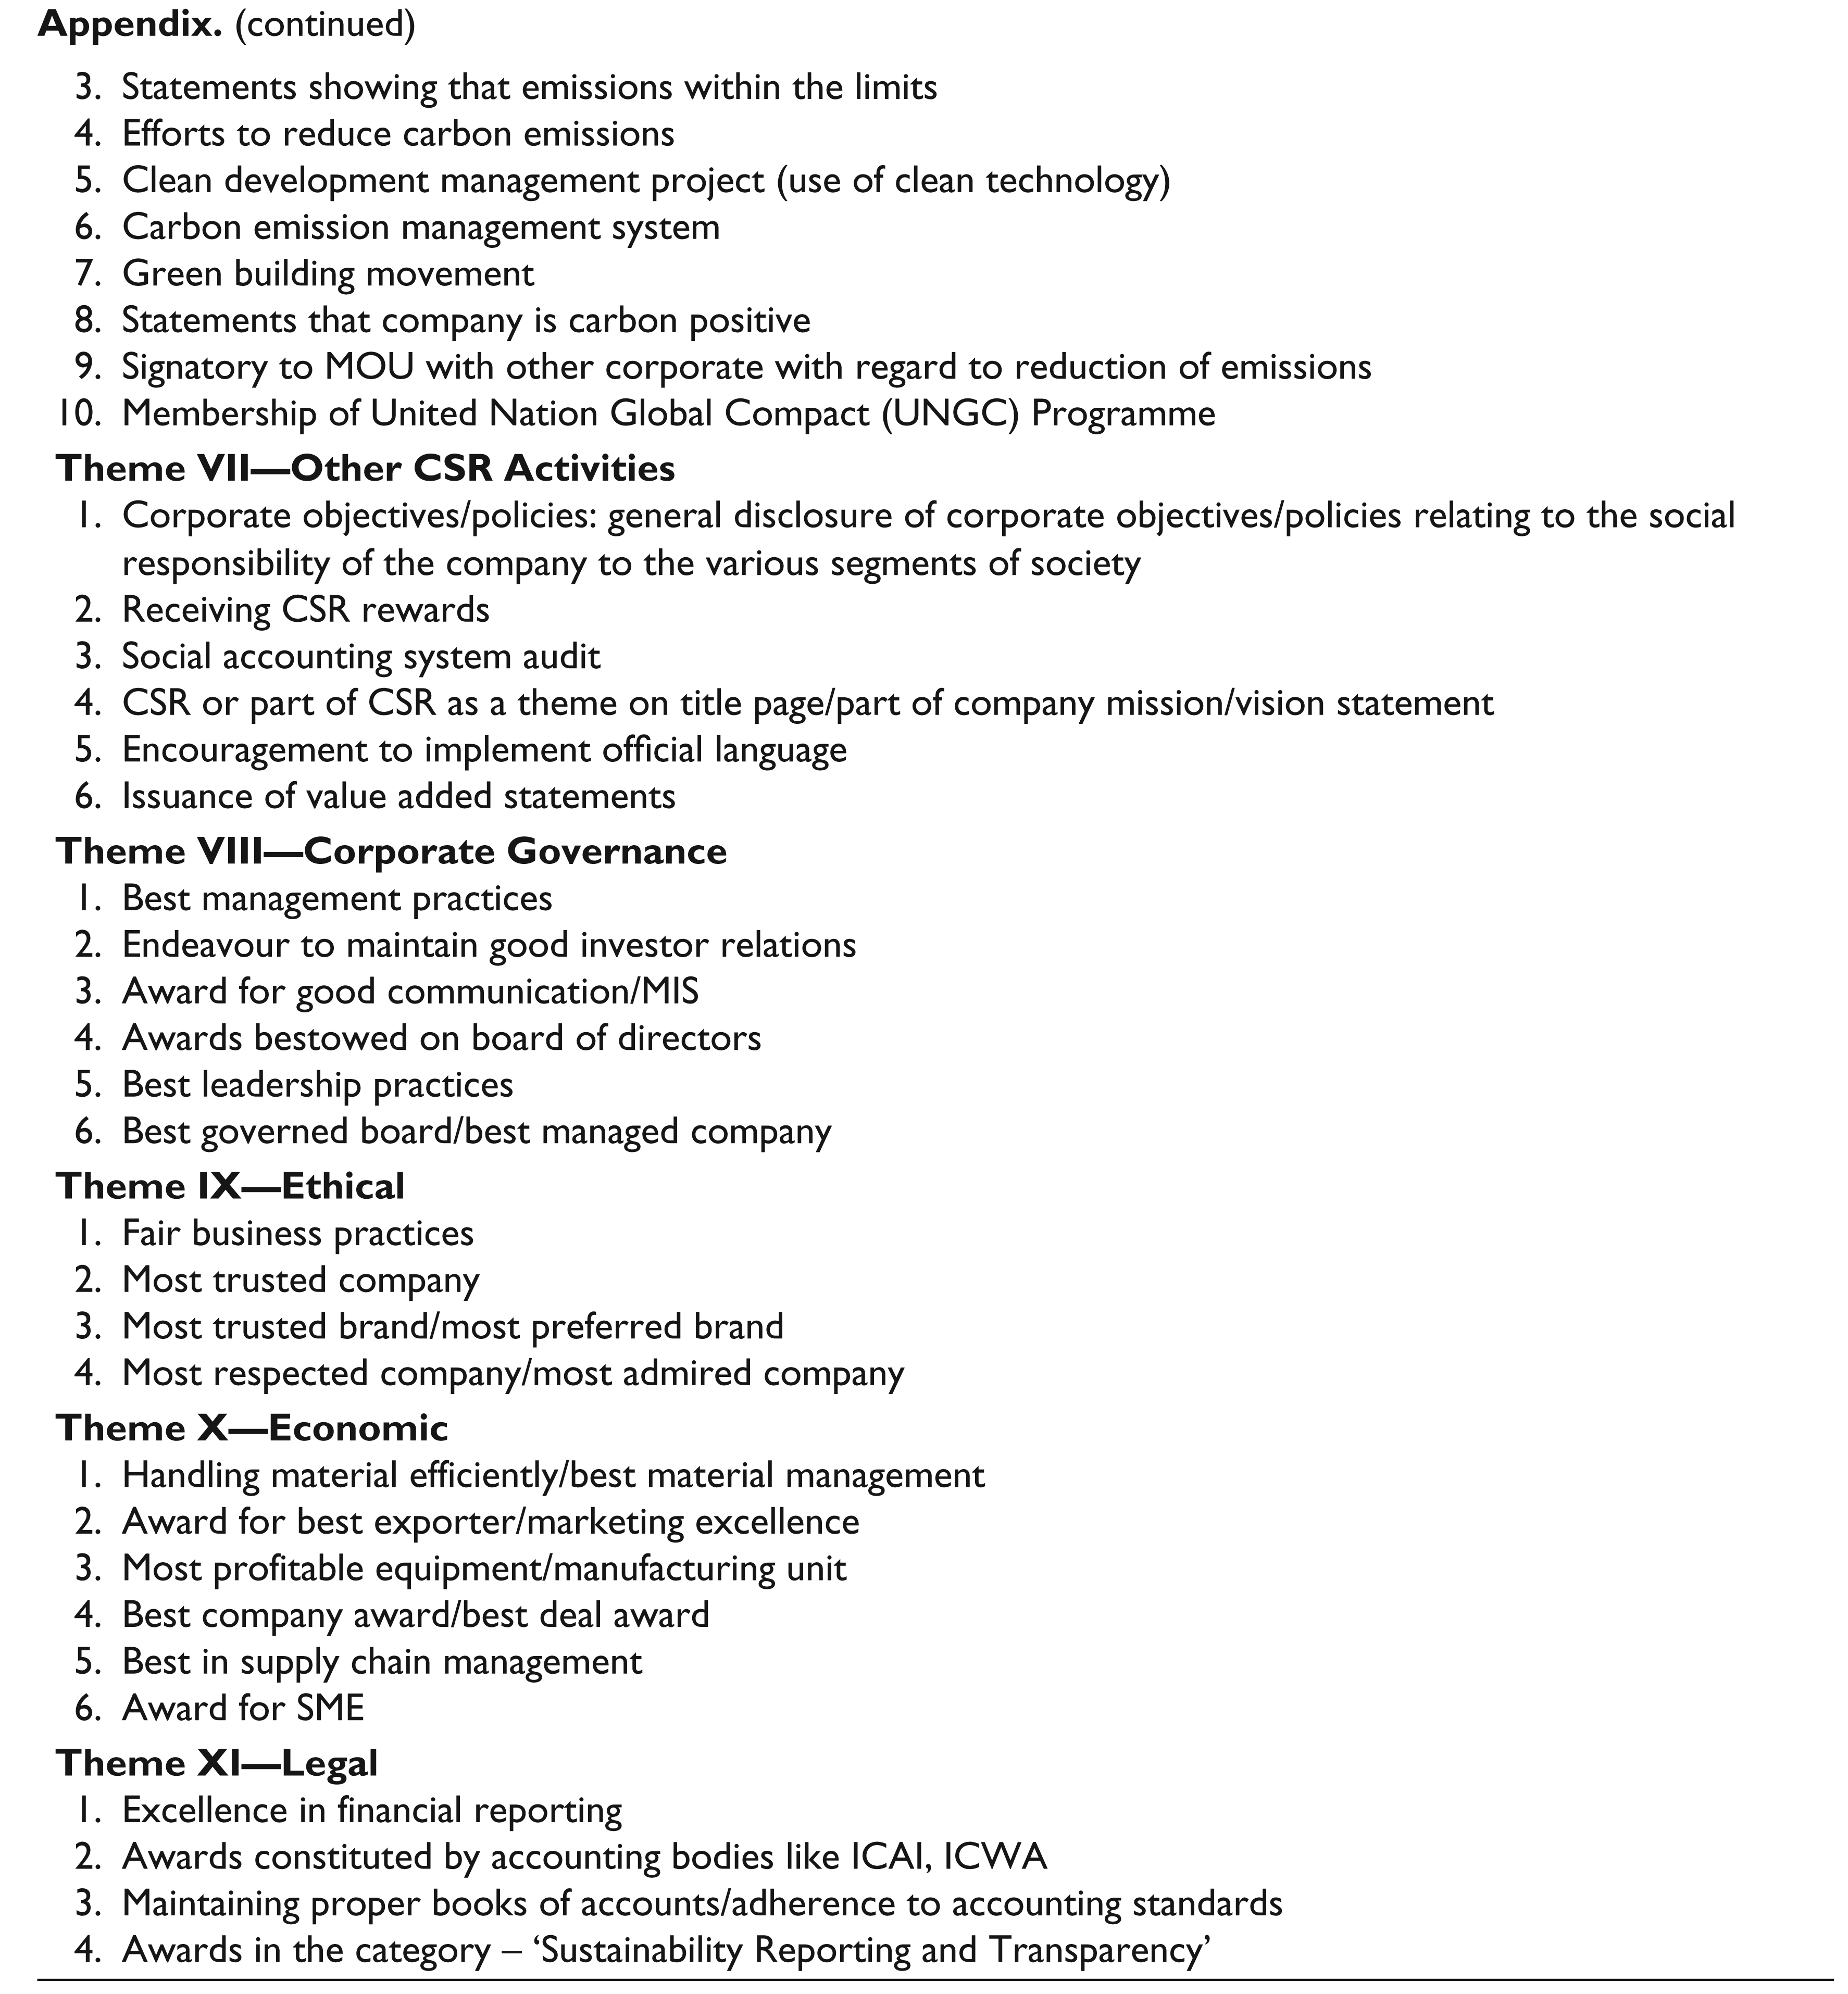
Dependent variable. For analysing the impact of firm size on reputation of Indian companies, corporate reputation is taken as a dependent variable. Corporate reputation has been captured through two different ways, that is, taking price earning ratio as proxy (Catuogno et al., 2013) and measuring it through the number of awards/certifications received for CSR activities. Adopting and extending the CSEEE index of Kansal et al. (2014), four more categories namely economic, legal, ethical and corporate governance are added thereby making a total of 11 CSR categories for which a company could be rewarded. The data related to the number of awards/certifications received for various CSR activities has been obtained by conducting content analysis of annual reports of 403 companies over a period of 10 years. The various CSR categories for which the companies have been rewarded are shown in the appendix. Independent variable. Firm size is taken as an independent variable. The literature suggests taking total assets as a proxy of firm size (Brammer et al., 2009). Hence, the study measured firm size of Indian companies through total assets. Control variables. Many factors influence the perception of stakeholders. Firm characteristics like sound financial position and past reputation are expected to have a positive bearing on corporate reputation. Barney (2001) suggests that it takes time for covert resources like corporate reputation to generate an impact on corporate audience. Reputation begets reputation. Since past reputation is expected to influence current perceptions of stakeholders and a good reputation in the past contemplates a favourable impression in future (Fombrun & Shanley, 1990), it is imperative to control the effect of past reputation in order to observe the impact of firm size on current reputation.
Permitting access to institutional investors is also viewed as a positive signal that improves firm reputation (Brammer et al., 2009; Fombrun & Shanley, 1990). Large board signals quality decisions by the firm thereby embarking a favourable impression on public (Brammer et al., 2009). High leverage and market risk are viewed sceptically and generate a negative influence on stakeholder perception (Fombrun & Shanley, 1990; Hall & Lee, 2014). Future growth expectations (measured through price to book ratio) are likely to boost market confidence and have a positive implication on current reputation (Cordeiro & Schwalbach, 2000). Data on control variables are extracted from the ACE Equity Database. Table 1 provides a summary of variables used in the study.
The model for discerning the effect of firm size on corporate reputation is:
Corporate reputation has been measured separately by using two proxies, that is, price earning ratio and the number of awards/certifications received for various CSR activities. The empirical model being tested through the equation includes corporate reputation as a dependent variable, where corporate reputation distinctively stands for price earning ratio (the impact of firm size on price earning ratio is examined in Model 1 of Table 5) and the number of awards/certifications received for 11 CSR activities, which is used as a dependent variable in Model 2 of Table 5 that tests the impact of firm size on corporate reputation.
Variables Used in the Study
Analysis
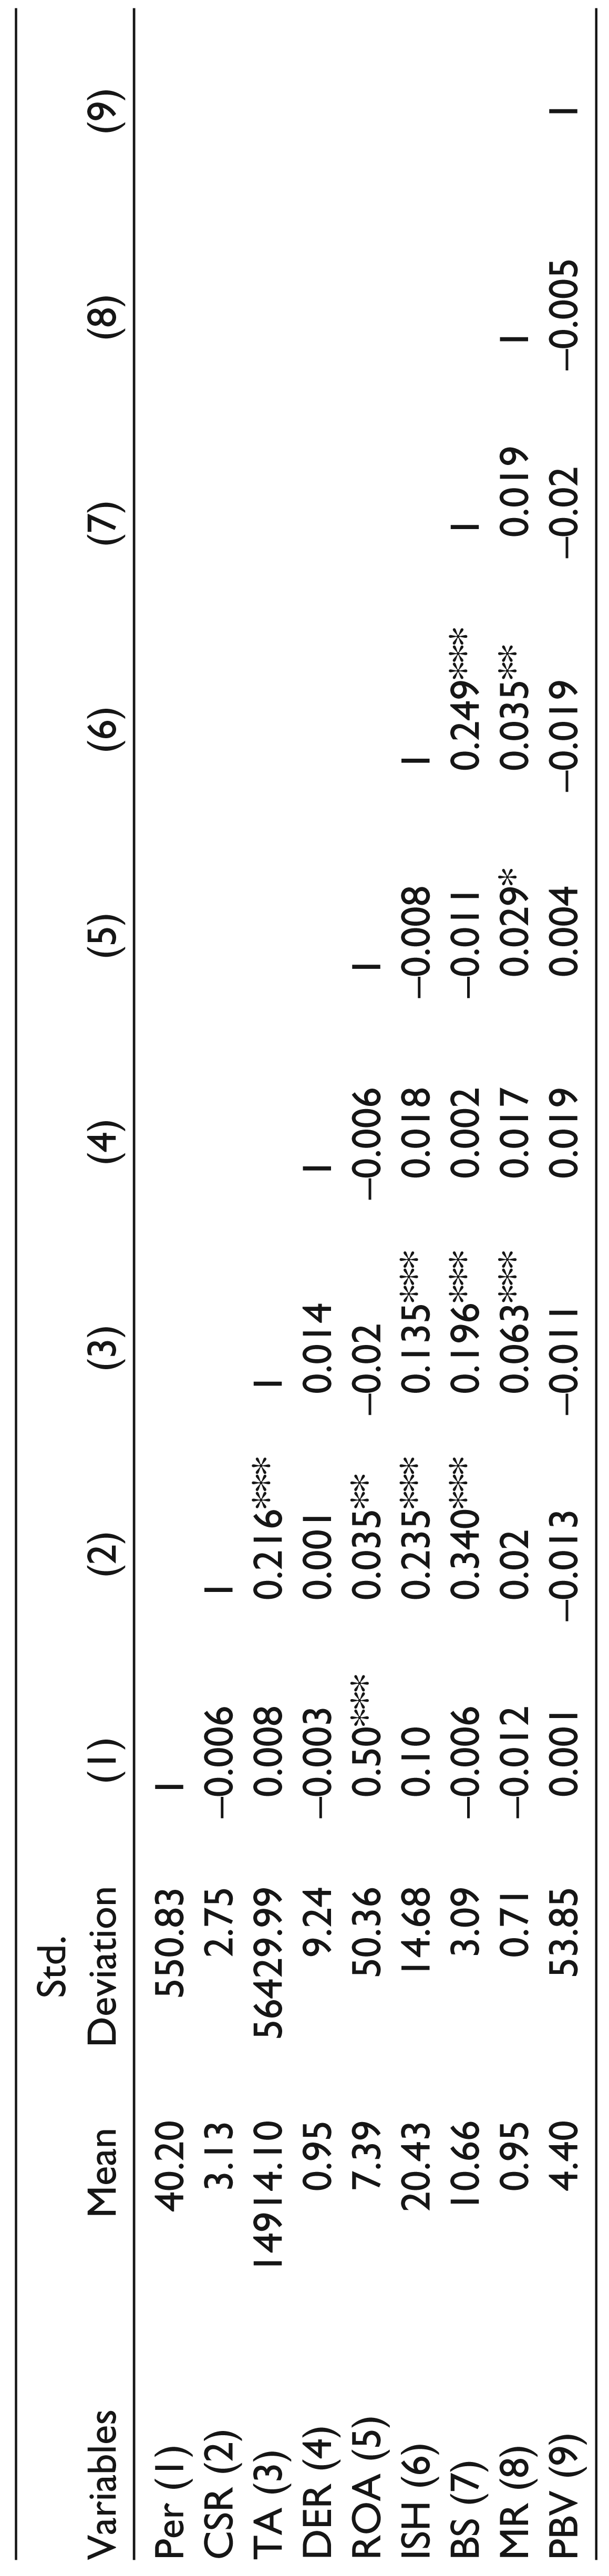
The descriptive statistics of the sample are reported in Table 2.The mean value of corporate reputation measured through price earning ratio is 40.20 and the average number of awards/certifications received for CSR activities by Indian companies is 3.13. This low value of corporate reputation is quite obvious and it clearly points toward the lower level of voluntary CSR activities undertaken by Indian firms as the period of study pertains to the pre- implementation era of new companies act, 2013 that mandated CSR for certain class of companies. Indian companies tend to face a low level of risk as the average market risk (captured through beta) is 0.95. It is observed that Indian companies prefer raising funds through issue of shares than debt financing as the average level of debt equity ratio is merely 0.95. The Indian companies constituting the sample seem to be financially sound as the mean value of ROA is 7.39 per cent. The average level of assets possessed by the firms is Rs. 14,914 crore. The average board size is 10 members and 20 per cent ownership rests in institutional hands. The mean value of price to book ratio is just 4.40. A positive correlation is depicted between firm size and corporate reputation. Although firm size portrays a positive but weak association with corporate reputation (when measured through price earning ratio), it depicts a significant positive relation (r = 0.216; p-value 0.00 < 0.05) with reputation (when captured through the number of awards/certifications received for CSR activities), thereby lending an ostensible support to the hypothesis that large-sized firms are perceived favourably by corporate audience.
Descriptive Statistics and Correlation Matrix
It is generally believed that large firms are perceived more favourably than their small counterparts (Fombrun & Shanley, 1990). In order to revalidate this supposition in Indian context, independent sample t-test is undertaken, which reveals significant variations based on reputation. In Tables 3 and 4, the sample statistics of highly reputed and low reputed companies have been compared by dividing the sample into two parts on the basis of median value of corporate reputation for each proxy. Highly reputed companies are defined as those companies portraying reputation more than the median value whereas low reputed companies are those depicting reputation lower than the median value. One is assigned to the reputational score of companies having value more than the median value and zero otherwise.
Sample Comparison Based on Reputation (Using Price Earning Ratio as Proxy)
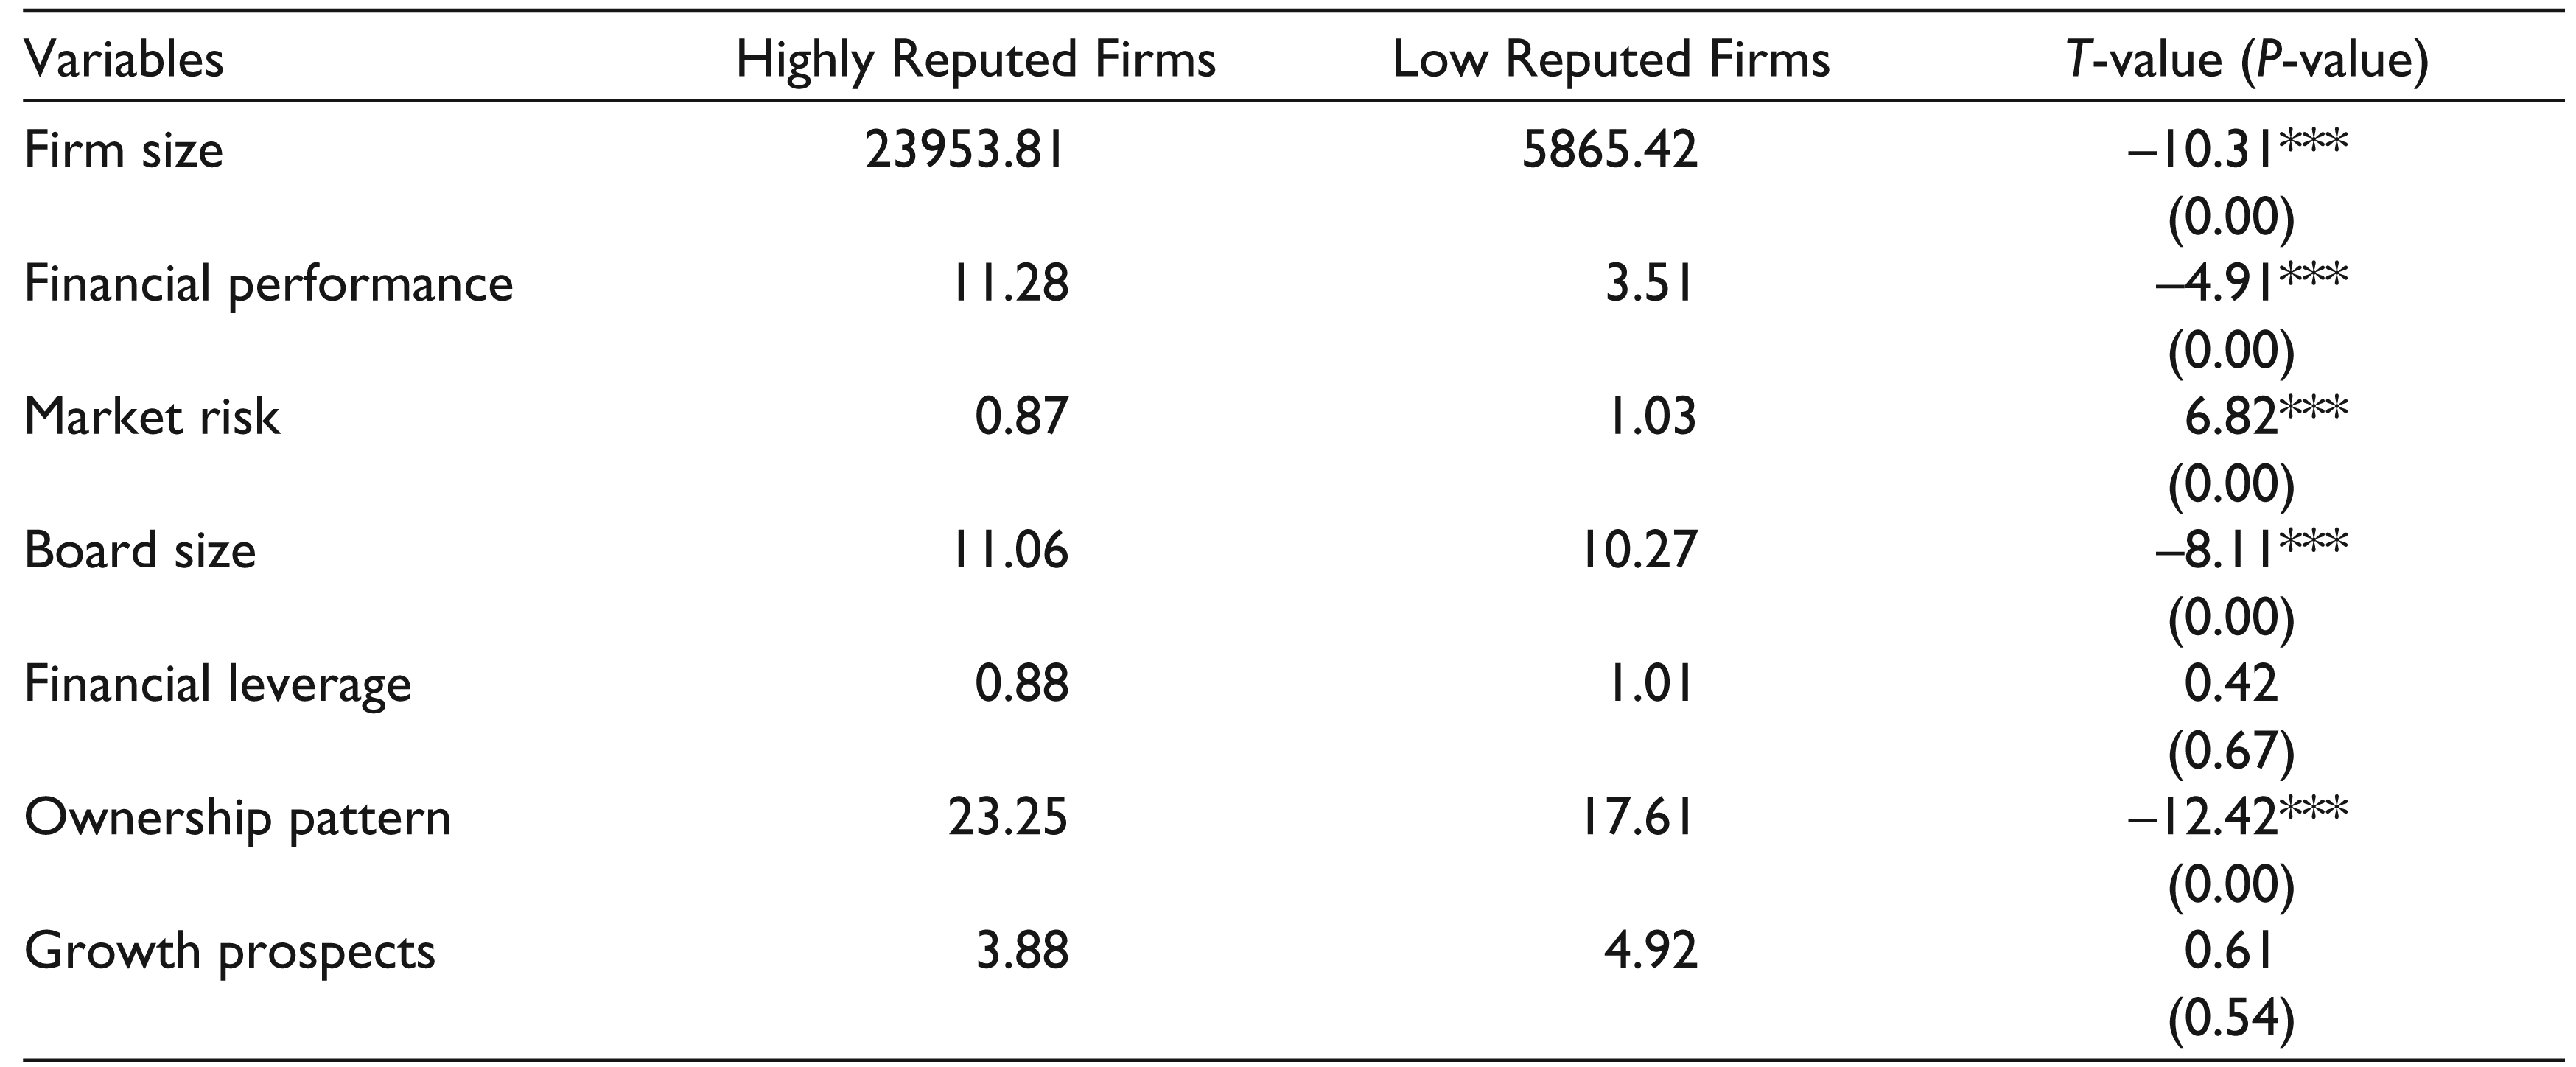
A significant difference in firm size is found based on reputation as depicted in Table 3. Highly reputed firms are found to be almost four times larger in size than low reputed firms (t-value –10.31 > 2.58; p-value 0.00 < 0.01). Firm performance also showed significant variations based on reputation. Highly reputed firms depict a better financial position (t-value –4.91 > 2.58; p-value 0.00 < 0.01). A lower level of market risk is encountered by highly reputed firms (t-value 6.82 > 2.58; p-value 0.00 < 0.01). Even board characteristics revealed variations based on reputation. Larger board size and greater extent of institutional ownership are found in highly reputed companies ( p-value 0.00 < 0.01). However, there is no significant difference in financial leverage and growth prospects of highly reputed and low reputed firms.
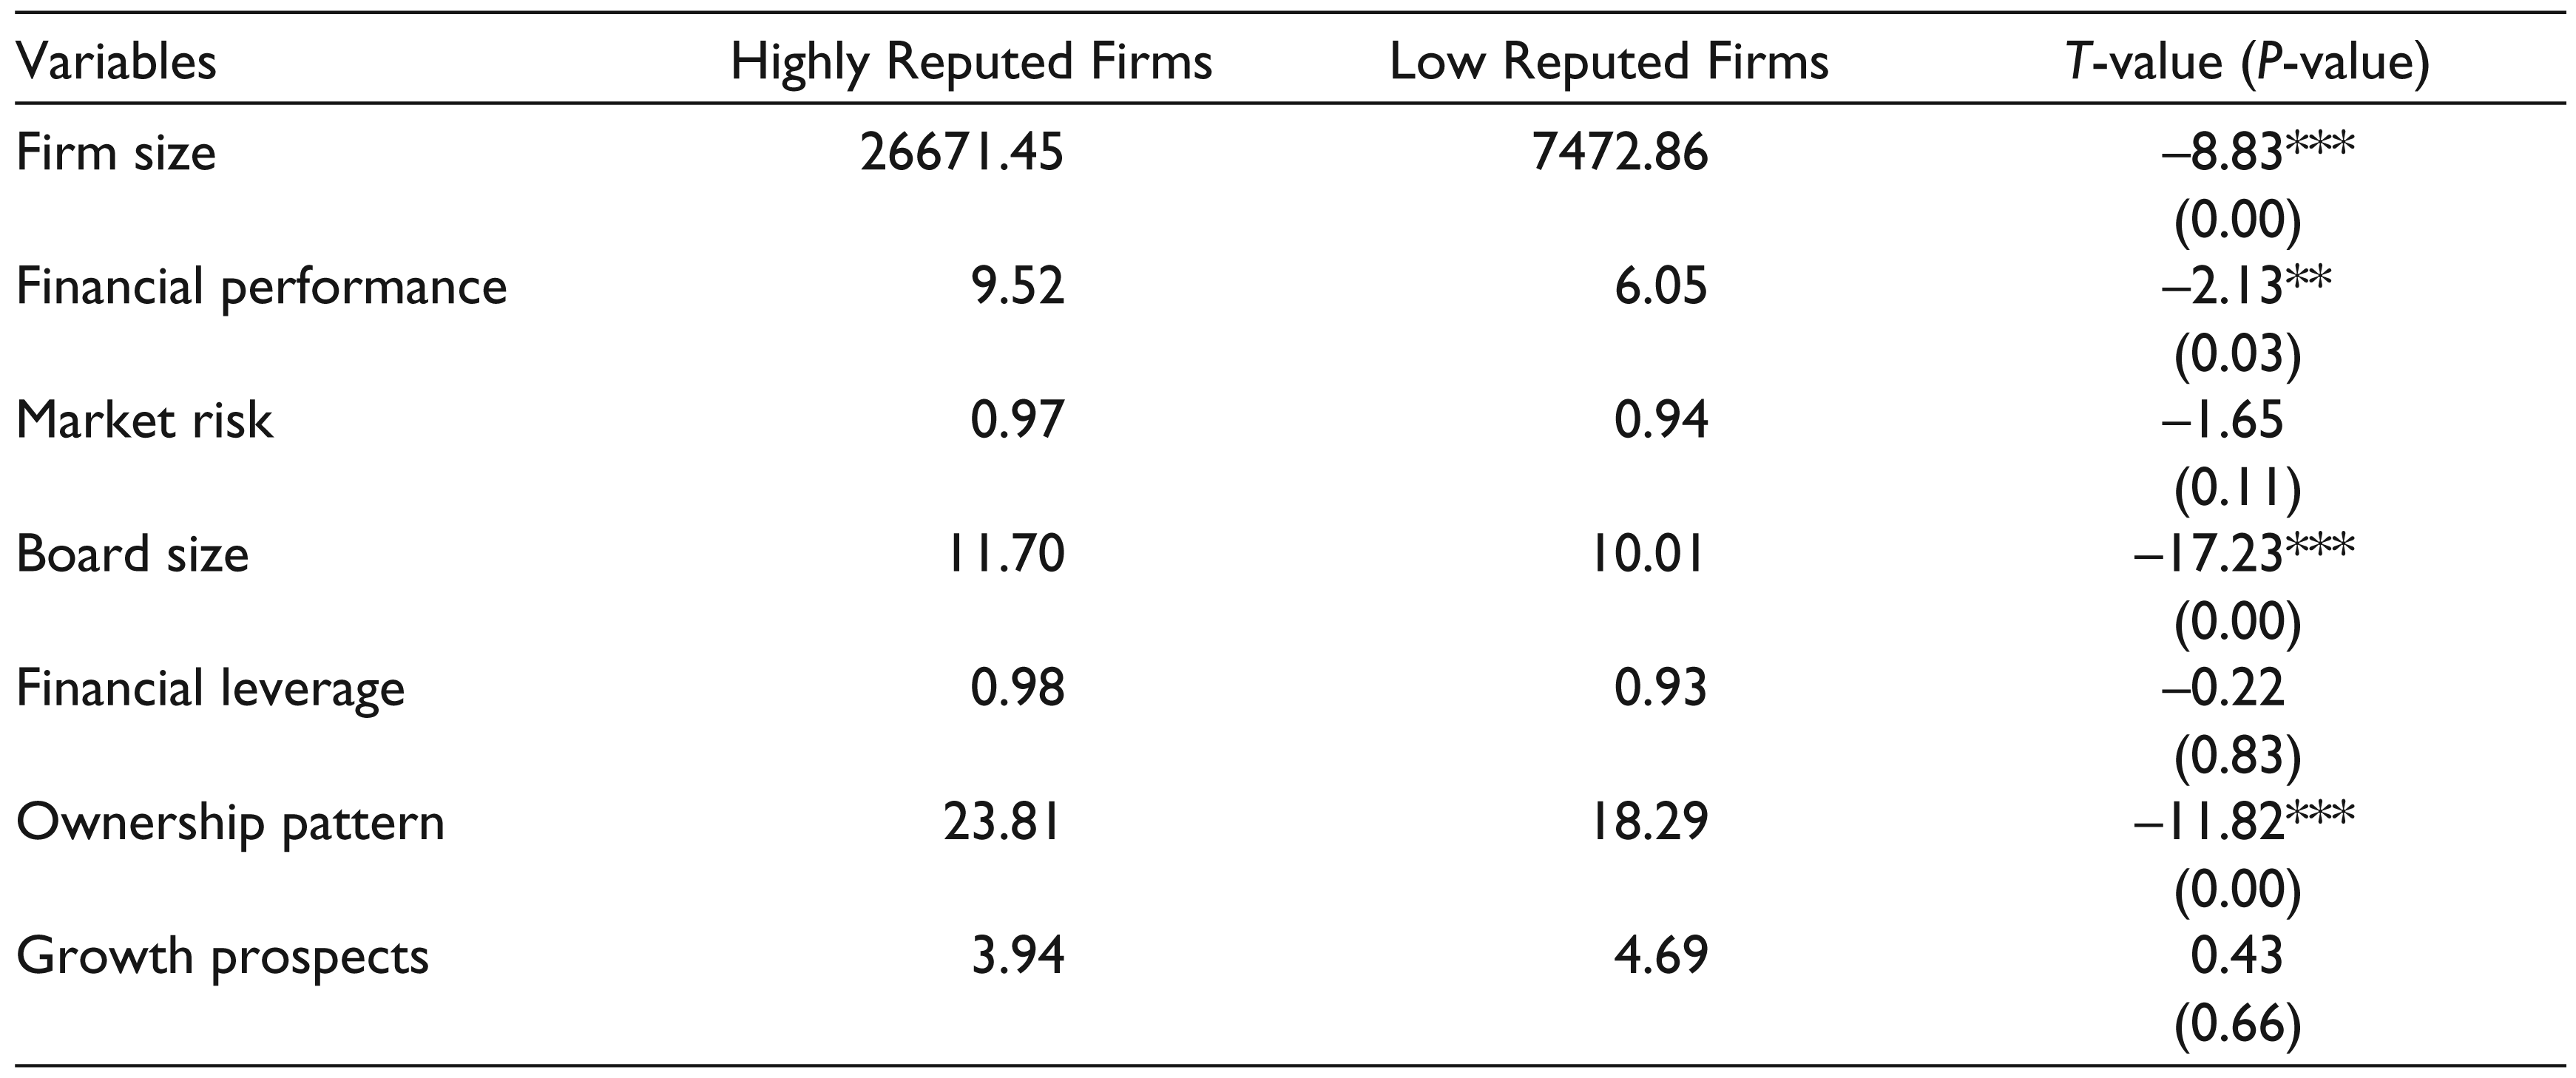
Almost similar results are exhibited in Table 4 which reveals sample variations based on reputation (taking awards/certifications received for CSR activities as proxy). Firm size of highly reputed companies is almost three times the size of low reputed companies (t-value –8.83 > 2.58; p-value 0.00 < 0.01). The ROA of highly reputed firms is almost 1.5 times the ROA of low reputed firms (t-value –2.13 > 1.96; p-value 0.03 < 0.05). Market risk, which is found to be lower for highly reputed firms (when price earning ratio is used as proxy), does not reveal a significant difference in reputation (when awards/ certifications received for CSR activities are used as its proxy). Reputed firms tend to employ a large number of members on board who bring in pool of knowledge enabling better quality decisions ( p-value 0.00 < 0.01). A significant difference is found in the ownership pattern of highly reputed and low reputed companies ( p-value 0.00 < 0.01). Reputed firms tend to attract institutional investors who assure a check on misappropriation by managers.
Sample Comparison Based on Reputation (Taking Awards Received for CSR as Proxy)
Panel Regression Analysis Taking Corporate Reputation as Dependent Variable
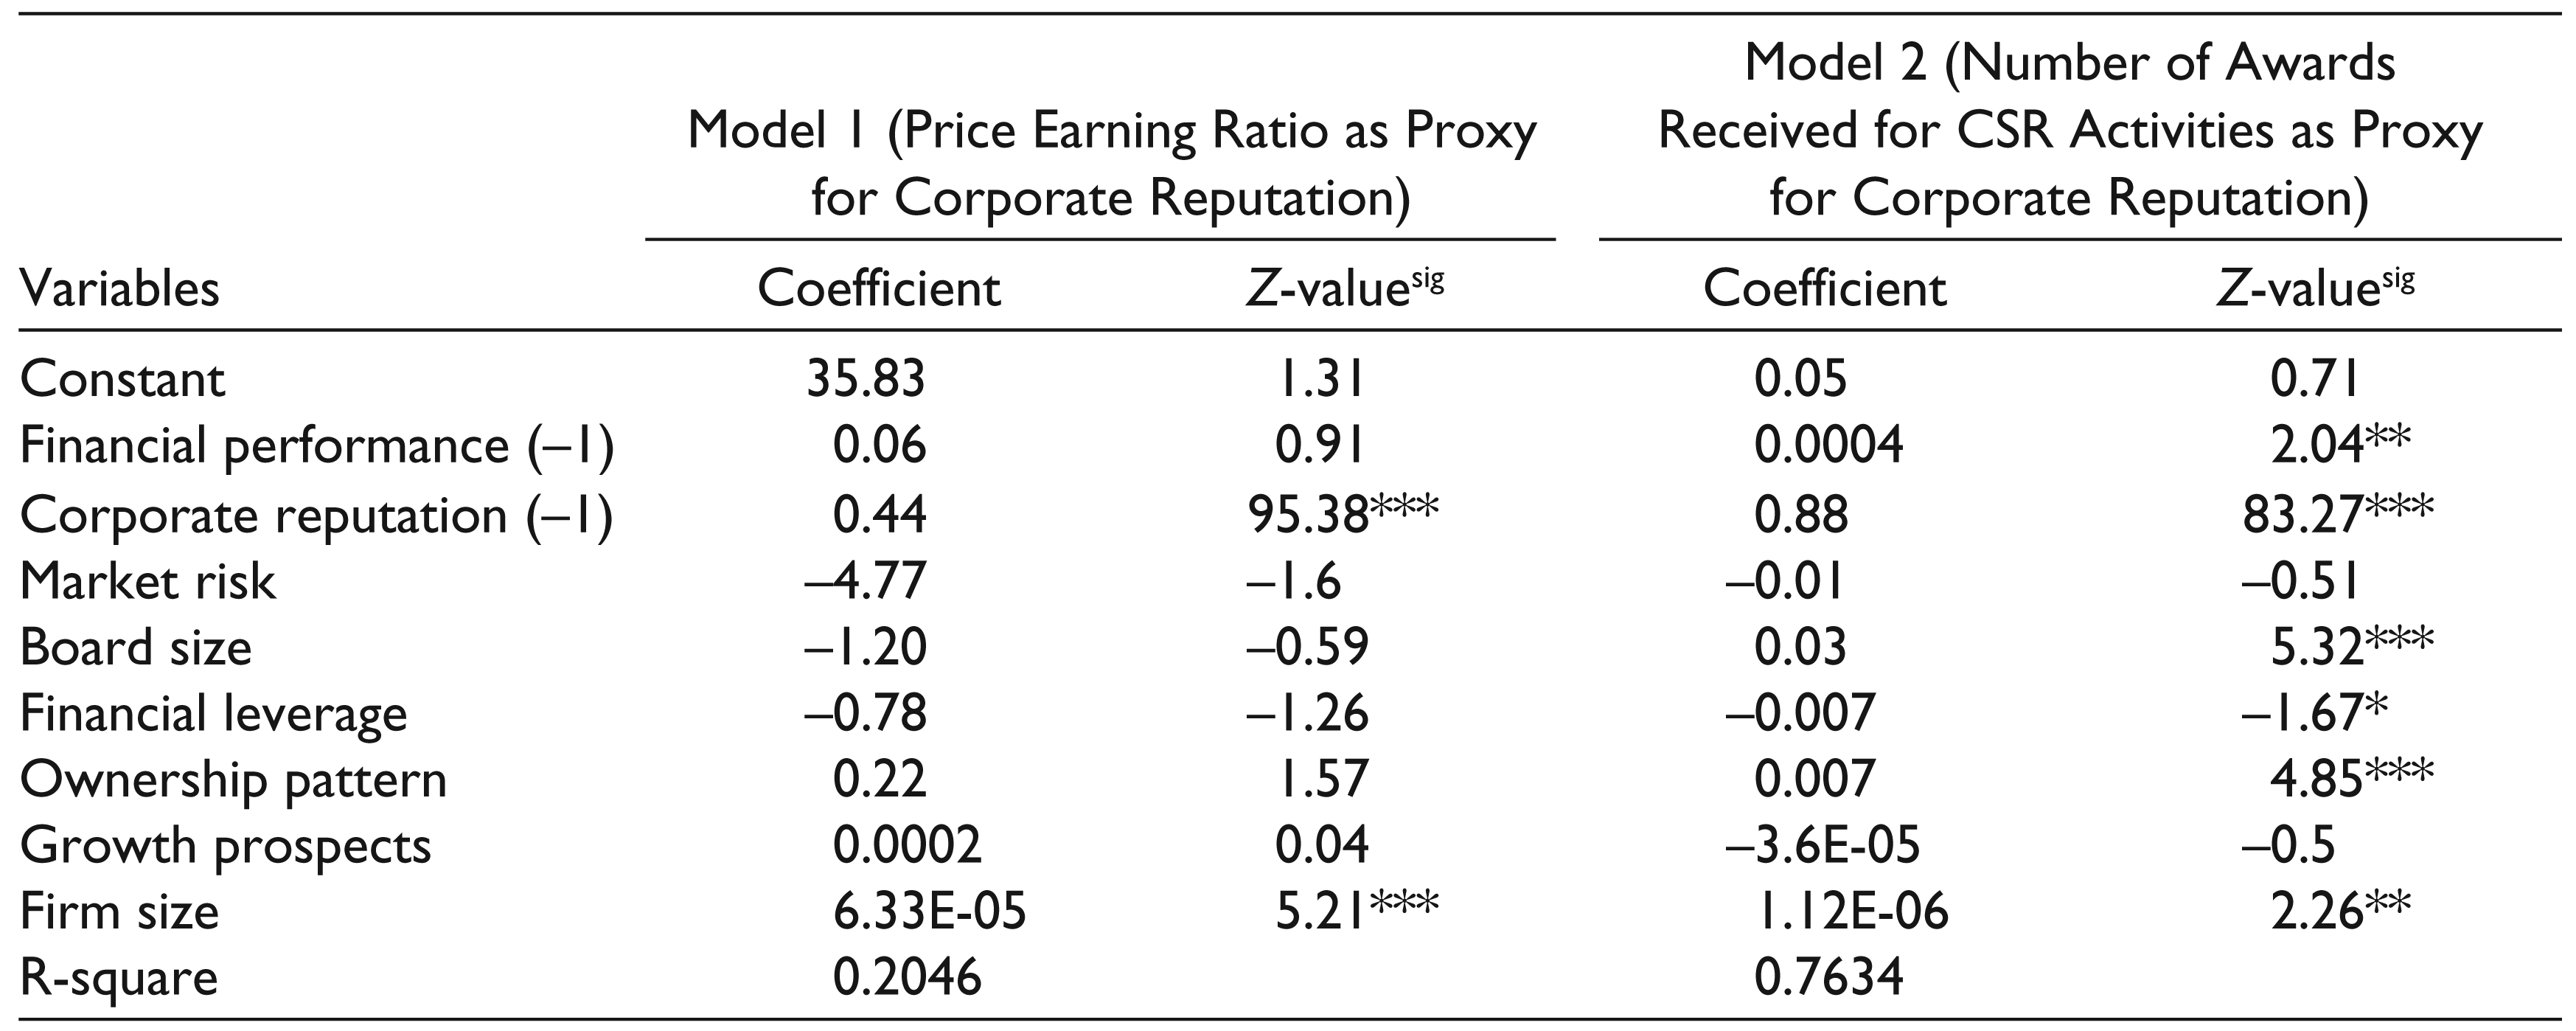
The main purpose of the study is to examine the role of firm size in framing perception about the companies. For this panel regression analysis is conducted in stata 11 version. The assumptions regarding autocorrelation, heteroscedasticity and multicollinearity are duly examined. The Wooldridge test revealed the problem of autocorrelation ( p-value 0.00 < 0.01). The data are also found to be non-homogeneous as the p-value of 0.00 < 0.01 is revealed through the Breush-Pagan/Cook-Weisberg test. However, there is no multicollinearity among variables as the VIF value for all the variables is found to be < 10. In order to deal with the problem of autocorrelation and heteroscedasticity, cluster (cross- sectional identifier) is used in the model.
Model 1 shows firm size as a crucial determinant of corporate reputation ( p-value 0.00 < 0.01). This finding is consistent with the majority of literature positing size as an antecedent of reputation (Antonovich & Laster, 1998; Fombrun & Shanley, 1990; McGuire et al., 1988, 1990; Nanda et al., 1996; Shefrin & Statman, 1994, 1995). It can be inferred that a large firm is able to build better reputation among stakeholders accruing to its access to resources and visibility in the market (Fombrun & Shanley, 1990). Public tends to be more familiar to large-sized companies and hold positive perception about their future growth prospects (Delgado-Garcia et al., 2013). In addition to firm size, past reputation emerges out to be a significant contributor in framing current perceptions about a company ( p-value 0.00 < 0.01). Other control variables like past performance, market risk, board size, financial leverage, ownership pattern and growth prospects fail to cast a significant impact on corporate reputation. Model captures 20 per cent variation in current reputation, which is measured through price earning ratio.
Model 2 delineates the impact of firm size on corporate reputation (taking awards/certifications received for CSR activities as proxy). Here also firm size is found to influence corporate reputation positively but the level of significance changes from 1 per cent to 5 per cent ( p-value 0.02 < 0.05). Stakeholders generally interpret the quality of the offering from past observations. Sound financial position and good market standing in the past generate a significant positive influence on current reputation of the company. Consistent with the findings of Fombrun and Shanley (1990), past financial performance produced a significant impact on current reputation ( p-value 0.04 < 0.05). Previous year’s corporate reputation acts as an important factor in building current perceptions about it ( p-value 0.00 < 0.01). Studies linking board size to corporate reputation depict a positive relation between the two (Brammer et al., 2009; Fombrun & Shanley, 1990) as large board brings in pool of knowledge which helps in taking quality decisions leading to better governance which ultimately enhances firm reputation (Brammer et al., 2009; Fombrun & Shanley, 1990; Ljubojevic & Ljubojevic, 2008). The results are consistent with this proposition ( p-value 0.00 < 0.01). A highly levered firm is viewed sceptically by corporate audience as it imbues financial burden on the company by enlarging interest obligations (Fombrun & Shanley, 1990). The findings of the study are in line with this supposition as debt equity ratio exhibits a negative impact on corporate reputation ( p-value 0.09 < 0.10). The ownership pattern is also expected to influence stakeholder perceptions. A large extent of ownership in institutional hands relieves external shareholder’s burden to keep a check on management (Brammer & Millington, 2005; Brammer et al., 2009). More the proportion of institutional investors, better the firm reputation ( p-value 0.00 < 0.01). Market risk and price to book value fail to generate any significant impact on corporate reputation. The model explains 76 per cent variation in corporate reputation.
Conclusion
The current study intends to examine the role of size in framing perceptions about a company. Larger firms have been widely documented as better ones in terms of greater access to resources, more visibility and familiarity among corporate audience, thereby procuring favouritism from them (Fombrun & Shanley, 1990). Although larger firms pocket many benefits yet its direct impact in framing impression on stakeholders lacks empirical support. Therefore, the study attempts to explore firm size (measured through total assets) as an antecedent of reputation in emerging market like India characterized by low level of transparency and high levels of uncertainties leaving stakeholders in vulnerable position.
The findings of the current study (through two independent sample t-test) reveal that there exists a significant difference in the size of highly reputed and low reputed firms. Larger firms exhibit better reputations. In addition, firm size casts a significant positive impact on corporate reputation, thereby accepting the hypothesis. Thus size of a firm acts as a clue to the corporate spectators who can assess firm quality from it. It can be argued that a company has been able to maintain its large size only after fulfilling varied stakeholder expectations, thereby implying that larger firms survive in acute rivalry and their capabilities and competencies build a favourable image among stakeholders.
Managerial Implications
The study carries implications for both stakeholders and management. First, stakeholders can deploy firm size as a surrogate and interpret firm quality from it. Myriad signals confuse rather than assisting them. Their plight can be improved by assessing firm’s reputation through easily apprehendable and conspicuous clues. Size of a firm may give a hint about firm’s competence and stakeholders might view larger firms propitiously. Second, management should be well cognisant of the fragile nature of corporate reputation, which is difficult to build and easy to destroy (Hall, 1992). Managers should make every effort to keep intact their good name. Larger firms must be all the more cautious. They must recognize that firm size is a double-edged sword, where on one hand it brings familiarity and better reputation (Fombrun & Shanley, 1990), on the other hand it attracts greater public scrutiny (Delgado-Garcia et al., 2013). It is argued that larger firms disseminate more information among audience and are under higher level of public scanner as compared to their smaller counterparts. Thus managers of large-sized firms must make every endeavour to maintain their standing in the market.
Limitations and Future Research
The study suffers from few limitations. First, firm size has been captured through total assets only, while many studies use total sales or the number of employees as a proxy for firm size (Hall & Lee, 2014; Safon, 2009; Zadeh & Eskandari, 2012). The use of such proxies may vary the results. Second, although an effort has been made to measure corporate reputation through two different ways, yet deploying other proxy of corporate reputation may distort the findings of the study. Third, the study intended to examine the role of firm size in building corporate reputation, whereby the role of industry is not controlled. Future research may incorporate industry effects so as to provide a vivid glance at the role of size in shaping firm perception after controlling industry effects as done by Cordeiro and Schwalbach (2000). Fourth, governance variables could be included in future research as the past literature upholds inkling between good governance and reputation.
Footnotes
Declaration of Conflicting Interests
The authors declared no potential conflicts of interest with respect to the research, authorship and/or publication of this article.
Funding
The authors received no financial support for the research, authorship and/or publication of this article.
Acknowledgements
The authors are grateful to the anonymous referees of the journal for their extremely useful suggestions to improve the quality of the paper. Usual disclaimers apply.
List of Items Constituting CSR Categories (Adopted and Modified Version of CSEEE Index from Kansal et al.,2014 )
|
|
| 1. Promotion of education through donations/scholarships |
| 2. Summer or part-time employment of students |
| 3. Sponsorship of educational conferences, seminars and art exhibitions |
| 4. Sponsorship of public health projects/medical camps |
| 5. Aiding medical research |
| 6. Supporting national pride and government campaigns |
| 7. Supporting the development of local industries or community programmes and activities. |
| 8. Generation of jobs |
| 9. Establishment/maintenance of educational institutions |
| 10. Formulating vigilance committee to check corruption in the company |
| 11. Livestock/wasteland development |
| 12. Providing relief to victims of natural disasters |
| 13. Employee volunteerism for community work |
| 14. Rural development programme/adoption of villages |
| 15. Rainwater harvesting |
| 16. Improving road network |
| 17. Improving agricultural productivity |
| 18. Aids to sports |
| 19. Meals for the disabled/midday meals for children |
| 20. Special community related activities, e.g. opening the company’s facilities to the public. |
| 21. Adopting old age homes |
| 22. Mass marriage programmes |
|
|
| 1. Statements regarding reduction of pollutants, irritants, hazards and injuries |
| 2. Promoting employee safety and physical or mental health |
| 3. Compliance with health and safety standards and regulations |
| 4. Receiving a safety award |
| 5. Establishing a safety department/committee/safety policy |
| 6. Providing low cost healthcare for employees |
| 7. Disclosing percentage or number of minority employees in the workforce and/or in the various managerial levels |
| 8. Employment of differently abled people/ex-servicemen |
| 9. Training employees through in-house programme |
| 10. Giving financial assistance to employees in educational institutes or continuing education courses |
| 11. Establishment of trainee centres |
| 12. Staff accommodation |
| 13. Providing recreational, cultural and activities/facilities |
| 14. Providing the number of employees in the company and/or at each branch/subsidiary |
| 15. Providing per employee statistics, e.g. assets per employee and sales per employee |
| 16. Providing information on the company/management’s relationships with the employees in an effort to improve job satisfaction and employee motivation e.g.strikes/statements regarding cordial relations |
| 17. Improvements to the general working conditions—both in the factories and for the office staff |
| 18. Information and statistics on employee turnover |
| 19. Winning an award for being a good employer |
| 20. Awards given away for motivation of employees |
| 21. Stock option plans for the employees or employee share purchase schemes |
| 22. Retirement benefits |
| 23. Subsidized canteen |
| 24. Subsidized transport |
| 25. Feedback from employees |
| 26. Employee loan facilities |
| 27. Employee welfare fund |
| 28. Information about support for day-care, maternity and paternity leave |
| 29. Holiday benefits |
| 30. Disclosing percentage or number of women employees in the workforce and/or at various managerial levels |
|
|
| 1. Information on developments related to the company’s products, including its packaging, e.g. making containers reusable |
| 2. The amount/percentage figures of research and development expenditure for specific products and/or its benefits |
| 3. Information on the quality of the firm’s products as reflected in prizes/awards received |
| 4. Verifiable information that the quality of the firm’s product has increased |
| 5. Disclosing improved or more sanitary procedures in the processing and preparation of products |
| 6. Information on the safety of the firm’s product |
|
|
| 1. Pollution consciousness in conduct of business operations(capital, operating, R&D for pollution abatement) |
| 2. Statements indicating that the company’s operations are non-polluting or that they are in compliance with pollution laws and regulations |
| 3. Statements indicating that pollution from operations have been or will be reduced |
| 4. Prevention or repair of damage to the environment resulting from processing or natural resources, e.g land reclamation or reforestation |
| 5. Conservation of natural resources, e.g.recycling glass, metals, oil, water and paper; using recycled materials |
| 6. Receiving an award for environment programmes and policies |
| 7. Preventing waste/waste management |
| 8. Biodiversity/wildlife conservation |
| 9. Signatory status to agreements that commit the organization to consider the environment in its operations |
| 10. Water, environment studies/surveys |
| 11. Water reuse/reduction of water usage |
| 12. Use of environment friendly materials |
| 13. Claims that the company is water positive/targets to become water positive |
| 14. Discussion of environment management systems |
| 15. Donations for restoring historical buildings/structures |
|
|
| 1. Conservation of energy in the conduct of business operations/using energy more efficiently during the manufacturing process |
| 2. Use of alternate sources of energy |
| 3. Discussing the company’s efforts to reduce energy consumption |
| 4. Receiving an award for an energy conservation program |
| 5. Disclosing the company’s energy policies |
| 6. Voicing concerns about energy shortages |
| 7. Energy conservation/day week/month/awareness |
|
|
| 1. Setting Carbon emission targets |
| 2. Disclosing mode used for reducing carbon emission |
| 3. Statements showing that emissions within the limits |
| 4. Efforts to reduce carbon emissions |
| 5. Clean development management project (use of clean technology) |
| 6. Carbon emission management system |
| 7. Green building movement |
| 8. Statements that company is carbon positive |
| 9. Signatory to MOU with other corporate with regard to reduction of emissions |
| 10. Membership of United Nation Global Compact (UNGC) Programme |
|
|
| 1. Corporate objectives/policies: general disclosure of corporate objectives/policies relating to the social responsibility of the company to the various segments of society |
| 2. Receiving CSR rewards |
| 3. Social accounting system audit |
| 4. CSR or part of CSR as a theme on title page/part of company mission/vision statement |
| 5. Encouragement to implement official language |
| 6. Issuance of value added statements |
|
|
| 1. Best management practices |
| 2. Endeavour to maintain good investor relations |
| 3. Award for good communication/MIS |
| 4. Awards bestowed on board of directors |
| 5. Best leadership practices |
| 6. Best governed board/best managed company |
|
|
| 1. Fair business practices |
| 2. Most trusted company |
| 3. Most trusted brand/most preferred brand |
| 4. Most respected company/most admired company |
|
|
| 1. Handling material efficiently/best material management |
| 2. Award for best exporter/marketing excellence |
| 3. Most profitable equipment/manufacturing unit |
| 4. Best company award/best deal award |
| 5. Best in supply chain management |
| 6. Award for SME |
|
|
| 1. Excellence in financial reporting |
| 2. Awards constituted by accounting bodies like ICAI, ICWA |
| 3. Maintaining proper books of accounts/adherence to accounting standards |
| 4. Awards in the category – ‘Sustainability Reporting and Transparency’ |