



Abstract
Using a sample of Indian firms, we study the determinants of corporate cash holdings in an emerging economy. We study the excess and deficit cash holdings and assess the impact of leverage, accrual quality and working capital accruals on cash holdings. We find that after controlling for growth and size, leverage depends upon whether the firm holds excess or deficit cash. Levered firms with high profitability (measured via return on equity—ROE) hold less cash as compared to firms holding less than desired cash even if the profitability is high, and ample growth opportunities are available. We also find that while operating profit has no significant impact on cash holdings, volatility of sales does have a positive and significant impact. Firms having ready access to capital market (proxied by size and amount of leverage) are less likely to hold cash. Therefore, we argue that such firms can focus on value-generating activities without having to worry about liquidity. At the same time, smaller firms with good profitability (measured as return to equity) may also hold less cash as presented in this study.
Introduction
Cash is held by companies for various purposes. For instance, they need to maintain a certain level of cash to meet daily expenses, for precautionary purpose or for capital expenses. Although it is considered as an idle asset, it is the most vital one. However, past research indicates that firms do not hold optimal cash at a given point of time (Oler & Piconi, 2014; Ozkan & Ozkan, 2004). These studies find that firms hold excess cash in their balance sheets, and it affects the performance of the firms. For instance, Oler and Picconi (2014) report that one-year ahead, return on net operating assets (RNOA) is a decreasing function of deviations from optimum cash level of the firm. They argue that every firm has a target cash ratio as a percentage of total assets. When the actual cash holdings deviate from this level, it results in future reduction of RNOA. However, in most of these studies, excess cash holdings have been considered. The other part which has been studied less is the deficit cash holdings and their determinants. Kumar and Ranjani (2018) find that in the Indian context, cash holdings affect the dividend policy of the firms positively. As on 31 March 2016, the average cash balance of BSE 500 companies in India was about 7 per cent of total assets. Apple Inc., the makers of the legendary iPhones reported a staggering US$257 billion of cash and cash equivalents as at the end of second quarter of fiscal 2017. This was an increase of about 32 per cent over the same quarter of 2015. On 3 November 2016, the Moody’s reported that US non-financial companies rated by Moody’s will increase their cash holdings to US$1.77 trillion by the end of the year, from US$1.68 trillion at the end of 2015. Most of the cash that companies have generated and is being held overseas. Moody’s estimates that the amount of overseas cash will reach about US$1.3 trillion, or 74 per cent of total cash, in 2016. That’s up from an estimated US$1.2 trillion, or 72 per cent of total cash a year earlier. 1
Cash is held by all companies irrespective of their business type and characteristics. Generally, three reasons are assigned for corporate cash holdings—precautionary, speculative and transactional. While precautionary and speculative reasons are more to deal with future uncertainties, transactional deals with holding cash for meeting working capital requirements (WCRs). To a larger extent, a certain level of cash is required to meet the earlier requirements. However, studies have shown that companies hold more cash than what is required (Oler & Picconi, 2014; Ozkan & Ozkan, 2004; Subramaniam, Tang, Yue, & Zhou, 2011). A popular explanation of this is that large or excess cash provides a low-cost financing for companies. Studies in the past, which examine the manager’s preference to hold a large cash balance, find that raising external finance is more costly in the presence of asymmetric information between firms and external investors (Jensen & Meckling, 1976; Myers, 1977; Myers & Majluf, 1984).
In some studies, it is found that many public firms report substantial and growing cash level on their balance sheets (Bates, Kahle, & Stulz, 2009). Faleye (2004) finds that firms having insufficient cash can become the potential target for takeovers. Excess cash, he reports, enhances the ability of the target firm to defend itself against hostile acquisition. In a study by Dechow, Richardson and Sloan (2008), they find that firms that retain cash are more likely to spend it on net accruals in future periods and because of lower earnings persistence of accruals, any increase in cash could be an indicator of future investments on accruals that have diminishing returns to investments. They also report that increase in cash balance is more due to issue of equity and retained earnings as compared with issue of debt which are more used to fund operating expenditures that are capitalized on the balance sheet. These findings are substantiated in the study of Bates et al. (2009).
In their studies, Opler, Pinkowitz, Stulz and Williamson (1999) and Harford (1999) find that firms with stronger growth opportunities, high cash flow variability and limited access to capital markets hold more cash. At the same time, holding more cash holdings gives rise to agency problems as excess cash can be diverted far more easily to generate private benefits (Lie, 2000; Myers & Rajan, 1998). The problem is further aggravated by information asymmetry between the manager of the firm and the shareholders. Information asymmetry may therefore be an important determinant of corporate cash holdings (Ferreira & Vilela, 2004; Ozkan & Ozkan, 2004). One way by which the problem of information asymmetry can be mitigated to a large extent is the quality of financial reporting (Bushman & Smith, 2001; Verrecchia, 2001). A good quality financial report, notably the annual and quarterly reports, ensures reducing the trust deficit among the stakeholders and reduces the negative impact of information asymmetry (Chung, Kim, Kim, & Zhang, 2015; Francis, LaBond, Olsson, & Schipper, 2005). We argue that for a firm with high (low) degree of information asymmetry, the cost of external financing will be high (low) and, therefore, they are likely to maintain a high (low) level of cash. In accounting literature, various proxies have been used to measure accounting quality and one of the widely used measure is the accrual quality (Dechow et al., 2008; Francis et al., 2005).
A firms’ cash holdings depend on various factors like the leverage, growth prospects, previous cash holdings and so on. For example, Maheshwari and Rao (2017) find that cash holdings are negatively affected by changes in working capital, research and development expenditure and leverage. In her paper, Dechow and Dichev (2002) argue that cash holdings are affected by accrual quality as well. A firm with high accrual quality needs to maintain a low level of cash as compared to firms with low accrual quality. However, there has been little research on the effect of accruals and their quality on the firms’ cash holdings. In this article, we investigate this aspect also and address the issue of effect of accrual quality on firms’ cash holdings.
This article contributes to our understanding of nature and determinants of corporate cash holdings in an emerging and fast-growing economy and how the level and quality of accruals affect a firm’s cash holdings. While previous studies have paid attention to excess cash holdings, we also consider firms with deficit cash holdings in an emerging economy. We add to the existing body of literature through our understanding of the determinants of excess and deficit cash holdings and how variables like leverage, size, working capital accruals and so on are important in explaining the cash holdings of Indian firms. In our knowledge, no study has been attempted to establish the relationship between accruals quality and corporate cash holdings of an emerging market.
The article is organized as follows: The second section discusses the motivation for the study. The third section outlines the objective of the study. The fourth section provides the theoretical framework. The fifth section defines the methodology and sample description. The sixth section presents and discusses the results. The seventh section concludes the study. The eighth section identifies future scope of research.
Motivation for the Study
As one of the fastest growing economies in the world, India deserves attention so far as our understanding of corporate cash holdings is concerned. Since the last 10 years, India has averaged about 7 per cent in GDP growth and as per estimates of the International Monetary Fund (IMF). According to World Economic Outlook Database, 2018 (IMF) India will grow at about 7.7 per cent and 7.9 per cent in 2019 and 2020, respectively. 2 Recently, it has surpassed France to become the fifth largest economy in the world with the GDP size of US$2,597 trillion and is marginally behind the UK whose economy is US$2,622 trillion. With such a fast pace of quality growth, we expect rapid changes in the way the corporates function that now have easy access to cheaper capital, low labour cost and huge spending capacity of consumers fuelling demand for goods and services. Further, in its report in December 2017 on Asian Equity Strategy Report titled: Asia’s Financial Acceleration—Moving Centre Stage, Morgan Stanley predicts that the market capitalization of Indian equity market is set to increase from US$2.3 trillion in 2017 to US$6.1 trillion by 2027, clocking a compound annual growth rate (CAGR) of 10 per cent and making it the fastest growing country in Asia in terms of equity market capitalization. With such a massive size of the economy and faster growth, it will be interesting to understand the determinants of corporate cash holdings of firms in India.
Objective of the Study
The objective of this study is to study the determinants of excess and deficit cash holdings of Indian firms. Apart from the determinants which have already been established by previous studies, our aim is also to understand the effect of accrual quality on corporate cash holdings.
Theoretical Framework
In a world of no transaction cost, holding of cash and cash equivalents is irrelevant as firms can raise capital from the market (banks and/or capital market) at zero cost. In other words, a firm can raise capital by issuing equity or debt whenever there is a need without having to worry about current cash holdings, as the costs related to issuing equity or debt are zero. However, in reality, there is a transaction cost with respect to raising new capital through equity, bonds or through banks. It is therefore imperative for firms to hold a certain level of cash depending on the type of industry the firm is in, demand for the product, macroeconomic conditions, variability of cash flows and so on. Opler et al. (1999) suggest that, for a firm, the marginal cost of holding cash should equal its marginal benefit. Holding excess cash may not be a value-increasing activity while holding less cash can be costly, especially when the firm is faced with positive net present value (NPV) projects. In the presence of information asymmetry between managers and shareholders of a firm, managers may invest excess cash in value-destroying activities like investment in poor projects (with negative NPVs), uneconomical and unjustifiable mergers and acquisitions. Under these conditions, managers must consider to use the excess cash either for share repurchase (assuming personal tax on capital gains is less than dividends) and repayment of debt. Dechow et al. (2008) argue that future spending on inventory and plant, property and equipment are a convex function of positive change in cash balances. As accruals have lower-earning persistence, any increase in cash balance may signal investment on operating assets which have a diminishing marginal return on investment.
In case of leverage, firms with high leverage face high monitoring costs in the form of protective covenants available to the providers of debt capital and one of them is that firms invest in positive NPV projects. Idle cash is equated with non-operating asset until it covers the amount of debt and interests. In other words, suppose a firm holds US$100 worth of cash and a debt of US$100, then the risk of default is high as firms will have to meet other operating and non-operating expenses apart from debt servicing. Under such circumstances, providers of debt capital will like the firms to invest in positive NPV projects which generate additional future cash flows and which may result in the reduced probability of default. Therefore, following the financing hierarchy theory of Opler et al. (1999), firms find it expensive to raise capital by issuing equity and when they require funds they prefer debt. If the firm has excess cash, it will prefer to repay the existing debt. Similar arguments can be forwarded for net working capital (NWC). Technically, NWC is an investment in operating accruals and therefore firms with high NWC are expected to have lower cash balance. Any excess cash will result in investment in operating accruals like inventory, plant, property and equipment or to repay the debt.
Traditionally, it has been established that cash is held by firms for precautionary, speculative and transaction purposes (Baumol, 1952; De Alessi, 1966; Whalen, 1966). Later, few researchers have tried to find other reasons of cash holding wherein cash holdings have been found to impact NWC, cash flow (Ogundipe, Ogundipe, & Ajao, 2012), investment opportunities, dividend payout (Kim, Kim, & Woods, 2011), firm structure, ownership structure (Guney, Ozkan, & Ozkan, 2007) and corporate governance (Kuan, Li, & Chu, 2011). There are few other studies which assess the impact of an external factor like fiscal policy (Sánchez & Yurdagul, 2013) on corporate cash holdings. Many studies have also examined whether cash holding is affected by various firm-specific characteristics like firm value (Martínez-Sola, García-Teruel, & Martínez-Solano, 2013), auditor pricing (Gleason, Greiner, & Kannan, 2017), stock returns, market value (Pinkowitz & Williamson, 2007) and other firm performance measures. Since it is evident that cash holding changes have an effect on firm characteristics including performance, a few studies like Kuan, Li and Liu, 2012; Venkiteshwaran, 2011, have tried to come up with models for optimal cash holdings. These studies also suggest that firms tend to target the optimal level of cash holding and adjust their holdings towards this optimal level.
A large number of studies focus on the excess cash holding and have examined how excess cash impacts the firm. For example, Simutin (2010) finds evidence that excess cash has negative effect on stock returns. Similarly, Oler and Picconi (2014) too find that one-year-ahead abnormal stock returns are decreasing in the level of deviation from the estimated target, with results being most pronounced for firms with insufficient cash. Other studies have examined the relationship between cash holding and working capital level of firms. Autukaite and Molay (2011) have stressed that the researchers should explore the relationship between cash holdings and working capital management on the one hand and a company’s value on the other hand. In case of working capital, there are two broad categories of studies. On the one hand, there are studies like Lian, Sepehri and Foley (2011), Ogundipe et al. (2012) and so on, which suggest that working capital level has effect on cash holdings; on the other hand, there are studies suggesting an opposite relationship. For example, Hill, Kelly, and Highfield (2010) relate the WCR ratio to operating conditions and financing ability. Similarly Lozano (2011) found that cash holding levels have implication on firm’s financial decision including investments in short-term (SR) assets. Further, in uncertain business conditions and in presence of competition, firms are under pressure to report an increase in sales (and earnings) or at least sustain a desired level of sales without a matching cash inflow. This is particularly applicable to small firms which are vulnerable to unexpected market and demand conditions.
Methodology and Sample
We draw our sample from Prowess database maintained by Centre for Monitoring Indian Economy (CMIE). The data period is from April 2010 to March 2017 and consists of all non-financial companies listed on the Bombay Stock Exchange (BSE). Following past studies, we exclude firms in the financial, public utilities from our study as these are highly regulated, and they work in tight supervisory environment. This process generated original firm-years of 11,175 observations and after excluding observations with missing values, we are left with 8086 firm-years. All the continuous variables are winsorized at 5 per cent level to achieve normality and to remove outliers. Industry-wise classification is shown in Table 1.
In this article, we focus on ST accruals like receivables, payables, current portion of ST debt, inventory and other current assets and liabilities. This is because we assume that ST accruals will reverse in one operating cycle and as such is a deciding factor for the cash holdings decision of the firm. We also look into the effect of cash holdings on the future operating profitability measured as earnings before interest, depreciation and amortization (EBITDA) and taxes. We follow the work of Subramaniam et al. (2011) for measuring the excess/deficient cash holdings and Oler and Picconi (2014) for measuring profitability.
Following Subramaniam et al. (2011), we calculate excess and deficit cash as follows:
First, we calculate imputed cash or expected cash as a percentage of total assets:

Industry-wise Sample Classification

where, TAfirm is the total non-cash assets of the firm.
Denote actual cash holding of the firm as Ci, then if
We define cash from operations (CFO) as earnings after interest, taxes and dividends but including depreciation and amortization less total accruals, deflated by total non-cash assets. We use the modified Jones model proposed by Dechow et al. (1995) to estimate total accruals (TotAccr) as shown in the following:

In the above equation, TA is the total average non-cash assets; ΔRev is the change in revenue; ΔAR is the change in receivables; PPE is plant, property and equipment; and εit is the error term.
Size is measured as natural logarithm of total assets. Leverage is calculated as ST debt plus long-term debt divided by total non-cash assets. For accrual quality, we use the definition of Dechow and Dichev (2002). We therefore regress change in non-cash working capital on current, past and future cash flows from operation and extract the R2 for each firm-year. If the calculated value of R2 is more than the industry average, then we take it as a measure of good accrual quality and assign a value of 1, else 0. NWC is measured as change in the difference between non-cash current assets and current liabilities. In order to measure growth prospects of a firm, we use Tobin’s Q as the proxy and is calculated as market value of equity plus book value of debt-less book value of equity divided by book value of total assets. The operating profit (as a measure of profitability) is taken as EBITDA and is calculated as net earnings (PAT) plus after-tax interest and depreciation and amortization and finally the ROE is calculated as profit after tax divided by last year’s book value of equity.
Following Opler et al. (1999) and Harford et al. (2008), we measure cash holding as the ratio of cash and cash equivalents to non-cash total assets.
Dechow and Dichev (2002) argue that accruals are of high quality if their reversal can be forecasted within one operating cycle. We follow their approach model to measure accruals quality. They suggest a model in which change in working capital accruals is regressed on current, past and future CFO. A large explained portion (measured by R2) indicates good quality accruals. While it is true that good accrual quality firms are likely to have lower cash balance, that is expected only when the accruals reverse in the near future However, due to business exigencies and uncertainties, forecasting reversal of accruals with certainty may not be possible, and in case the reversal is delayed or does not happen despite having a good quality, the cash flow to the firm gets affected.
Control Variables
In order to deal with firm heterogeneity, we use control variables. First, growth opportunities of firms have a positive impact on cash levels. High-growth firms have larger information asymmetry (Myers & Majluf, 1984; García-Teruel et al., 2009). We proxy growth opportunities by Tobin’s Q, which is measured as market value of debt plus book value of debt divided by book value of assets. Further, we also control for size of the firms as smaller and less diversified (bigger and diversified) firms have lower (higher) information asymmetry. Size is measured as natural logarithm of total assets. We use a panel regression approach besides ordinary least square (OLS) approach for various regressions according to the following equation:

In the above equation, αk are the set of explanatory variables, ai are the firm’s fixed effects which vary across firms but assumed to remain constant over time, and εit is the error term.
Analysis
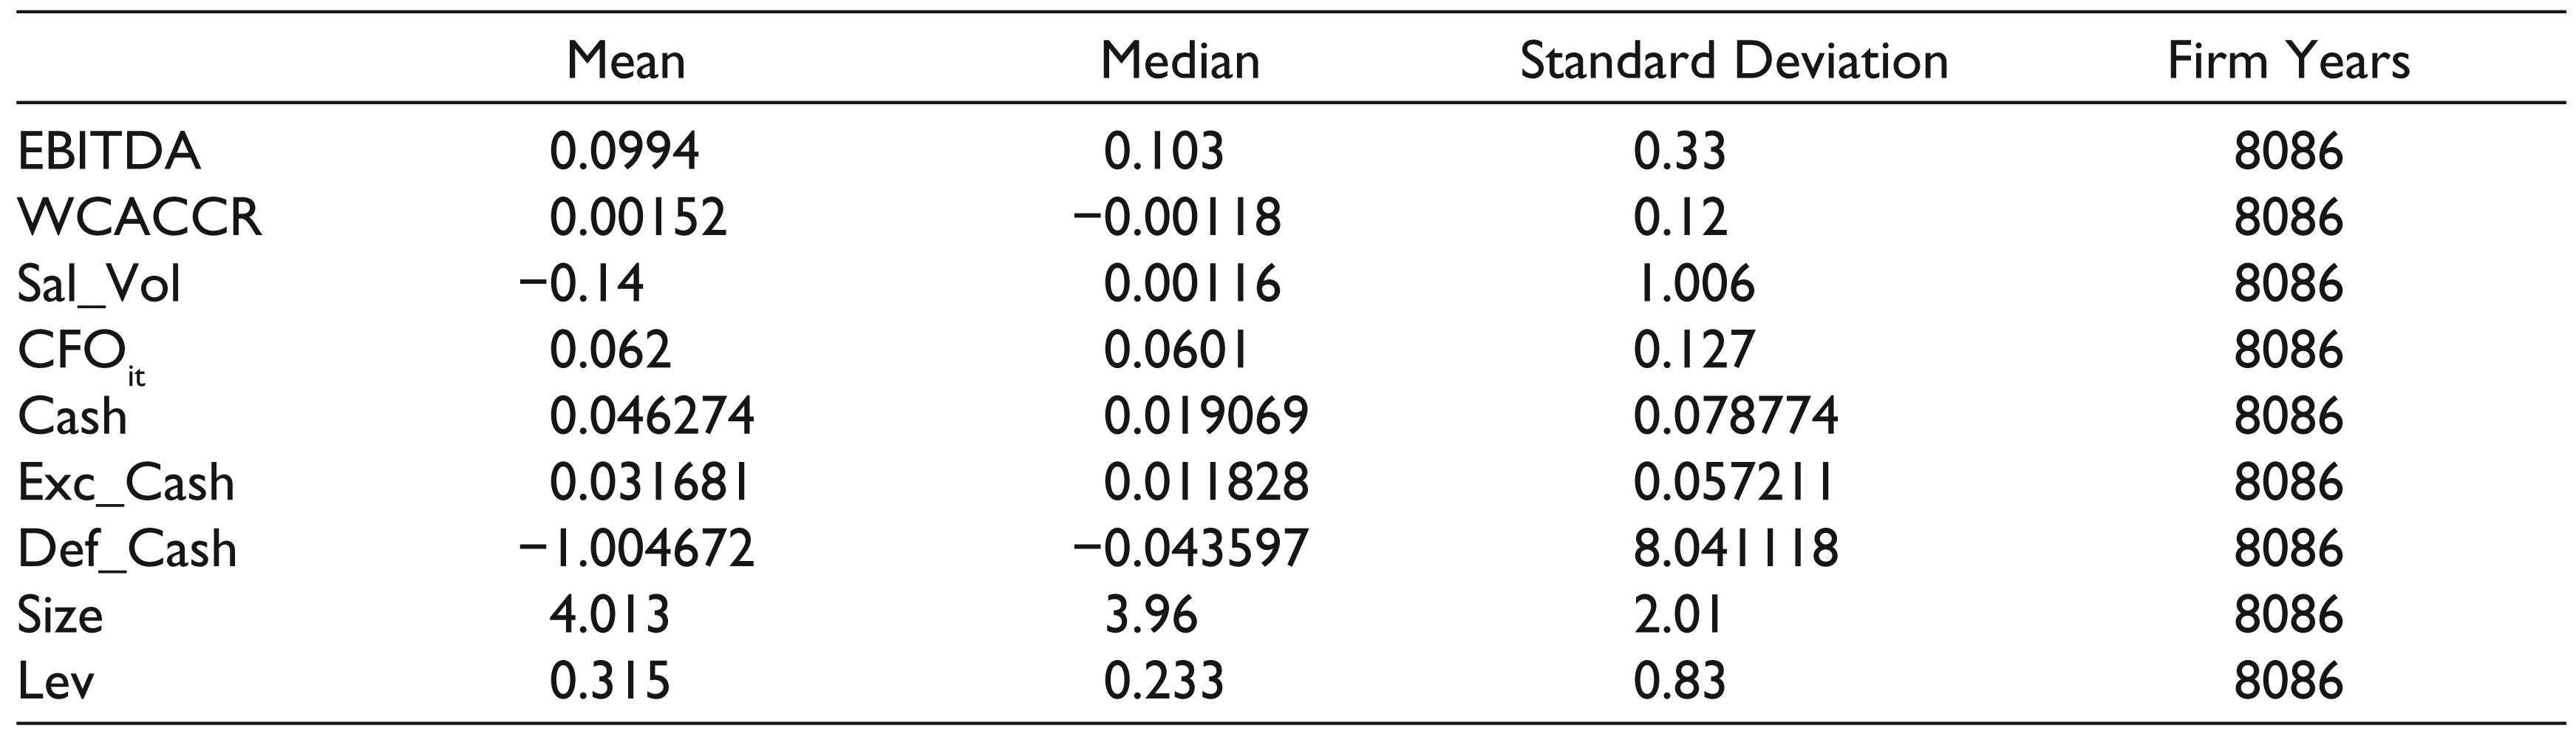
Table 2 presents the descriptive statistics of the variables. All the variables, except sales volatility (Sal_Vol) and size, are deflated by non-cash average total assets. Size is measured as natural logarithm of total non-cash assets. The mean and median operating profits are about 10 per cent of total assets with a standard deviation of 0.33 meaning that there is quite variation in the profit of the sample firms. The operating cash flows have an average of about 6 per cent of total non-cash assets with a standard deviation of 0.127 and seem that it is more or less stationary across sample firms. The average of log of total assets, the measure of firm size is 4.013 which translates to about US$55.3 million and the smallest company has an asset base of about US$0.001 million. The average debt is about 31.5 per cent (median is about 23.3%) of total assets. In other words, on an average, about one-third of the non-cash assets of the sample firms are financed with debt. When we look at the cash holdings as a percentage of non-cash total assets, we find that on an average, Indian firms hold about 5 per cent of cash with a significant variation among firms. The median excess cash holdings are about 1.18 per cent with a maximum of 87 per cent. Excess cash has been calculated after taking into account the firm’s cash requirements for its operating and growth activities. Therefore, the excess cash present in the balance sheet might be because of speculative motive of the firms. The problem is even more acute when we look at the deficit cash holdings, where the median shortfall is about 5 per cent of total non-cash assets, which is approximately US$2.75 million.
In Table 3, we report the accrual quality based on the quartiles of the firms. When we look into the accrual quality of Indian firms industry wise, we find that, except textile industry, firms in all other industries have low-to-moderate R2 values indicating poor quality accruals. We analyse the 25th, 50th and 75th quartiles by sorting according to cash holdings as a percentage of total non-cash assets. We observe that the coefficients on current cash flows varies from −0.109 (t-value of −1.432) to −0.188 (t-value of −3.002). The median coefficient on current cash flows is −0.0076, while that on the past and future cash flows are 0.009 and 0.0017, respectively. These results are consistent with Dechow and Dichev (2002) who report similar results for US firms. For firms in the upper quartile, past cash flow is an important determinant of accrual quality and to an extent the expected future cash flows, whereas the accrual quality of firms in the lower quartile are more determined by future cash flows only.
Descriptive Statistics
OLS Regression Results
ΔWCACCR it = φ0 + φ1 CFO it + φ2 CFOit-1 + φ3CFOit+1 + ε it
ΔWCACCR it is measured as change in non-cash ST operating accruals, CFOs are the operating cash from operations obtained from the cash flow statements of each firm across the sample period. All the variables are deflated by non-cash total assets.

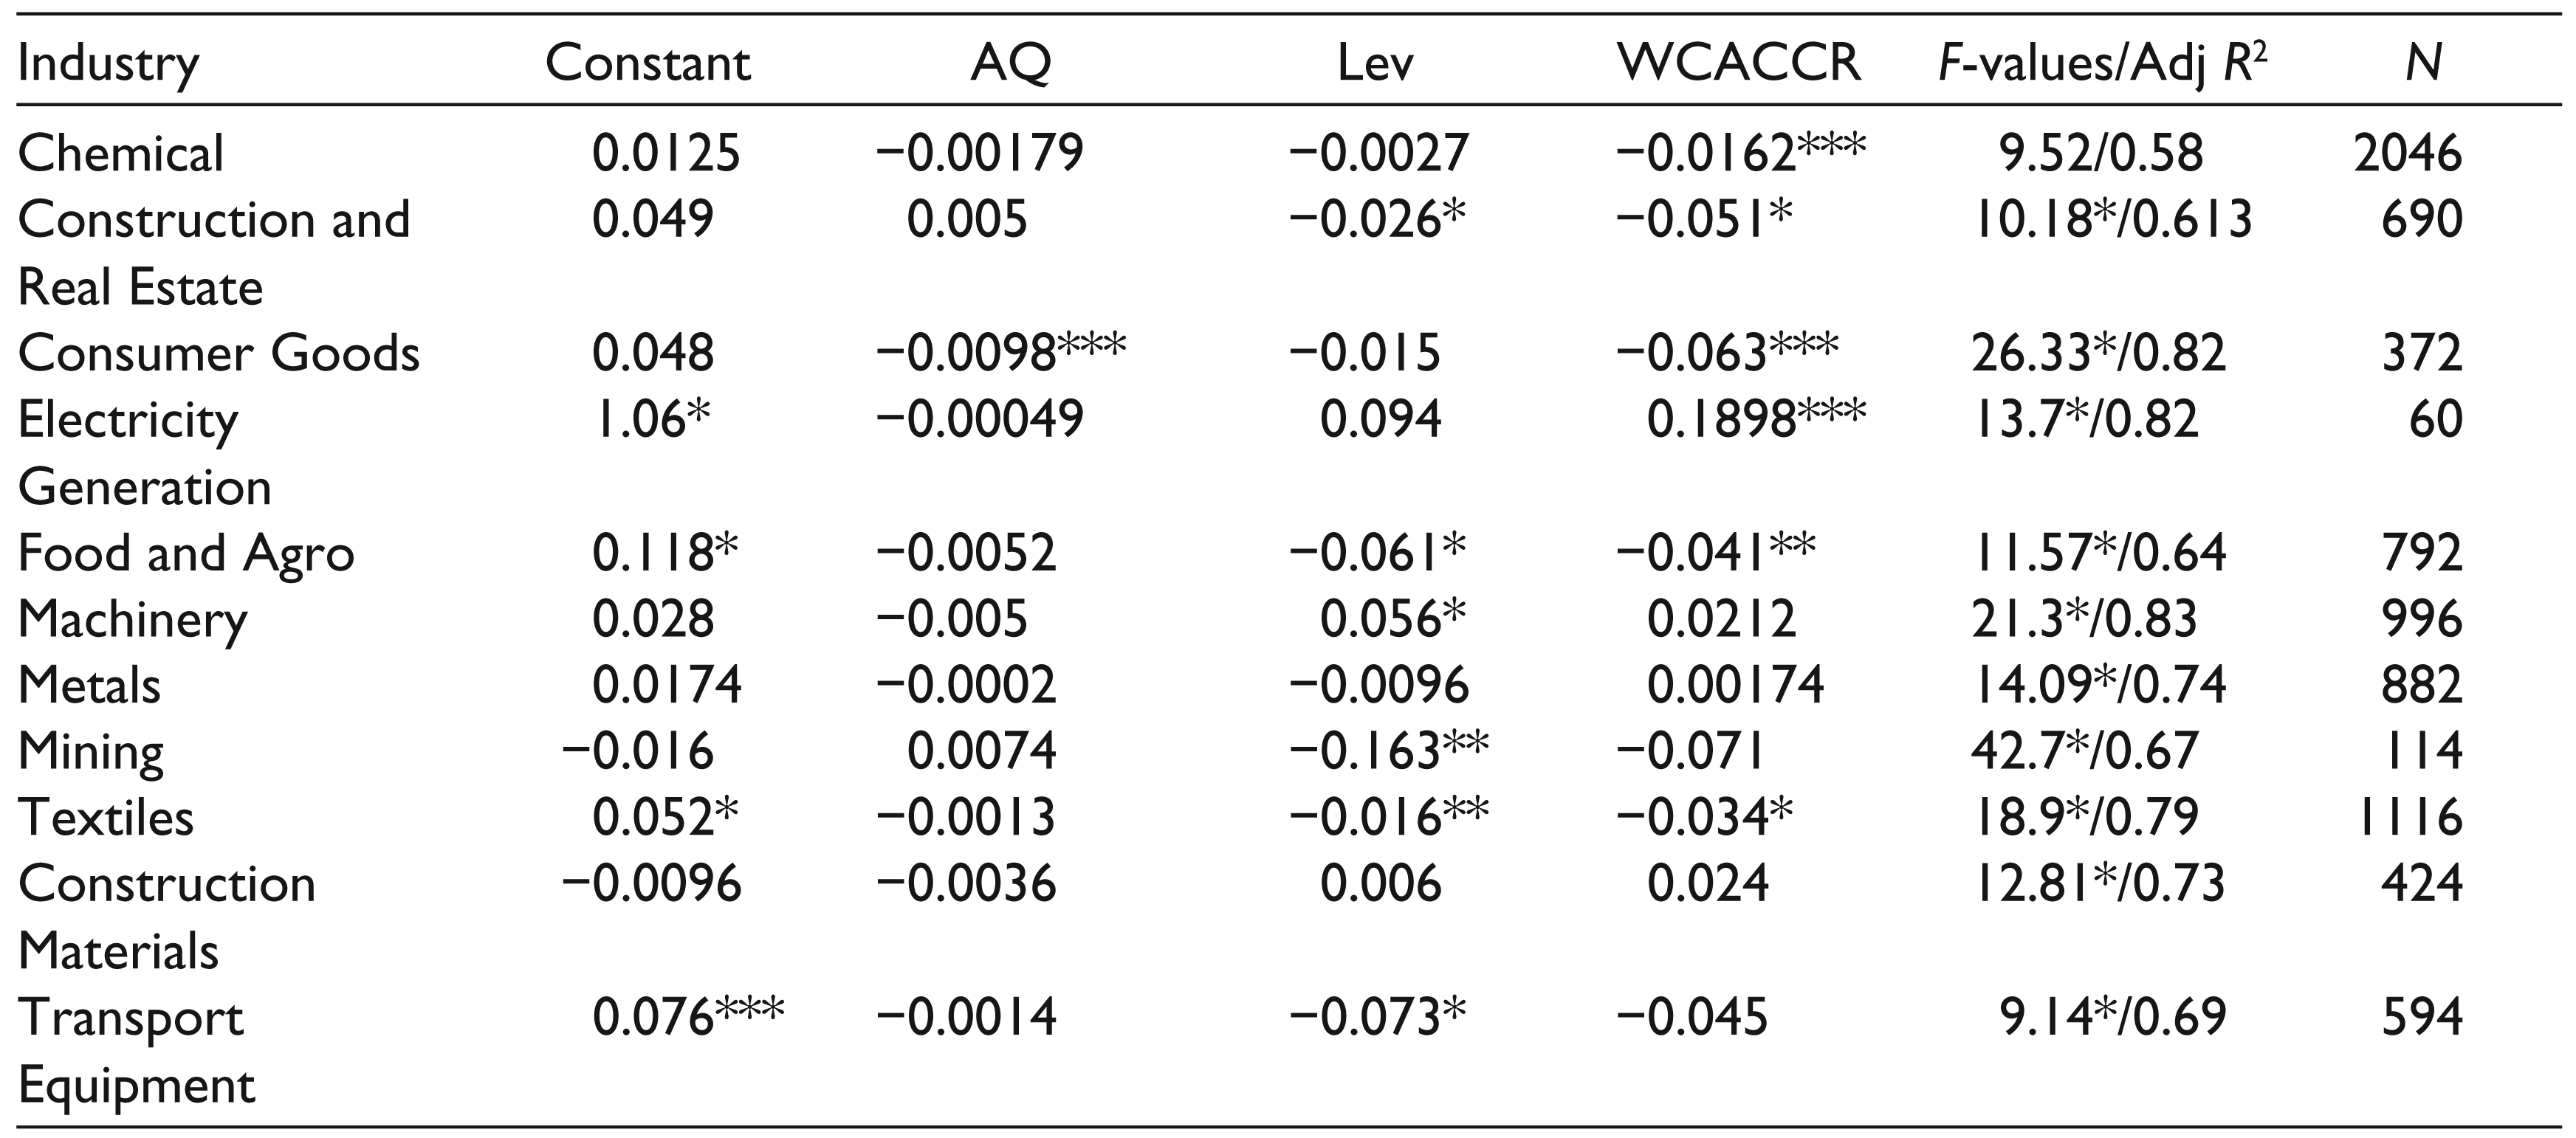
Table 4 presents the regression of cash holdings on accrual quality, leverage and NWC according to industry. We observe that although individually the regressors may not explain cash holdings of the firms, they jointly explain the cash holdings of the firms. We also find that leverage is the most important determinant of cash holdings followed by NWC. Both of them load negatively on cash holdings and as such our findings are consistent with Opler et al. (1999). This explains heterogeneity in cash holdings across industry. However, in India, cash holdings are not affected by accrual quality, and it is more determined by debt level and working capital requirements.
Fixed Effect Regression Results: Industry-wise Determinants of Cash Holdings
Cash
it
= μ0 + μ1 AQ
it
+ μ2 Lev
it
+ μ3 WCACCR
it
+
Cash is measured as the sum of cash and bank balance as a percentage of non-cash total assets. AQ is the accrual quality measured as described in Dechow and Dichev (2002). Lev it is the leverage measured as sum of long-term and ST interest bearing debt. WCACCR is the non-cash ST operating accrual measured each year. We use size which is measured as natural logarithm of total assets and Tob_Q measured as market value of equity plus book value of debt minus book value of equity as control variables. All the variables are deflated by non-cash total assets.
In the study of Oler and Piconi (2014), they find that excess cash holdings determine future profitability. They use RNOA to define profitability. Our measure of profitability is defined by ROE, which is the return to the equity shareholders. We first sort the firms according to ROE and classify them under two categories—high ROE and low ROE. We classify firms above the median ROE as high ROE firms and below the median as low ROE firms (Table 5). We find that after controlling for growth and size, levered firms hold less cash in both the high- and low-ROE category. This tendency is more prominent in the firms with low ROE. In other words, levered firms having low ROE maintain less cash as compared to high-ROE firms. This may be due to excess monitoring of these firms by shareholders, and that the firms are under increased pressure to invest in value-adding projects and investments. Increased pressure on the managers of these firms may lead them to invest in value-destroying projects, reducing the return to the shareholders in the form of profitability.
Regression Results of High-ROE and Low-ROE Firms
Cash
it
= ψ0 + ψ1 AQ
it
+ ψ2 Lev
it
+ ψ3 WCACR
it
+
Cash is measured as the sum of cash and bank balance as a percentage of non-cash total assets. AQ is the accrual quality measured as described in Dechow and Dichev (2002). Lev it is the leverage measured as sum of long-term and ST interest bearing debt. WCACCR is the non-cash ST operating accrual measured each year. All the variables are deflated by non-cash total assets. Tobin’s Q and Size are the control variables.

A firm with both low and high ROE is found to invest more in NWC, and it seems to be more reasonable for these firms. Investment in working capital is required to keep the business running and that is independent of firm size although the investment in NWC is less for low-ROE firms as compared to high-ROE firms.
Table 6 presents the regression results of cash holdings for three models. Model 1 evaluates the impact of accrual quality, leverage, lagged cash holdings and firm size on its cash holdings. We observe that while leverage and accrual quality do not have significant impact, the lagged cash and firm size affect the current year’s cash holdings. Last year’s cash holdings have a positive impact on current year’s cash holdings. This can be attributed to precautionary motive of firms to hold cash to meet future and uncertain expenses. A firm holding excess cash is likely to continue holding high cash balance. In Model 2, we find that when working capital accruals and operating profit are taken together with size, leverage and accrual quality, current cash holdings are not affected except by size. While in Model 3, as expected, we find that firms with high volatility in sales hold more cash and vice versa. Higher sales volatility induces the firms to hold more cash to meet expenses.
Regression Results
Model 1: Cash it = λ0 + λ1 Cashit-1 + λ2 AQ it + λ3 Lev it + ε it
Model 2: Cash it = λ0 + λ1 AQ it + λ2 Lev it + λ3 WCACCR it + λ4 EBITDA it + ε it
Model 3: Cash it = λ0 + λ1 Cashit-1 + λ2 Sal_Vol it + ε it
Cash is measured as the sum of cash and bank balance as a percentage of non-cash total assets. AQ is the accrual quality measured as described in Dechow and Dichev (2002). Lev it is the leverage measured as sum of long-term and ST interest bearing debt. Size is the measured as natural logarithm of total assets; WCACCR is the non-cash ST operating accrual measured each year. EBITDA is the operating profit measured as net profit plus depreciation and amortization plus interest paid. Sal_Vol is the volatility of sales measured as the deviation of sales of a firm from the median sales of the sample. All the variables are deflated by non-cash total assets.

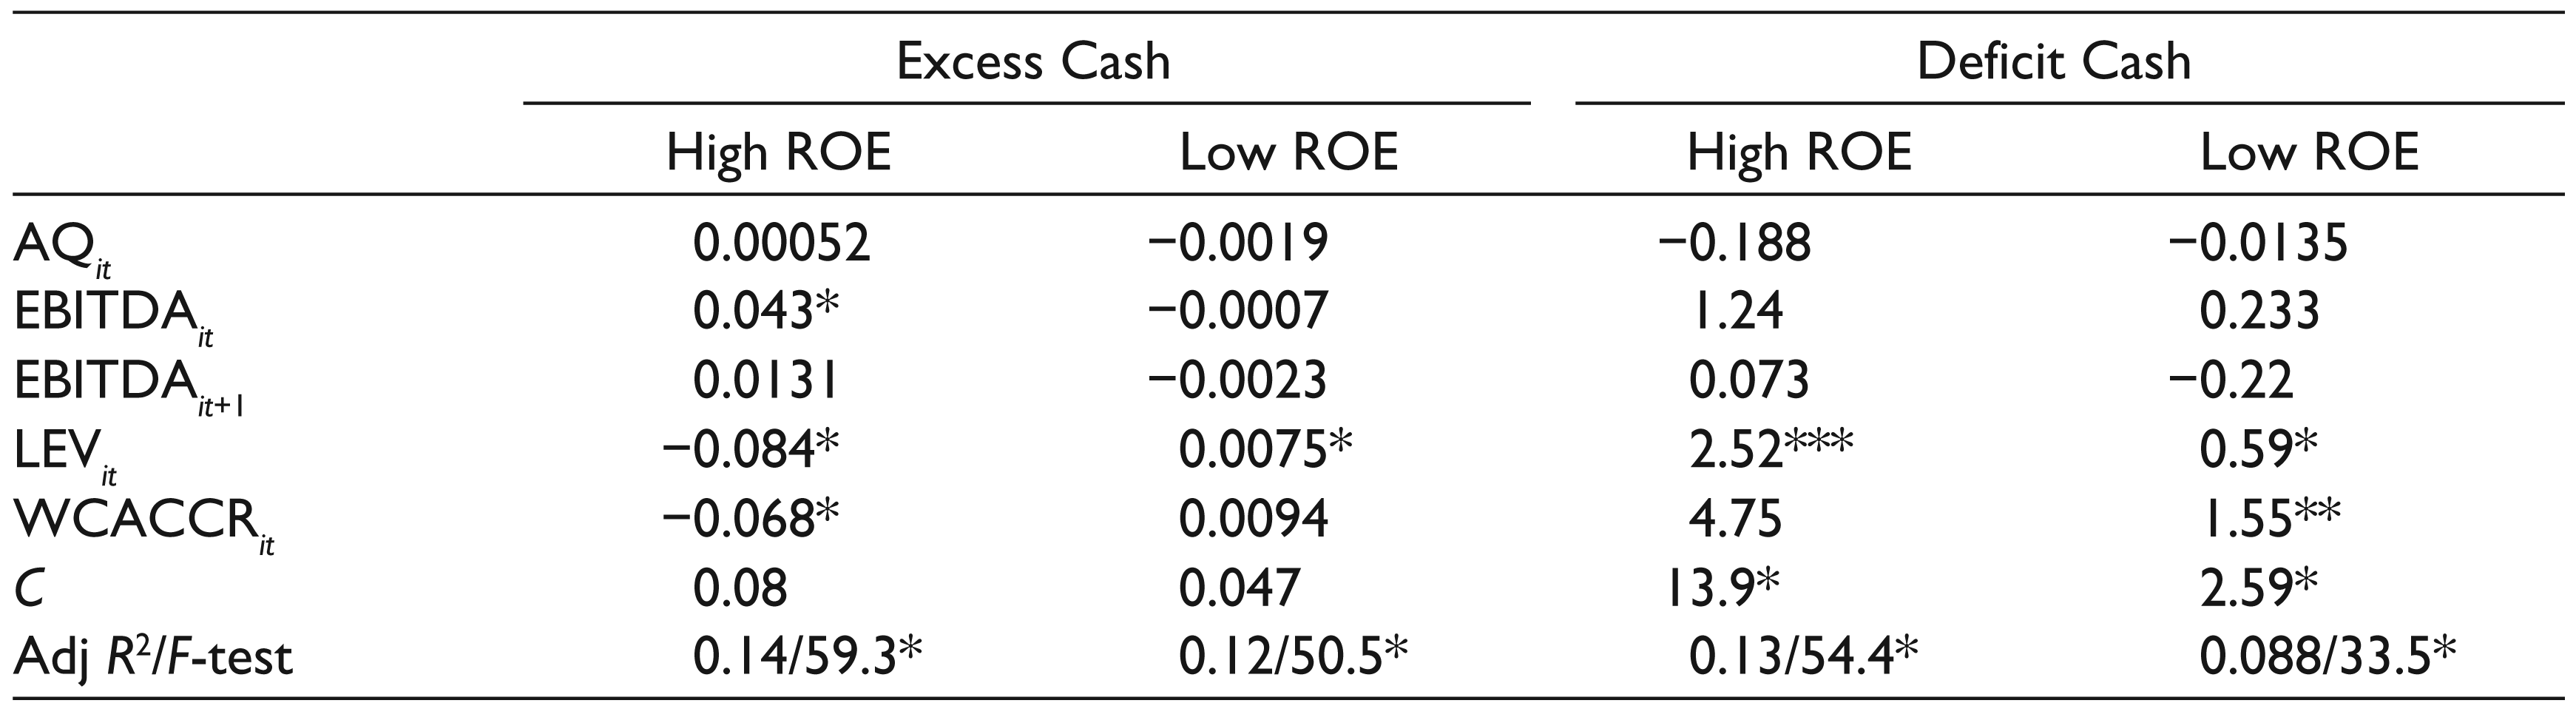
In Table 7, we report the results of cash holdings of firms which have excess cash and deficit cash at time t and based on these, we classify the firms with high/low ROE. It is observed that firms with excess cash and high ROE are positively affected by current year’s operating profit. This means a good portion of this profit is persistent as it is represented by equivalent cash inflows. At the same time, these firms, if levered, hold less cash. This is not unexpected as high-ROE firms have better investment avenues and positive NPV projects, and they will be expected to hold less cash even though they are levered. On the other hand, leverage is positively related to firms with deficit cash, even if it is a high-growth firm as is reflected in the positive loadings of leverage in firms with deficit cash. One of the striking features of these results is the fact that size is negatively related with the current cash holdings irrespective of whether the firm has excess or deficit cash. Similarly, firms with low ROE have cash which is an increasing function of leverage. So far as investment in working capital is concerned, firms with excess cash and high ROE maintain less cash. Intuitively, this may be because these firms expect no immediate shortfall of cash to meet their debt obligations. This, however, does not hold for firms holding deficit cash.
Regression Results
Cash
it
= λ0 + λ1 AQ
it
+ λ2 EBITDA
it
+ λ3 EBITDAit+1 + λ4 Lev
it
+ λ5 WCACCR
it
+
Cash is measured as the sum of cash and bank balance as a percentage of non-cash total assets. AQ is the accrual quality measured as described in Dechow and Dichev (2002). Lev it is the leverage measured as sum of long-term and ST interest bearing debt. Size is the measured as natural logarithm of total assets; WCACCR is the non-cash ST operating accrual measured each year. EBITDA is the operating profit measured as net profit plus depreciation and amortization plus interest paid. All the variables except Size are deflated by non-cash total assets.
Conclusion
We study the determinants of cash holdings of firms in an emerging market. While previous researches have focused on determinants of cash holdings as a whole, we study the implications for firms having excess and deficit cash. Although excess cash holdings have received considerable attention of researchers, very few studies are available which focus on deficit cash. We fill this gap by studying the determinants of both excess and deficit cash holdings by firms in India. We find that in contrast to previous researches, accrual quality does not have significant impact on corporate cash holdings. Size, measured as natural log of total assets, is a significant determinant of cash holdings. Also, we find that the impact of leverage has different impact on cash holdings under different conditions. For instance, for firms with high ROE, cash holding is a decreasing function of leverage. We also conclude that firms with excess cash holdings and high growth opportunities invest less in ST net accruals. This will ensure value creation for the shareholders in the medium to long run. Further, firms with high uncertainty (measured by standard deviation of sales) in expected future sales maintain high cash balance in order to deal with future exigencies and uncertainties. This study has managerial implications as the insights will help the managers to decide upon an optimal cash level with reference to the firm’s profitability and future growth prospects.
Future Scope of Research
Although this study identifies the determinants of excess and deficit cash holdings in India, we have not controlled for ownership pattern in these firms. As most of the companies in India are either family controlled or have significant share in these companies, it will be quite interesting to know the cash holdings of these firms, and further studies may be carried out in this direction.
Footnotes
Declaration of Conflicting Interests
The authors declared no potential conflicts of interest with respect to the research, authorship and/or publication of this article.
Funding
The authors received no financial support for the research, authorship and/or publication of this article.
Acknowledgements
The authors are grateful to the anonymous referees of the journal for their extremely useful suggestions to improve the quality of the article. Usual disclaimers apply.