



Abstract
This study examines the determinants of non-interest income and the implications of non-interest income for bank risk-return trade-offs, medium-term profitability and profit variability. Over a number of specifications, we find that cost-efficiency is key to generating and profiting from non-interest income as are volume of loans generated and liquid assets held by a bank. Large banks may also profit from non-interest income but do not seem to rely on it for their profits. We do not find non-interest income detrimental to bank solvency in our sample, perhaps because the nature of non-interest income of our sample banks may not expose bank capital to significant risk of loss. This could change as the economy and financial services demand increases in sophistication.
Introduction
Banks’ core business is intermediation, receiving deposits and providing loans. While this is the bulk of what banks still do, the modern economy needs other services related to payments. When banks provide these other services, they generate non-interest income. In this study, we analyse the determinants and impact of non-interest income on banks’ performance in Ghana. Today’s banking industry is largely the result of policy changes brought about by the financial sector liberalization reforms of the 1990s. In the past 10 to 15 years, Ghana’s banking sector witnessed the entry of a number of de novo banks, both international and domestic. Anecdotal evidence show that competition for deposits and price-competition in lending have both increased. A noticeable change was decrease in the minimum account balances customers were hitherto required to maintain both savings and current accounts. Competition for funds led to changes in attitudes to paying interest on savings account balances.
Another consequence of the growing number of banks is that banking as usual is no longer adequate to provide good returns for bank shareholders. Complementing interest income with non-interest income has become essential. Non-interest income refers to income from fees and commissions, such as commission on turnover, fees for remittance services, fees on custodial services and commissions from transaction advisory services. Other sources of non-interest income in the Ghanaian banking industry include income from foreign exchange transactions, bid-bond guarantees, domestic money transfer services and ATM fees, among others. These services may require investment in dedicated resources or the leveraging of existing assets. In this study, our aim is to examine the bank characteristics that are associated with non-interest income generation. A related question is, which bank characteristics are indicative of banks that profit the most from non-interest income generated.
Increasing the proportion of non-interest income in a bank’s revenue mix has risk-return implications. A bank that adds a number of channels of non-interest income is expanding its portfolio business and sources of income. Non-interest income business has the potential to put bank capital at risk of loss. Aggregate bank profitability also stands to be affected by variations in the non-interest income lines of business. In relation to these, we also test for the association between bank non-interest income generation and the profitability and variability of banks’ profits. We also test for the association between expanding non-interest income and the risk of loss of bank capital. Moreover, canonical finance theory holds that diversification of banking business is beneficial to shareholders if it results in better reward-per unit risk (Sharpe ratio) for a bank’s portfolio of businesses. We test this implication by considering the association between non-interest income and the Sharpe ratio of bank profits.
As background for our study, we present in Figure 1 the trends of the respective proportions of non-interest income and interest income in the revenue structure of banks in Ghana over the periods from 1999 to 2015. The graph shows that non-interest income is settled at close to about 20 to 30 per cent of the average bank’s revenue mix. This indicates that non-interest income is a key feature of bank revenue mix in Ghana. Our questions are, therefore, important in the light of the lack of understanding of the implications of non-interest income for Ghanaian bank investors. Our empirical results show that bank characteristics that drive the pursuit of non-interest income are bank size, liquidity, cost-efficiency and growth in loans and deposits. For the risk implications of non-interest income, we do not find a significant association between non-interest income and the variability of bank profits and measures of bank risk of solvency. That is, non-interest income does not influence bank risk in our sample. But, this could be because the non-interest income business of banks in our sample does not expose bank capital to risk of loss.

We believe our results enrich our understanding of the determinants of non-interest income and its implications for bank risk and performance. For instance, in addressing the principal concerns of our study, we attempt to reconcile the different methodological choices in the studies of Tennant and Sutherland (2014), DeYoung and Torna (2013), Nguyen (2012) and DeYoung and Rice (2004) in studying the determinants of non-interest income. This exercise shows that how non-interest income is scaled in our regressions has implications for the bank characteristics associated with non-interest income. In the context of the Ghanaian economy, we provide further insights over that of Aboagye’s (2012) study of bank concentration and its implications on costs of deposit mobilization and credit expansion in Ghana.
This article is structured as follows. Section 2 presents a summary of the relevant literature, and Section 3 describes our data and empirical framework. We present and discuss our results in Section 4 and provide concluding remarks in Section 5.
Literature Review
Determinants of Bank Revenue Diversification
Studies in developed markets have noted significant changes in bank revenue structure (Williams & Prather, 2010). DeYoung and Rice (2004) observe that non-interest income has become a permanent feature of United States’ bank revenue structures much like Figure 1 depicts for the Ghanaian banking industry. Universal banking and other regulatory changes, coupled with technological advances, encouraged banks to diversify their traditional product offerings with fee-based services (DeYoung & Rice, 2004). In the United States, deregulation forced local banks into competition with out-of-state banks and prompted them to diversify their income sources (Berger, Clarke, Cull, Klapper, & Udell, 2005). This body of work suggests that through their effect on industry competition, regulatory changes led banks to expand their income base. While the Ghanaian economy did not experience a similar watershed moment, the cumulative surge in the number of banks suggests that competition has increased. For this reason, we believe that competition drives the expansion of a bank’s range of non-interest income businesses.
Besides regulatory changes, other studies have focused on bank-specific and environmental factors as determinants of bank revenue diversification. Tennant and Sutherland (2014) show that non-interest income generation is determined by bank-specific characteristics and country-level environmental factors. In their cross-country study, Tennant and Sutherland found that large, solvent, liquid and efficient banks tend to profit most from non-interest income. Banks also profit from fee income in countries with a higher level of financial development and bank concentration as well as high inflation volatility. Dvorak and Hanousek (2009) also found that non-interest income is related to banking industry concentration and macroeconomic volatility.
A bank’s net interest margin is also linked to non-interest income generation by the cross-subsidization hypothesis. The cross-subsidization hypothesis holds that a bank could lower interest rates in order to lend to customers on a long-term basis. Thus, over the long term, the bank’s relation with the borrower allows them to offer non-interest income-related services. Empirical studies confirm a negative relation between fee income and net interest margins (Berger, Demirguc-Kunt, Levine, & Haubrich, 2004; Lepetit, Nys, Rous, & Tarazi, 2008; Nguyen, 2012; Tennant & Sutherland, 2014).
Other studies also found that the quality of a bank’s loan portfolio is related to the pursuit of non-interest income. Nguyen (2012) demonstrates that loan quality has an important time-varying positive relation with non-interest income. Tennant and Sutherland’s 2014 results, however, did not consistently find a relation between non-interest income to the quality of a bank’s loans. Sample selection or estimation techniques are responsible for these differences to an extent. For instance, although both studies use cross-country data, Tennant and Sutherland’s (2014) results are based on hierarchical random effects models while Nguyen (2012) controls for two-way fixed effects and panel covariance. Thus, loan portfolio quality may or may not be important for a bank’s non-interest income pursuit. One rationale for the indeterminate relation between non-interest income and loan quality is that non-interest income could provide a means to absorb loan losses implying a negative relation between non-interest income and loan quality. But, this effect could be dampened by banks with large capital base that can absorb loan losses. Bank size should, therefore, be controlled for a better understanding of the relation between non-interest income and bank loan quality.
Diversification Benefit of Non-interest Income and Bank Risk
Results on the risk implications of non-interest income are not settled. Non-interest incomes from currency trading and other derivatives are more volatile due to the peculiar nature of these lines of business. Thus, earlier studies note that non-interest income is more volatile than interest income (for example Stiroh, 2004; Stiroh & Rumble, 2006; Williams & Prather, 2010). This implies that non-interest income could increase the variability of a bank’s profitability. A related issue in the extant literature is whether the increased risk due to non-interest income is compensated for with a better reward per unit risk. Köhler (2014, 2015) provide insights to these questions using both cross-country and country-level data. Williams (2016) provides recent evidence on non-interest impact on bank risk in the Australian context, while Saunders, Schmid, and Walter (2016) provide evidence on non-interest income on bank profitability and bank failure for a comprehensive US sample.
Diversification benefits of non-interest is expected because non-interest income activities may be uncorrelated or imperfectly correlated with interest income activities (Chiorazzo, Milani, & Salvini, 2008). For a European Union sample, Köhler (2015) reports a significant diversification benefit from non-interest income for retail-oriented banks. DeYoung and Rice (2004) found that non-interest income is associated with lower Sharpe ratios due to higher volatility of non-interest income. Nguyen (2012) also found a negative association between non-interest income and risk-adjusted return on equity (ROE) and return on assets (ROA) prior to 2002 but a positive relation with ROAs in the second half of his sample from 2003 to 2007. This suggests a time-varying risk-return trade-off effect of non-interest income. In a Canadian sample, Calmes and Theoret (2010) also reported similar time-varying diversification benefit of non-interest income—the source of variation being changes in regulation regarding bank risk measurement. There are a number of possible reasons why non-interest income may not have any diversification benefit. Laeven and Levine (2007) observed that a diversification premium accrues only to banks with significant economies of scope. Evidence consistent with this view is provided in Mercieca, Schaeck, and Wolfe (2007) who found no direct diversification benefits within and across banks’ business lines.
Since non-interest income is more volatile than traditional interest income, the question arises: does it increase bank risk of failure and variability of bank profits? While Saunders et al. (2016) provided evidence that suggests that non-interest income does not affect bank insolvency or profit variability, both DeYoung and Torna (2013) and Lepetit et al. (2008) showed that the sources of non-interest income are important in identifying the risk implications of non-interest income. Saunders et al. (2016) showed that non-interest income to interest income ratio is associated with higher profits, and this results is not time-varying. But DeYoung and Torna (2013) observe that during the 2007–2008 global financial crises, different sources of non-interest have different effects on bank risk of failure given a bank’s financial health condition. DeYoung and Torna (2013) found that fee-for-service income is negatively associated with a bank’s probability failure. Baele, De Jonghe, and Vander Vennet (2007) also found a significant negative non-interest income impact on a bank’s total risk but a positive effect on bank’s systematic risk exposure.
For the Australian economy, Williams (2016) found non-interest income associated with increasing revenue volatility. But, Williams (2016) and Williams and Prather (2010) report results that suggest that non-interest income does not increase bank insolvency risk. Indeed, Saunders et al. (2016) contrast Stiroh’s (2004) earlier results that suggest that risk-adjusted returns decreases with an increased share of non-interest income in a bank’s revenue structure. In relation to stock market returns, Stiroh (2006) does not find a significant relation between non-interest income and bank stock returns. Lee, Yang, and Chang (2014) in their study of Asian banks over the period 1995–2009 report that non-interest income impact on bank risk varies with bank specialization and the macroeconomic context. In summary, these studies show that the nature and type of non-interest income business, macroeconomic environment and financial market sophistication affect what is observed of non-interest income impact on bank risk.
Data and Econometric Framework
Data
We obtained bank-level financial statement data from the Ghana Bankers Association for the period 1999 to 2015. Macroeconomic indicators are from World Development Indicators (WDI) published by the World Bank for the period 1999 to 2015. The bank-level data is also for the period 1999 to 2015. To explore the sample, we present in Table 1 the summary statistics of our main analysis variables. The average industry ROAs (roa) is about 4.5 per cent, while ROE on average is about 31 per cent. Since our data cover both new and established banks, the negative values in terms of the minimum values for the profitability measures show that some banks did not start out making profits. There is also a significant variation in the cost-to-income ratio. The average is about 71 per cent but the maximum value shows that some banks started out with higher operating costs.
We also explore the differences in the analysis variables between domestic and foreign banks. A bank is considered foreign if more than 50 per cent of the voting rights are held by foreigners. In Table 2, we present tests of differences in means and medians between foreign and domestic banks. Domestic banks are the reference. Foreign banks have better roa, roe and nim or net interest margin in terms of means. These are all statistically significant. The conclusion is the same with the median differences except for roe, for which the difference is not statistically significant. In terms of means, domestic banks have better net interest income to shareholders’ equity (niishares), non-interest income to shareholders’ equity (nintshares) and non-interest income to total assets (nintassets). These differences are not statistically significant in terms of the medians. Foreign banks also have a better cost-to-income ratio over domestic banks; the median cost-to-income ratio of domestic banks is about 10 percentage points more than that of foreign banks. Overall, Table 2 shows that there are significant differences between foreign and domestic banks in terms of profitability and the generation of non-interest income.
Summary Statistics
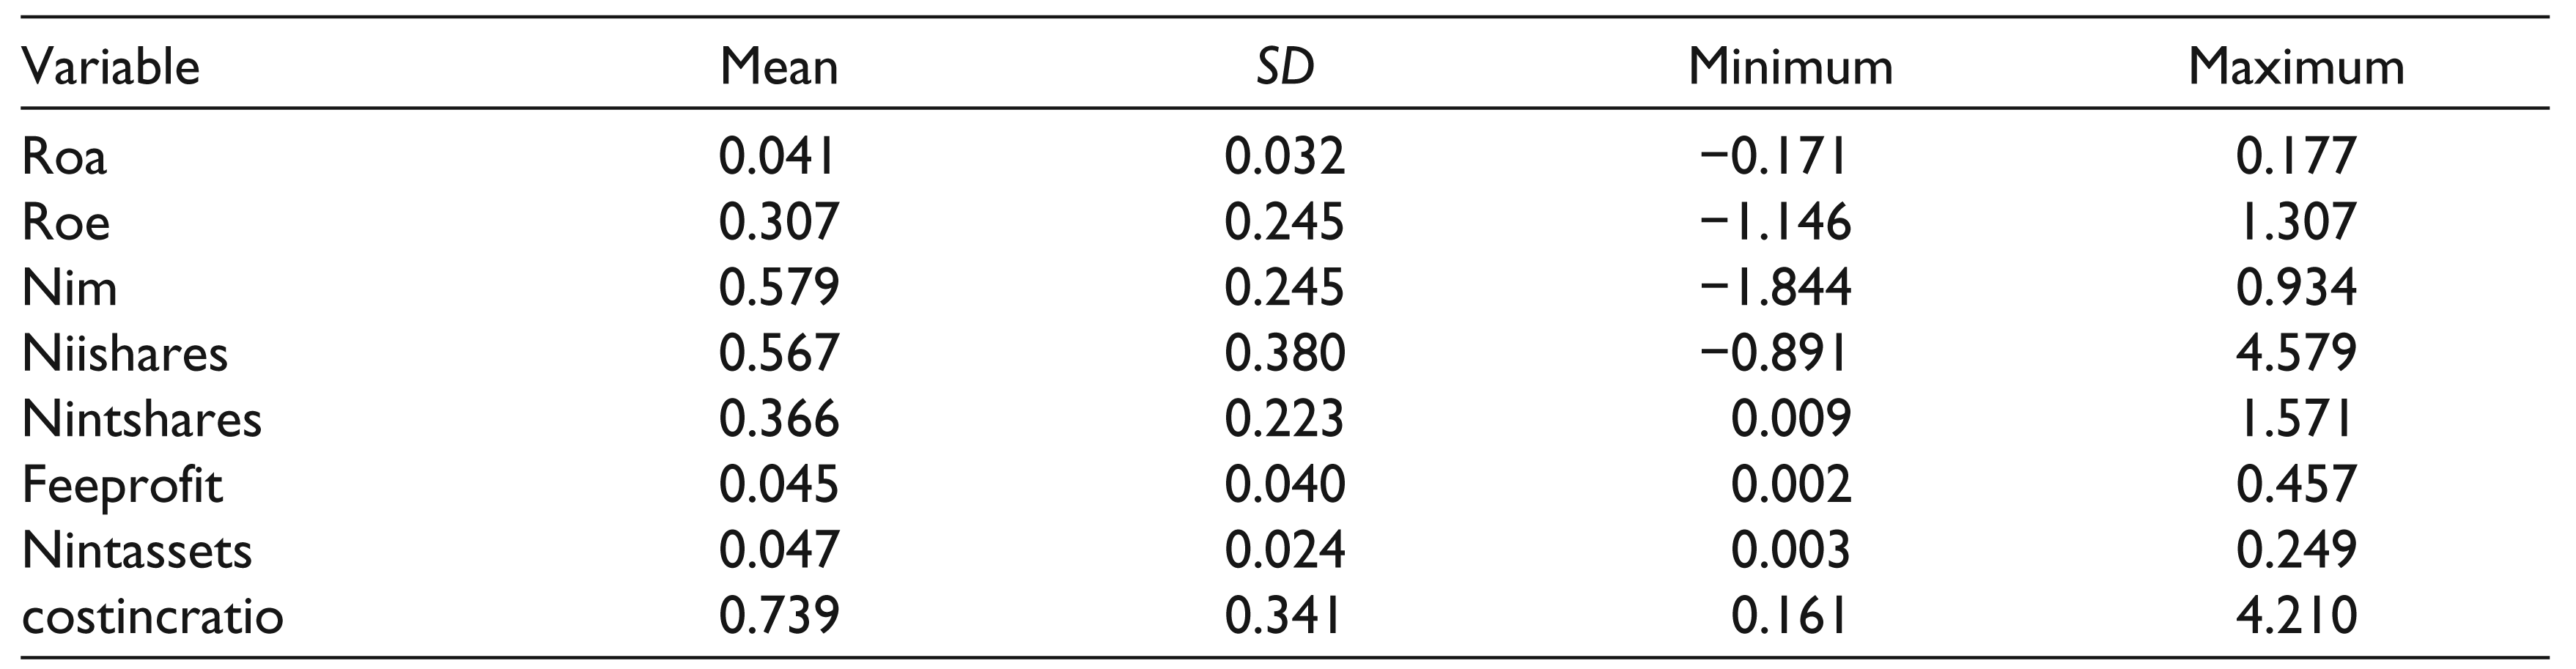
Table 1 presents the descriptive statistics of our analysis variables and the mean and median differences between domestic and foreign banks with respect to the analysis variables. Non-interest income includes fees, commissions and other income of a bank other than interest on loans. Roa is profit before tax to total assets, nintassets is non-interest income to total assets, nintshares is non-interest income to shareholders equity, nim is net interest margin, roe is return on equity, feeprofit is commissions and fees to total deposits, niishares is net interest income to shareholders equity and costincratio is cost-to-income ratio (interest expense and operating expense to total revenue). The bank-level data is from the Ghana Bankers Association, while the macroeconomic variables are from the World Development Indicators of the World Bank. The sample period is from 1999 to 2015.
Test of Differences in Means and Medians

Table 2 presents the mean and median differences between domestic and foreign banks for our key analysis variables. Non-interest income includes fees, commissions and other income of a bank other than interest on loans. Roa is profit before tax to total assets, nintassets is non-interest income to total assets, nintshares is non-interest income to shareholders equity, nim is net interest margin, roe is return on equity, feeprofit is commissions and fees to total deposits, niishares is net interest income to shareholders equity and costincratio is cost-to-income ratio (interest expense and operating expense to total revenue). Values in parenthesis are t-statistics and value in squares brackets are p-values. The bank-level data is from the Ghana Bankers Association, while the macroeconomic variables are from the World Development Indicators of the World Bank. The sample period is from 1999 to 2015.
Determinants of Non-interest Income
We test the determinants of non-interest income in Ghanaian banking with the following general model:

In the preceding equation, NII is non-interest income, SIZE is the logarithm of bank assets Xit is a vector of other explanatory variables and εit is the error term. We vary our estimation of equation (1) in terms of the explanatory variables included to correspond to the studies of Tennant and Sutherland (2014), Nguyen (2012) and DeYoung and Rice (2004). These studies differ in terms of measurement of the dependent variable, explanatory variables used and estimation technique. Our hope is to find commonality in the predictors of non-interest income from these studies. Bank size is stated because it is the common bank-specific independent variable across the three studies. We provide details of the control variables in each model in our results in Section 4.
The studies of Nguyen (2012) and Tennant and Sutherland (2014) use international data sets. Nguyen (2012) controls for effects of macroeconomic variables by way of a fixed effects estimation. Tennant and Sutherland (2014), on the other hand, use hierarchical linear models with random effects as their main estimation technique while explicitly controlling for macroeconomic variables. As a single country study for the US economy, DeYoung and Rice (2004) use generalized least squares with controls for bank-level fixed effects, time and state fixed effects and no macroeconomic control variables.
Risk-return Implications of Bank Non-interest Income
The prior literature review shows different approaches to assessing the risk-return implications of bank revenue diversification. We specify a model that follows the same procedure as in equation (1). In this analysis, we consider the studies of Köhler (2015, 2014), DeYoung and Torna (2013), Nguyen (2012) and DeYoung and Rice (2004). Our general model is as follows:

In equation 2, RISK it is a measure of bank risk that includes the Z-score and a decomposition of the Z-score into the capital adequacy and ROA parts as in Köhler (2014). An alternate definition of RISK is the standard deviation of ROAs or ROE over the previous 3 years as in DeYoung and Rice (2004). Following Köhler (2014), we compute the Z-score as follows:
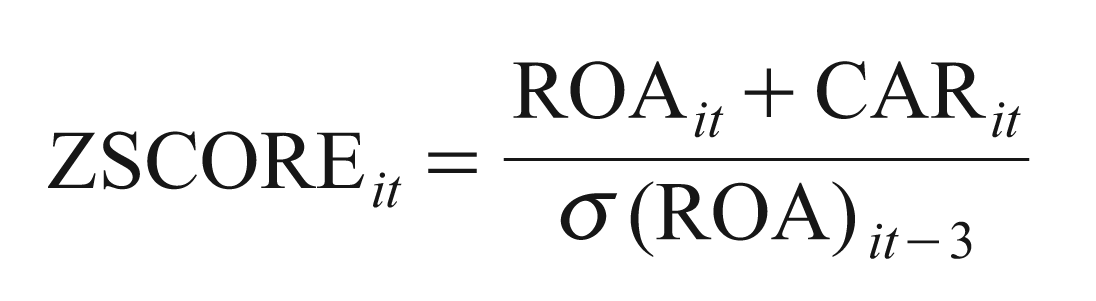
In our estimation, we use the natural logarithm of ZSCORE to mitigate problems with skewness of the variable due to the varying sizes of the banks in the sample. For the relation between non-interest income and bank performance, we follow DeYoung and Rice (2004) and estimate the following model which provides a test of the impact of non-interest income on bank medium term profitability:

In equation (4),
We test the diversification benefits of non-interest income in the Ghanaian banking industry by replacing average profitability with the Sharpe ratio in equation (4). We compute a bank’s Sharpe ratio using 3-year rolling data as follows:
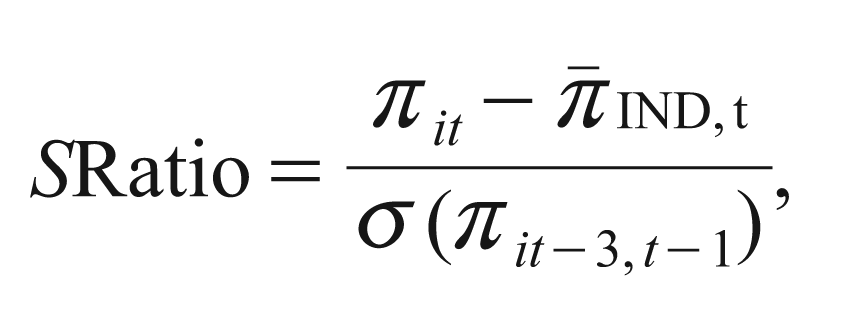
In equation 5, πit is either of ROA or ROE of the ith bank for year t,
Empirical Results
Determinants of Non-interest Income
This section presents our results on the test of the determinants of non-interest income in the Ghanaian banking industry. Our results are reported in Table 3. Each column in the table represents a result drawing on the variables in prior studies: Column (1) is a variant of DeYoung and Rice (2004); columns (2) and (3) are variants of Tennant and Sutherland (2014) and column (4) is a variant of Nguyen (2012). Multiple estimations give us the opportunity to show our results’ robustness to the different approaches to modelling the determinants of non-interest income. We also have the opportunity to highlight common variables that could aid in the understanding of non-interest income determinants.
For the DeYoung and Rice (2004) model, we estimate equation (1) by generalized least squares with controls for year fixed effects. Non-interest income is proxied by non-interest income to total assets. Results for this estimation are in column (1) of Table 3. Bank size and deposits per employee have negative and statistically significant coefficients. We observe statistically significant coefficients on loans to total assets and loan losses to total assets. Our results have a number of differences with the results in DeYoung and Rice (2004). While our results suggest that large banks rely less on non-interest income, DeYoung and Rice (2004) found the opposite. We can attribute this to the largely uncompetitive local banks whose strategic posture invited a number of de novo banks of smaller size into the Ghanaian banking industry. Relative ROA in our results is insignificant. In the context of DeYoung and Rice (2004), we interpret this as indicating that well-managed banks in our sample do not rely on non-interest income. Deposits per employee in our results is negative, while DeYoung and Rice (2004) observe a positive coefficient. Deposits per employee measure the amount of personalized services offered to customers. The negative coefficient suggests that customers of banks in our sample are less willing to pay for personalized services.
Test of Determinants of Non-interest Income—Comparison of Models
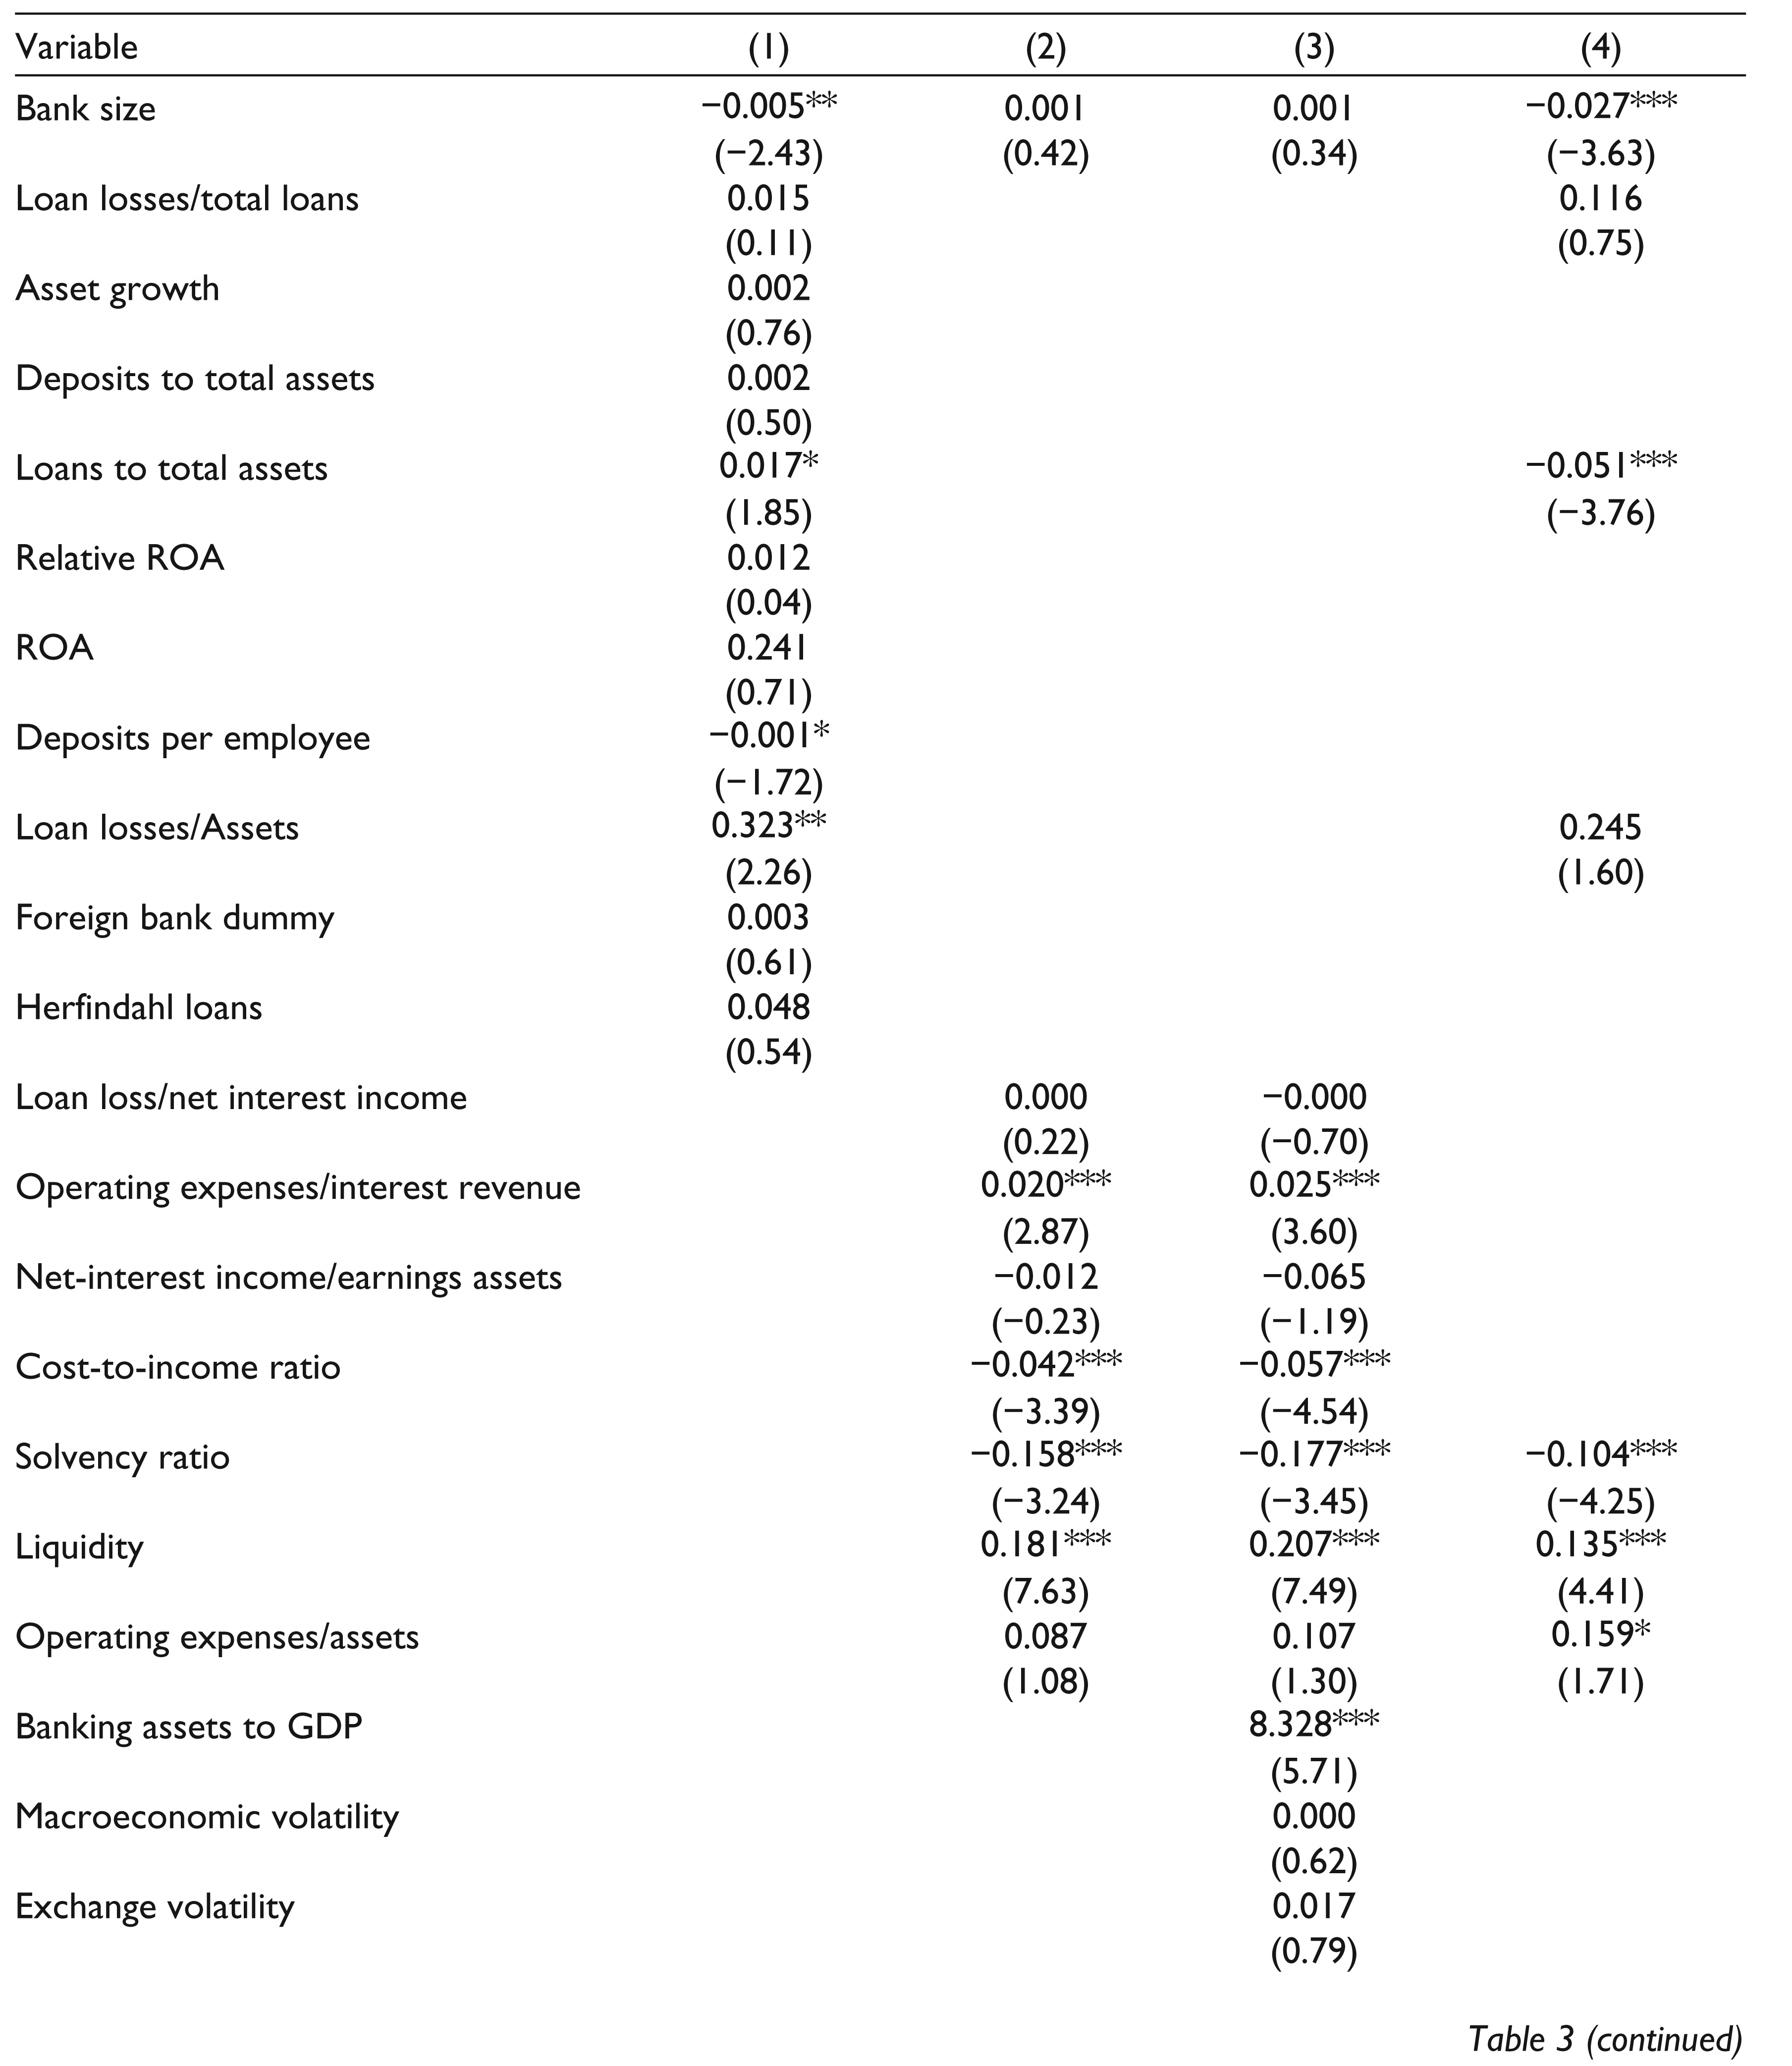
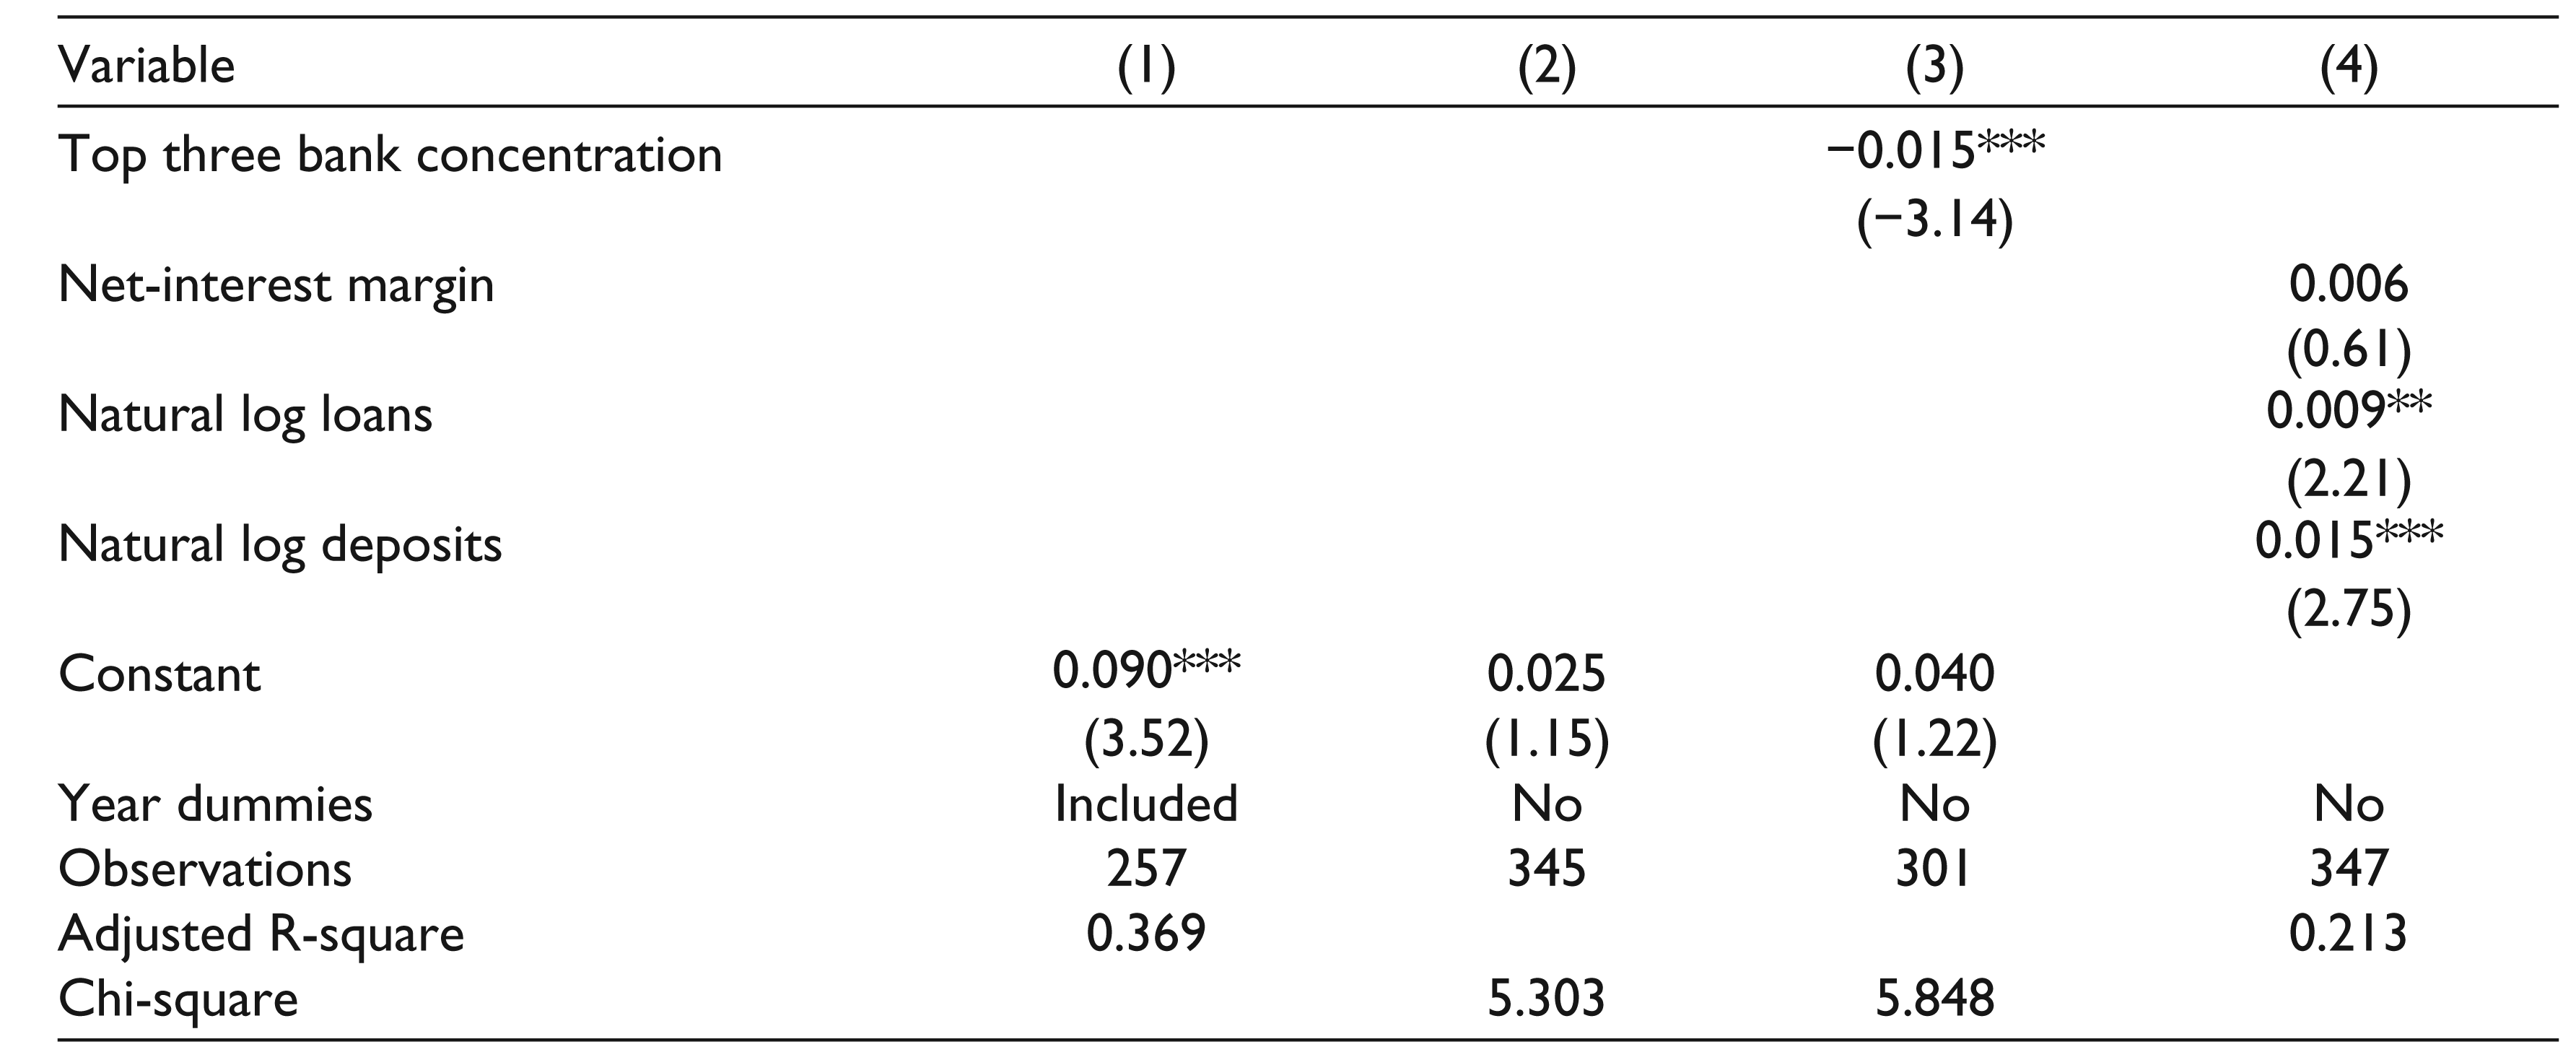
Table 3 presents results of test of determinants of non-interest income. We estimate the models in DeYoung and Rice (2004) in column (1); Tennant and Sutherland (2014) in columns (2) and (3) and Nguyen (2012) model in column (4). The bank-level data is from the Ghana Bankers Association, while the macroeconomic variables are from the World Development Indicators of the World Bank. The sample period is from 1999 to 2015.
In Table 3, we report in column (2) a version of Tennant and Sutherland (2014) without macroeconomic variables. Macroeconomic variables are included in column (3). Tennant and Sutherland (2014) have as their dependent variable the ratio of non-interest income to total deposits as a measure of how much a bank profits from the non-interest income it raises. In column (2), we observe positive statistically significant coefficients for operating expenses to interest revenue and liquidity. Negative and statistically significant coefficients are observed for cost-to-income ratio and solvency ratio. In column (3), the results on the bank characteristics variables are not different from those in column (2). Of the macroeconomic variables included in column (3), banking assets to gross domestic product (GDP) has a positive statistically significant coefficient but top-three bank concentration ratio is negative and statistically significant. Other included variables are not statistically significant in the two columns. The cost-to-income ratio result is intuitive: a higher cost-to-income ratio (or inefficiency) deters the pursuit of non-interest income. The solvency ratio result is also intuitive: when faced with deteriorating capital, banks prefer to stay close to their core business.
Also, the positive coefficient on the ratio of banking assets to GDP, a measure of sophistication in the financial market, suggests that banks generate more non-interest income with increasing financial sophistication of their customers and the marketplace. Our results on cost-to-income ratio, liquidity and banking assets to GDP are consistent with Tennant and Sutherland’s (2014) results. They interpret their positive solvency ratio coefficient as an indication that well-capitalized banks are those that profit most from non-interest income. Our results suggest the opposite. We argue that our results are plausible in the Ghanaian context because it suggests that banks only turn to non-interest income when their capital base is weakening, perhaps due to losses in the intermediation business given the anecdotal evidence of higher lending rates in the banking industry in Ghana.
We present our results based on the Nguyen (2012) model in column (4) of Table 3. Non-interest income to earnings assets is the dependent variable in this set of results. Also, the model is estimated with bank fixed effects with net interest margin treated as an endogenous explanatory variable as in Nguyen (2012). We observe a statistically significant negative coefficient for bank size as in the DeYoung and Rice (2004) model results in column (1), for loans to total assets and solvency ratio. We observe positive statistically significant coefficients for liquidity, operating expenses to total assets, natural log of loans and natural log of deposits. Relative to Nguyen (2012), our results on banking size, log deposits, loans to total assets, cost-to-income ratio and liquidity are all consistent.
We conclude from Table 3 that the bank characteristics associated with non-interest income, to an extent, are bank size, liquidity, cost-to-income ratio, solvency, loans to total assets (mixed), financial sector sophistication, banking sector concentration, volume of loans and deposits. Obviously, our conclusion here is based on results from models with differences in the measurement and extent of explanatory variables and the dependent variables. We partially address these issues in the results in Table 4.
Test of Determinants of Non-interest Income—Combining Models
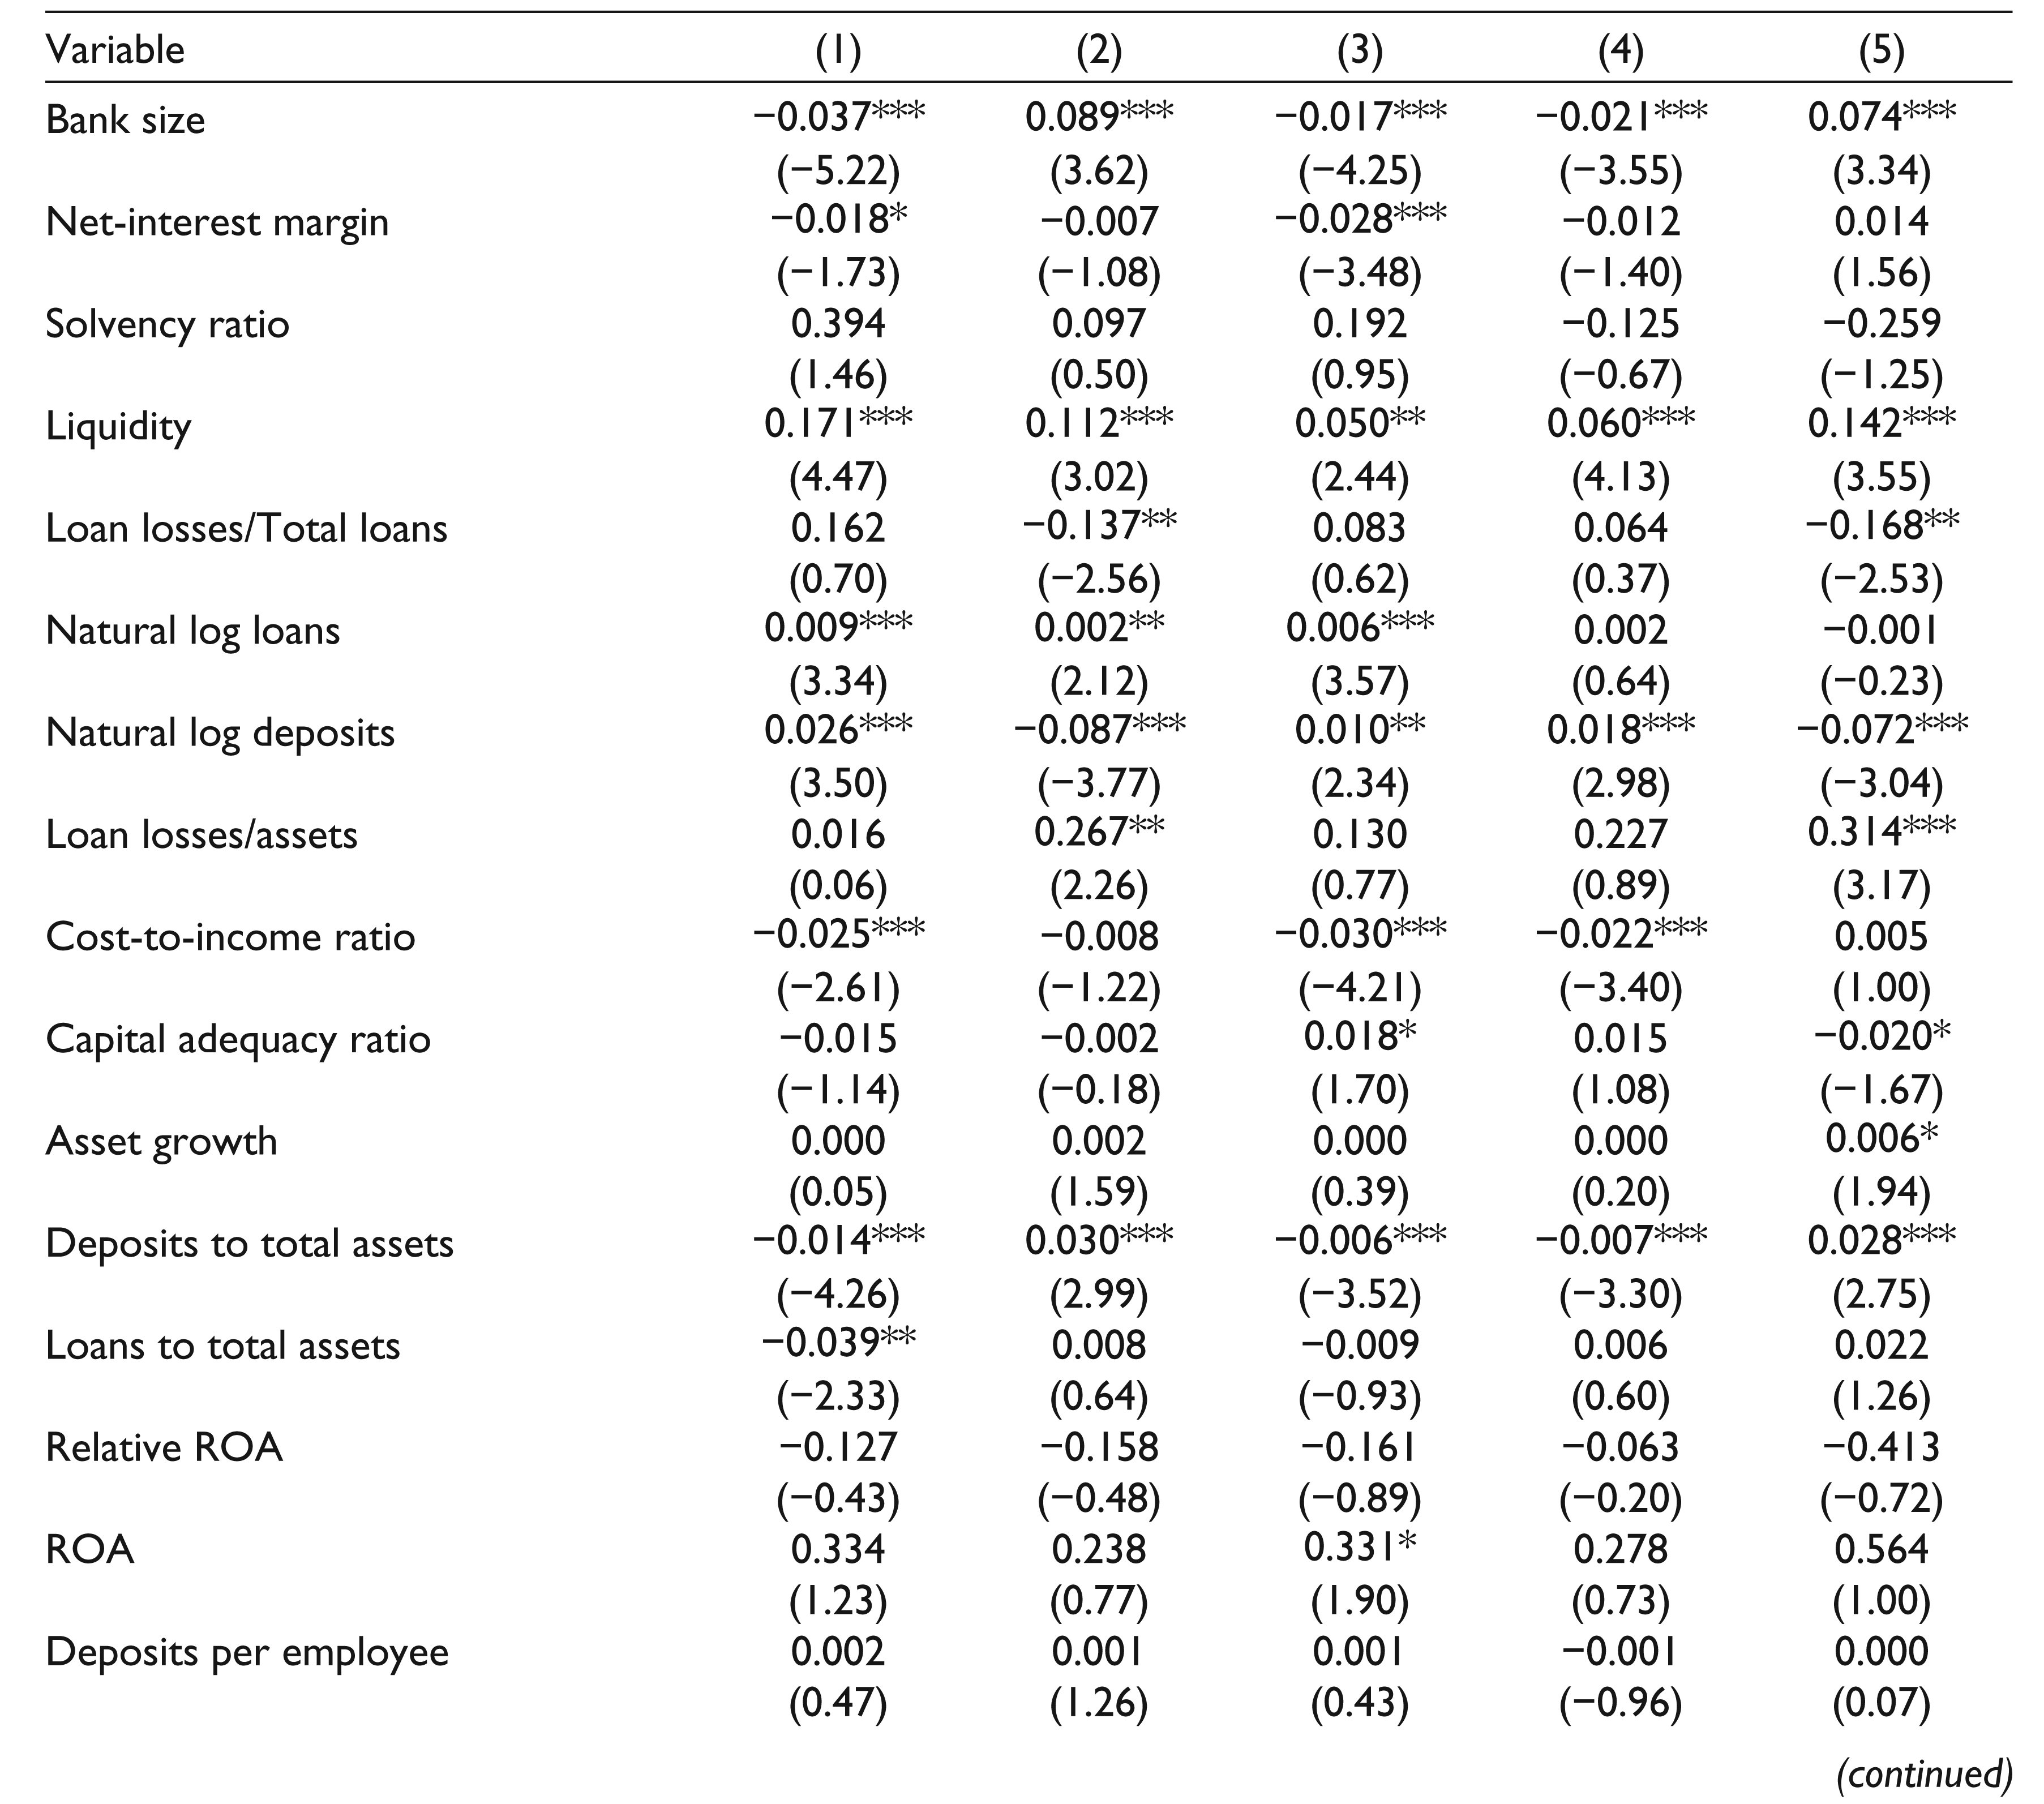
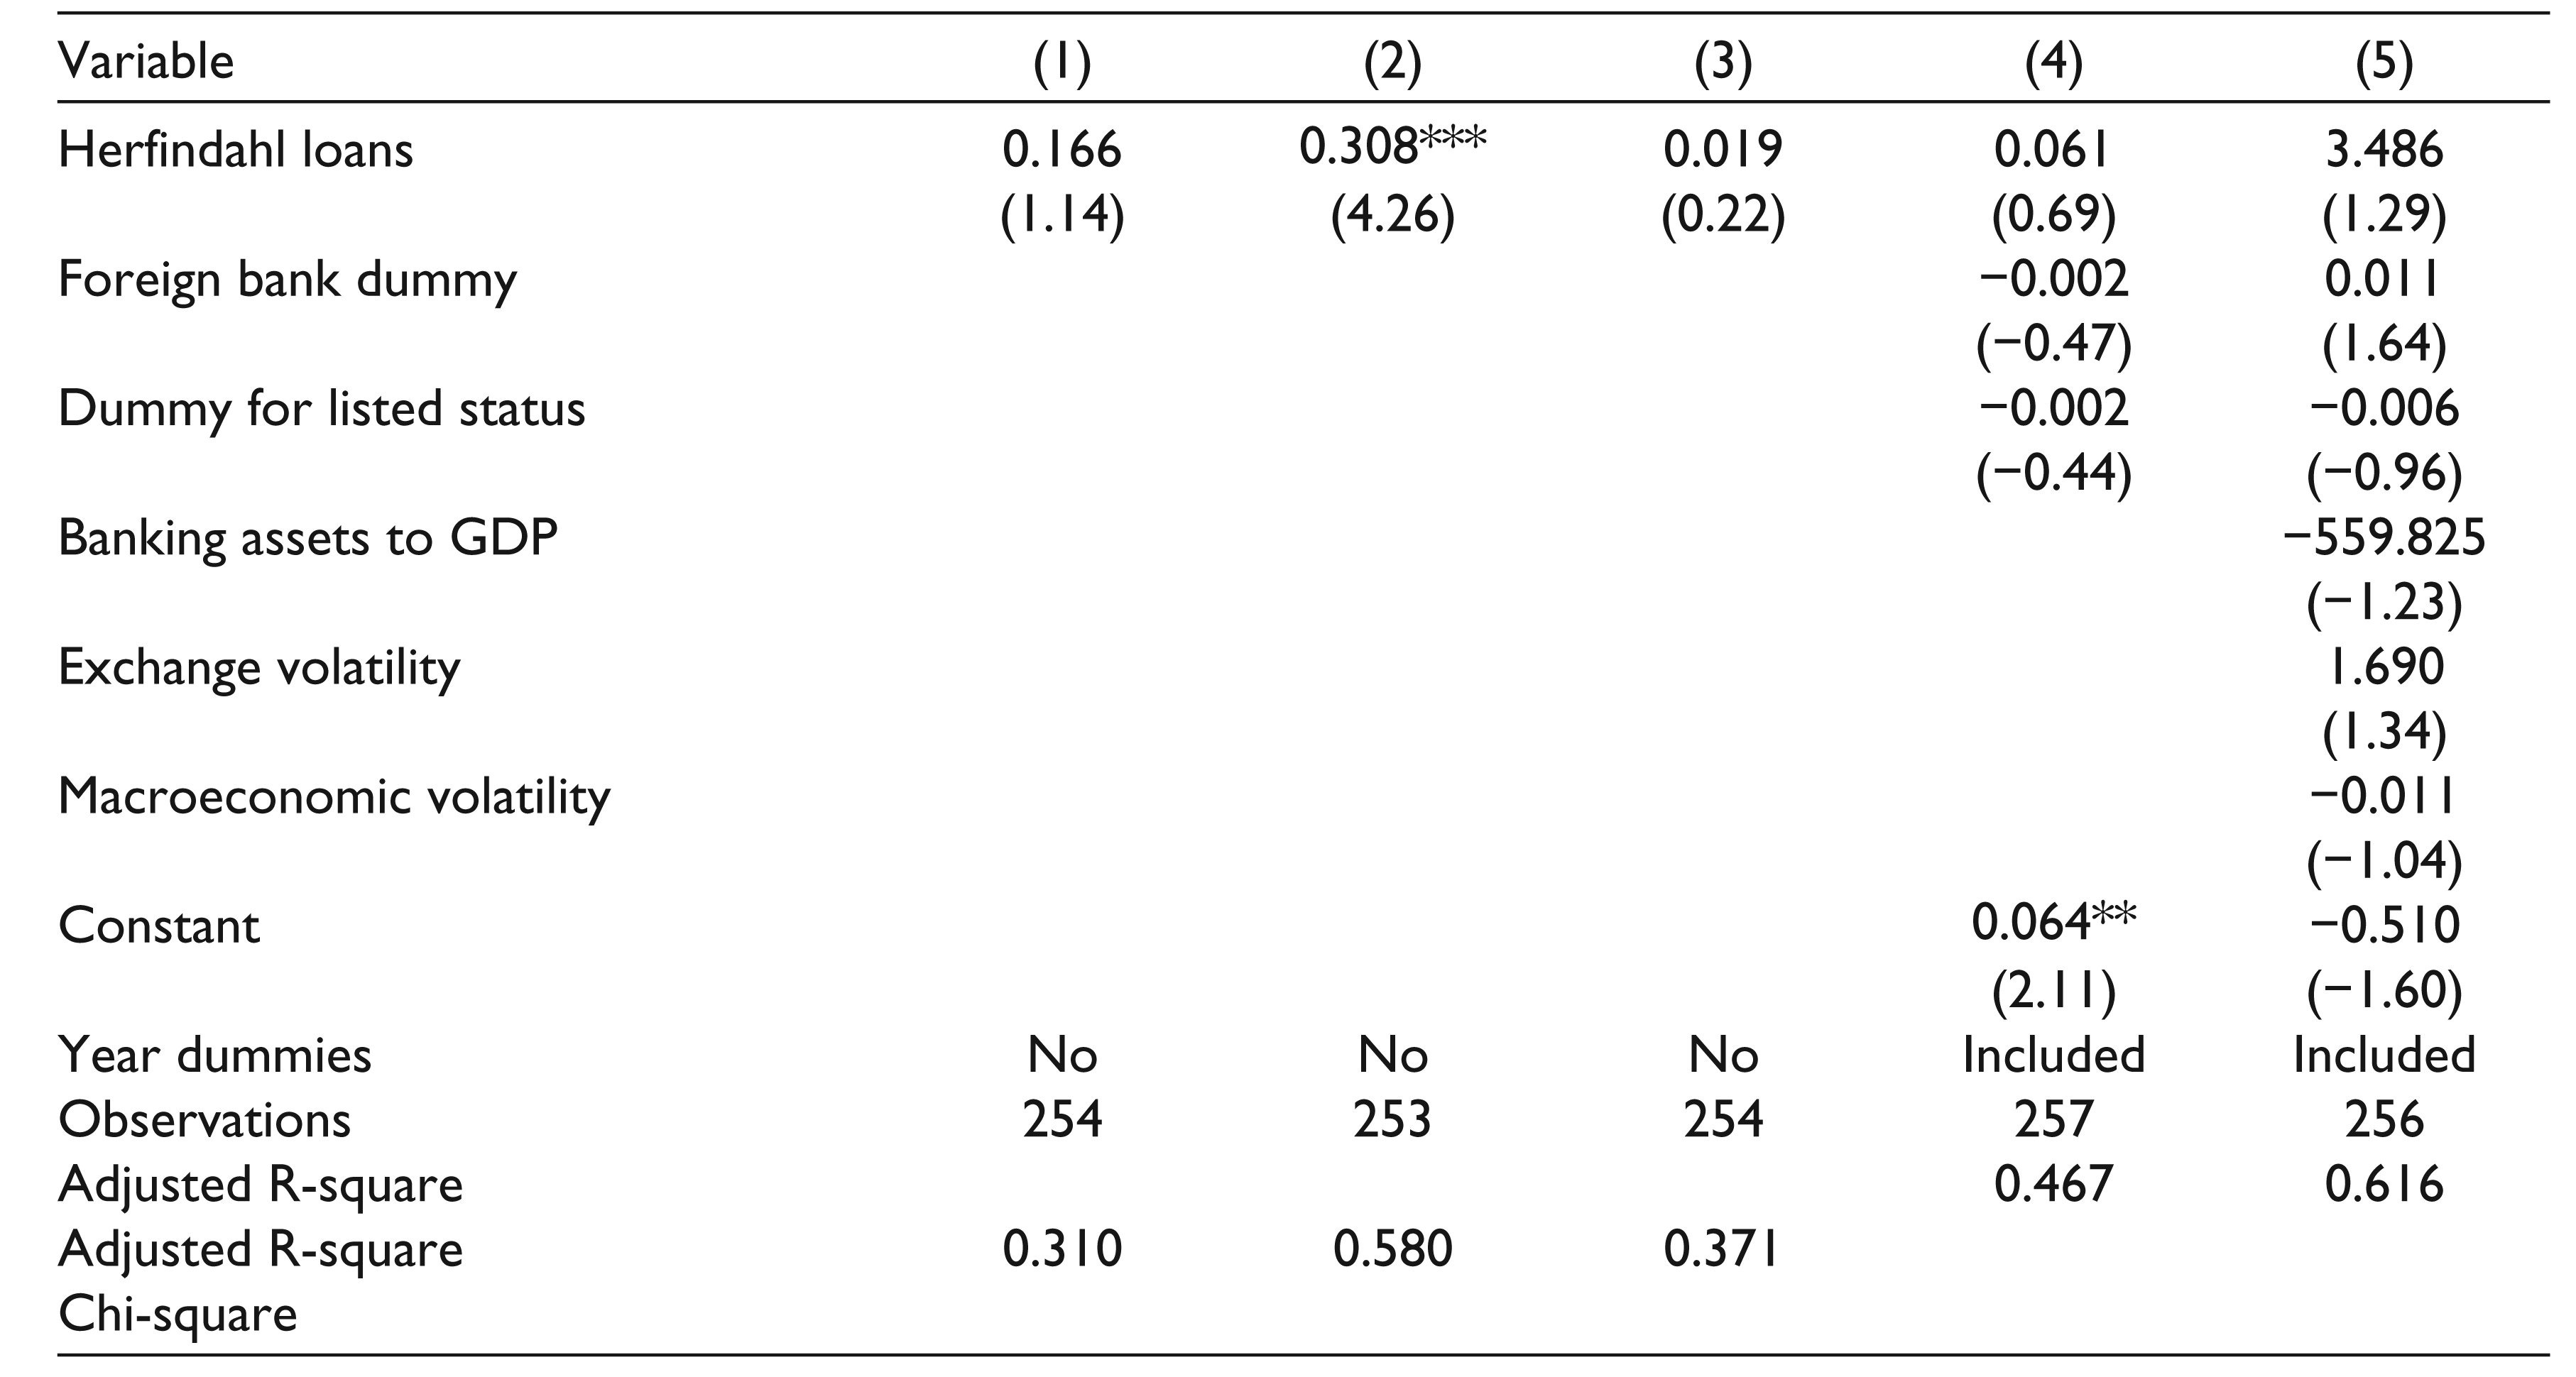
Table 4 presents results of test of determinants of non-interest income by estimating a model based on variables common to the models of DeYoung and Rice (2004), Tennant and Sutherland (2014) and Nguyen (2012). The bank-level data is from the Ghana Bankers Association, while the macroeconomic variables are from the World Development Indicators of the World Bank. The sample period is from 1999 to 2015.
Table 4 presents results based on a model that draws the common explanatory variables from the results in Table 3. In column (1) of Table 4, the dependent variable is non-interest income to earnings assets (Nguyen, 2012). In column (2), the dependent variable is non-interest income to total assets (DeYoung & Rice, 2004), and in column (3), the dependent variable is fee profit (Tennant & Sutherland, 2014). Results in these three columns are estimated following the Nguyen (2012) model, which treats net interest margin as endogenous. In column (1), we observe a statistically significant negative coefficient on bank size, net interest margin, cost-to-income ratio, deposits to total assets and loans to total assets. Variables with statistically significant positive coefficients are liquidity, natural log of loans and deposits. Column (2) has fee profit as the dependent variable. For this, we observe statistically significant negative coefficients on natural log of deposits. One can infer from this particular result that banks which raise a lot of deposits do not tend to profit highly from non-interest income. Variables with positive and statistically significant coefficients in column (2) include bank size, liquidity, natural log of loans, loan losses to total assets, deposits to total assets and the Herfindahl based on loans. Implications from these are that larger banks profit more from non-interest income as reported in Tennant and Sutherland (2014).
In column (3) of Table 4, the dependent variables are non-interest income to total assets as in DeYoung and Rice (2004). The results closely mirror that of the results in column (1), except the marginally significant positive coefficients for capital adequacy ratio and ROA. In column (4), the dependent variable is non-interest income to total assets, but, in this model, we introduce a foreignness dummy and a listing status dummy. These variables are not included in the first three columns due to the fixed effects estimation of those models. In column (4), the model is estimated by the generalized least squares with year fixed effects. The results in column (4) is similar to those in columns (1) and (3).
We introduce macroeconomic variables as in Tennant and Sutherland (2014) for the results in column (5) of Table 4. As in column (2), the dependent variable in this estimation is fee profit. The model is estimated by Generalized Least Squares (GLS) with year fixed effects and clustering of standard errors at the bank level. Similar to column (2) bank size, liquidity, loan losses to total assets and deposits to total assets all have positive statistically significant coefficients. Loan losses to total loans, natural log of deposits and capital adequacy ratio (marginally) have negative coefficients.
Overall, Table 4 suggests that, judging by the adjusted R2, the models with macroeconomic variables included have better explanatory power. From Tables 3 and 4, we observe that the scaling of non-interest income has implications for what determines non-interest income. When non-interest income is scaled by total assets or earnings assets, the consistently significant variables are bank size, cost-to-income ratio and deposits to total assets, with a negative association. The variables with a positive association are liquidity, the natural log of loans and deposits. If non-interest income is scaled by total deposits, the important variables (positive association) are bank size, liquidity, loans losses to total assets, asset growth and deposits to total assets. Variables with negative association are loan losses to total loans and natural log of deposits.
In relation to the existing literature, our results on cost-to-income ratio is consistent with Sufian and Noor (2012) who suggest bank costs have positive and significant impacts on bank performance. We also believe our results are consistent with Fiordelisi, Marques-Ibanez, and Molyneux’s (2011) conclusions that income diversification has a negative effect on cost efficiency, that is, the more a bank diversifies its income activities, the less it becomes efficient. This reiterates the well-known limits of diversification.
Risk-return Trade-off Implications of Non-interest Income
We present two sets of results for our test of non-interest income implications for bank risk and return: one based on DeYoung and Rice (2004) and another set based on more recent studies. DeYoung and Rice (2004) used a long-term approach, different from the short-term models of the more recent studies (DeYoung & Torna, 2013; Köhler, 2014, 2015; Nguyen, 2012). First, we report in Table 5 results that mirror the main components of DeYoung and Rice (2004). Column headings in Table 5 identify the respective dependent variables. Models are estimated by GLS with year fixed effects.
With Sharpe ratio measured with ROA in the first column of Table 5, non-interest income averaged over 3 years and has a positive and statistically significant coefficient. Likewise, asset growth averaged over 3 years. For ROE-based Sharpe ratio, non-interest income is not important, but bank size and loan concentration are important. Non-interest income also has no statistically significant association with variability of ROAs (σ(ROA) column) although it does have a positive and statistically significant association with ROA averaged over 3 years. From Table 5, the conclusion is that non-interest income has diversification benefits based on ROA, and that non-interest income contributes to medium-term profitability in terms of ROA. DeYoung and Rice (2004) in their study report that non-interest income has positive association with ROE, is associated with lower Sharpe ratio, and is also associated with high profit variability. In contrast to the DeYoung and Rice (2004) study, our results suggest that non-interest income has a mixed association with variability of bank profits in our sample over the medium term.
In Table 6, we consider non-interest income implications for bank risk of failure and variability of bank profits. The results are from GLS estimates with year fixed effects. In the DeYoung and Torna (2013) model, the dependent variable is ZSCORE, for which only liquidity (positive) has a statistically significant coefficient. Non-interest income is not statistically important. This result is consistent with DeYoung and Torna (2013) observation that non-interest income’s impact on bank risk depends on the financial health and category of non-interest income under study. DeYoung and Torna (2013) examine three sources of non-interest income: Fee-for-service activities, Stakeholder activities and traditional fee banking activities. We deem our results consistent with DeYoung and Torna (2013) because the Ghanaian banking industry is largely engaged in the traditional fee income activities that do not expose bank capital to significant possible losses. Consistent with this argument, with σ(ROA) as the dependent variable, non-interest income is not statistically.
Testing DeYoung-Rice Model of Non-interest Income Effect on Risk and Return
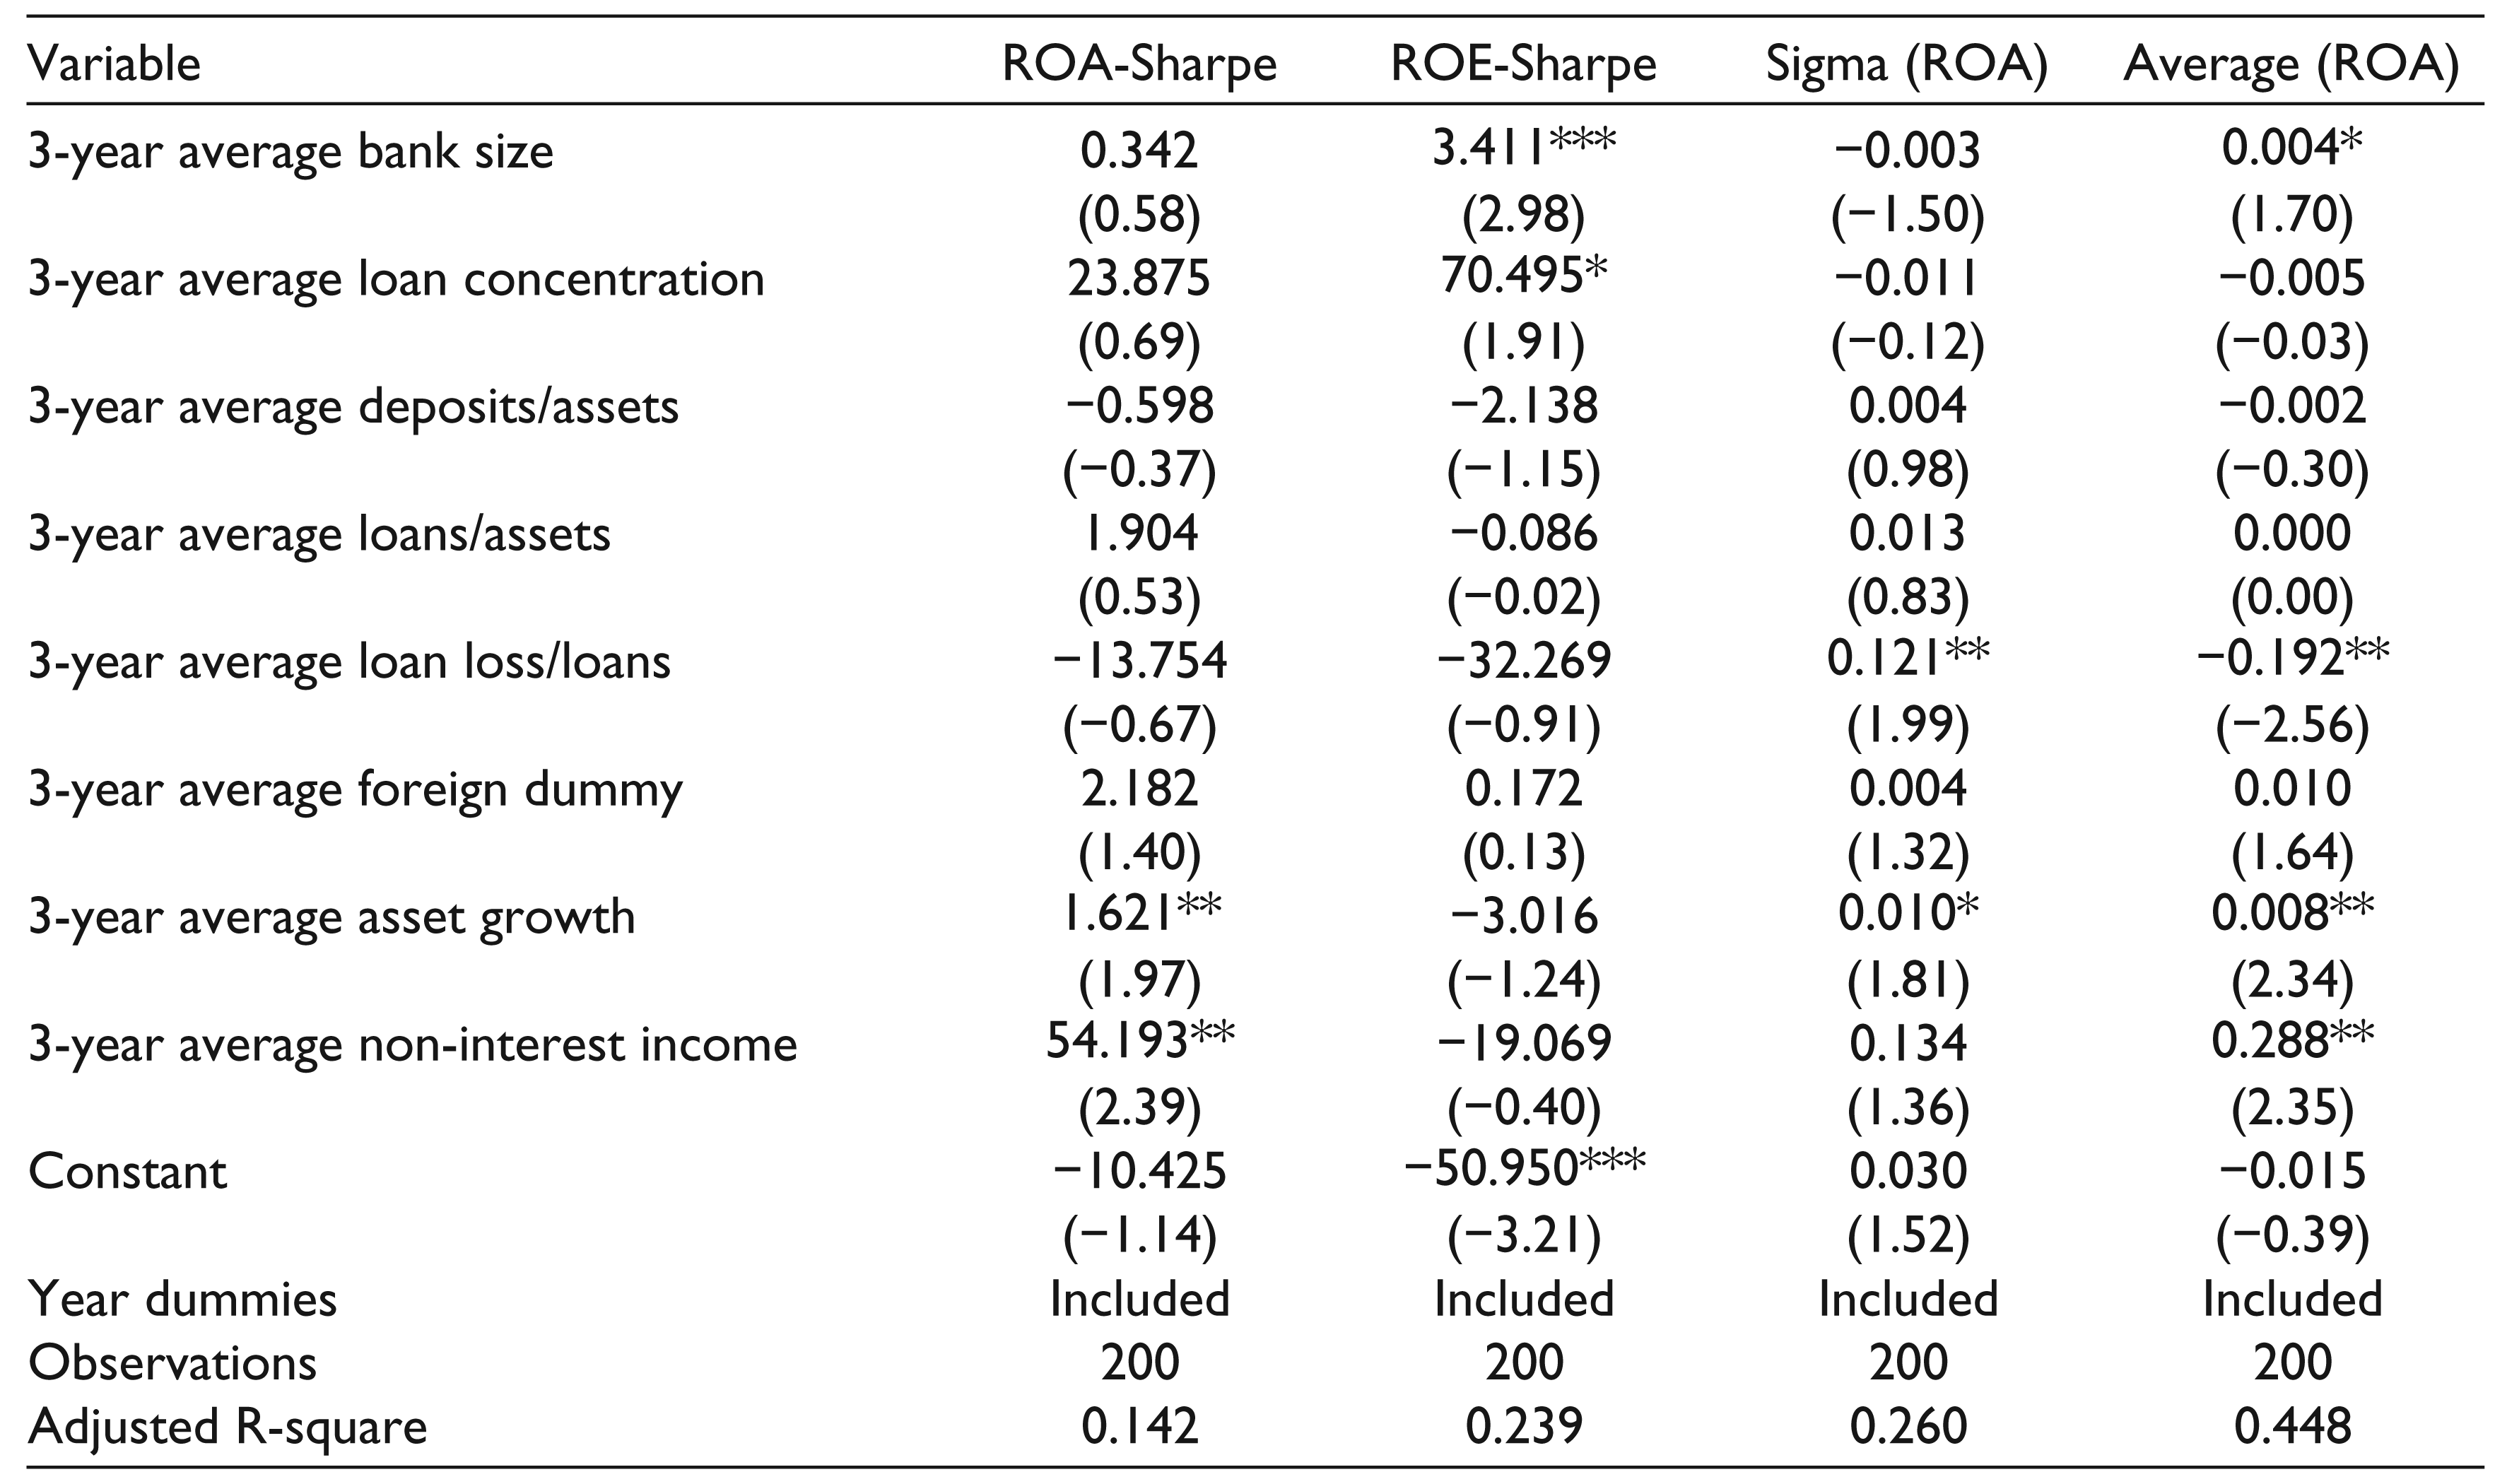
Table 5 presents results of test of non-interest income effect on bank risk and return based on the models estimated in DeYoung and Rice (2004). The estimation is by GLS with year fixed effects. The bank-level data is from the Ghana Bankers Association, while the macroeconomic variables are from the World Development Indicators of the World Bank. The sample period is from 1999 to 2015.
The ZSCORE column in Table 6 comprises results based on Köhler (2015), for which liquidity and asset growth show positive and statistically significant coefficients. RAROA and RACAR are from the decomposition of ZSCORE into the profitability and capital adequacy parts. The weight of the evidence in Table 6 is that non-interest income may not have a statistically significant implication for risks among Ghanaian banks for the aforementioned reasons. Our results match Lepetit et al.’s (2008) report that non-interest income increases for small banks. Our results are also consistent with Saunders et al.’s (2016) conclusion that non-interest income does not affect bank profit variability and bank insolvency risk. Our results also parallel Lee et al.’s (2014) suggestion that the context matters for what is observed of non-interest income impact on banks’ risk and profit variability.
Our conclusion differs from a number of empirical results. For example, Acharya, Iftekhar, and Saunders (2006) and Chiorazzo et al. (2008) hold that income diversification increases the volatility of bank earnings and makes banks more vulnerable to financial distress. Likewise, our results are not consistent with those of Lepetit et al. (2008), De Jonghe (2010) and Fiordelisi et al. (2011) who suggest revenue diversification increases banks’ risk.
Test of Non-interest Income Effect on Bank Risk with Macro Factors
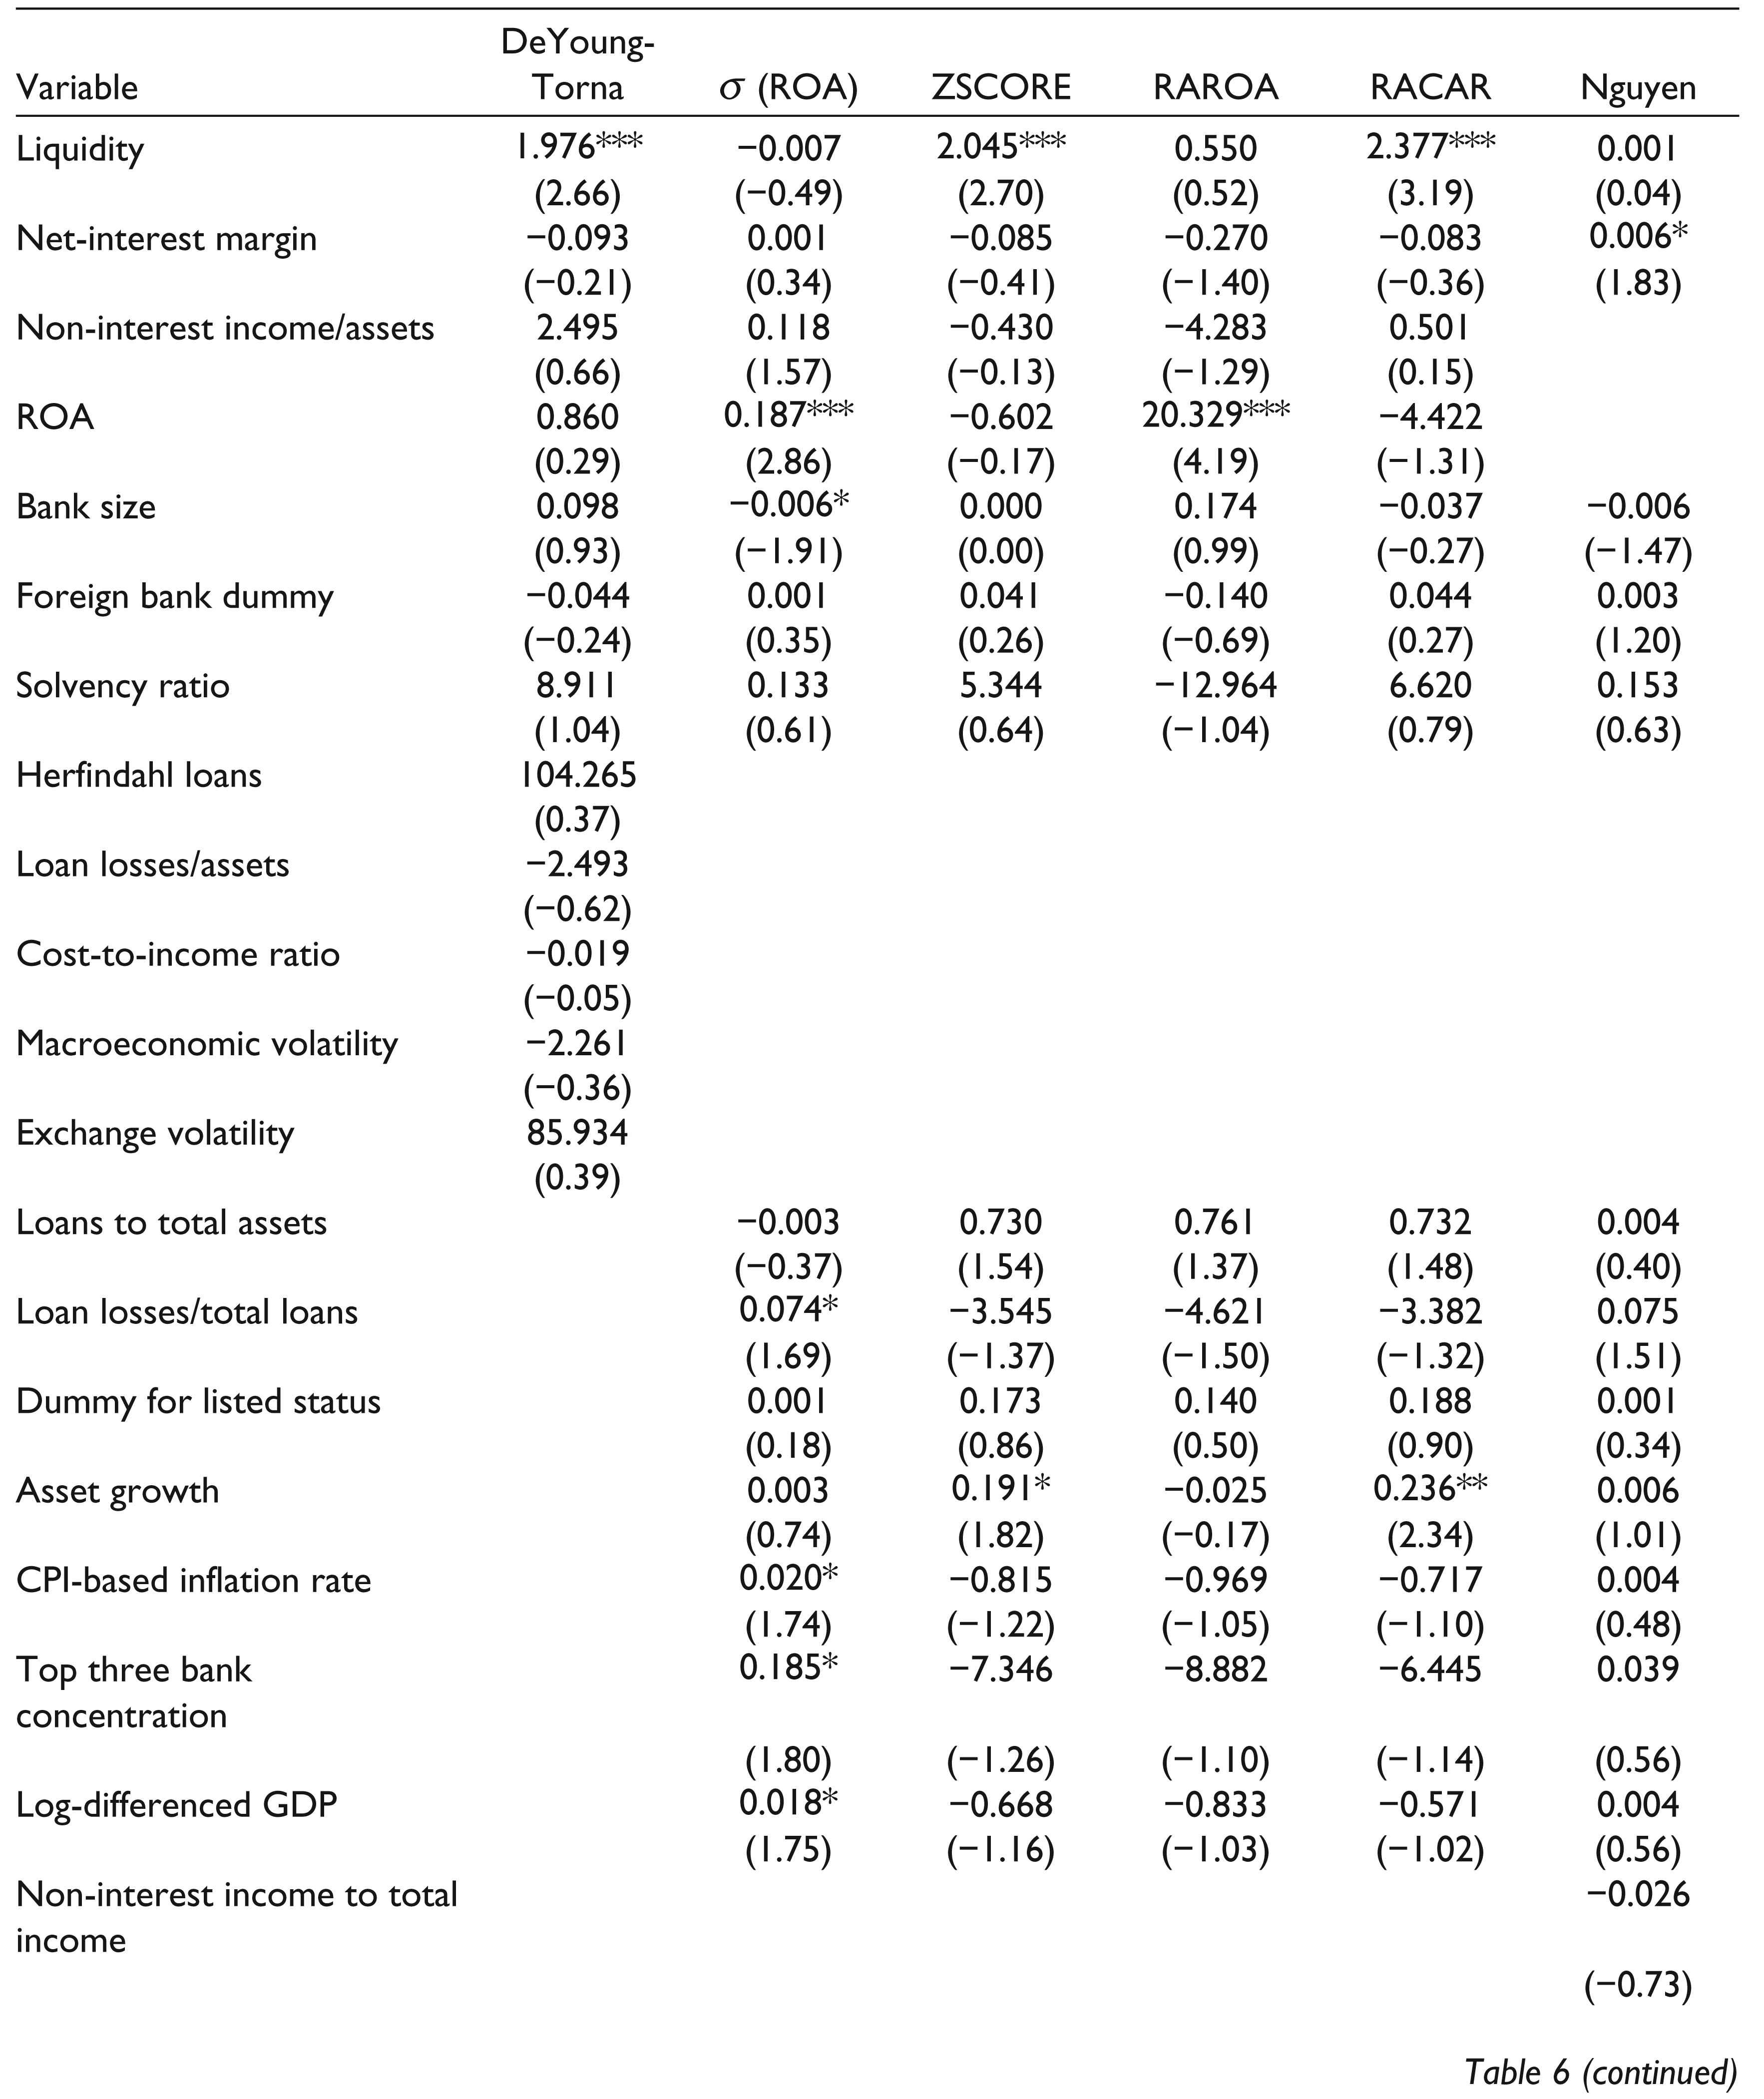
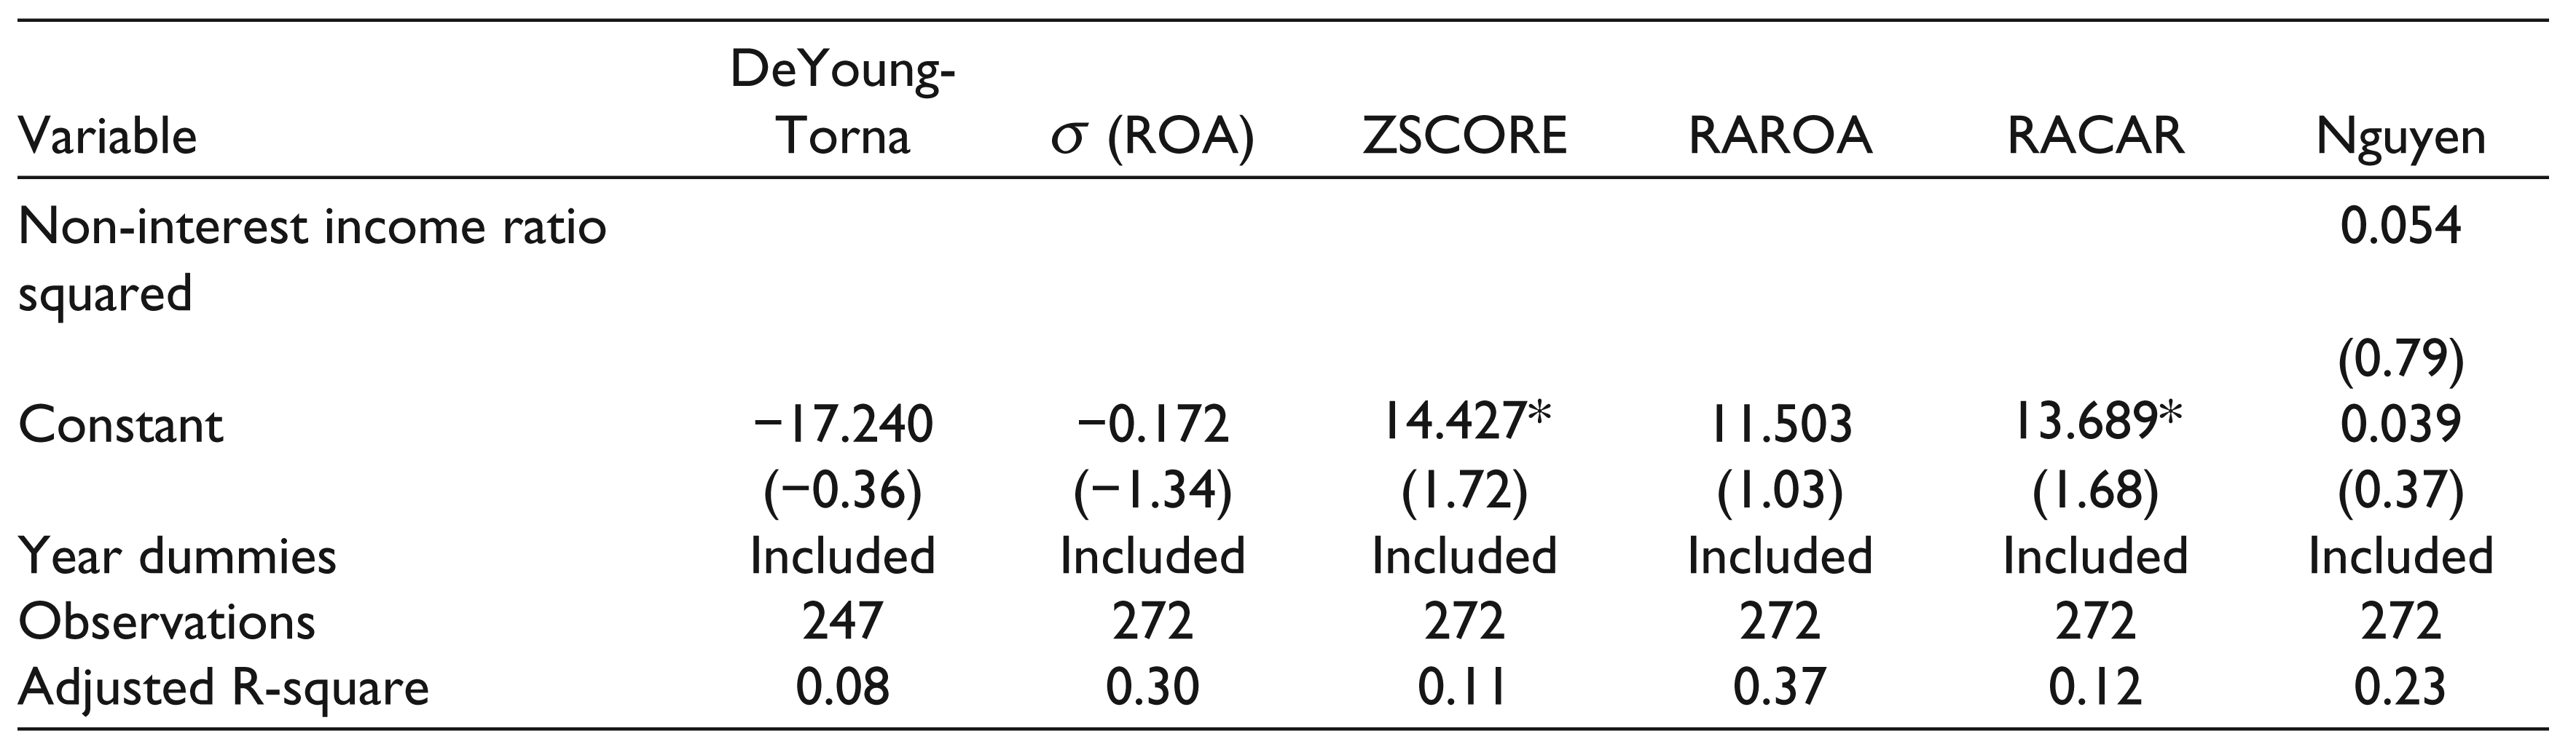
Table 6 presents results of test of non-interest income effect on bank risk and return based on the models drawn from recent studies. The bank-level data is from the Ghana Bankers Association, while the macroeconomic variables are from the World Development Indicators of the World Bank. The sample period is from 1999 to 2015.
Conclusion
In this study, we have tested for the determinants of non-interest income and also the risk-return implications of non-interest income with a Ghanaian banking sample. On the determinants of non-interest income, we find that empirical implementation has implications for the results obtained. If non-interest income is scaled by total assets (DeYoung & Rice, 2004) or earnings assets (Nguyen, 2012), we find that the important bank characteristics are bank size, net interest margin, deposits to total assets and cost-to-income ratio, all having a negative association. Variables with significant positive association are log of deposits, log of total loans and liquidity.
If non-interest income is scaled by deposits as in Tennant and Sutherland (2014), we observe that variables with positive significant coefficients are bank size, liquidity, log of total loans, loan losses to assets, deposits to assets and competition. The variables with negative coefficients are loan losses to total loans and cost-to-income ratio. Cost-to-income ratio, log of total loans and liquidity stand out from the non-interest income-determinant models. The sign of their coefficients is not dependent on the scaling of non-interest income. The implications are that banks with cost-efficient operations tend to generate more non-interest income in the context of DeYoung and Rice (2004) and 1 (2012). In the context of Tennant and Sutherland (2014), we can intuitively interpret the cost-to-income ratio result as indicating that efficient banks profit the most from non-interest income. The size result in the realm of Tennant and Sutherland (2014) model suggests that large banks profit from non-interest income, perhaps due to scale economies. The negative size results in the context of the DeYoung and Rice (2004) and Nguyen (2012) studies suggest that relative to assets, large banks do not generate enough non-interest income.
On the risk implications of non-interest income, we find that non-interest income does not contribute significantly to banks risk of failure nor to the variability of bank profits. This has much do with our sample than a universal evidence about the role of non-interest income for bank risks. Our results are consistent with Williams (2016), Köhler (2015) and DeYoung and Torna (2013) who have shown that different sources of non-interest income has different implications for bank risk. Our results are also consistent with Saunders et al. (2016) who suggest non-interest income does not increase banks risk of failure.
Managerial Implications
Our results have implications for regulators and bank managers. For bank managers, our results show that the key to maximizing benefits of non-interest income is cost control given that our results show that cost-efficient banks had better gains from non-interest income. Also, bank managers need to do more to sell personalized banking services to Ghanaian bank customers, an avenue that currently does not seem to be a fully exploited source for non-interest income. Another implication of our results is that as the Ghanaian financial marketplace becomes sophisticated and banks move into riskier sources of non-interest income activities, there will be a point where the risk implications that DeYoung and Torna (2013) observe would become imminent. The central bank, therefore, needs to keep this in mind and keep its vigilance over the industry as banks introduce newer non-interest income businesses.
Footnotes
Acknowledgements
The authors are grateful to the anonymous referees of the journal for their extremely useful suggestions to improve the quality of the article. Usual disclaimers apply.
Declaration of Conflicting Interests
The authors declared no potential conflicts of interest with respect to the research, authorship, and/or publication of this article.
Funding
The authors received no financial support for the research, authorship, and/or publication of this article.