
Abstract
The present study investigates the long-run association and direction of causality among economic growth, trade openness and gross capital formation in Brazil, Russia, India, China and South Africa (BRICS) nations. This article applied autoregressive distributed lag (ARDL) and vector error correction model to examine the long-run association and casual relationship among the competing variable. The ARDL bound test results indicate long-run relationship among economic growth, trade openness and gross capital formation. Granger causality results reveal unidirectional causality from trade openness to economic growth in India and that Brazil supports trade-led growth hypothesis while bidirectional causality is found between trade openness and economic growth in China supporting feedback hypothesis. In addition, the empirical evidence of unidirectional causality moving from economic growth to trade openness is found in South Africa validating growth-led trade hypothesis. As trade openness is a significant determinant of economic growth in BRICS, the member countries should adopt policies towards trade liberalization to sustain economic growth. Moreover, these emerging markets offer a pool of investment opportunities for the global managers.
Introduction
High economic growth is the ultimate objective of all the developing and developed countries as it improves the quality of life. Achieving fast and sustained economic growth is a major challenge in the developing world (Pradhan, Arvin, & Norman, 2015). Trade openness has recently been considered as a significant determinant of economic growth and has become a key element for policymaking in developing countries. It has been witnessed that international trade openness has played an important role in the development process of a country. World Bank, International Monetary Fund and World Trade Organization recommend trade openness to achieve high economic growth. Trade liberalization has become an important part of structural adjustment programme in many developing countries. The potential benefit of outward-oriented trade policy for economic growth has been the subject of empirical investigation in both developed and developing economies. According to classical economists, trade liberalization will increase the economic growth. Against the liberal understanding of some classical economists, some argued that trade openness negatively affects economic growth and defended that import substitution is important for protection of domestic industry (Bahmani-Oskooee & Niroomand, 1999; Galindo, Micco, & Ordonez, 2002; Odekon, 2002). However, some economists argued that it is not always necessary that free trade would contribute to economic growth, as development levels are different in different countries, and suggested import substitution (Chang, 2004). Many researchers found that trade openness leads to economic growth of the country (Anderson & Babula, 2009; Tahir & Norulazidah, 2014). Most of the earlier studies have only focused on the effect of export expansion on economic growth while ignoring the significant contribution of imports. In the literature, empirical studies on international trade explained the significance of trade openness in economic growth with the help of export-led growth hypothesis and import-led growth hypothesis (Balassa, 1978, 1985; Bhagwati, 1978; Feder, 1982; Michaely, 1977; Mishra et al., 2010; Ram, 1987; Shahbaz, Azim, & Ahmad, 2011; Tyler, 1981).
The relationship between exports and economic growth has been attributed to the potential positive benefits derived from trade with foreign markets. Export is considered as an engine of growth due to three reasons. First reason is that increase in foreign demand for domestic products can lead to overall growth in output via decrease in unemployment and increase in income of exportable sector. Second, export can affect growth indirectly through different routes like greater capacity utilization, economies of scale and quality improvement due to foreign market competition (Helpman & Krugman, 1985). Third, increased exports can provide foreign exchange that helps in payment of import which further increases capital formation and thus speed up economic growth (Balassa, 1978). Banik (2012) explained that exports is an important determinant of GDP and affects the economic growth through the multiplier process. In most of the studies, trade openness has been investigated focusing on exports (Esfahani, 1991; Riezman, Summers, & Whiteman, 1996; Thangavelu & Rajaguru, 2004).
Although imports and import competition play key roles for economic growth, yet relatively little attention has been devoted to the causal relationship between import and economic growth. Imports have the potential to play an important role in stimulating overall economic growth. But, the effect of import on economic growth is quite different from that of exports. Endogenous growth models showed that imports provide access to foreign technology and knowledge, thus stimulating long-run economic growth, and help in capital formation. According to Lawrence and Lawrence (1999), technological development enhances the productivity of trading nations. In addition, Grossman and Helpman (1991), Rivera-Batiz and Romer (1991) and Romer (1990) stated that trade openness increases the number of specialized inputs, cutting-edge technologies and advanced machines, equipments, tools and capital goods in developing countries. Consequently, technology transfer via imports enhances the economic growth.
Trade Openness and Economic Growth
The openness of the country is usually calculated as the proportion of foreign trade volume to GDP besides the usage of the individual proportion of export or import to GDP (Anoruo & Ahmad, 2000; Awokuse, 2011; Burange et al., 2013; Chow, 1987; Hye & Lau, 2015; Kakar 2015; Khilji, 2011; Kwan & Cotsomities, 1991; Mercan, Gocer, Bulut, & Dam, 2013; Okuyan, 2012; Pilinkiene, 2016; Romer, 1993). Openness also indicates the dependence of the country on foreign trade. The size of openness rates indicates the significance level of foreign trade for the development of the economy through capital formation. In addition, openness increases the foreign exchange reserve as a result of export expansion which is further used for import. In addition, removal of trade restrictions is important because it gives an opportunity for the economies to take advantage of visible benefits (Banik, 2014).
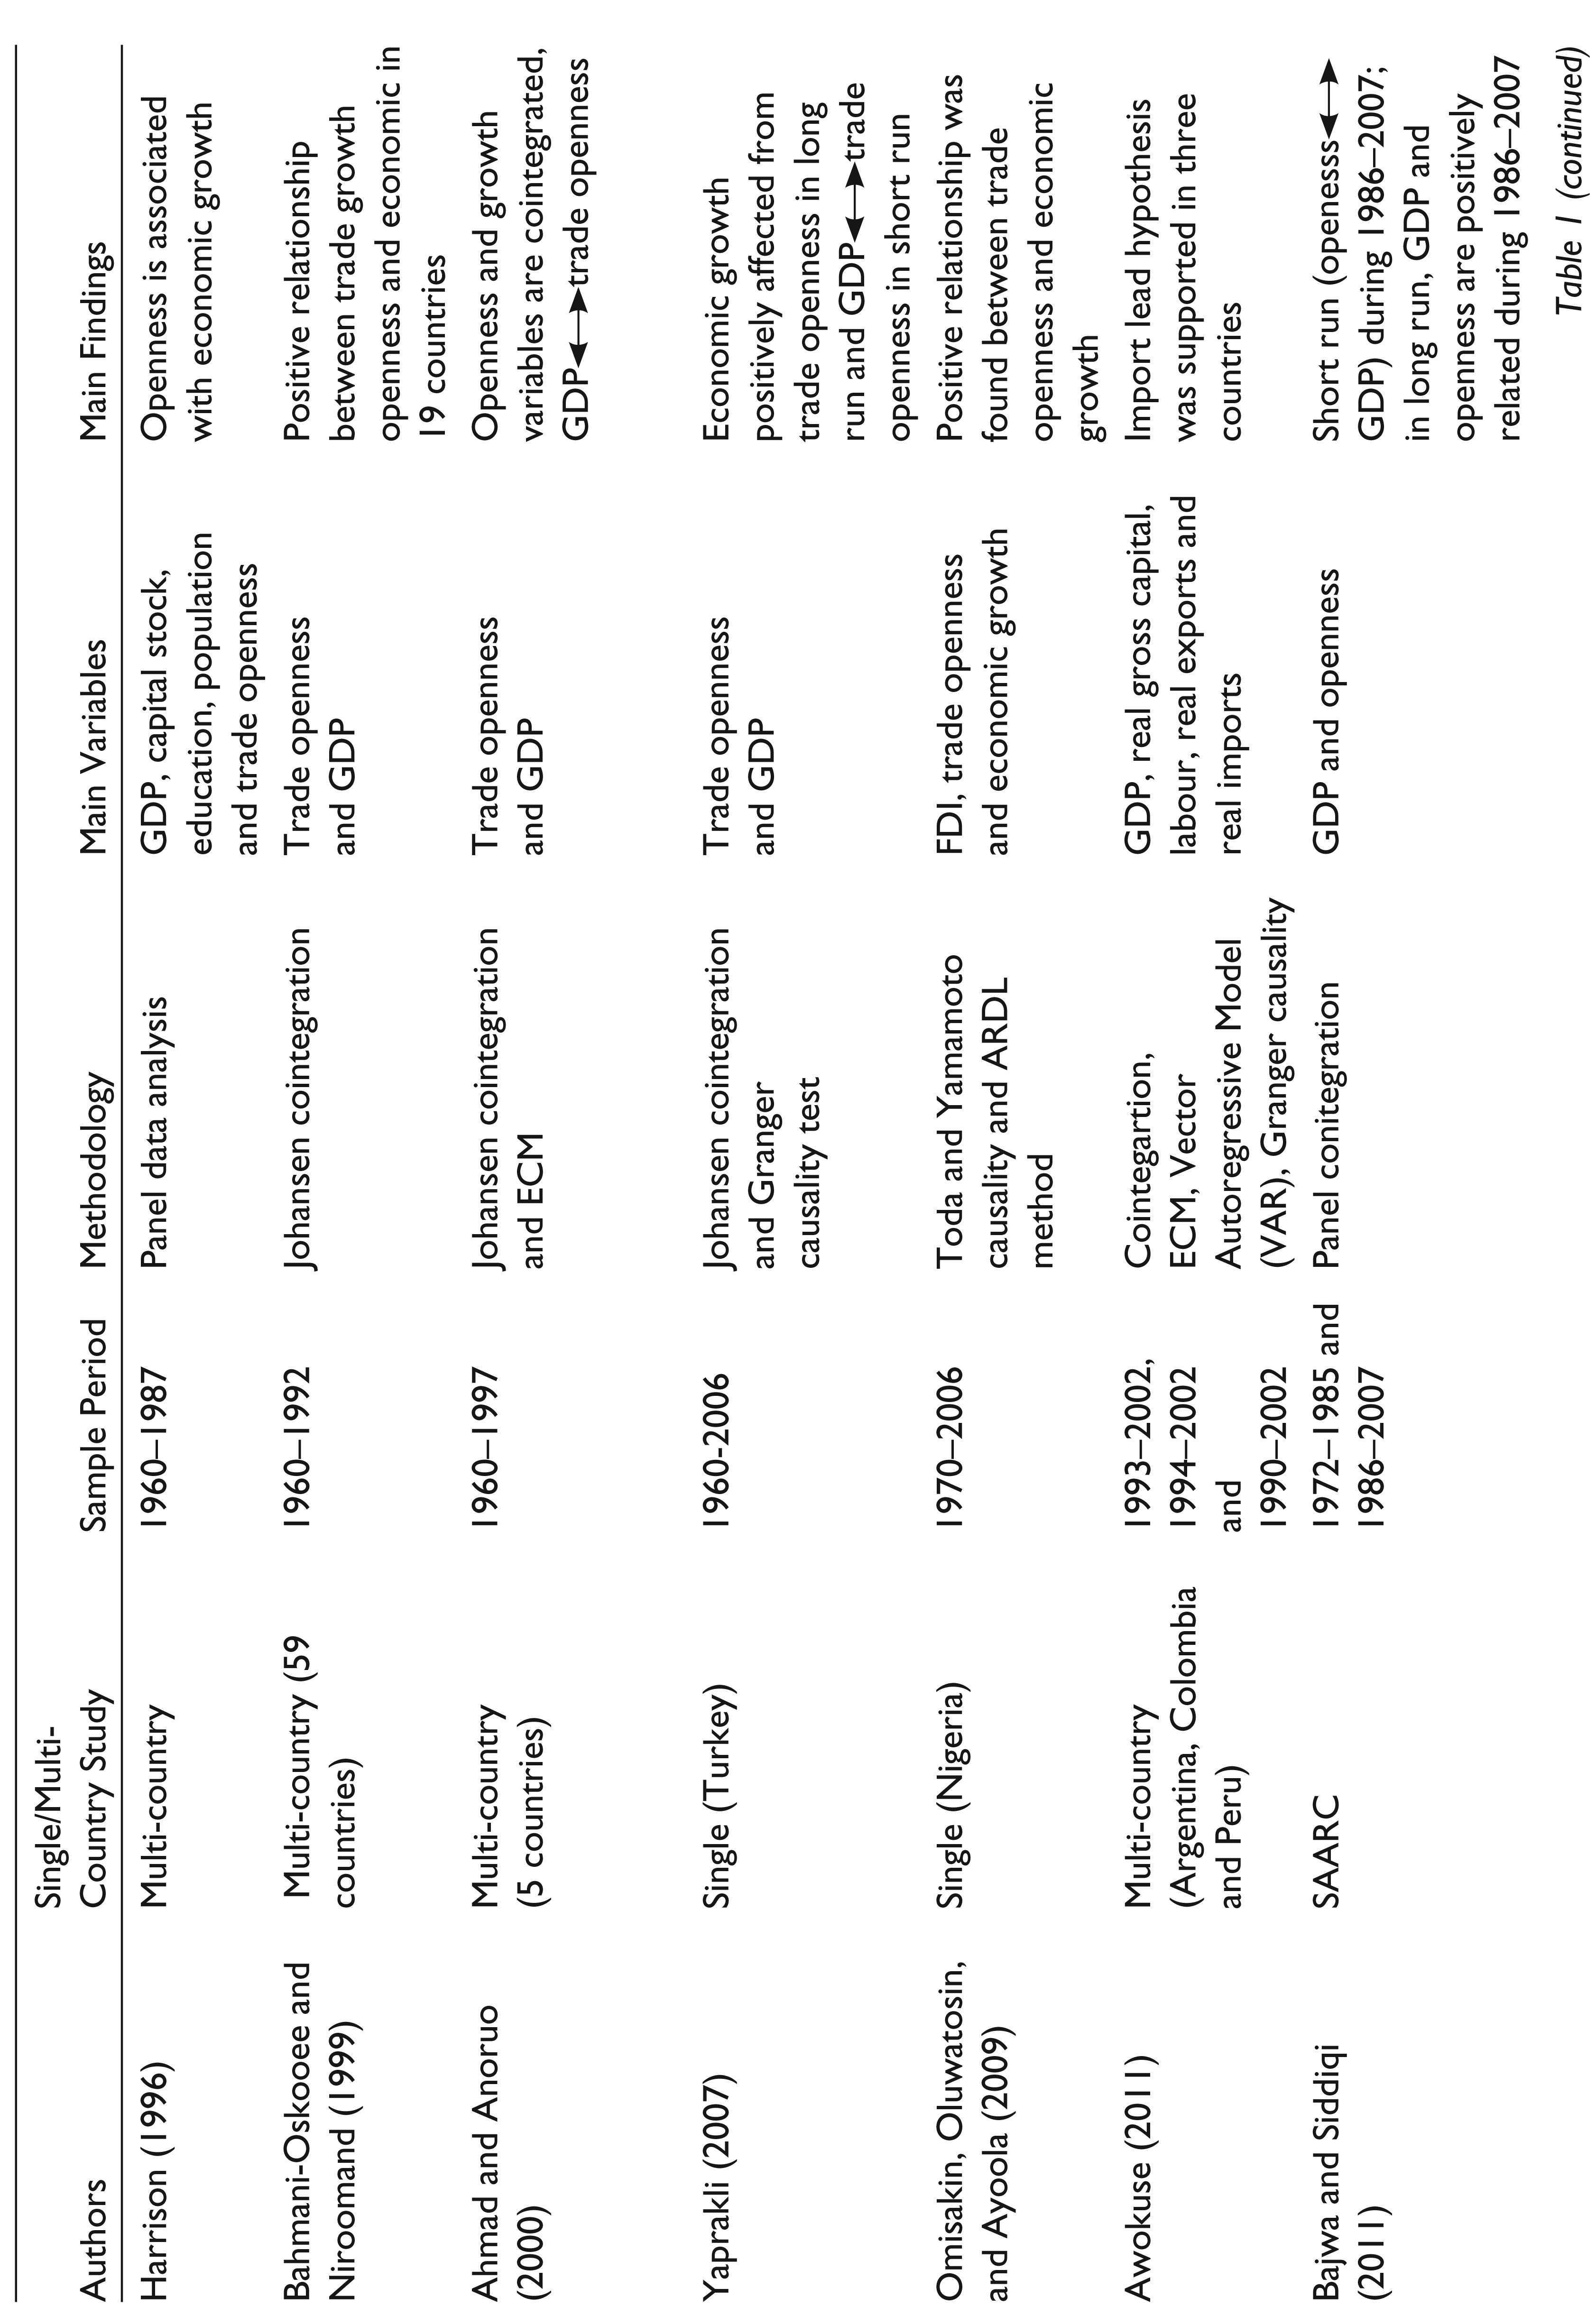
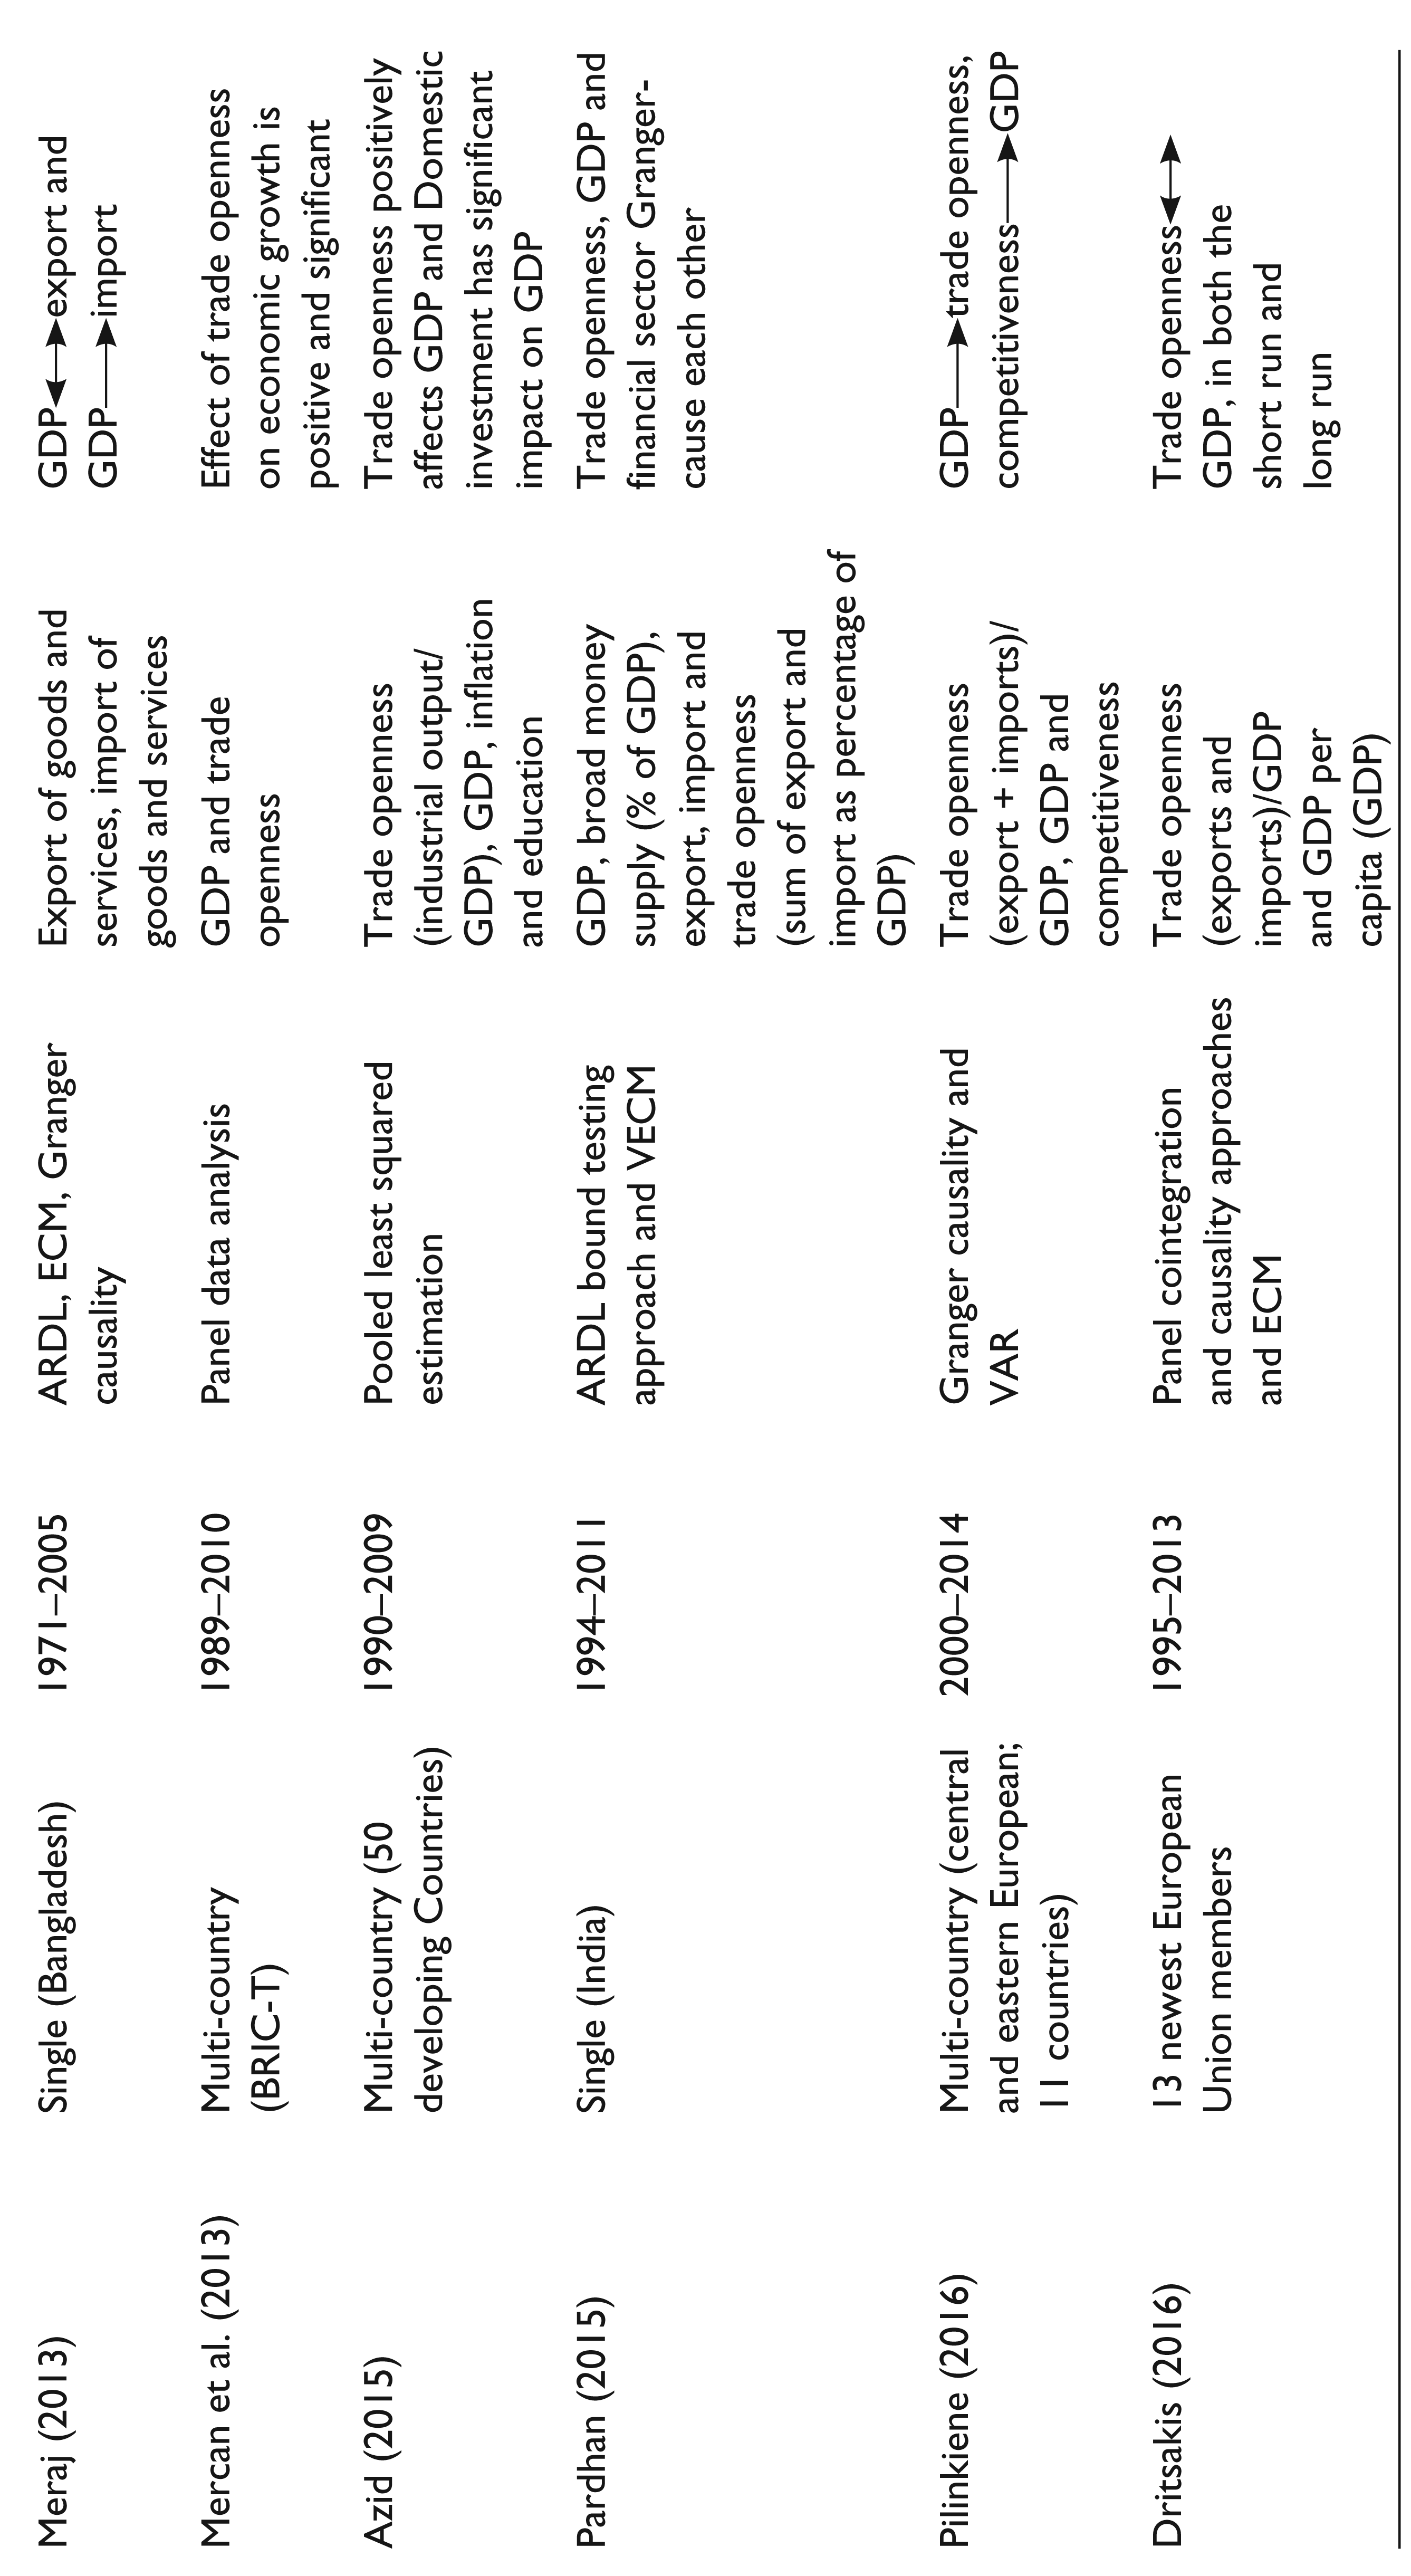
Besides the individual relationship of export or import with economic growth, there are four main competing hypotheses regarding trade openness. First proposition is trade-led growth (TLG) hypothesis which asserts that the causality runs from trade openness to economic growth (Bojanic, 2012; Kumar & Pacheco, 2012; Muhammad, Hussain, & Ali, 2012; Yavari & Mohseni, 2012). The second is growth-led trade (GLT) hypothesis that suggests unidirectional causality runs from economic growth to trade openness (Harrison 1996; Levine & Renelt, 1992; Rodriguez & Rodrik, 1999). The third perspective is known as feedback hypothesis which advocates that economic growth and trade openness can complement and mutually cause each other (Chow, 1987a, 1987b; Liu, Song, & Romilly, 1997; Pradhan, 2013; Pradhan & Gunashekar, 2013). The fourth view is neutrality hypothesis which advocates that trade openness and economic growth are independent of each other (Chang, Simo-Kengne & Gupta, 2013; Din, 2004; Sarkar, 2007). Furthermore, Table 1 encapsulates some recent empirical studies on causal relationship among economic growth, trade openness and gross capital formation.
BRICS Current Scenario
At present, Brazil, Russia, India, China and South Africa (BRICS) encompass 40 per cent of the world’s population and account for nearly 30 per cent of total global GDP in terms of purchasing power parity. Further, with the total foreign exchange reserves of member countries estimated at US$ 4.3 trillion, BRICS accounts for approximately 40 per cent of global reserves. China has the largest share (17.08%) in world’s GDP and is the first largest growing economy in the world, whereas India’s share in world GDP is 7.1 per cent and secured third fastest growing economy in the world. Each of the BRICS countries has multiple and different attributes and thus each has a huge potential to develop. This is the reason that the balance of global economic power is now shifting from the United States and Europe to a number of fast growing and large developing countries. The total population of BRICS is about 3 billion people. China is the most populous country in the world with its 1.4 billion people, followed by India with 1.25 billion people. The population of Brazil is 205 million people. Russia, the world’s largest country by area, is home to about 120 million people. South Africa is home to 53 million inhabitants. BRICS are also enjoying demographic dividend in comparison with rapidly ageing countries, and longer life expectancy is likely to benefit the group in future. The population in the age group of 0 to 14 is highest in India (32.1%), followed by Brazil (27.9%), China (21.4%) and Russia (15.3%). The share of urban population is also growing. The increasing working population shows the huge demand and supply potential in BRICS economies (The BRICS Report, 2014).
Brazil is the fifth largest country in the world with 8.5 million sq. km land size. The share of Brazil in world GDP was 2.81 per cent (2015). India’s share in the total world capitalization is 2.5 per cent. India is the second largest participant among BRICS after China with 7.01 per cent share in world GDP. Russia’s relative strength is high labour work participation, very low public debt, a larger proportion of high-school students going on to tertiary education, strong position in higher education, with a powerful scientific system, particularly dedicated to space and defence activities and growing R&D expenditures. China is the biggest exporter, second biggest importer and second best destination for foreign direct investment. Chinese manufacturing sector captures the unskilled labour of the country and puts the unemployment rate low. Although South Africa is a small country, it showed its visibility in world with 0.5 per cent share in global trade. In total world GDP, the share of South Africa is 0.69 per cent.
The participation of the BRICS countries in world GDP is expected to rise sharply in the years to come. Economic and demographic trends are creating profound social and political transformations within the BRICS nations. The share of BRICS in merchandise exports was 17.48 per cent in 2012 in world’s export that increased to 19.01 per cent in 2015, whereas import constitutes 16.13 per cent share (2012) in total world imports (World Trade Organization, 2015). In 1990, BRICS accounted for only 3 per cent of global trade. This share doubled by the turn of the century. The share of member countries in world export increased from 8 per cent in 2002 to 19 per cent in 2014. In addition, BRICS accounted for 16 per cent of global imports of goods and services. Considering the increasing share of BRICS in world trade, it became important to investigate impact of trade on economic growth of BRICS. These emerging markets offer a pool of investment opportunities for the global managers. So, global investors can take the advantage of doing trade with BRICS nations.
Literature Review
Objectives and Rationale of the Study
The theoretical literature shows that trade openness affects the economic growth by different channels (capital accumulation, factor price equalization and more employment). Considering the benefits and vast opportunities of trade openness, the present study investigated the link between trade openness and economic growth of member countries of BRICS. Specifically, the first objective of the present study is to investigate the long-run relationship among trade openness, gross capital formation and economic growth. The second objective is to examine the direction of causality among competing variables. Nonetheless, we hope to make a contribution to a better understanding of the links between both trade openness and economic growth.
Methodology and Data Analysis
This article applied autoregressive distributed lag (ARDL) model and vector error correction model (VECM) to examine the long-run association and casual relationship among the competing variable. The study uses annual time series data of Brazil (1966–2015), Russia (1989–2015), India (1966–2015), China (1982–2015) and South Africa (1966–2015). The variables taken for analysis are GDP per capita, trade openness and gross capital formation. All the variables are taken from online world development indicators database of World Bank. GDP per capita is measured at constant local currency unit of each country. Trade openness is measured as ratio sum of exports of goods and services and imports of goods and services to GDP at constant price (Meraj, 2013; Mercan et al. 2013; Okuyan et al., 2012; Ohlan, 2010, 2015; Pradhan, 2015). The relationship among variables is expressed through the following specification:
Empirical Evidence on Relationship between Economic Growth, Trade Openness and Gross Capital Formation


Here, GDPPC is gross domestic product per capita, TOPEN is trade openness and GCF is gross capital formation.
Using log-linear transformation of the variables Equation (1) can be rewritten in a time-series econometric specification as follows:
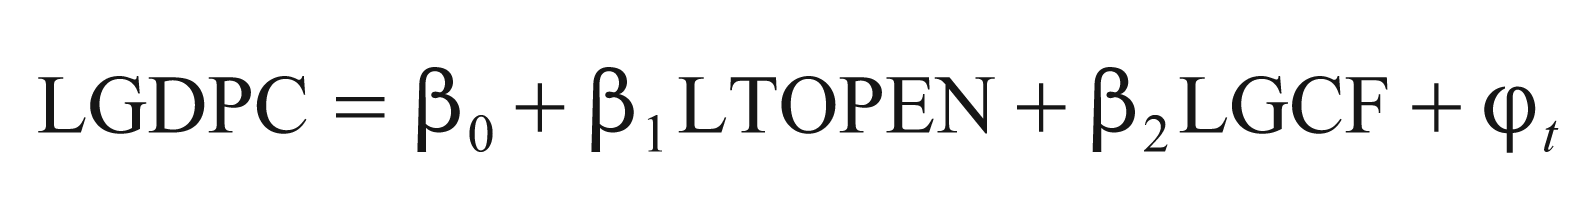
Here, L is natural log, β1 and β2 are elasticities of economic growth with respect to trade openness and gross capital formation, β0 is intercept parameter and φ is the error term.
Investigation of the cointegration between the variables using teh ARDL approach does not formally require pretesting of variables for unit root. Testing of stationarity of the variables is carried out to ensure that variables are not I(2). To determine the order of integration of series, we applied the augmented Dickey–Fuller (Dickey & Fuller, 1981) unit root test. The results of unit root test presented in Table 2 shows that all the variables under study are stationary at first difference except GDP per capita of Brazil that is stationary at level i.e. I(0) (the null hypothesis of the presence of unit root is rejected once the series are in the first difference).
The autoregressive distributive lag model has the advantage that it does not require all variables to be I(1) as in Johansen cointegration and applicable even if variables are I(0) and I(1). To investigate the presence of long-run relationships among the GDP per capita, trade openness and gross capital formation in BRICS, bound testing under Pesaran, Shin and Smith (2001) procedure is used. The bound test is based on the joint significance of F-statistic and the chi-square statistic of Wald test. If the computed F-statistic is greater than the upper bound critical value (bound test), then empirical results confirmed the long-run relationship among underlying variable, and if the calculated F-statistic falls below the lower critical value, then we found the evidence of no cointegration among variables. The ARDL model is specified in Equation (3):
Unit Root Test (Augmented Dickey–Fuller Test)

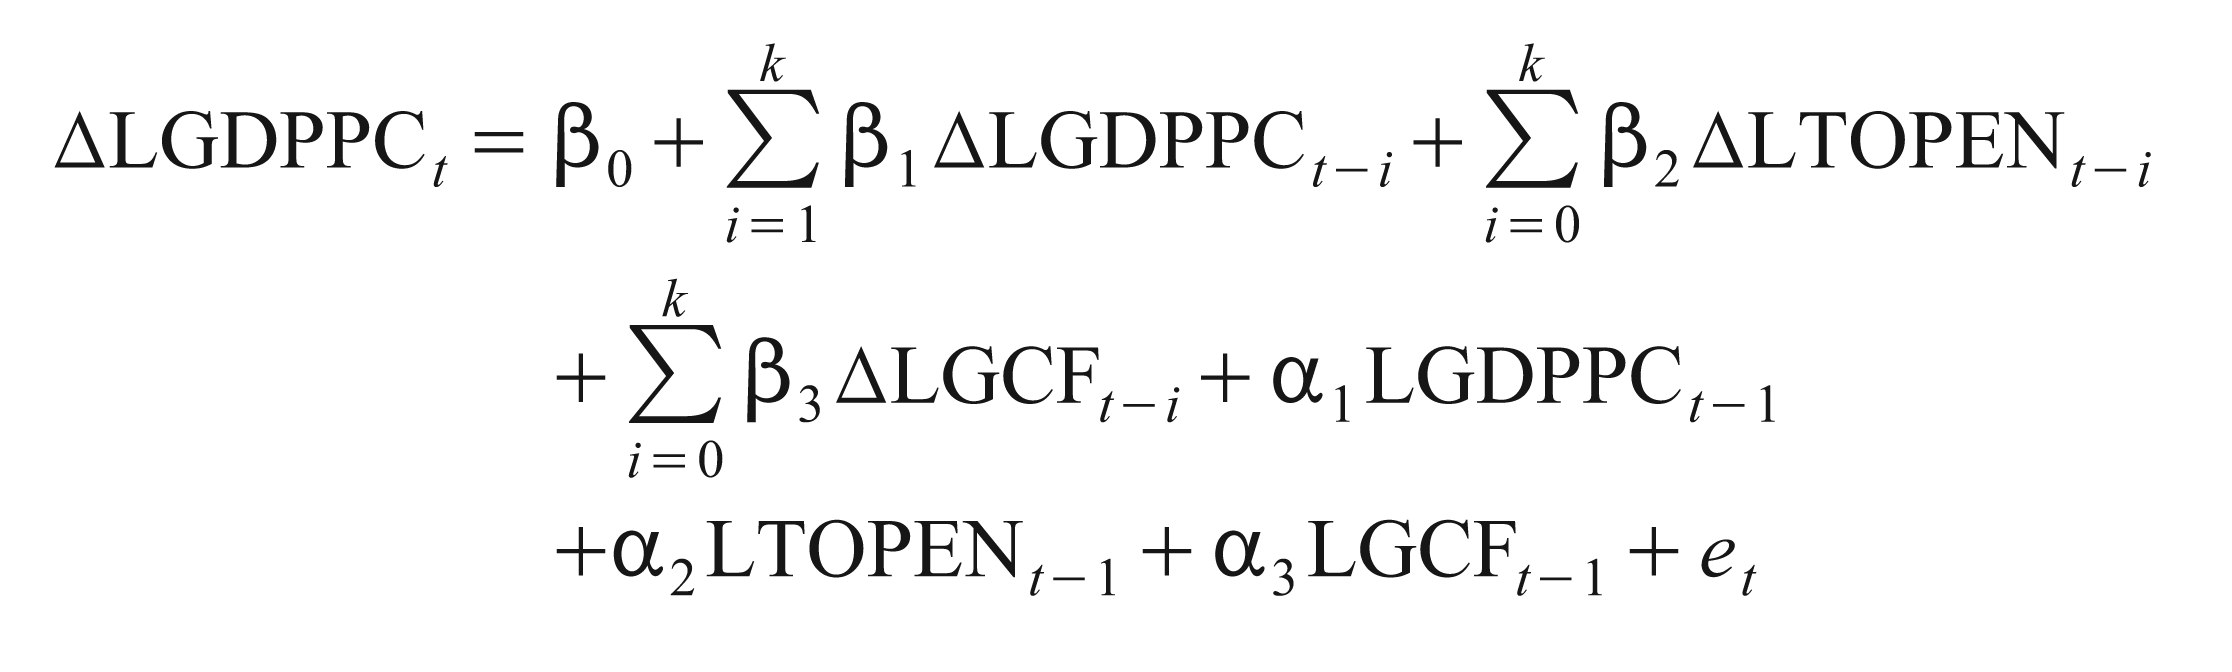
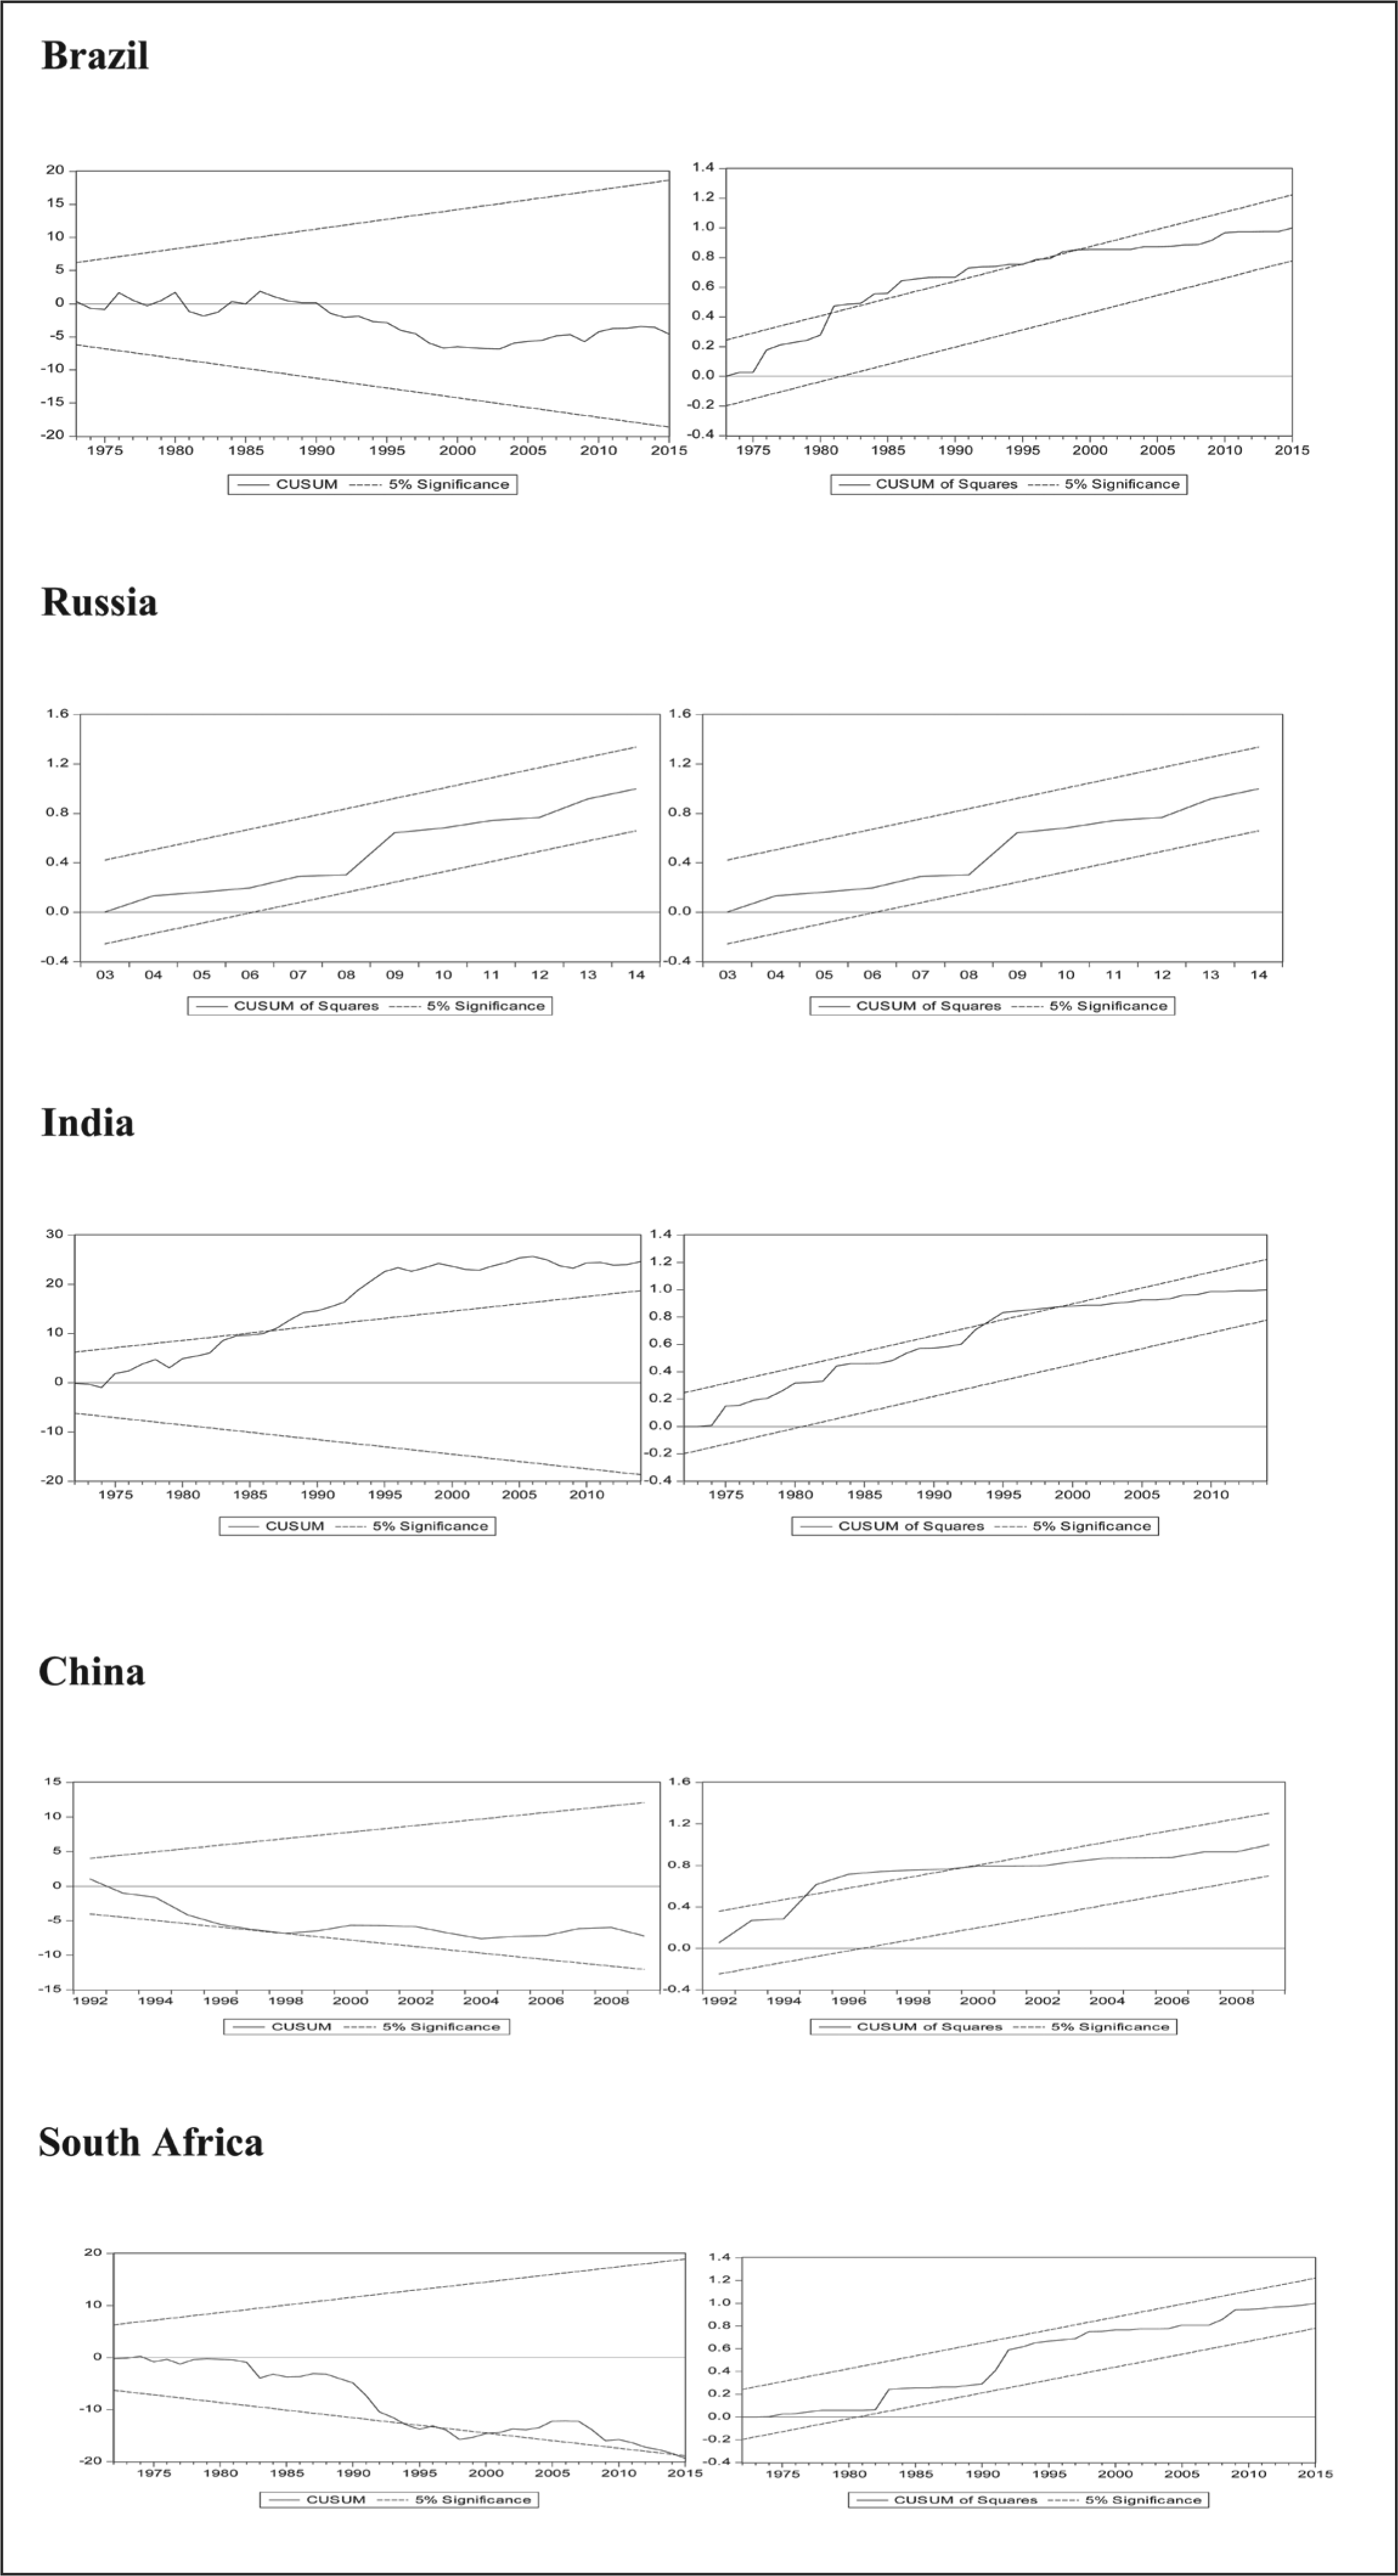
On the right-hand side, α1, α2, α3 represent the coefficient of long-run relationship. The remaining expressions with the summation sign (β1 to β3) represent the short-run dynamics of the model. In addition, the long-run stability of the parameters is tested by applying the cumulative sum (CUSUM) and the cumulative sum of squares (CUSUMSQ) tests suggested by Pesaran and Shin (1999). CUSUM and CUSUM square confirm the stability of model in long run.
The long-run elasticity of economic growth with respect to trade openness and gross domestic capital formation estimated using the underlying ARDL model is shown in Table 3. The critical value of F-statistics of the bound test at 5 per cent level is greater than upper bound, confirming the long-run relationship among competing variables of the study. The result of Brazil indicates that in long run, trade openness has a statistically significant positive impact on economic growth at 10 per cent level of significance. Specifically, the magnitude of 0.09 implies that a 1 per cent increase in trade openness leads to increase GDP per capita by 0.09 per cent. It means that trade openness enhance the growth in Brazil in long run. Not surprisingly, gross domestic capital formation also has a positive impact on economic growth in Brazil. It means that 1 per cent increase in gross domestic investment will increase the GDP per capita by 0.2 per cent. In case of Russia, trade openness is found to have a significant impact on GDP per capita in long run and significant at 5 per cent level. It could further mean that 1 per cent increase in trade openness increase the GDP per capita by 0.22 per cent. In addition, gross domestic capital formation is also found positive and statistically significant at 5 per cent level. A 1 per cent increase in capital formation will lead to increase the GDP per capita by 0.18 per cent in Russia.
Testing Cointegration: ARDL Bound Testing Procedure
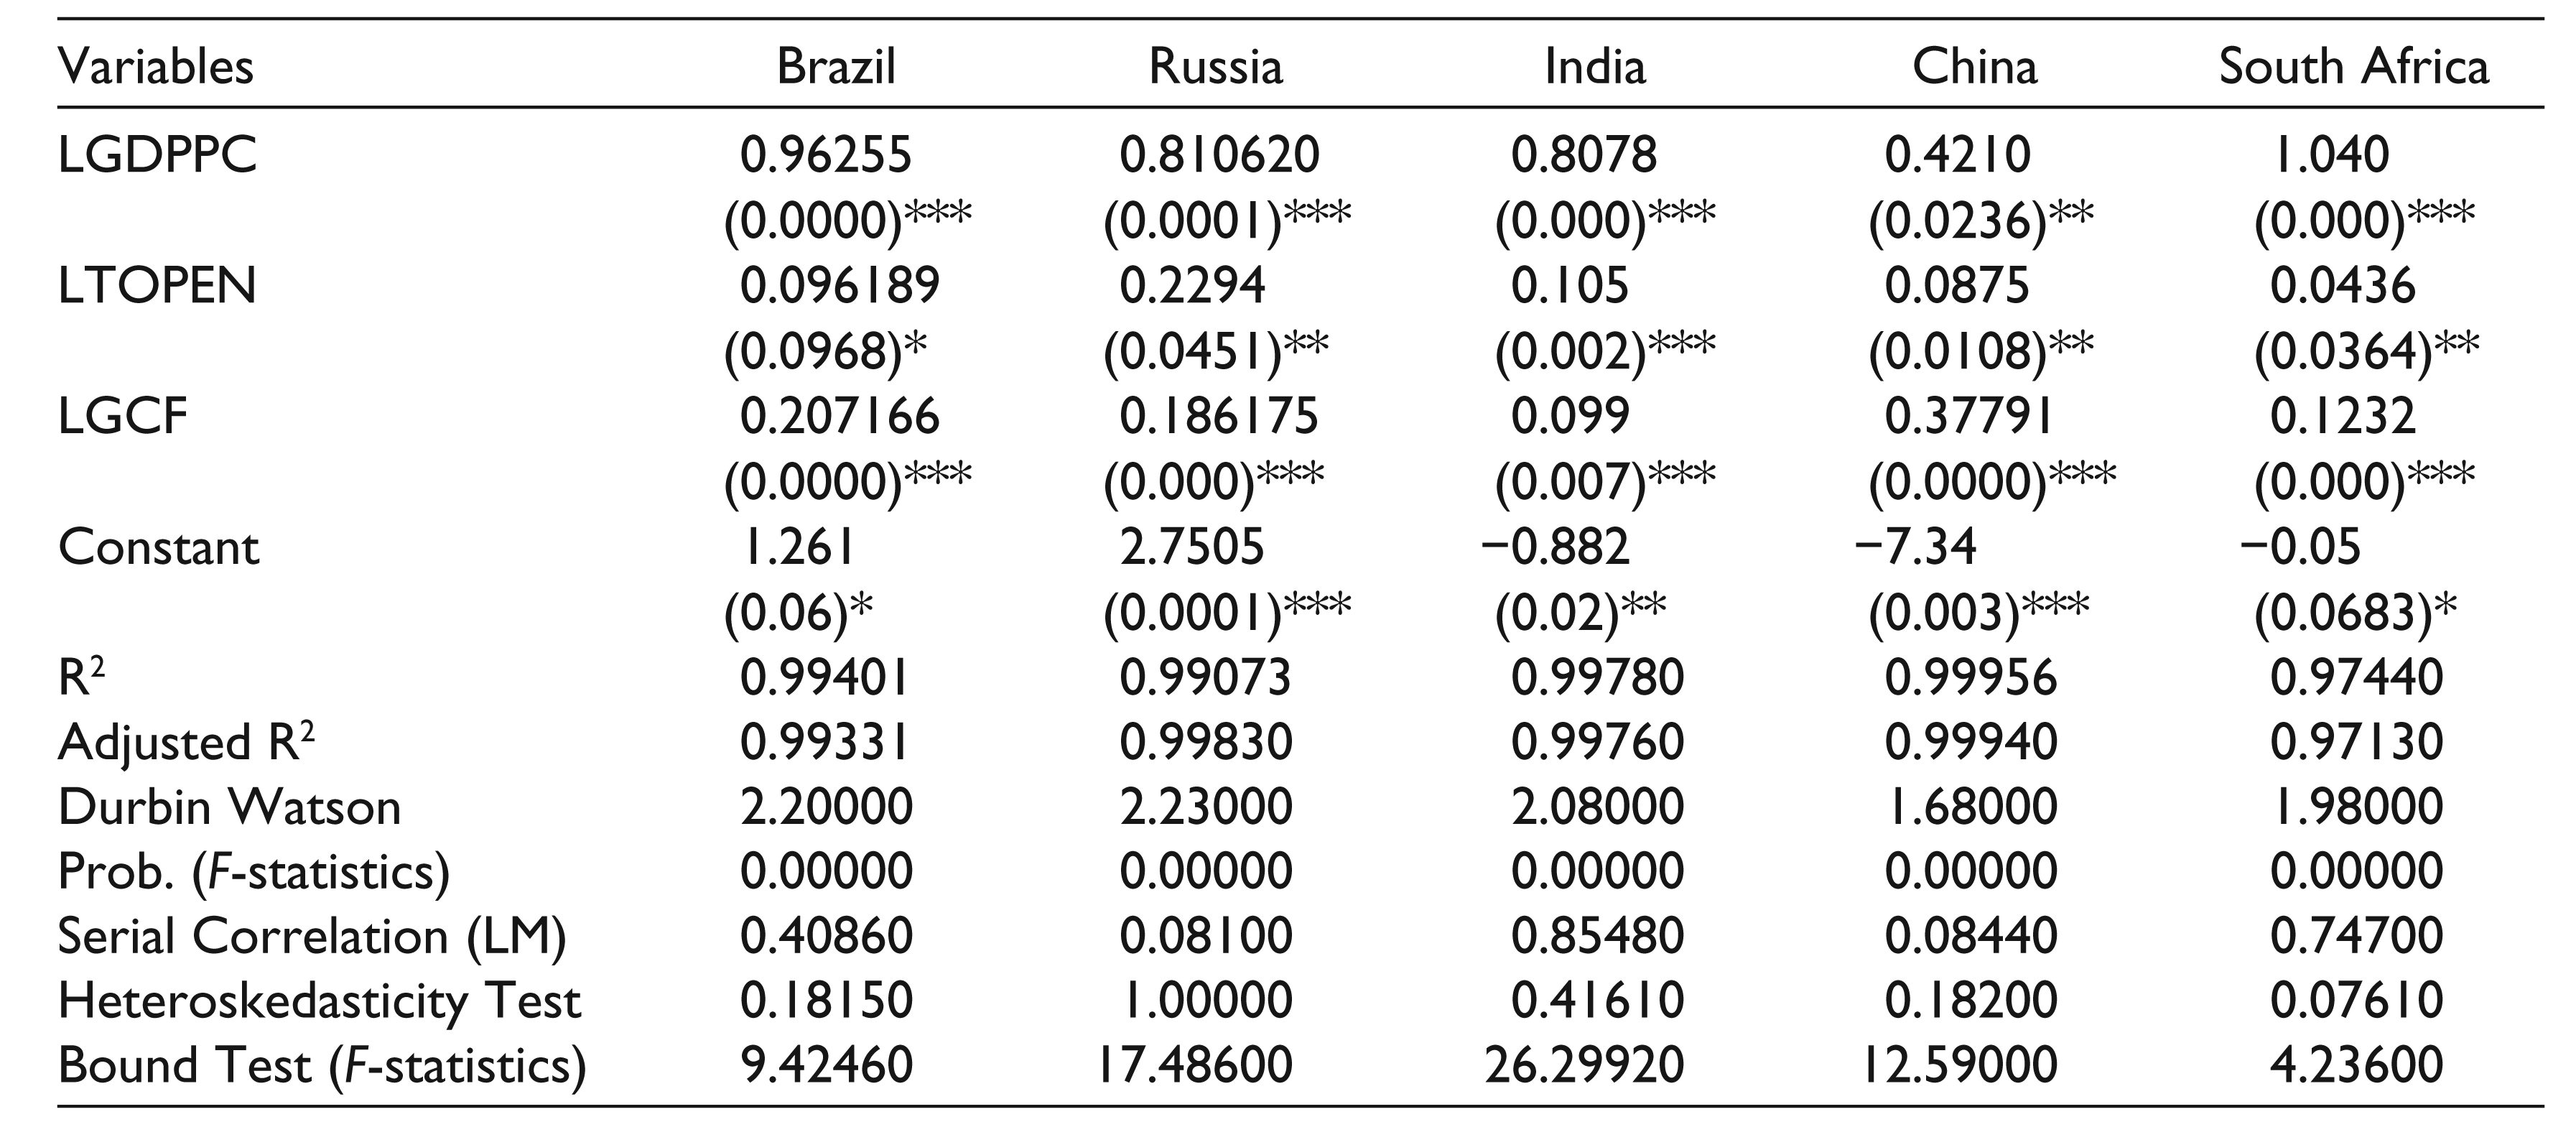
In India, trade openness and gross domestic capital formation have a positive and significant impact on GDP per capita. A 1 per cent increase in trade openness will lead to increase the GDP per capita by 0.10 per cent. Further, 1 per cent increase in gross domestic capital formation led to an increase in the GDP per capita by 0.09 per cent in long run. Not surprisingly, trade openness has a positive and significant impact on economic growth in China. The elasticity of economic growth with respect to trade openness is 0.08 per cent in China. Gross domestic capital formation has strong and positive impact on GDP per capita. The result shows that 1 per cent increase in gross capital formation increases the GDP per capita by 0.37 per cent. In case of South Africa, trade openness has a positive and significant impact on GDP per capita meaning that 1 per cent increase in trade openness will increase the GDP per capita by 0.04 per cent. While 1 per cent increases in gross capital formation increase the GDP per capita by 0.12 per cent.
Moreover, the estimated ARDL model passed the usual diagnostic tests. The value of R square is above 99 per cent except South Africa (97%) indicating fitness of model. Further, Breusch–Godfrey serial correlation LM test shows that there is no serial correlation. In addition, chi-square value of heteroskedasticity test is also significant at 5 per cent level. The p-value of Durbin–Watson statistics indicates no autocorrelation among residuals.
In brief, BRICS nation validates the TLG hypothesis in long run. This could further mean that not only export but also import plays a significant role in economic growth of these nations. The results show that trade openness is significantly related with economic growth at 5 per cent level except Brazil (10%). It follows that the countries belonging to the BRICS have benefitted significantly from the process of trade liberalization. The BRICS nations are, therefore, suggested to speed up the process of trade liberalization to accelerate the long-run economic growth. The results have also provided strong evidence in favour of a positive long-run relationship between domestic capital investment and economic growth. The developing countries (like Brazil, India and South Africa) in general are facing the problem of scarcity of capital formation. Domestic investment plays a vital role in the growth process. It implies that the BRICS countries should invest more in the domestic economy if they want to grow faster. Further, increase in exports will provide foreign reserves which can be used to import new technology and capital goods. These altogether increase the domestic investment, hence stimulate economic growth.
We implemented the cumulative sum (CUSUM) and cumulative sum of square (CUSUMQ) stability test based on residuals of ARDL model. According to Figure 1, there is no stability issue in Brazil, Russia and South Africa. However, for India, CUSUM test indicates that there is structural break in the GDP during 1990s but CUSUM square shows stability in long run. While, in China, CUSUM square indicates instability but CUSUM test shows the stability in long run.
VCEM for Granger Causality
After analysing long-run association, the Granger causality test is used to check the causality relationships between the variables with the application of VECM. It must be noted that the estimations of both ARDL and VECM are very sensitive to lag length (Granger & Lee, 1989; Ma, 2007). Akaike Information Criterion is used to choose the optimum lag length following Burnham and Anderson (2004). The presence of cointegrated long-run relationships among economic growth, trade openness and gross capital formation entitles us to apply the VECM Granger causality approach. The direction of causality is essential, as it informs policymakers the relative significance of alternative approaches to stimulate economic growth. The VECM model is specified in Equation (4), as follows:
Granger Causality Test Results Based on Error Correction Model
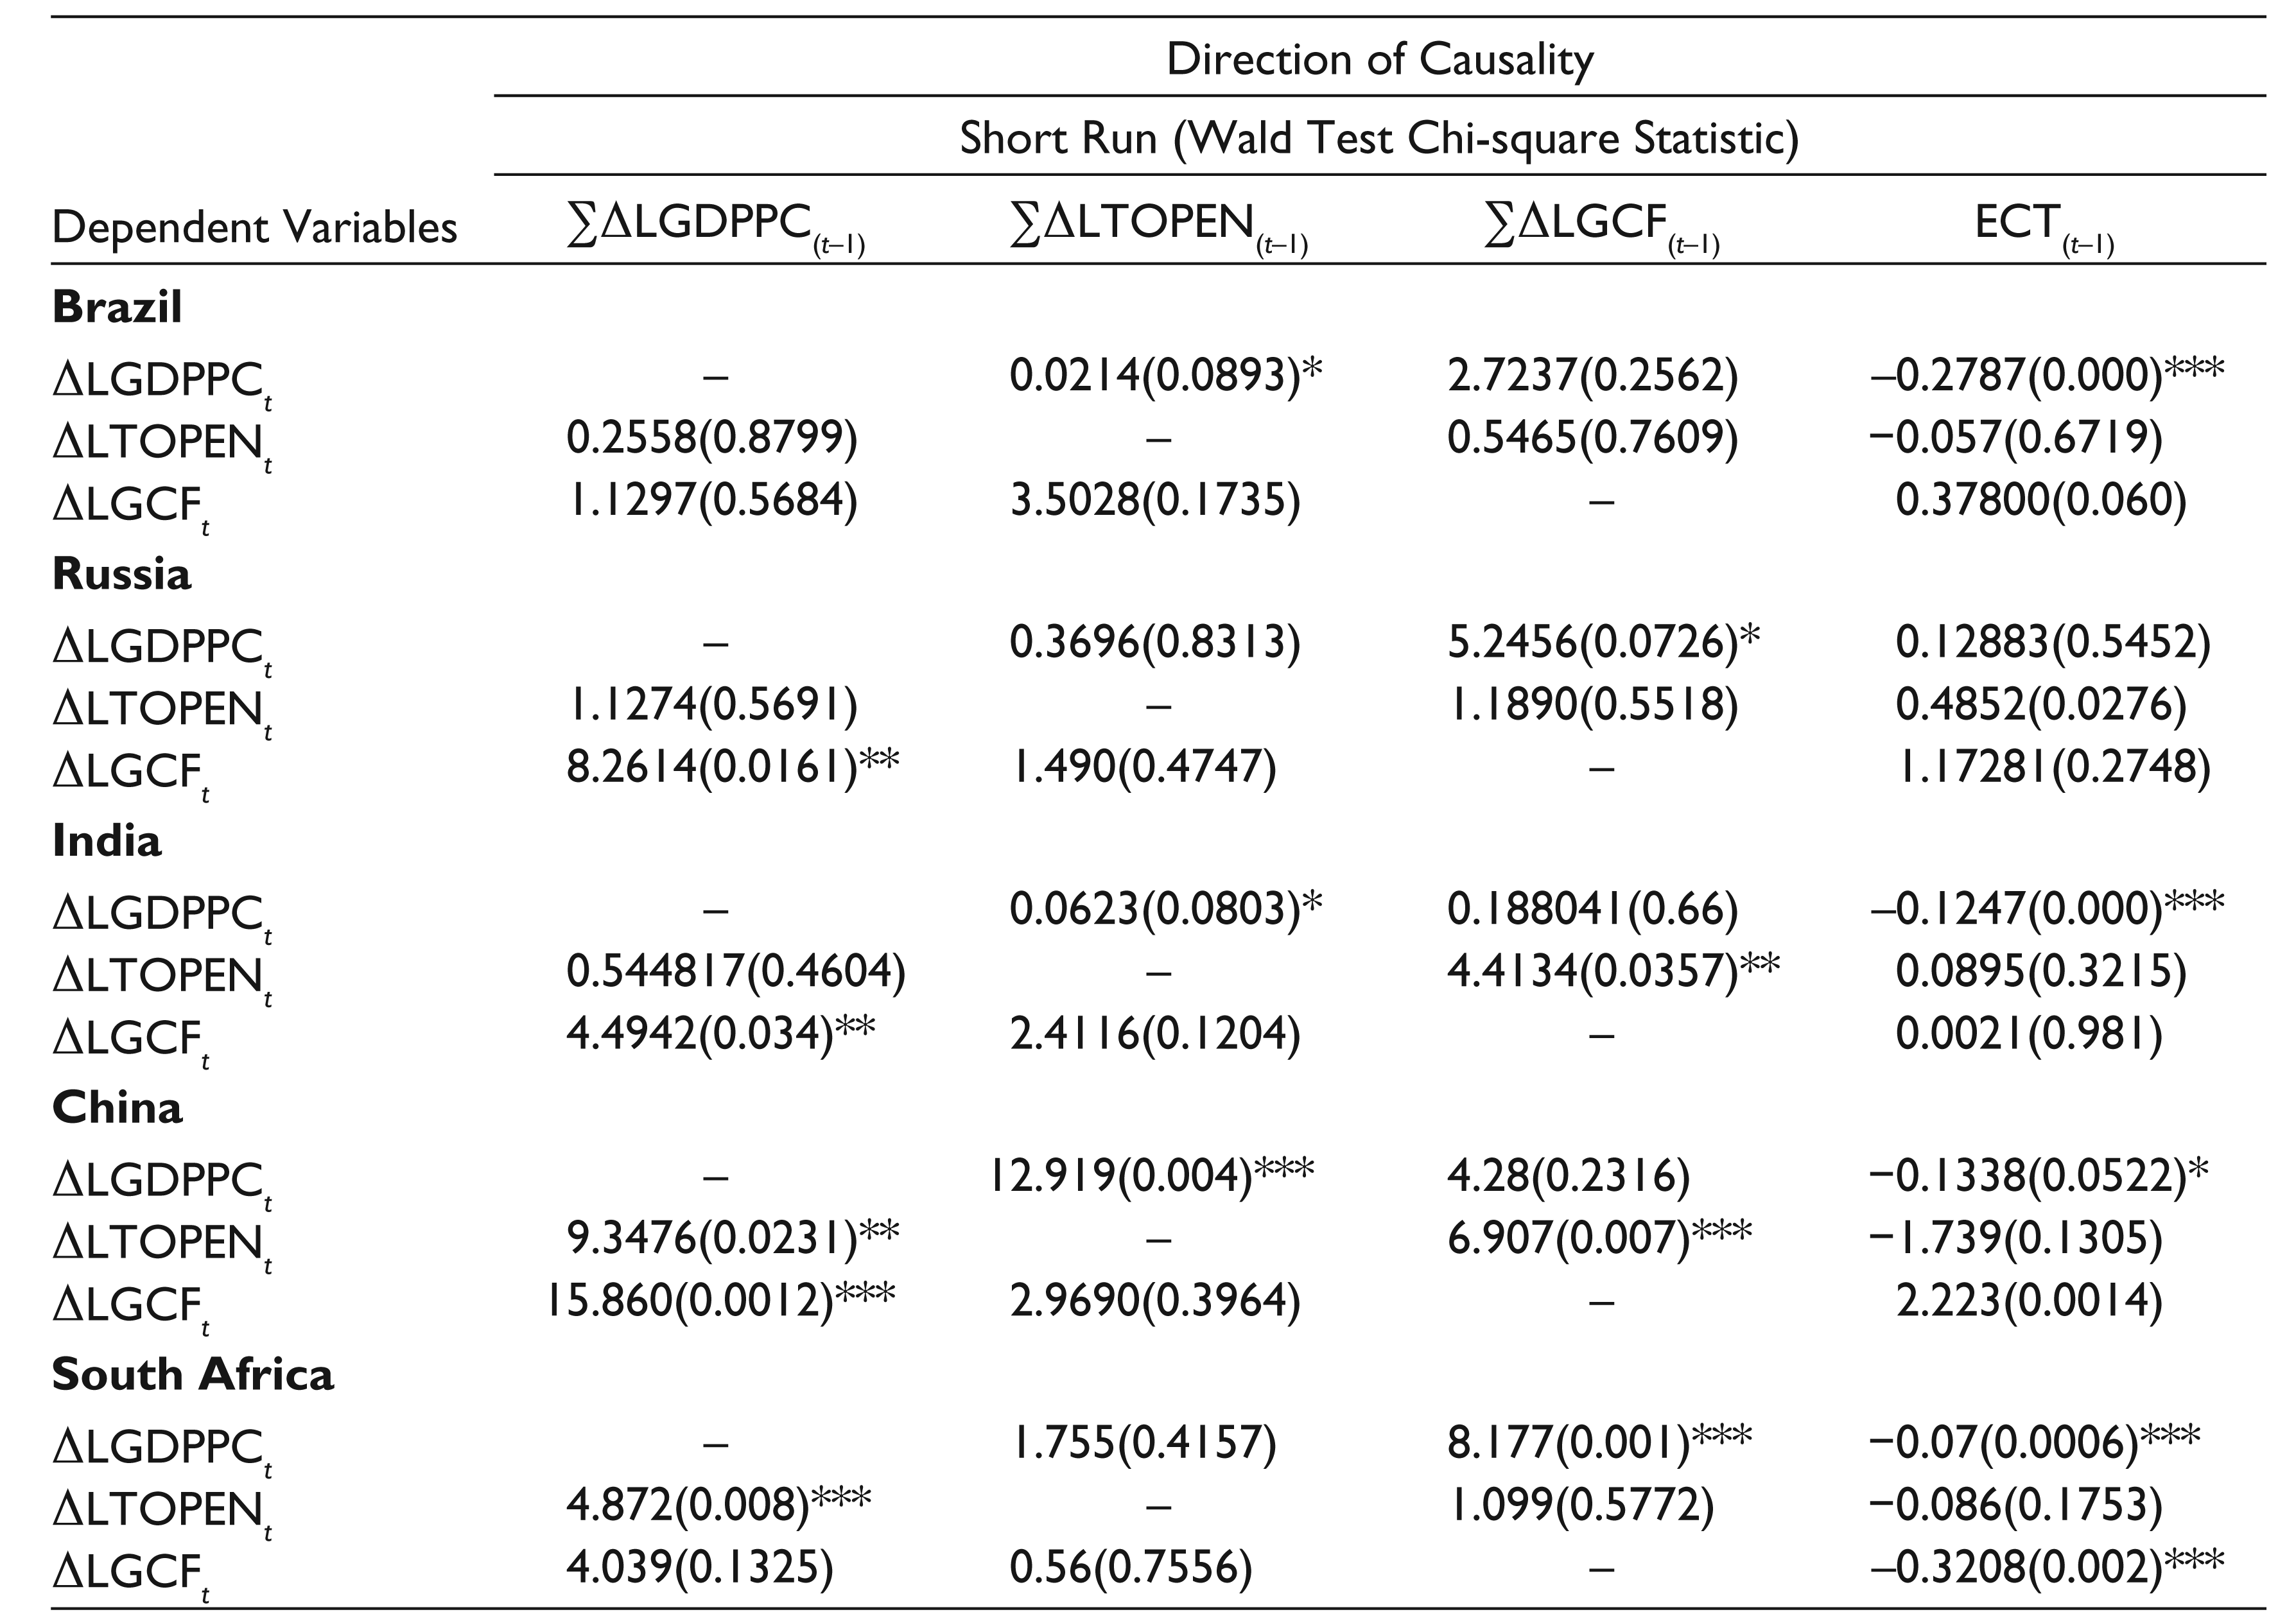
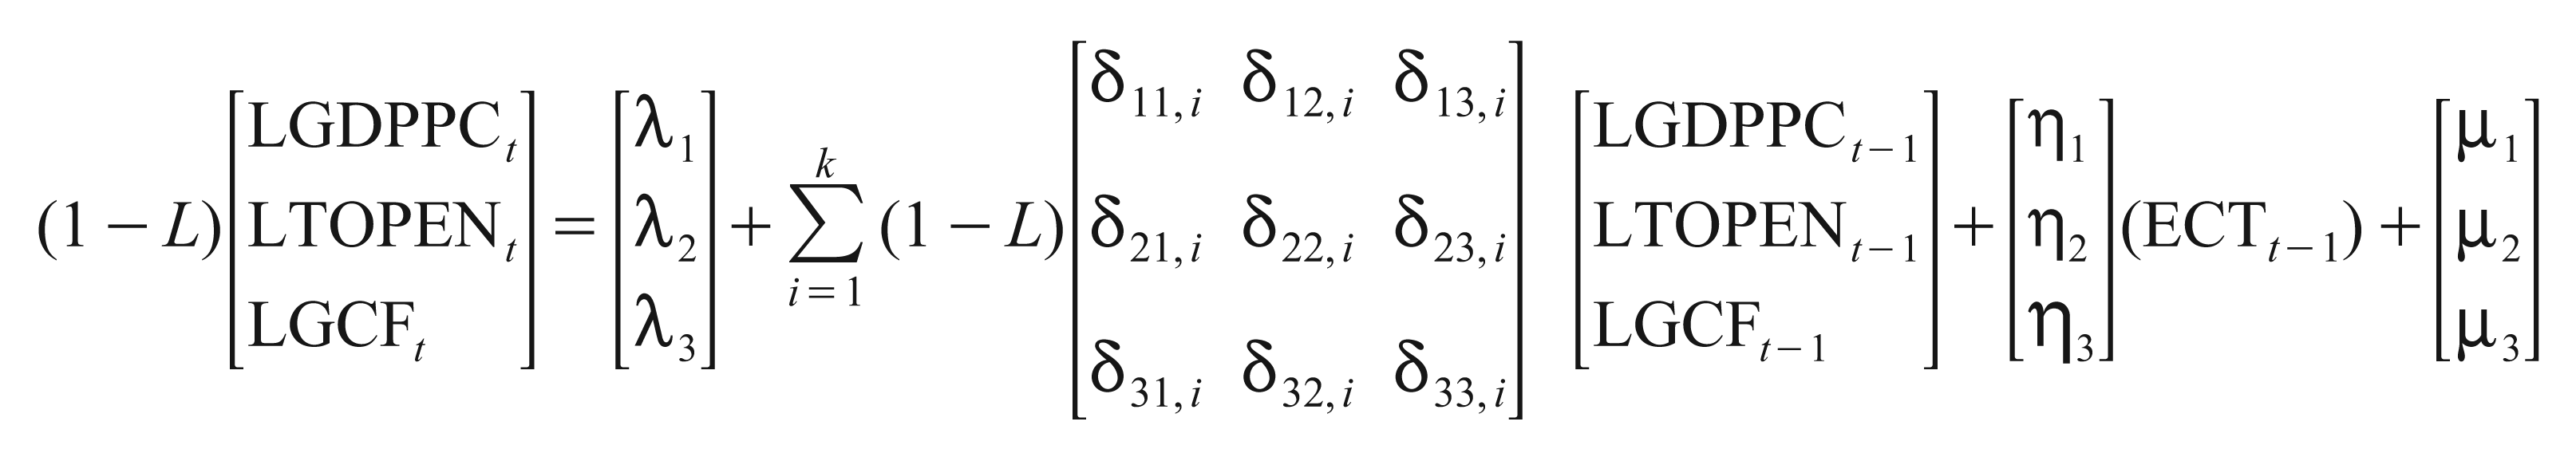
Here, (1−L) shows the difference operator, ECTt-1 is the one period lagged error correction term. λ1, λ2 and λ3 are constant and δ11,i to δ33,i shows the short-run causality. η1, η2 and η3 show long-run causality. μ1, μ2 and μ3 are error terms. The statistical significance of ECTt-1 is checked by applying t-test statistic and confirms the existence of long-run Granger-causality while that of Wald’s test chi-square statistic for the combined significance of lagged values of variable exhibits short-run dynamics.
The Granger causality results are reported in Table 4. Empirical evidence shows that in short run, unidirectional causality is running from trade openness to GDP per capita in India and Brazil (supports TLG hypothesis). In China, bidirectional causality is running between trade openness and GDP per capita (supports Feedback hypothesis). While in South Africa, unidirectional causality is running from GDP per capita to trade openness (validating GLT hypothesis). Moreover, bidirectional causality is found between gross capital formation and GDP per capita in Russia while in case of India and China, causality is unidirectional and running from GDP per capita to GCF. In South Africa, causality is running from gross capital formation to GDP per capita. Regarding the long-run causality, ECT coefficient of all the BRICS nations, except Russia, are negative and significant suggesting unidirectional causality running from trade openness and GCF to GDP per capita. The causality from trade openness to GDP confirms the validity of TLG hypothesis confined with the results of Bojanic (2012); Yavari and Mohseni (2012); Kumar and Pacheco (2012) and Muhammad et al. (2012).

Using the previously estimated VECM system, the causal analysis is extended by examining impulse response function (IRF). An IRF capture the impact of one-time shock to one of the innovations on current and future values of endogenous variables (Koop, Pesaran, & Potter, 1996). Thus, IRFs could provide clear picture of shocks effect GDP per capita, trade openness and gross capital formation with each other. Figure 2 provides results of Cholesky impulse response for BRICS. To trace the completeness, impulse responses are provided for all the three competing variables in the system. However, focus is placed only on the relationship between trade openness and GDP per capita. The simulation in the IRF covers 10 years to capture adequate time for tracing the effect of the shocks to variable in the system. The first column in the Figure 2 reveals the impulse responses of each variable to innovation from each of the other variables for Brazil followed by Russia, India, China and South Africa. Panel 1 reflects the impulse response of GDP per capita (a positive shock) to trade openness and gross capital formation in Brazil. When the impulse is GDP per capita (positive shock), the every response of trade openness is all time positive at each responsive period. In contrast, the response of GDP per capita to innovation in capital formation is negative.
Further, the response of GDP per capita to a shock in trade openness is positive for other BRICS nation except South Africa in which it is initially small and negative (became positive after three years). In order to check for reverse causality from GDP per capita to trade openness in BRICS, the responses of trade openness are reported in panels 2, 5, 8, 11 and 14. The response of positive shock of trade openness on GDPPC is positive for Brazil and Russia while it is negative up to 1 year in India, then becames positive. In China and South Africa, the impulse response of trade openness on economic growth is negative after 2 and 3 years, respectively. There are feedback causal effects in Brazil and Russia (Dufrenot, Mignon, & Tsangarides, 2010; Shahbaz, 2012; Shahbaz et al., 2011), while GLT hypothesis is supported in India, China and South Africa.
Conclusion and Policy Recommendations
This article has tested the relationship between trade openness and economic growth in the context of the BRICS countries as a whole. Over the past two decades, these economies have achieved remarkable growth rate and could become the most dominant economies in the near future. The empirical analysis is carried out with the help of ARDL model, VECM and Granger causality test. Using the ARDL bounds testing approach in conjunction with the VECM approach, our study reaches the conclusion that there is a long-run relationship among GDP per capita, trade openness and gross domestic capital formation in BRICS countries. More interestingly, the result reveals that 1 per cent increase in trade openness will increase the GDP per capita by 0.09 per cent in Brazil, 0.22 per cent in Russia, 0.10 per cent in India, 0.08 per cent in China and 0.04 per cent in South Africa. Thus, we can infer that trade openness stimulates economic growth through capital formation in these economies. In addition, results of VECM granger causality test show that ECT coefficient of all the BRICS nations except Russia are negative and significant suggesting unidirectional causality running from trade openness and GCF to GDP per capita in long run. This confirms the validity of TLG hypothesis in the short and long runs in BRICS nations (Bojanic, 2012; Kumar & Pacheco, 2012; Muhammad et al., 2012; Yavari & Mohseni, 2012).Further, empirical evidence from IRF supports the bidirectional causality between trade openness and GDP per capita for Brazil and Russia. The results confirmed the validity of GLT hypothesis in India, China and South Africa.
In brief, this article has found a positive and statistically significant relationship between trade openness and economic growth in long run for BRICS nations. Therefore, speeding up the process of trade liberalization would be a useful strategy for these countries. The analysis also finds that domestic investment is a key determinant of economic growth apart from trade openness. Based on the results, it is recommended that BRICS countries should increase the volume of trade openness through reduction in import duties, reciprocal trade liberalization, freeing quotas and other technical barriers of trade. Further, export openness along with import openness is also very important to foster economic growth and to increase capital formation these nations. Export promotion strategy to foster economic growth will be partially effective if import restrictions are maintained. Import openness is equally very important to stimulate economic growth, as it complements the exports by providing intermediate production inputs to export sector. Moreover, developing countries of BRICS like India, Brazil and South Africa have limited capital resources for technological innovation, so they should take the benefit of foreign technology and knowledge via import from developed economies.
Footnotes
Acknowledgements
The authors are grateful to the anonymous referees of the journal for their useful comments and suggestions. The usual disclaimer applies.
Declaration of Conflicting Interests
The authors declared no potential conflicts of interest with respect to the research, authorship, and/or publication of this article.
Funding
The authors received no financial support for the research, authorship, and/or publication of this article.