



Abstract
Abstract
The present article investigates the relationship between stated preferences for firm’s characteristics and asset allocation decisions. Data from the survey of retail investors in Malaysia are used for estimations by employing binary logit and ordered logistic models. The analyses show that preferences for a firm’s value characteristics, quality of management and product characteristics, risky characteristics, liquidity and trading volume characteristics affect holding of a particular financial asset, number of asset holding, quite diversified portfolio holding and hypothetical asset allocation. However, a firm’s characteristics have no influence on fully diversified portfolio. In Malaysia, the regulators may consider the investor’s preferences for specific firm’s characteristics in designing policies to reduce the apparent structural imbalance in the capital market.
Introduction
There are several theoretical models on asset allocation. Tobin’s (1958) mutual fund separation model suggests asset allocation to different combination of risky and risk-free assets based on individual’s risk preferences. Sharpe (1964) and Lintner’s (1965) capital asset pricing model suggests asset allocation to all available assets in the market irrespective of risk associated with the assets. Markowitz’s (1959) men-variance model predicts that investors should care about the mean and variance of portfolio returns to achieve optimal asset allocation.
As opposed to optimal allocation, a particular strand of literature suggests that certain heuristics came into play when it comes to asset allocation, for example, 1/n heuristic, home bias, optimism, risk attitude, presentation format, future value projections, financial advice and, recently, peer effects and personal characteristics (Barasinska, Schäfer, & Stephan, 2012; Benartzi & Thaler, 1995, 2001; Ehm, Kaufmann, & Weber, 2014; Jacobsen, Lee, Marquering, & Zhang, 2014; Strong & Xu, 2003; Sundali & Guerrero, 2009; Tversky & Kahneman, 1974; Zhang, 2014; Zhang, Jacobsen, & Marshall, 2016). These studies conclude that such factors lead to hold under-diversified portfolio comprising excessive allocation to either risky or safe assets. On the competing argument between fundamental and behavioural, the empirical research on fundamental ground has received less attention as theoretical studies mostly assume and rarely examine the impact that fundamental factors may have on asset allocation.
Regarding fundamental factors, preferences for a firm’s characteristics could affect asset allocation decisions in several ways. First of all, investors’ stated preferences for firm’s characteristics can be regarded as relying on fundamental information for investments. Previous studies highlight that investors using fundamental analysis hold different combination of financial assets than others (Lease, Lewellen, & Schlarbaum, 1974). Therefore, it assumes that firm’s characteristics as a manifestation of fundamental analysis would affect asset allocation. Second, Elkinawy (2005) illustrated that a firm’s attributes affect an individual’s portfolio choice. Investors prefer to invest in firms which have greater accounting transparency (Aggarwal, Klapper, & Wysocki, 2005). Firm-level disclosure improves investors’ knowledge about a firm’s characteristics and thus likely to affect asset allocation. Third, a firm’s characteristics represent deeper insight into the type of stocks that investors like to hold in portfolio. Investors like to give higher priority to firms with the characteristics of higher profitability, efficient resource management, more liquidity, large market capitalization, low market risk and high leverage (Narang & Kaur, 2014). Duxbury, Hudson, Keasey, Yang, and Yao (2013) asserted that stock’s characteristics shape investors’ portfolio composition. They contend that stock’s characteristics do matter in portfolio holding. Fourth, individuals elicit risk–return expectations from a firm’s specific characteristics. They expect higher returns for firms that pay dividend, but higher risks for firms that do not pay dividend have low cash flows and are smaller firms (Kempf, Merkle, & Niessen-Ruenzi, 2014). Since a firm’s characteristics are perceived as a representation of risk and returns, based on this assessment, individuals can decide which assets to be included in portfolio. Given the aforementioned discussions, this study aims to examine the link between stated preferences for firm’s characteristics and asset allocation.
Malaysia is chosen as a context of this study due to its distinguished features. Malaysian households appear to less diversify their financial assets. They are excessively exposed to a single asset class, that is, safe assets (Bank Negara Malaysia, 2010, 2011). Hence, they fail to diversify portfolio with the combination of risky and safe assets. As a result, Malaysians forgo the opportunity to earn higher returns. In addition, regulators have identified excessive allocation to safe assets as one of the key challenges in the Malaysian stock market (Securities Commission Malaysia, 2011). Overconcentration to safe asset is considered dangerous anomalies in financial market, resulting in lower equity premium (Goetzmann & Kumar, 2008; Sunden & Surette, 1998). The aforementioned scenario grabs special attention to study asset allocation in Malaysia. The study finds that investors’ preferences for firm’s characteristics affect their ownership of financial assets, portfolio holdings, the number of financial asset holding and hypothetical asset allocation.
This study makes several contributions pertaining to asset allocation. First, the study focuses on stated preferences for firm’s characteristics as potential determinants of asset allocation decisions. To the best of author’s knowledge, there are few studies that empirically look at the potential role of preferences for firm’s characteristics in asset allocation. Second, the study explores asset allocation of retail investors in Malaysia. There are not many studies in the literature that have explored the factors influencing asset allocation of Malaysian investors, in spite of placing greater emphasis on structural imbalance between safe and risky assets. Third, the study comprehensively measures investors’ asset allocation decisions such as a particular financial asset holding, types of portfolio holdings, the number of asset holding and hypothetical asset allocation.
The structure of this study is as follows: the first section is an introduction of the article; the second section reviews the relevant literature; the third section stated the objective of this study; the fourth section discusses the rational of this study; the fifth section describes methodology, the sixth and seventh sections describe analysis and discussion, respectively and finally the conclusion is given in the eighth section following implications given in the ninth section.
Review of Literature
This study argues that preferences for firm’s characteristics affect investors’ asset allocation decisions. One of the arguments is that firm’s specific characteristics affect investors’ risk and return expectations, which in turn influence their asset allocation decisions. Along this line, Kempf, Merkle, and Niessen-Ruenzi (2014) reported that depending on a firm’s specific characteristics, investors form risk and return expectations. A firm’s profitability characteristics, such as dividend payments, profit margin, return on equity, earnings and return on assets (ROA), can be associated with investors’ risk and return expectations. Based on these expectations, a firm’s profitability characteristics can be an important determinant of a particular type of financial asset holding.
An individual’s decisions may be influenced not only by profitability characteristics but also by a firm’s value characteristics. Doran and Wright (2010) found that in a survey of finance professors in the USA, the use of a firm’s value-related characteristics, such as market capitalization, book-to-market ratio and price-to-earnings, has a stronger influence on an individual’s buying and selling decisions. Kempf, Merkle, and Niessen-Ruenzi (2014) argued that investors expect relatively higher returns from a firm with high price-to-earnings ratio, lower book values, debt ratio and larger firms. Stock selection, based on a firm’s price-to-equity ratio, price-to-book value ratio, debt-to-equity ratio, is found to be related to portfolio construction (Roy, 2016). Also, a firm’s value characteristics, like high price-to-earnings ratio and price-to-book ratio, are perceived as glamour firms. The glamour firms are generally attracted by sentiment-prone investors (Baker & Wurgler, 2006).
Besides value characteristics, a firm’s liquidity and trading volume characteristics can be regarded as potential determinants for asset allocation. The works of Ng and Wu (2006) and Khan, Tan, and Chong (2016) have shown that not only revealed preferences but also stated preferences for a firm’s liquidity and trading volume lead to a high degree of trading activity. Elkinawy (2005) found that a firm’s liquidity characteristic becomes more desirable for fund manager’s stock ownership decisions in financial crisis period than in tranquil period. Similarly, the demand for liquidity and firm’s greater trading volume would influence investors to own a particular financial asset and hold portfolio accordingly to meet their demand.
A firm’s management and product-related characteristics, and long-term value apart from its financial ratios, can lead to asset allocation decision. Kempf, Merkle, and Niessen-Ruenzi (2014) showed that, in a laboratory experiment, individuals display affective reaction to a firm’s marketing expenditure and its brand’s strength. Individuals’ confidence increases with renowned brand, higher marketing expenditures, higher media coverage and lower information asymmetry. Referring to Kempf, Merkle, and Niessen-Ruenzi’s (2014) study, it can be argued that a firm’s product and management-related characteristics carry significant information about firms and, as a result, this resourceful information can increase investors’ confidence. Confidence about a firm’s management and product-related characteristics could influence their asset allocation such as which assets to own, portfolio to hold and the number of financial asset holding.
As investors typically concern about risk–return concept, they can regard a firm’s risky characteristics in their asset allocation. Firm’s risky characteristics refer to leverage, beta and idiosyncratic volatility. In assessing these characteristics, investors are likely to expect higher return and lower risk (Kempf, Merkle, and Niessen-Ruenzi, 2014). Investors’ preferences for a firm’s risky characteristics are driven by past positive outcome, which in turn shape their portfolio composition (Duxbury, Hudson, Keasey, Yang, & Yao, 2013). A firm’s risky characteristics itself and its underlying information can influence asset allocation (Aggarwal, Klapper, & Wysocki, 2005).
Given the aforementioned discussion, the study expects that investors’ stated preferences for a firm’s profitability, value, liquidity and trading volume, management and product attributes, and risky characteristics affect their asset allocation decisions. This study is related to the study of Khan, Tan, and Chong (2016) where they investigate investors’ stated preferences not only for firm’s characteristics but also for trading.
Objective
This study aims to investigate the relationship between stated preferences for firm’s characteristics and asset allocation decisions in Malaysia. Stated preferences for firm’s characteristics are represented by investors’ preferences for a firm’s profitability, value, liquidity and trading volume, management and product attributes, and risky characteristics. Asset allocation decisions indicate a particular financial asset holding, types of portfolio holdings, the number of asset holding and hypothetical asset allocation.
Rationale of the Study
To understand Malaysian investors’ asset allocation choices, Bursa Malaysia conducted a survey in 2009 which revealed that investors tend to hold on, priority basis, saving deposits, insurance, real estate assets and unit trusts more than shares (StarBiz, 2010; The Malaysian Insider, 2010). Although there was a tremendous growth in financial assets of Malaysians, they mainly allocate their assets to bank’s saving assets, representing overconcentration on a single asset class (Bank Negara Malaysia, 2011; Economic Report, 2011/2012). The trend has been observed for a period of time. Households’ savings in banks and other financial institutions have increased from 31 per cent in 2010 to 42 per cent in 2013, whereas their allocation to risky equity asset has declined from 32 per cent to 16 per cent between 2007 and 2011 (Bank Negara Malaysia, 2011, 2013). This suggests that households mainly composite their portfolios by excessively focusing on safe assets while avoiding risky assets. Such undiversified portfolio composition has been highlighted in the Capital Market Masterplan 2 published by Securities Commission (SC) Malaysia. They highlighted it as a structural gap between safe and risky assets. The SC emphasized more on reducing this structural gap between safe and risky assets as it is necessary for the acceleration of stock market and the economic growth. This sets the motivation to investigate the determinants of asset allocation.
Methodology
Research Design
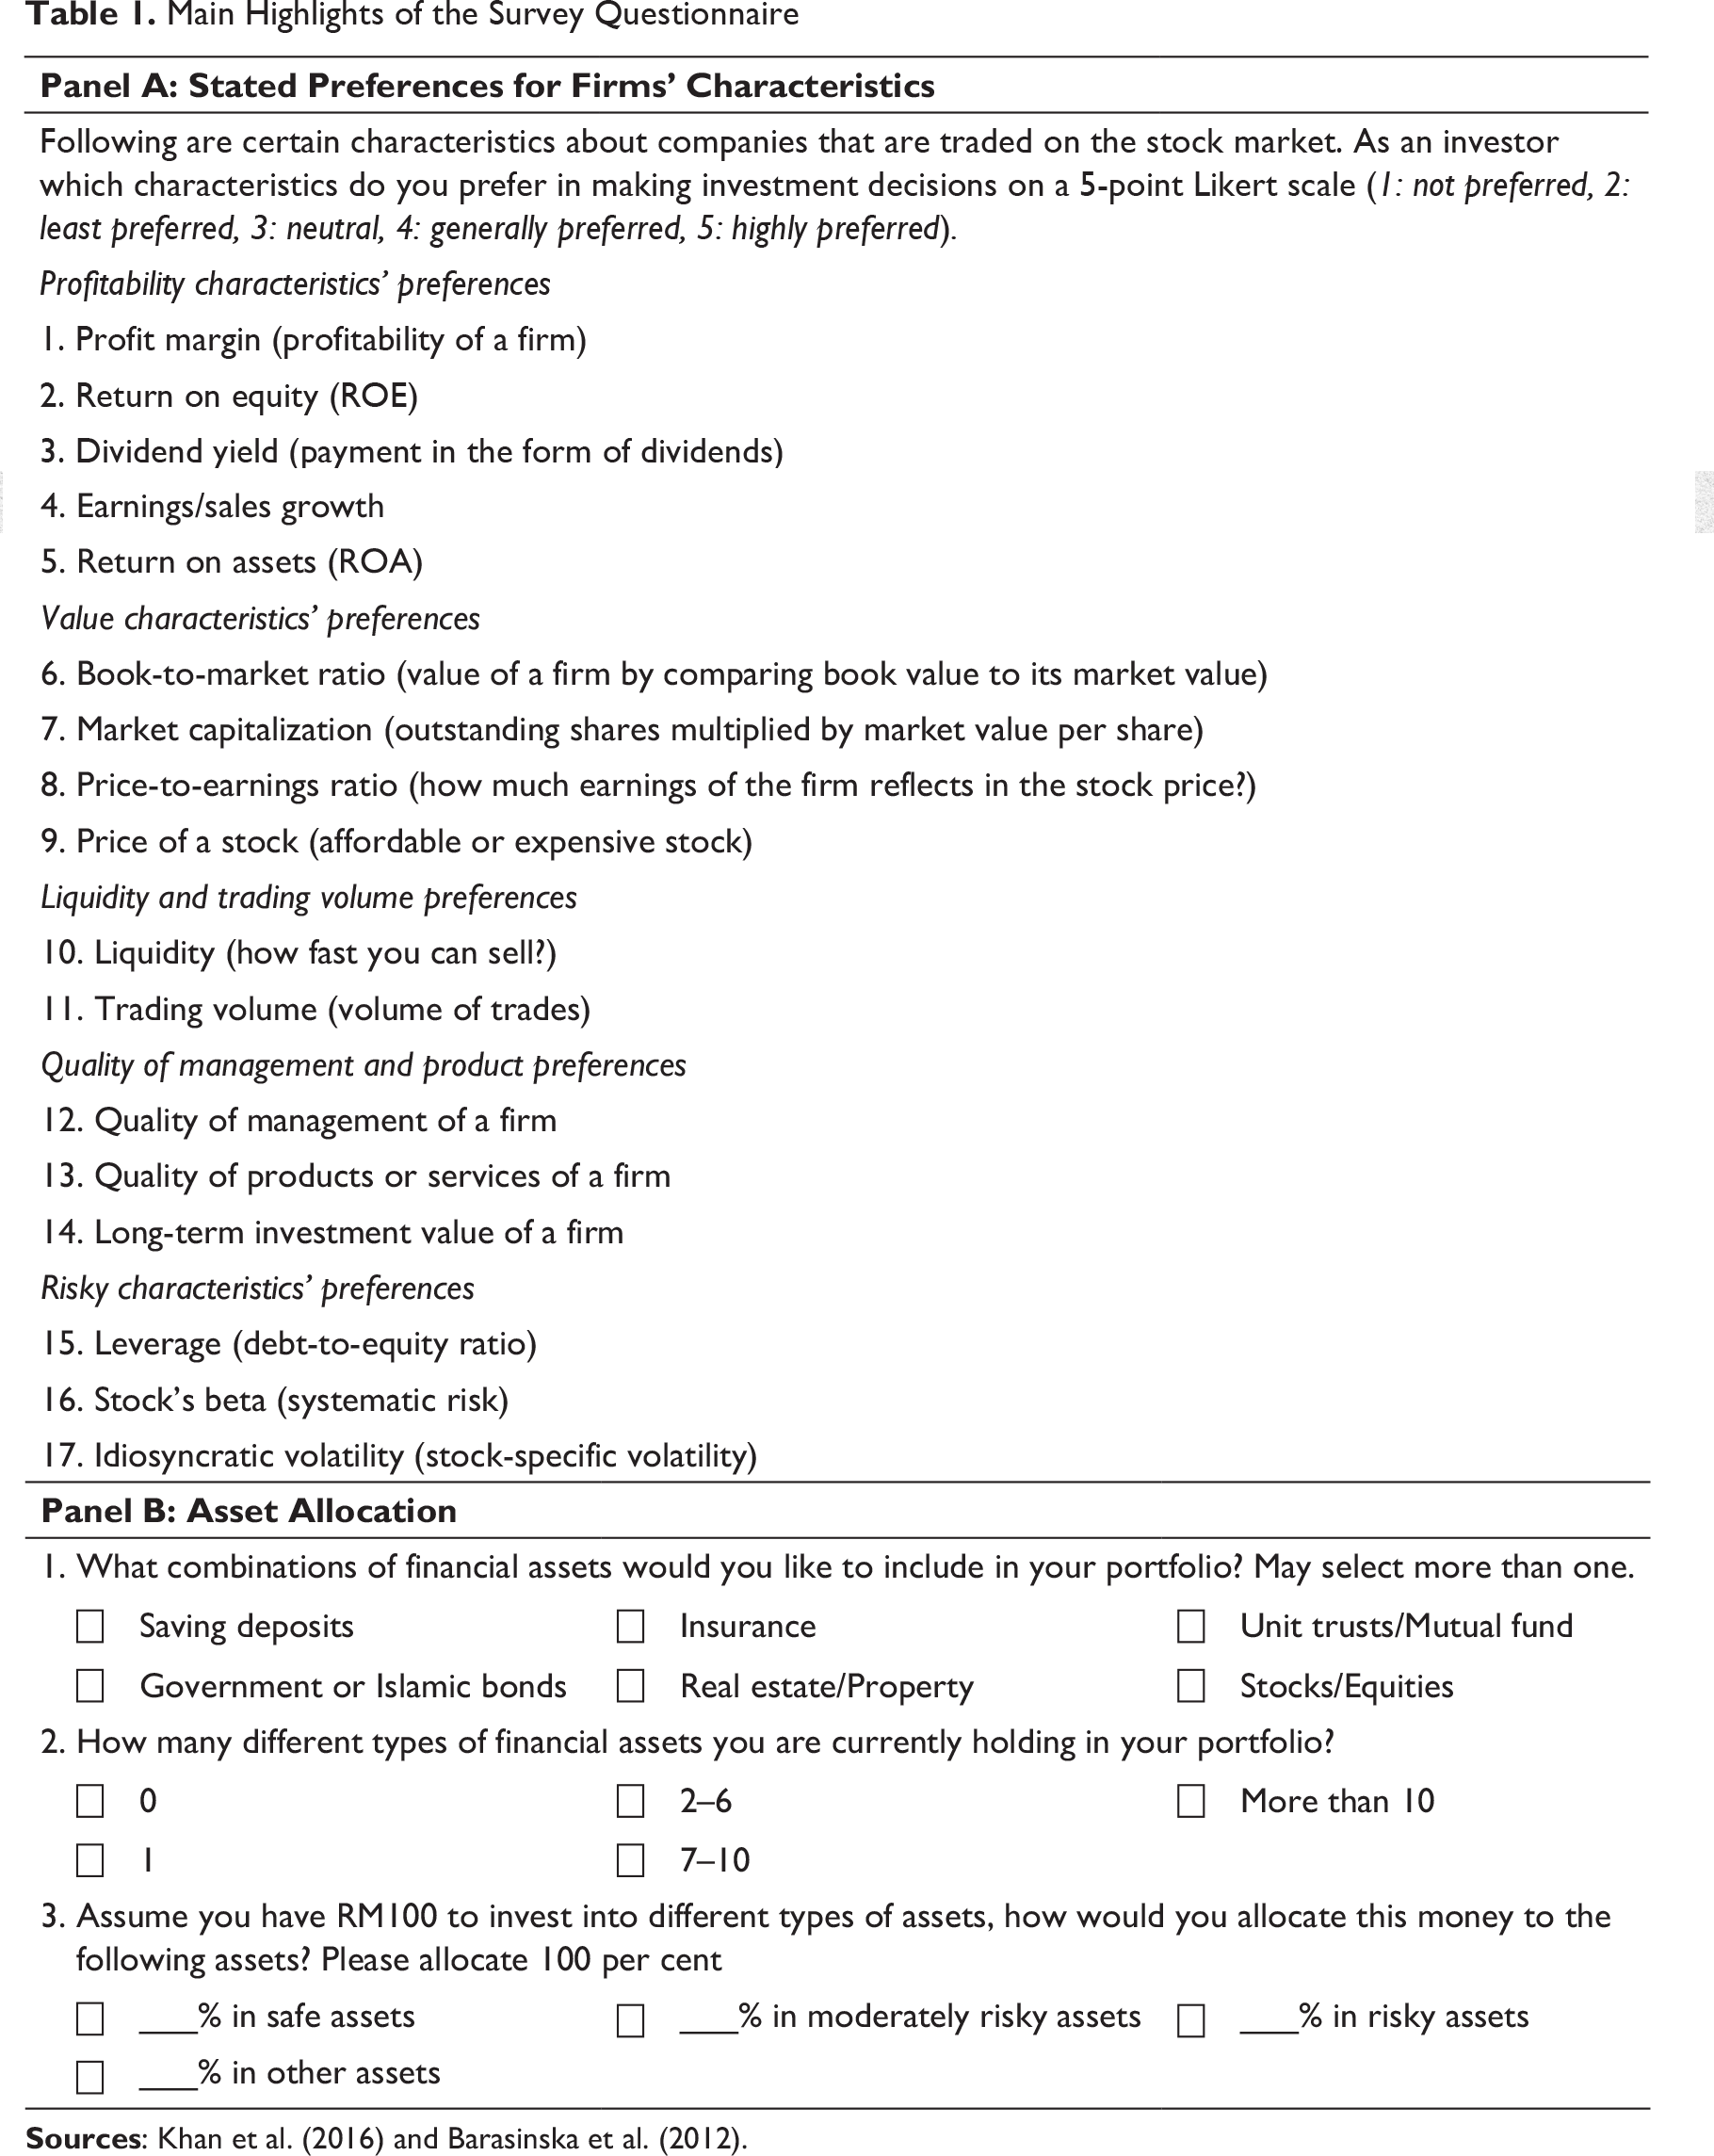
The research design of this study is purely a quantitative method. In the first stage, the study develops a survey questionnaire. It was then pretested with a panel of experts and subsequently administered on a sample of retail investors in Malaysia. In the second stage, the survey data were analysed using multivariate regressions. The survey questionnaire elicits investors’ preferences for each firm-specific characteristic on a 5-point Likert scale and extracts their self-reported asset allocation, following Khan, Tan, and Chong (2016).
Survey Instrument
The questionnaire consists of three main sections with 29 specific questions. The first section aimed to record investors’ demographic profile. The second section aimed at eliciting investors’ stated preferences for various firms’ characteristics. Investors were asked to state their level of preferences for 17 firm-specific characteristics about the companies that are traded on the stock market. The third section was designed to capture investors’ asset allocation decisions by using three questions. The first question determines the type of financial assets that investors would like to include in their portfolio. They were given an option to select more than one financial asset including saving deposits, government/Islamic bonds, insurance, real estate/property, unit trusts/mutual fund and stocks/equities. On the basis of this question, investors’ ownership of a particular financial asset and the type of portfolio holdings are measured. Depending on the risk–return profile of financial assets, seven types of portfolios are constructed (Barasinska, Schäfer, & Stephan, 2012). As a third measure, investors were asked to indicate the number of different financial assets they are currently holding in their portfolio. The last question was dedicated to measure investors’ asset allocation in a hypothetical task. Investors were asked to allocate a certain amount to safe, moderately risky, risky and other assets, hypothetically, so that the total allocation made up to 100 per cent.
Data Source
At the beginning of the data collection procedure, a database of retail investors was developed. The information about the number of registered stockbroking companies was collected from the website of Bursa Malaysia, which acts as a sampling frame. It is worth noting that with regard to trade stocks/shares in Malaysia, the individual investors must open a Central Depository System (CDS) account with the registered brokers, although they are allowed to hold more than one CDS account. All CDS accounts in Bursa Malaysia were handled by the 30 registered stockbroking companies (Bursa Malaysia, 2013). The survey was administered between September and November 2013. Two approaches were followed to select the target respondents by using a random sampling technique. The first approach was to distribute the questionnaire in the stockbroking firms. The individuals in charge of client services received invitations via email or telephone. After distributing the questionnaire, the reminders were sent to the contacted individuals. Huber and Power’s (1985) guidelines were followed to limit the impact of self-assessment and maximize the accuracy of responses. The respondents were informed at the cover page of the survey that their information would remain strictly confidential, and the final results would be shared with them. The second approach was to distribute the questionnaire in the investment seminars organized by registered stockbroking firms. The study targeted those investment seminars that were held within the survey period. Generally, the seminar participants were the clients of organized stockbroking firms. Of 1,054 questionnaires distributed in both approaches, the valid responses were received from 454 respondents after estimating preliminary analyses (e.g., outlier, missing values and incomplete questionnaire). This corresponds to a return rate of 43.07 per cent.
Operationalization of Variables
The independent variables in the study are investors’ stated preferences for various firm-specific characteristics. Profitability characteristics’ preferences were measured by multi-item psychometric scales. Participants were asked to express their degree of preferences for a firm’s profitability characteristics (profit margin, ROE, dividend, earnings and ROA) using a five-point Likert scale. The same explanation holds for value characteristics’ preferences (BM ratio, market capitalization, PE ratio and stock price), liquidity and trading volume preferences (liquidity and trading volume), quality of management and product preferences (quality of management, quality of product and services, long-term value) and risky characteristics’ preferences (leverage, beta and idiosyncratic volatility). The significant mean value of each firm’s characteristic indicates that investors exhibit preferences for firm’s characteristics. Finally, the independent variables were constructed by aggregating respective items of each construct.
Main Highlights of the Survey Questionnaire
Empirical Model
The functional form of the model that estimates the ownership of a particular financial asset holding is as follows:

where U i represents the ownership of a financial asset by investor i (i ϵ 1, 2, 3, …., 454), Y i is a vector of the explanatory variables representing preferences for firm’s characteristics and Z i is a vector of the control variables. On the left side of the distribution, the dependent variable, the ownership of a particular financial asset, is grouped into six dummy variables, that is, if the investors hold saving deposits, it takes the value 1 and 0 otherwise; if the investors hold government/Islamic bonds, it takes the value 1 and 0 otherwise; if the investors hold insurance, it takes the value 1 and 0 otherwise; if the investors hold real estate/property, it takes the value 1 and 0 otherwise; if the investors hold unit trusts/mutual funds, it takes the value 1 and 0 otherwise; if the investors hold stocks/equities, it takes the value 1 and 0 otherwise. In the model, the regressors are profitability characteristics, value characteristics, liquidity and trading volume, quality of management and product characteristics, and risky characteristics’ preferences. The control variables include an investor’s gender, age, marital status, income, ethnicity, education, investment experience and occupation. Given the nature of dependent variables, the binary logistic regression models were estimated for model (1).
The functional form of the model that estimates the types of portfolio holdings is as follows:

where V i represents the types of portfolio holdings by investor i (i ϵ 1, 2, 3, …., 454), Y i is a vector of the explanatory variables representing an investor’s preferences for firm’s characteristics and Z i is a vector of the control variables. The dependent variable, on the left-hand side of the equation, is denoted by seven dummy variables. ‘Portfolio 1’ assigns the value 1, if investors tend to hold only low-risk assets and 0 otherwise; ‘portfolio 2’ assigns the value 1, if investors tend to hold only moderately risky assets and 0 otherwise; ‘portfolio 3’ assigns the value 1, if investors tend to hold only high-risk assets and 0 otherwise. ‘Portfolio 1’, ‘portfolio 2’ and ‘portfolio 3’ are categorized as undiversified portfolios. ‘Portfolio 4’ denotes the value 1, if investors tend to hold ‘low and moderately risky assets’ and 0 otherwise; ‘portfolio 5’ denotes the value 1, if investors tend to hold ‘low- and high-risk assets’ and 0 otherwise; ‘portfolio 6’ denotes the value 1, if investors tend to hold ‘moderately risky and high-risk assets’. ‘Portfolio 4’, ‘portfolio 5’ and ‘portfolio 6’ are categorized as quite diversified portfolios. ‘Portfolio 7’ is categorized as fully diversified portfolio and assigned the value 1, if investors tend to hold a combination of low-risk, moderate-risk and high-risk assets and zero otherwise. Model (2) was estimated by binary logistic regressions.
To estimate the number of financial asset holding, the following functional form is estimated:

In functional form (3), W i represents the number of financial asset holdings by investor i (i ϵ 1, 2, 3, …, 454), Y i is a vector of the explanatory variables representing an investor’s preferences for firm’s characteristics and Z i is a vector of the control variables. The dependent variable in the functional form (3) takes the ordered-ranked values, where low value indicates few financial asset holdings and high value indicates more financial asset holdings. The independent and control variables remain as it is. The aforementioned model was estimated using an ordered logistic model.
The functional form of the model that estimates hypothetical asset allocation decisions is as follows:

where X i represents hypothetical asset allocation by investor i (i ϵ 1, 2, 3, …., 454), Y i is a vector of the explanatory variables indicating an investor’s preferences for firm’s characteristics and Z i is a vector of the control variables. Hypothetical asset allocation is denoted by three variables where an investor’s allocation of a certain amount to safe assets indicates safe asset allocation; the amount allocated to moderately risky assets indicates moderately risky asset allocation and the amount allocated to risky assets indicates risky asset allocation. The independent and control variables remain as before. This model was estimated using ordered logistic regression, given the econometric nature of the dependent variable.
Analysis
To briefly describe financial asset holding of respondents, more than 80 per cent of investors in the sample hold equities. More than half of the investors hold saving deposits and real estate/property in the portfolio. A total of 34.1 per cent of investors own unit trust or mutual fund, while 29.3 per cent of investors own insurance. Government or Islamic bonds are held by only 16.3 per cent of investors. Of the six different types of financial assets, more than a quarter of investors hold one type of asset, whereas only 13.2 per cent of investors hold four or more financial assets. Constructing a portfolio based on the riskiness of assets, 26 per cent of investors hold fully diversified portfolios comprising low-, moderate and high-risk assets. A total of 36.1 per cent of investors hold quite diversified portfolios comprising either the set of low and moderately risky assets or the set of low- and high-risk assets or the set of moderate and high-risk assets. About 37.8 per cent of investors hold undiversified portfolio which consists of either low-, or moderate- or high-risk assets. The subsequent sections estimate the role of preferences for various firms’ characteristics in asset allocation.
Preferences for Firm’s Characteristics and Financial Assets Owned by Investors

Preferences for Firm’s Characteristics and Undiversified, Quite Diversified and Fully Diversified Portfolio

Preferences for Firm’s Characteristics and the Number of Financial Asset Holding and Hypothetical Asset Allocation
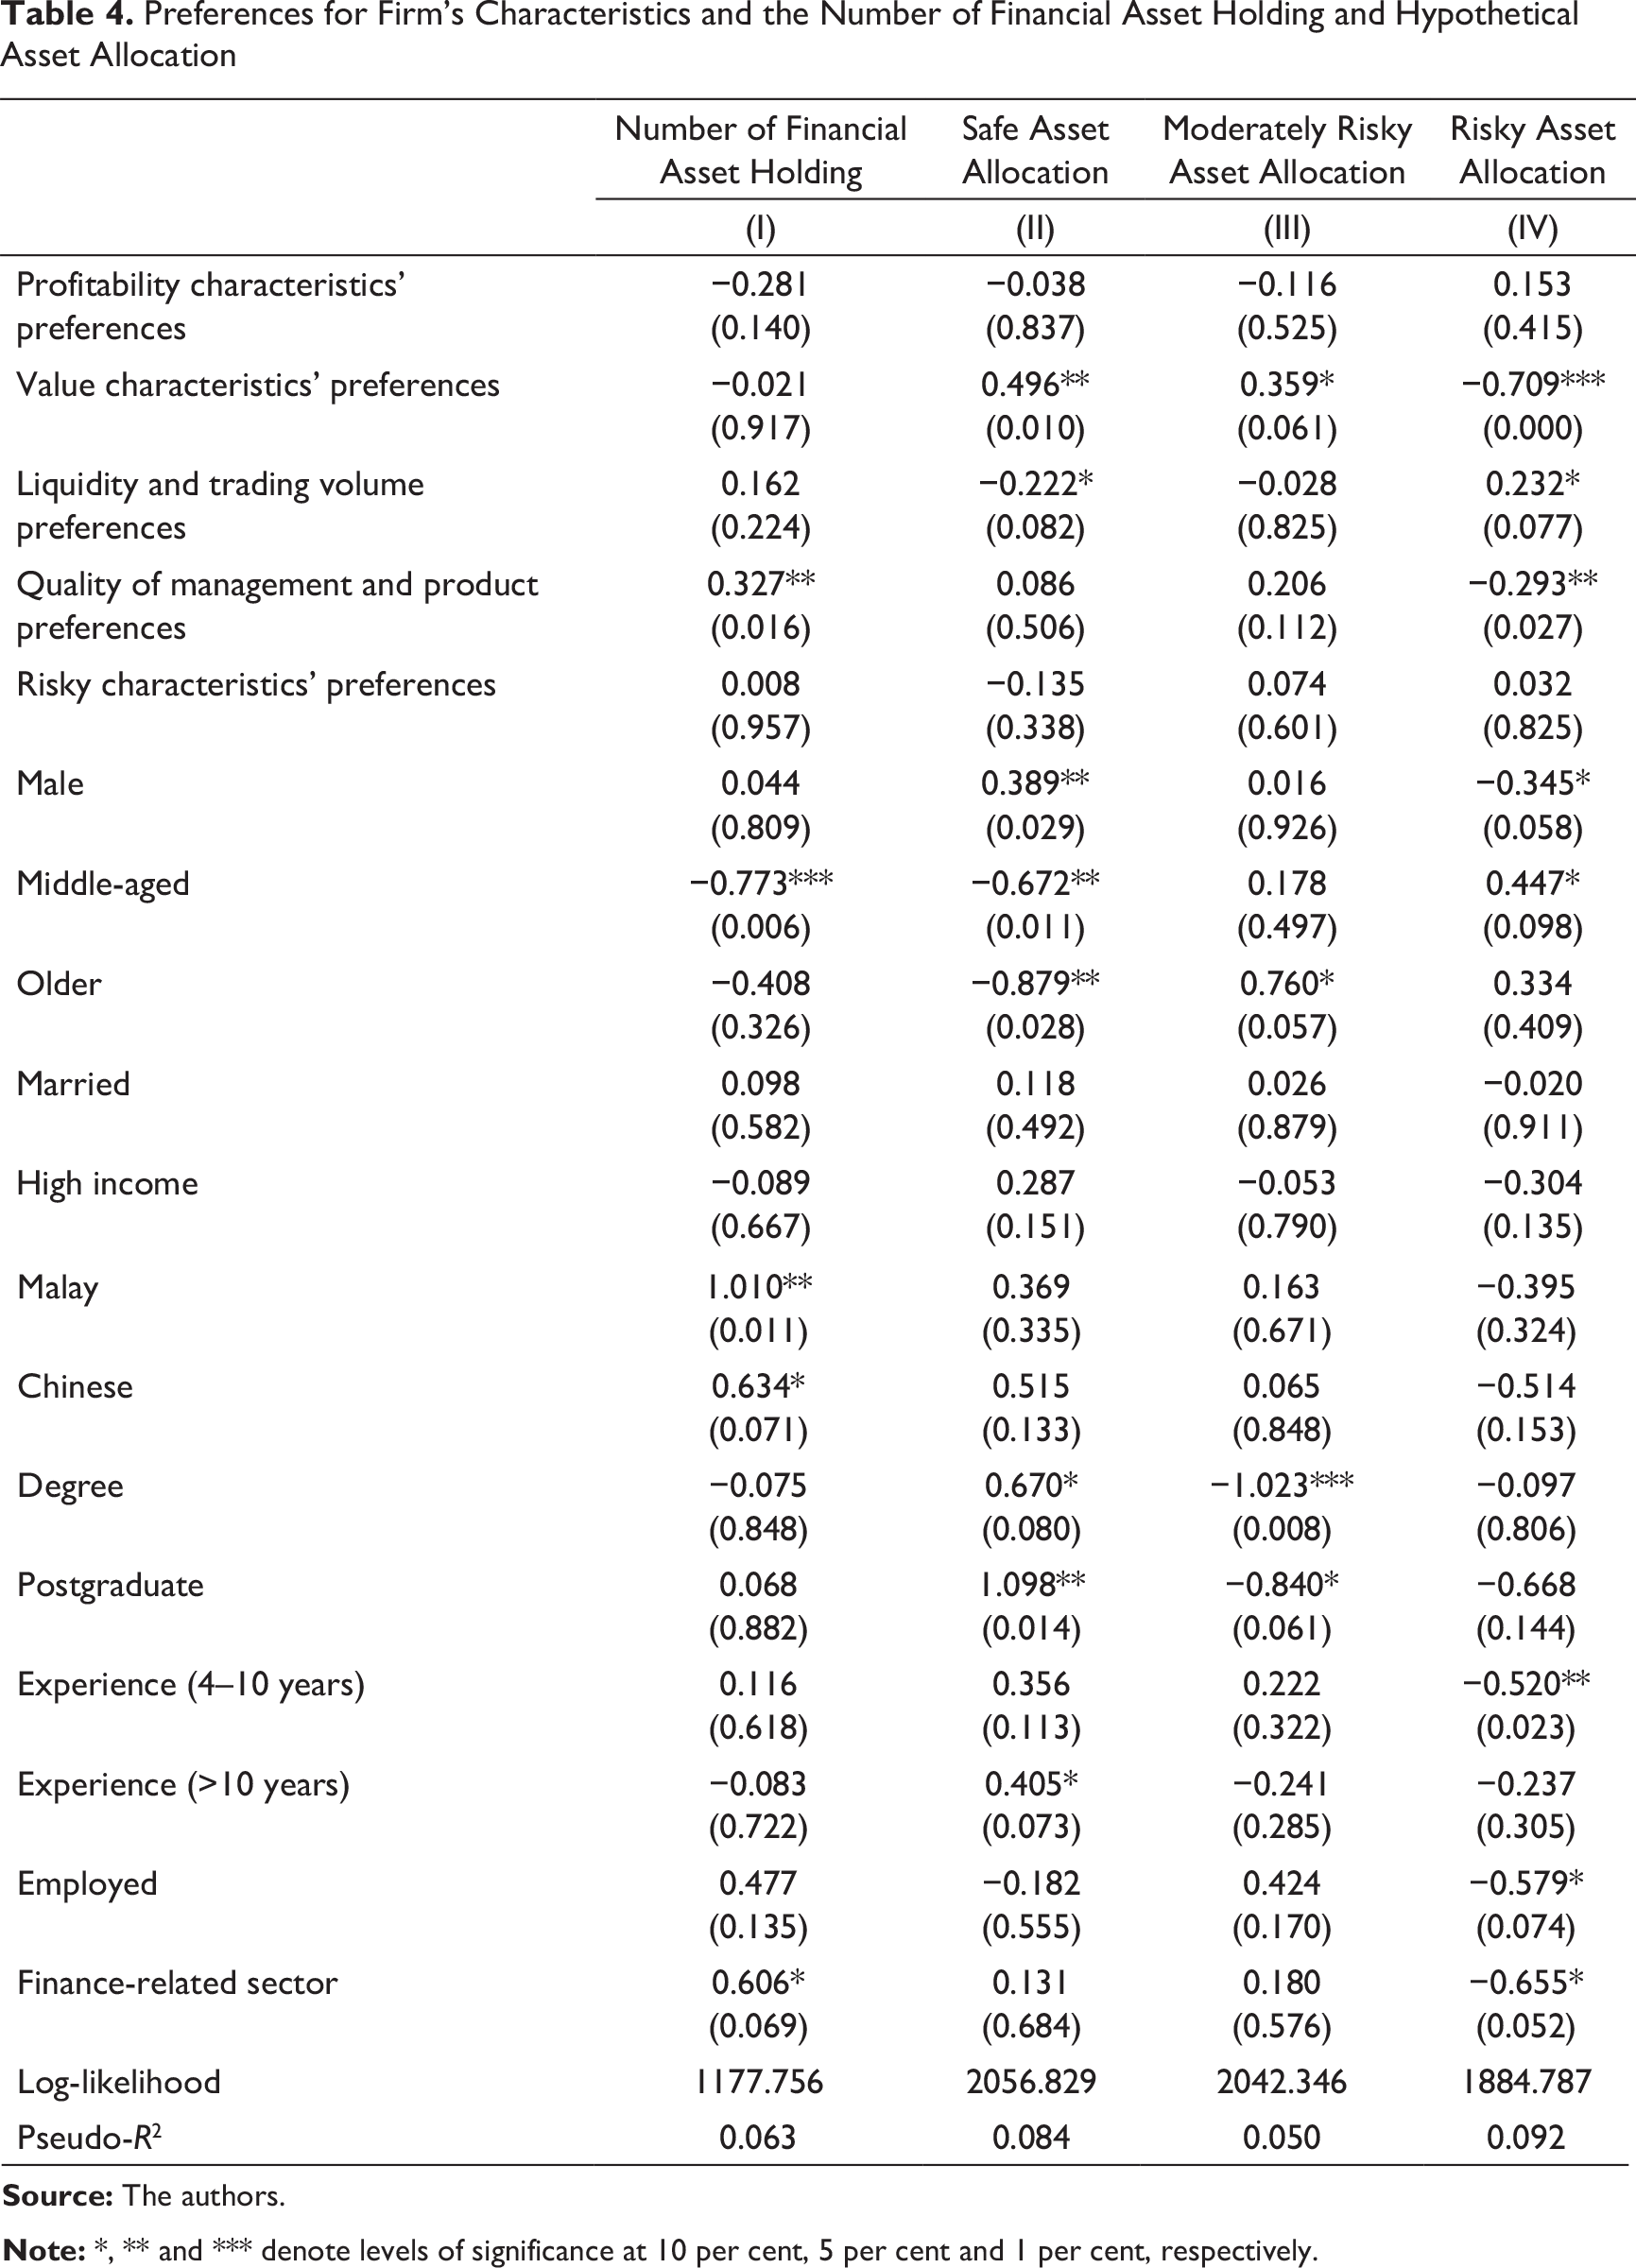
The regression results for the number of financial asset holding are presented in column (I) of Table 4. Given the same set of independent variables, the result in this specification provides interesting finding. Among the five groups of firm characteristics, preferences for a firm’s quality of management and product characteristics increase the likelihood of number of financial asset in the portfolio.
Investors are asked to allocate a certain amount to safe, moderately risky and risky assets in a hypothetical task. As shown in columns (II)–(IV) of Table 4, the results indicate that preferences for a firm’s value characteristics lead to a higher fraction of safe asset allocation, whereas preferences for liquidity and trading volume lower the fraction of safe asset allocation. Viewing moderately risky asset allocation, the significant positive effect is merely observed for a firm’s value characteristics. Considering risky asset, a firm’s value characteristics rather reduce risky asset allocation. Similarly, preferences for quality of management and product attributes lower the likelihood of risky asset allocation. As expected, the tendency for risky asset allocation increases with the preferences for liquidity and trading volume characteristics.
Discussion
The findings regarding the probability of holding a particular asset show that preferences for a firm’s various characteristics are significant in holding saving deposits, government/Islamic bonds and real estate/property. However, the likelihood of holding unit trust/mutual fund and stock/equity is unaffected by a firm’s characteristics. The finding can be explained by the fact that financial assets that are characterized by higher risk may be irrelevant to a firm’s characteristics. In the probability of holding a financial asset, a firm’s quality of management and product-related attributes have a stronger influence. This is consistent with the argument of Kempf, Merkle, and Niessen-Ruenzi (2014) that investors show an affective reaction to a firm’s product-related attributes.
With respect to type of portfolio holdings, preferences for a firm’s value characteristics, and quality of management and product characteristics reduce the probability of undiversified portfolio holding. Preferences for such characteristics indicate preferences for fundamental valuation technique (Doran & Wright, 2010), which lower the propensity to hold undiversified portfolio.
Investors’ tendency to hold quite diversified portfolios (a mix of low and moderately risk assets; or a mix of low- and high-risk assets) is caused by preferences for a firm’s quality of management and product characteristics. When it comes to portfolio composition, investors highly regard firm’s external product-related attributes on which they derive risk–return expectations. A similar finding is found by Khan, Tan, and Chong, (2016), but for trading decision. Also, preferences for a firm’s risky characteristics increase the probability of holding a quite diversified portfolio (a mix of low- and high-risk assets). Risky characteristics’ preferences lead to hold low-risk assets to overcome the downside of excessive risk and high-risk assets to meet the desire for risk. This finding is relevant to the studies conducted by Duxbury, Hudson, Keasey, Yang, and Yao (2013) and Khan, Tan, and Chong, (2016). A quite diversified portfolio (a mix of moderate- and high-risk assets) is further increased by investors’ preferences for liquidity and trading volume characteristics, which can be explained by investors’ preferences for easily tradable characteristics of a firm (Khan, Tan, & Chong, 2016; Ng & Wu, 2006).
When asset allocation is measured as the number of financial asset holding, a firm’s quality of management and product characteristics have significant impact. The visibility of this characteristic due to its external attributes conveys important information and thus influences number of asset holding. To explore further, investors are asked to allocate a certain amount to safe, moderately risky, risky and other assets, hypothetically. The evidence shows that value characteristics’ preference increases the probability of safe asset allocation and ensures investors’ safety net (Doran & Wright, 2010). Investors’ preferences for liquidity and trading volume characteristics lower the probability of safe asset allocation but increase moderately risky and risky asset allocation. The nature of this firm characteristic may increase investors’ risk-seeking propensity.
Value characteristics’ preferences also increase the probability of moderately risky asset allocation. Investors’ expectations of higher returns from a firm’s value characteristics such as market capitalization, BM ratio, PE ratio and stock price may cause asset allocation to moderately risky assets. Preferences for this characteristic, however, reduce the probability of risky asset allocation along with quality of management and product characteristics.
All in all, preferences for a group of firm’s characteristics affect investors’ asset allocation.
Conclusion
This study explores the relationship between stated preferences for firm’s characteristics and asset allocation. The results show that in holding a particular type of financial asset such as saving deposits, government/Islamic bond and real estate/property, preferences for a firm’s value characteristics, risky characteristics, and quality of management and product characteristics have significant impact. Regarding portfolio holdings, value characteristics and quality of management and product characteristics reduce the probability of under-diversification, while quite diversified portfolio holding increases with a firm’s quality of management and product, risky characteristics and the liquidity and trading volume characteristics. A firm’s quality of management and product characteristics affect number of financial asset holding. In a hypothetical task, preferences for a firm’s value characteristics, quality of management and product characteristics, and liquidity and trading volume affect asset allocation. While these findings support behavioural explanation, it contrasts conventional mean-variance assumption (Markowitz, 1959).
Implications
The findings imply that a firm’s quality of management and product-related attributes as well as liquidity and trading volume characteristics play a significant role in holding quite diversified portfolio and risky assets. Thus, preferences for firm-specific characteristics can help to design policies to reduce overinvestment in safe assets and the structural imbalance in the Malaysian capital market. SC and regulators may give more priority to investors’ preferences for a firm characteristic besides their own initiatives to minimize the structural difference. For investors, it implies that investors base their asset allocation on their preferences for firm’s characteristics. This will enhance investors’ understanding that different groups of firm’s characteristics have distinct impacts on asset allocation.
Acknowledgement
The authors are grateful to the anonymous referees of the journal for their extremely useful suggestions to improve the quality of the article. Usual disclaimers apply.
Declaration of Conflicting Interests
The authors declared no potential conflicts of interest with respect to the research, authorship and/or publication of this article.
Funding
The authors received no financial support for the research, authorship and/or publication of this article.