
Abstract
The sustainable socio-economic growth of any country depends on the availability of adequate and reliable power at reasonable rates. This is even true in case of a rapidly developing country like India where coal-based power plants account for the majority of electricity generation. Making use of data envelopment analysis (DEA) and Malmquist productivity index (MPI), this study analyses the productivity change of coal-fired power plants during 2002–2012. Productivity change is further decomposed into technical efficiency change (EFFCH), technological change (TECHCH), scale efficiency change (SECH), pure technical change (PECH) and total factor productivity change (TFPCH). The study revealed that 0.70 per cent of average annual total factor productivity (TFP) growth was witnessed from 2002–2003 to 2011–2012 indicating overall progress. The contribution of TECHCH in TFP growth is positive, that is, 1.3 per cent per annum. It demonstrates that expansion of the efficient frontier. However, there was a decrease in technical EFFCH of −0.6 per cent per year, indicating the adverse sign of progress. Plants in the central sector achieved maximum growth of 4.6 per cent annually. A total of 54.05 per cent of plants have recorded negative TFP growth. Power plants between 500 and 999 MW achieved the highest operational performances in all indices except SECH.
Introduction
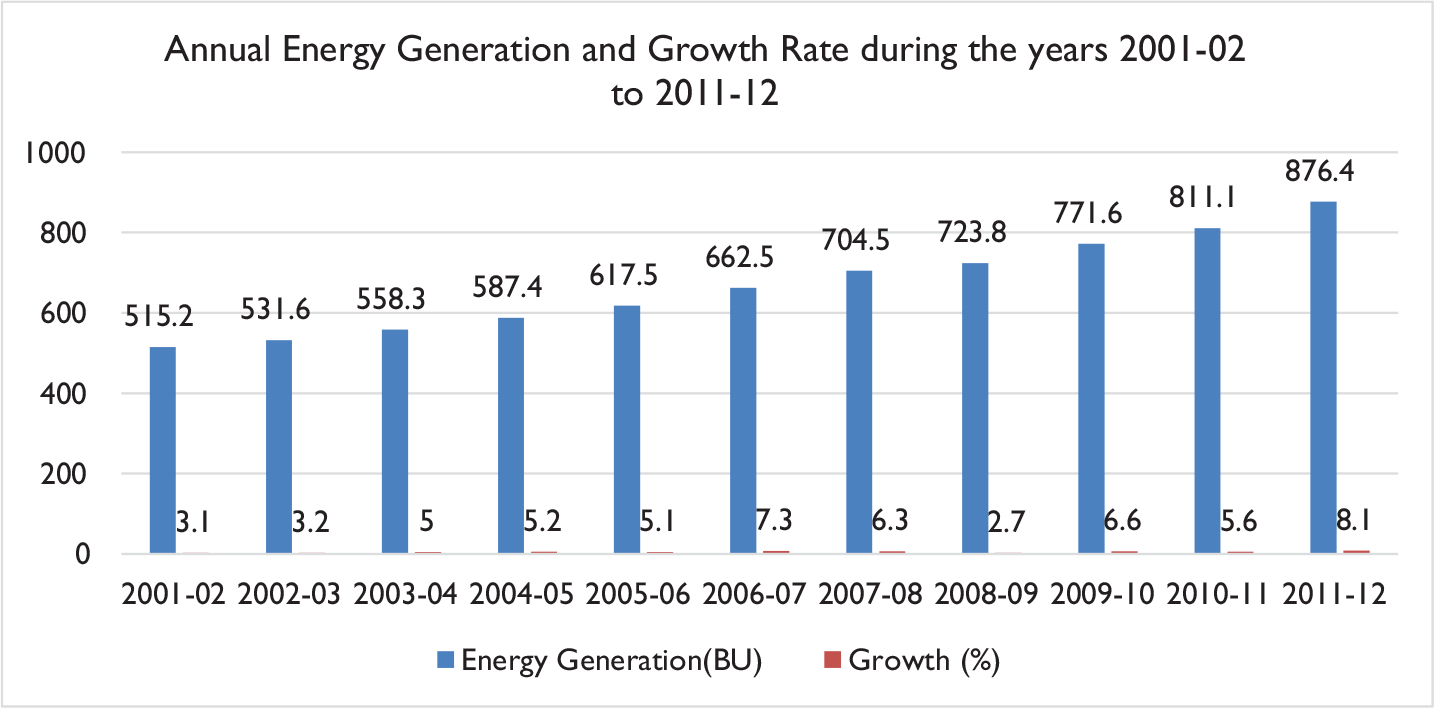
India, a fast-developing economy, after Independence in 1947, has seen significant growth in all sectors, especially in the power sector. A story of India’s power sector can be defined by way of power generation capacity that was increased from 1362 MW in 1947 to 876.4 BU in 2012. Such notable growth in the power sector was achieved due to the intervention of the Indian government in the generation and distribution segment of electricity, which was initially carried out by private players. In the beginning, few urban centres were served by private utilities. However, on latter stage, State electricity boards (SEBs) were formed under the purview of central and state government authorities in all states to make electricity available in all parts of India. The primary objective of such SEBs was to bridge the gap between demand and supply of electricity, which looked defeating till the early 1960s due to the political boundaries of states. However, the introduction of the concept of operating power systems on a regional basis diminished these political hurdles.
Indian economy has witnessed a rapid growth in the electricity sector in recent years with an installed capacity of 199.6 GW as of March 2012, the world’s fifth largest country in terms of installed capacity. Thermal power plants constitute 65 per cent of installed capacity, hydroelectric about 21 per cent and rest is a combination of wind, small hydro, biomass, waste-to-electricity and nuclear electricity. In 2011–2012, the actual electric generation was 876.4 BU against the target 855 BU. The compound annual growth rate (CAGR) of electricity generation during the ninth plan was 5.76 per cent against 5.16 per cent achieved during the tenth plan (Source: Website-Ministry of Power/CEA-GOI). The year-wise energy generation and annual growth rates during the period are presented in Figure 1.
Moreover, sustained socio-economic growth depends on the availability of adequate and reliable power at reasonable rates. To cater to the needs of energy, India has made remarkable progress in the capacity addition in the power sector, the distribution sector which is dominated by financially struggling state-owned utilities. However, nature of the power generation industry is capital intensive, and for development of generation, transmission and distribution, it is the first significant and challenging job to deploy sufficient financial resources at a competitive cost.
The present research explores how the productivity of these power-generating plants has changed over the 10-year window from 2002–2003 to 2011–2012. Using data envelopment analysis (DEA) and Malmquist productivity index (MPI), an attempt has been made to decompose and analyse the trend of the total factor productivity (TFP) growth into various components, namely, technological change (TECHCH), pure EFFCH and scale efficiency change (SECH).
The structure of the article is as follows: The second section discusses relevant literature about DEA, MPI and performance-related studies about India. The third section deals with the objectives of this research work. The fourth section prepares the foundation of the article by discussing the models and methodology. The fifth section discusses the findings of the study, and the conclusions are drawn in the sixth section.
Literature Review
A large number of studies on the DEA application are available for literature review because of extensive utilization of the DEA approach in various sectors whether it is measuring productivity growth in India’s manufacturing sector (Deb, 2014) or assessing the technical efficiency of Indian banks (Debasish, 2006). However, we have reviewed certain studies dealing with the performance efficiency of the power generation industry.
Behera, Dash, and Farooquie (2010) applied the DEA approach with a primary objective to estimate excess consumption of inputs while maintaining the same level of output for India’s 74 coal-fired power plants over a period of 5 years (from 2003–2004 to 2007–2008). Based on selected variables (five inputs: capacity, planned maintenance, forced outages, special coal consumption and auxiliary power consumption; and one output: generation), technical efficiency of around 51 per cent of units lies below the average technical efficiency, that is, 83.2 per cent, which means that there is the scope for improving technical efficiency by reducing the input’s consumption to the desired level as suggested by an input-oriented variable return to scale model. Out of 74 units, 2.70 per cent showed a constant return of scale over a span of 5 years.
Dhillon (2017) measured the operational performance of Orissa Power Generation Corporation Limited through the slacks-based measure (SBM) proposed by Tone (2001). The overall level of technical efficiency was found to be 82 per cent, which implies that there is the further scope for improvement of 18 per cent. Moreover, a study also observed that 75 and 25 per cent of decision-making units (DMUs) are inefficient (having increasing return to scale) and efficient (having constant return to scale), respectively. It also revealed pure technical efficiency (PTE) had no significant impact on earnings per share (EPS).
Lam and Shiu (2001) had applied the DEA approach and concluded that the fuel efficiency, as well as the capacity factor, significantly affects the technical efficiency of China’s thermal power generation. Provinces and autonomous regions that were under the control of the private ownership achieved higher levels of efficiency. It was also noticed that regions with abundant supplies of coal had higher technical efficiency as compared with their counterparts.
Jha, Yorino, and Zoka (2007) analysed relatively the operational efficiency performance of hydropower plants owned by Nepal Electricity Authority (NEA) using the weight-restricted DEA model for 2004–2005. NEA covers over 95 per cent of the total electricity area of the country. The conventional DEA model results were compared with the result of a modified DEA model, which was formed based on available economic parameters and expert opinion. The excellence of results under a modified DEA model depends upon the ways input and output parameters are incorporated. Experts’ knowledge/information regarding hydropower plants plays a crucial role in the weighted restricted DEA model in the absence of economic parameters. Inputs such as installed capacity, annual operation and maintenance, the number of staff, plant tripping, unit tripping and outputs such as annual energy generation, summer season peaking capacity, winter season peaking capacity and so on were introduced in the DEA model with categorical inputs like storage-type plants and peaking storage-type plants. The average overall efficiency of the NEA hydropower plants was 51.4 per cent with the modified DEA model. A total of 66.67 per cent of hydropower plants are found efficient under the CCR (Charnes, Cooper and Rhodes) model of DEA. A total of 60 per cent of hydropower plants showed poor efficiency scores. Sensitivity analysis was carried out on DEA results to highlight the weakness and strength of individual power plants so that further steps can be taken to improve their overall efficiency.
Vachhrajani and Dhillon (2014) assessed the relative performance of Gujarat’s thermal power plants and found that scale inefficiency is highly dedicating the generation stations which are owned by the government. Two DEA models, that is, BCC (Banker, Charnes and Cooper) and CCR models, were used to evaluate the TE, PTE and SE of each of the selected 49 DMUs (generation units/stations). The average overall efficiency and technical efficiency were noticed to be 85.1 and 92.9 per cent, which provide the scope of improvement by reducing their inputs by 14.9 and 7.1 per cent, respectively, without hampering their output’s target. Nearly 30 per cent of the utilities lie below this mean level.
Objective
The present research explores the productivity of 74 power-generating plants of India over the 10-year window from 2002–2003 to 2011–2012 using DEA-MPI. However, an attempt has been made to decompose and analyse the trend of the TFP growth into various components, such as TECHCH, pure EFFCH and SECH of all these power plants so that a manager can easily analyse their power plants’ performance as compared to their counterparts and decide an appropriate future course of action to improve their overall performance and efficiency.
The main purpose of this study is to assess the operational performance of coal-fired power plants using various productivity parameters in relative terms, not in absolute. Further, this study will identify the power plants which are located on the efficient frontier and will serve as a benchmark for others to identify their crucial areas of lacking, where immediate action is required in order to improve their overall technical performance.
Theoretical Framework
The productivity change can be measured by popular methods such as (a) index-number-based approaches, (b) non-parametric approaches and (c) parametric approaches. DEA-MPI is selected and used to measure TFP growth in light of severe drawbacks of other two approaches. The drawback of an index-number-based approach is the requirement of price information and assumptions about the behaviour of producers and structure of technology. The difficulty with the parametric approach is the knowledge of the production function. In situations where either the cost information is not available or misrepresented or the structure of the production function is not known, DEA-MPI is most suitable to measure TFP growth. Nevertheless, DEA suffers from one serious drawback, that is, it does not account for any errors in the data and is very sensitive to outliers.
DEA, a non-parametric and mathematical programming model, was introduced by Charnes, Cooper, and Rhodes in 1978 and called the CCR model (Charnes, Cooper, & Rhodes, 1978). Let us assume that there are data on K inputs and M outputs for each of the N firms; therefore, for the ith firm, these can be represented by column vectors xi and yi, respectively. The K × N input matrix, X, and the M × N output matrix, Y, represent the data for all N firms. A measure of the ratio of all outputs over all inputs would be obtained for each firm, like u’yi /v’xi, where u is an M × 1 vector of output weights and v is a K × 1 vector of input weights. Input-oriented DEA can be defined as follows:

where θ is a scalar and λ is an N × 1 vector of constants. The efficiency score for the ith firm will be the value of θ. According to the definition, it will satisfy: θ ≤ 1, with a value of 1 indicating a point on the frontier; hence, the firm is a technically efficient firm (Jain, Thakur, & Shandilya, 2010). Further, Banker, Charnes, and Cooper in 1984 made changes in the CCR model, which assumes a constant return to scale to changeable return to scale (Banker, Charnes, & Cooper, 1984). This approach is named as the BCC model and can be defined as follows:

where N1 is an N × 1 vector of ones. This approach forms a convex hull of interesting planes which envelope the data points more tightly than the CRS (Constant Return to Scale) conical hull, thus providing TE scores that are greater than or equal to those obtained using the CRS model (Jain et al., 2010).
The DEA-MPI deals with panel data. It evaluates the TFP change of a DMU between two periods, named period 1 (the ‘from’ period) and period 2 (the ‘to’ period). The Malmquist TFP index measures the productivity change and decomposes this change into technical change and technical EFFCH. This index is named after Malmquist, who proposed to construct an input quantity index as a ratio of the distance function. Afterwards, Fare, Grosskopf, Lindgren, and Roos (1992) constructed an MPI directly from input and output data using DEA.
DEA-MPI is defined as the product of EFFCH (catch-up) and TECHCH (frontier-shift). The EFFCH reflects to what extent a DMU improves or worsens its efficiency, while TECHCH reflects the change of the efficiency frontiers between two periods. In practice, this DEA-MPI has proven to be an excellent tool for measuring the productivity change of DMUs over time and has been successfully applied in many fields (Greer, 2008; Yoruk & Zaim, 2005). The input-based MPI can be formulated.

where D
i
is the input distance function and M
i
t+1 (x
t
, y
t
, xt+1, yt+1) is the productivity of a most recent production unit, that is, B (t + 1), using period t + 1 technology relative to the earlier production unit, that is, B (t), with respect to t technology (Emrouznejad & Ho, 2012). An equivalent way of writing this index by Fare et al. (1994) is M = TECHCH × EFFCH


The research gap emanates from the fact that no significant studies have been undertaken so far to assess the productivity change of coal-fired power plants of India over a period of a decade, which account for a majority of electricity requirements. Thus, DEA and MPI are used to decompose and analyse the trend of TFP growth into various components such as TECHCH, pure EFFCH and SECH.
Methodology
Selections of Decision-making Units
Those power-generation plants are selected and included in this study, which continuously engaged in the electricity generation business from April 2002 to March 2012. Here attempts have been made to estimate the productivity change of coal-fired thermal power plants situated in India. There are several approaches to deal with technical efficiency, but the preferred technique is the non-parametric DEA, which can deal with multiple inputs and outputs without required pre-assumed functional form. A total of 74 power plants are included in this study. DEA and Malmquist index approach (MPI) are used to analyse the productivity change of these plants. Productivity improvements can be achieved by way of technological development, improved operational efficiency or leveraging economies of scale. Thus, productivity change is divided into the technical EFFCH, TECHCH and SECH. To compute the MPI for N firms over T periods, N (3T-2) LPs (Linear Programming) need to be solved (Yoruk & Zaim, 2005). In the present case with 74 firms and 10 time periods, this comes out to 2,072 LPs. Power plants which generated no electricity during the year were also excluded for obvious reasons.
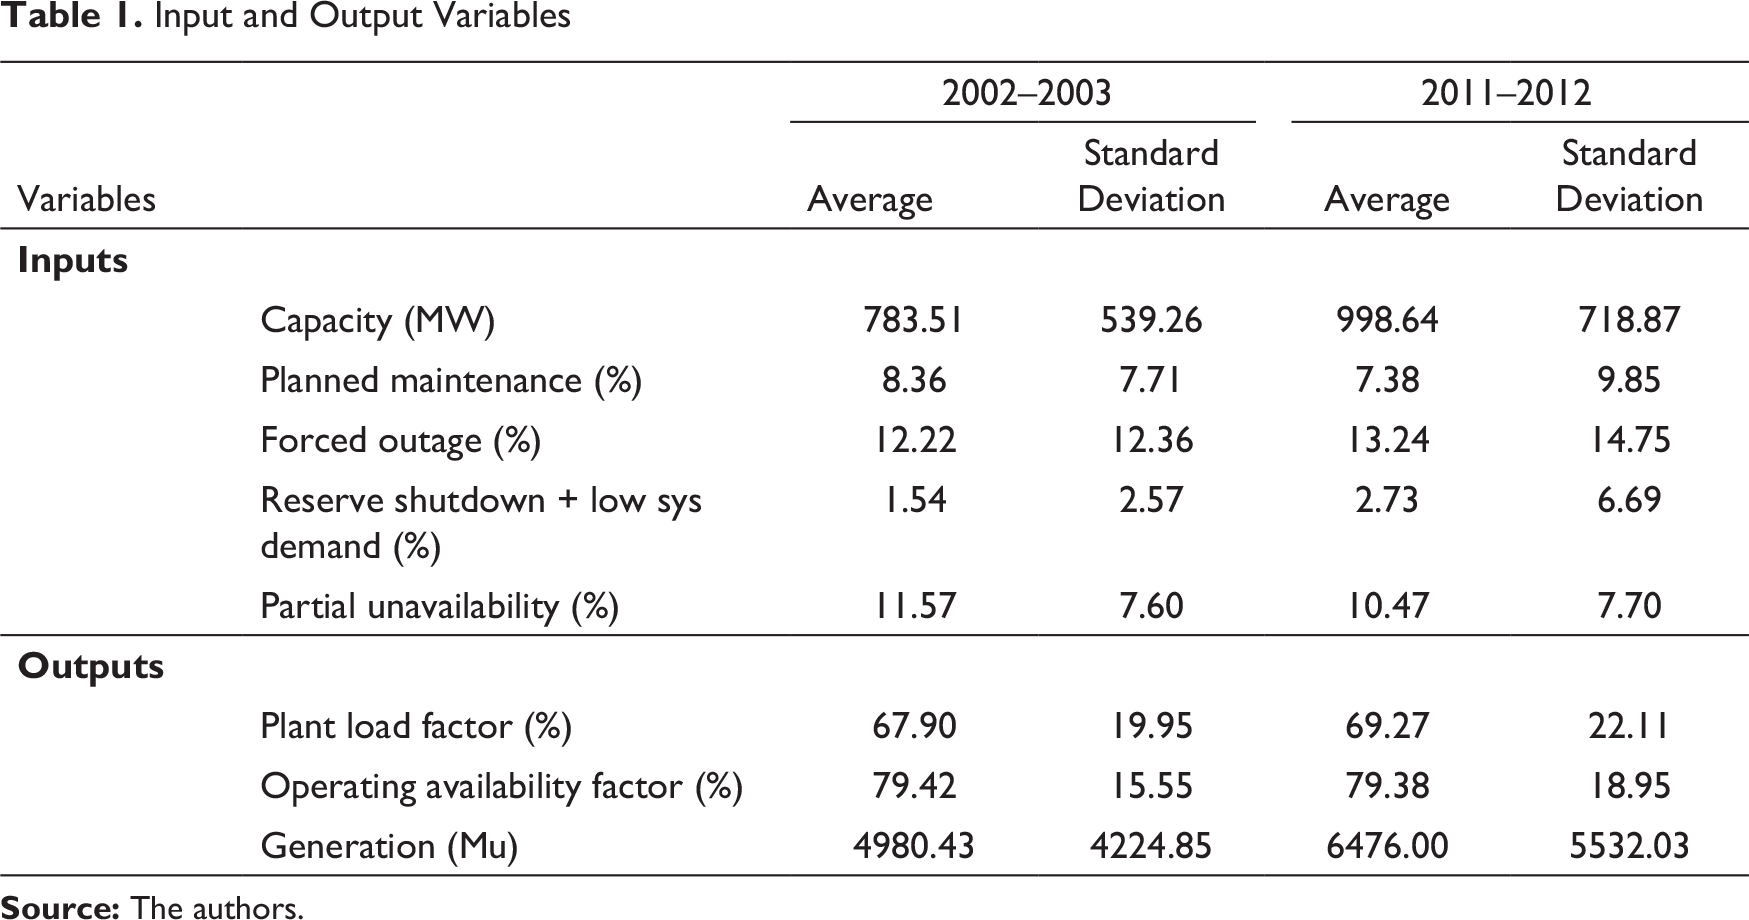
Selections of Input and Outputs
To assess the performance of the coal-fired power plants of India, there can be various input and output variables which can be used in this study. However, in view of the fact that DEA-MPI is just a statistical tool, one has to take extreme care while selecting the essential parameter as an input or output variable. In this study, those variables are termed ‘inputs’ where our aspiration is to minimize it, for example, maintenance. On the other hand, the remaining variables are termed ‘outputs’, where the focus is on the maximization of the variable, for instance, generation. Thus, after having a comprehensive discussion with energy experts, the following vital variables are selected for measuring the productivity change of coal-fired plants.
Inputs:
Capacity (MW): Capacity means the installed or derated/uprated capacity of the plant as accepted by Central Electricity Authority (CEA). A power plant will describe their capacity in terms of megawatt hours (MW/hr).
Planned maintenance (per cent): Maintenance, which is performed purposely and regularly to prevent a machine from deteriorating or breaking down, is known as planned maintenance. During the research, planned maintenance has been measured in terms of energy loss of the per cent of maximum possible generation.
Forced outage (per cent): It is the removal from service availability of a generating plant, transmission line or another facility for emergency reasons. The condition in which the equipment is unavailable is due to unanticipated failure. It is known as a forced outage.
Reserve shutdown+ low-sys demand (per cent): Low load (per cent) comprises low-system demand and reserve shutdown. When operating plants generate less due to system load variation, then it is termed ‘low-system demand’. Non-utilization of available plants due to their complete shutdown for want of load is known as reserve shutdown.
Partial unavailability (per cent): It is when there is a reduction in the output of the operating plants in MW due to constraints in auxiliaries/equipment, or any other causes, and plants are operating at reduced load.
Outputs:
Plant load factor (per cent): It is the ratio of the total number of kWh supplied by a generator or generating station to the total number of kWh.
Operating availability factor (per cent): The availability factor of a power plant is the amount of time that it can produce electricity over a specified period, divided by the amount of the time in the period.
Generation (Mu): In natural phenomenon, energy generated by power plants or plants is measured in million units (MU).
Selection of Model
Considering the fact that there are five inputs and three outputs and the objective is to reduce the inputs without hampering the existing level of outputs, the input-oriented DEA-MPI model is selected.
Data
This study makes use of data compiled by the Central Electricity Authority (Nov, 2011) of India. CEA compiles all the data and publishes it in its annual report named as ‘Review of Performance of Thermal Power Stations’, supplemented by reports of Central Electricity Regulatory Commission, Ministry of Power and respective power-generating companies. The data relevant to 74 power plants are sourced from CEA’s database and compiled according to the requirement of the model.
Input and Output Variables
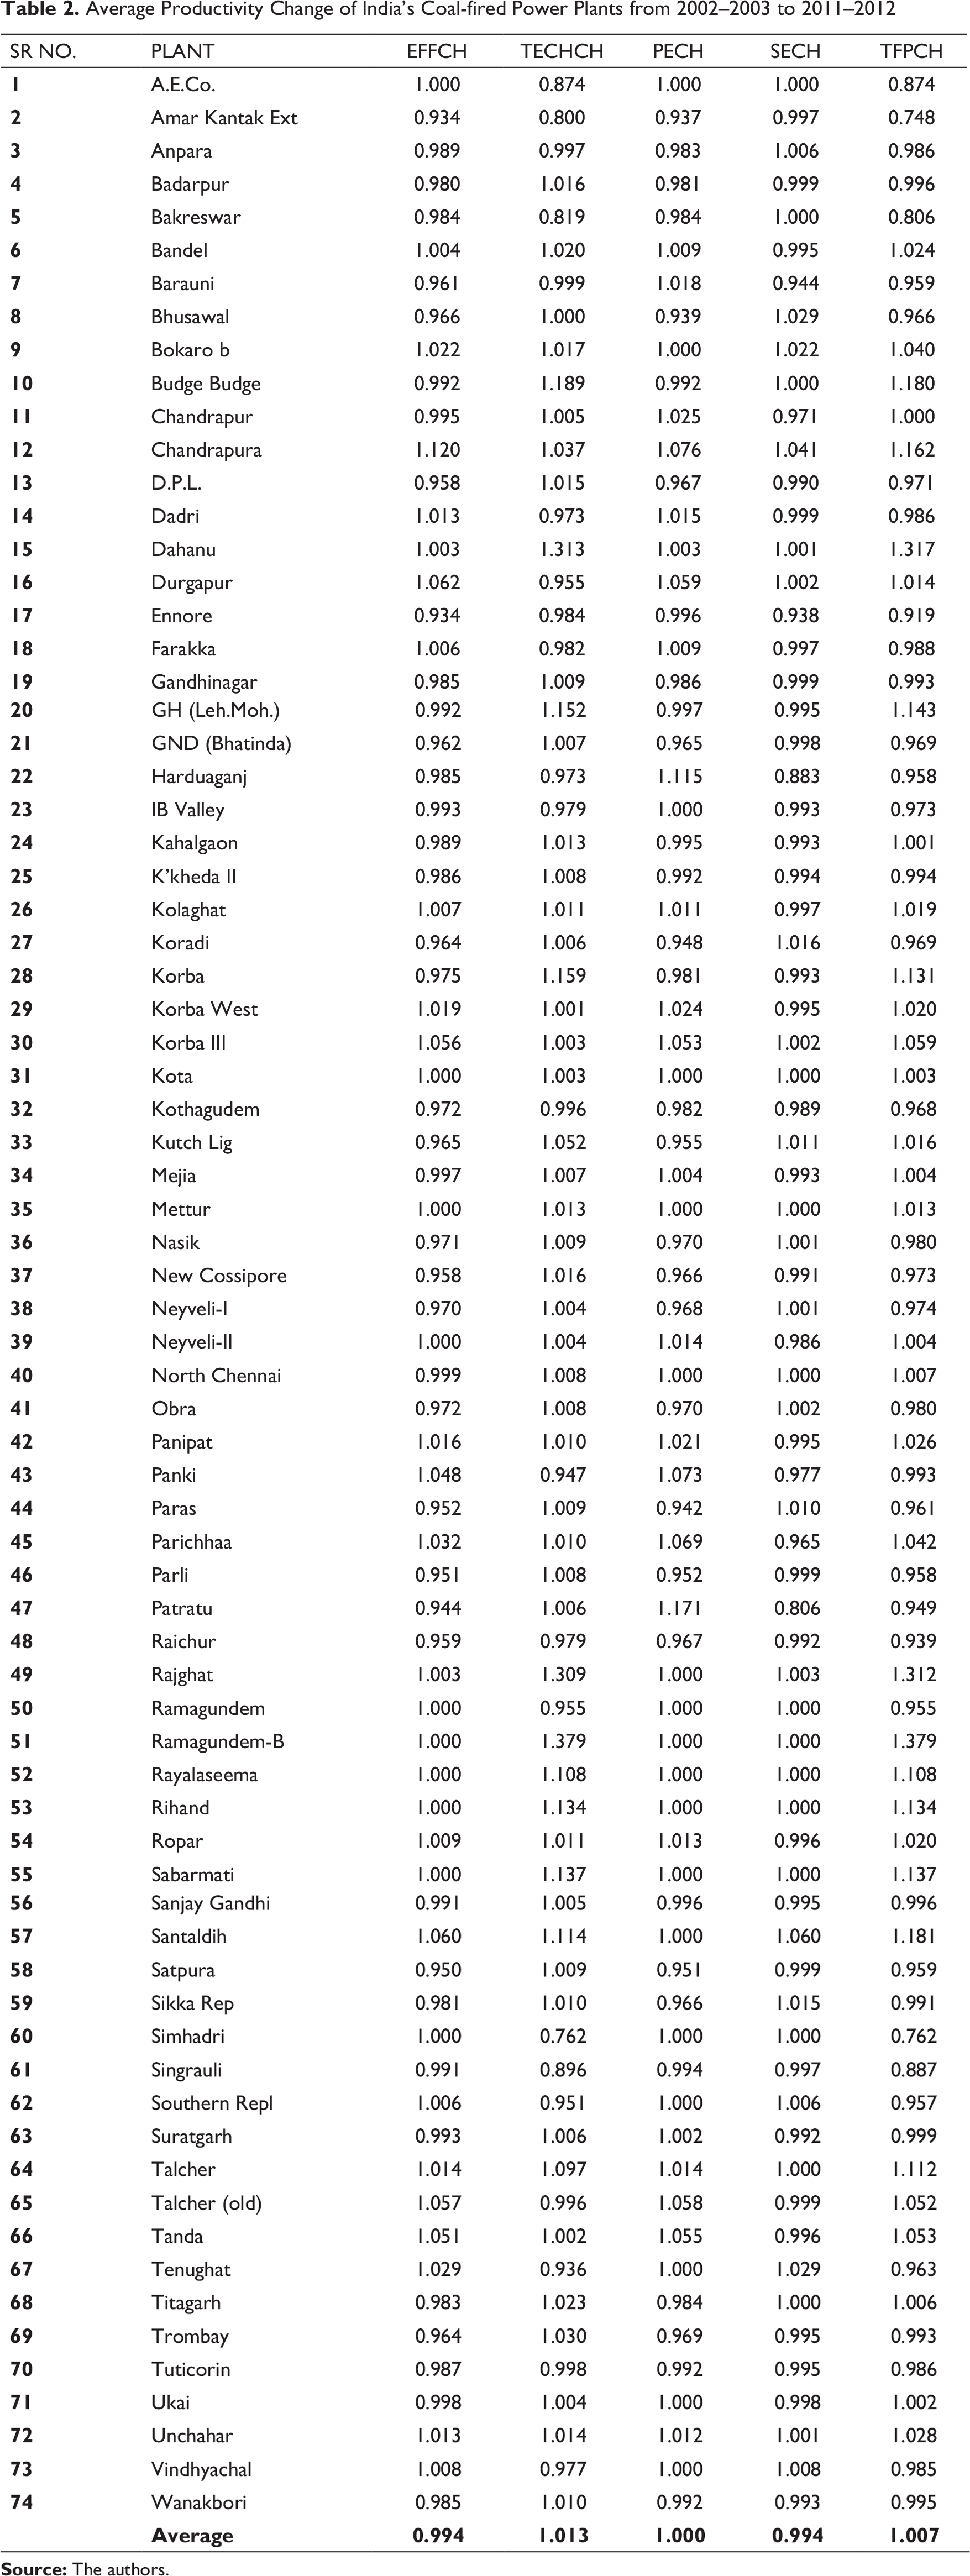
Average Productivity Change of India’s Coal-fired Power Plants from 2002–2003 to 2011–2012
Analysis
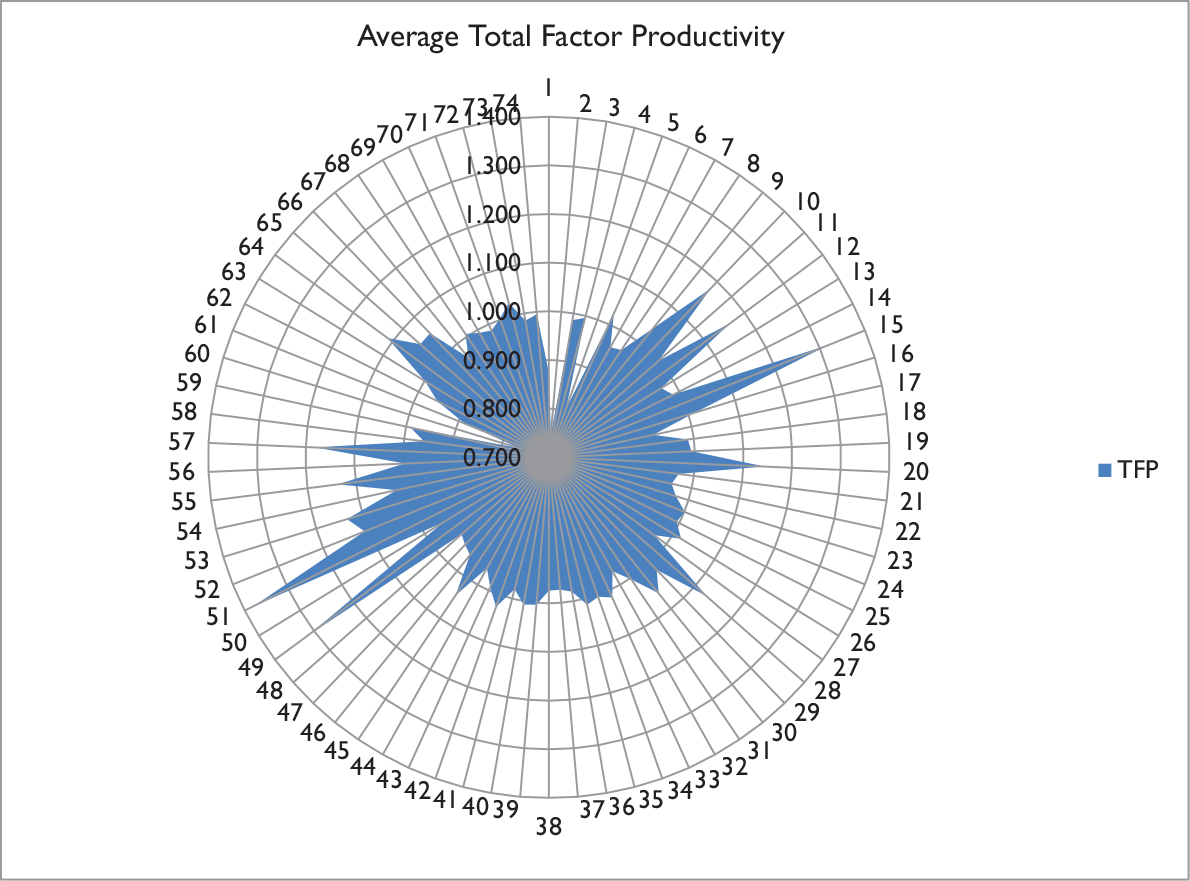
For easy understanding of the derived results (Table 2), average TFP is represented graphically as shown in Figure 2. It is observed that average TFP change, which is MPI, is 1.007. For this, one can conclude that the power sector recorded an average annual TFP growth of 0.70 per cent during the research period. TE change negatively contributes to TFP growth, that is, 0.6 per cent, and with 1.3 per cent TECHCH contributes positively to TFP growth.
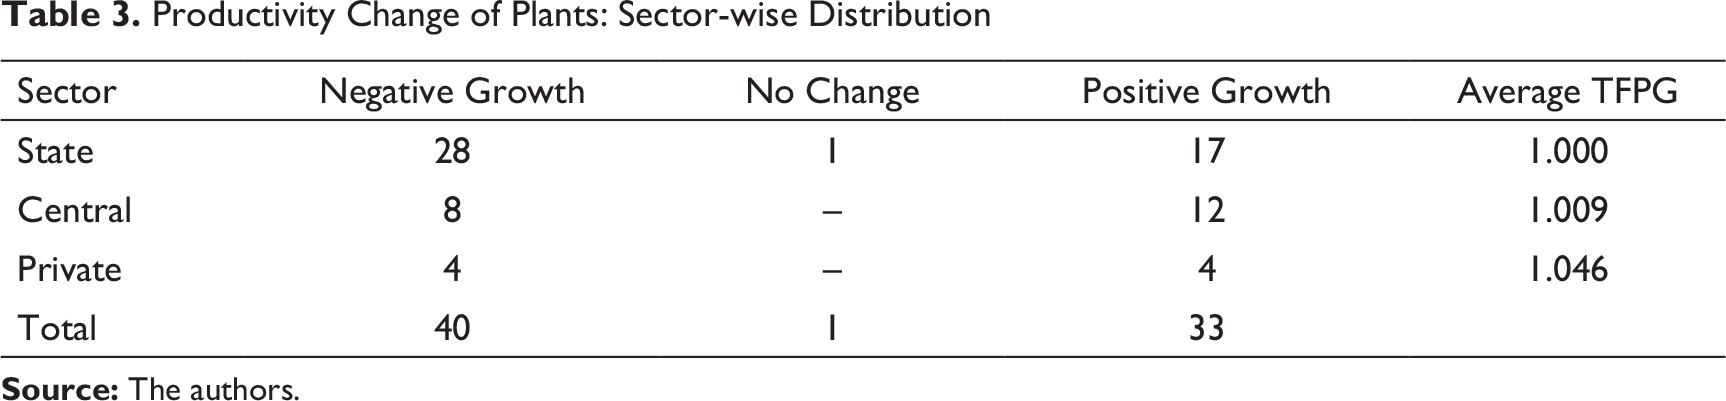
It is found that out of 74 plants, 40 plants (54.05%) recorded an average negative total factor productivity growth (TFPG), as many as 33 plants (44.59%) recorded positive TFP growth. The remaining one plant (1.35%) recorded no change in their TFP during the study period. Out of 33 plants, recorded average positive TFP, 7 and 4, belong to NTPC and DVC, respectively. On an average basis, plant-51 (Ramagundam-B) recorded maximum growth of 37.9 per cent per year followed by plant-15 (Dahanu), −31.7 per cent, and plant-49 (Rajghat), −31.2 per cent. Plant-2 (Amar Kantak Ext) and plant-60 (Simhadri) reported the lowest growth (negative growth) of −25.2 and −23.8 per cent per annum, respectively. Year-wise TFP change, SECH, PECH, EFFCH and TECHCH are shown in Figure 3.
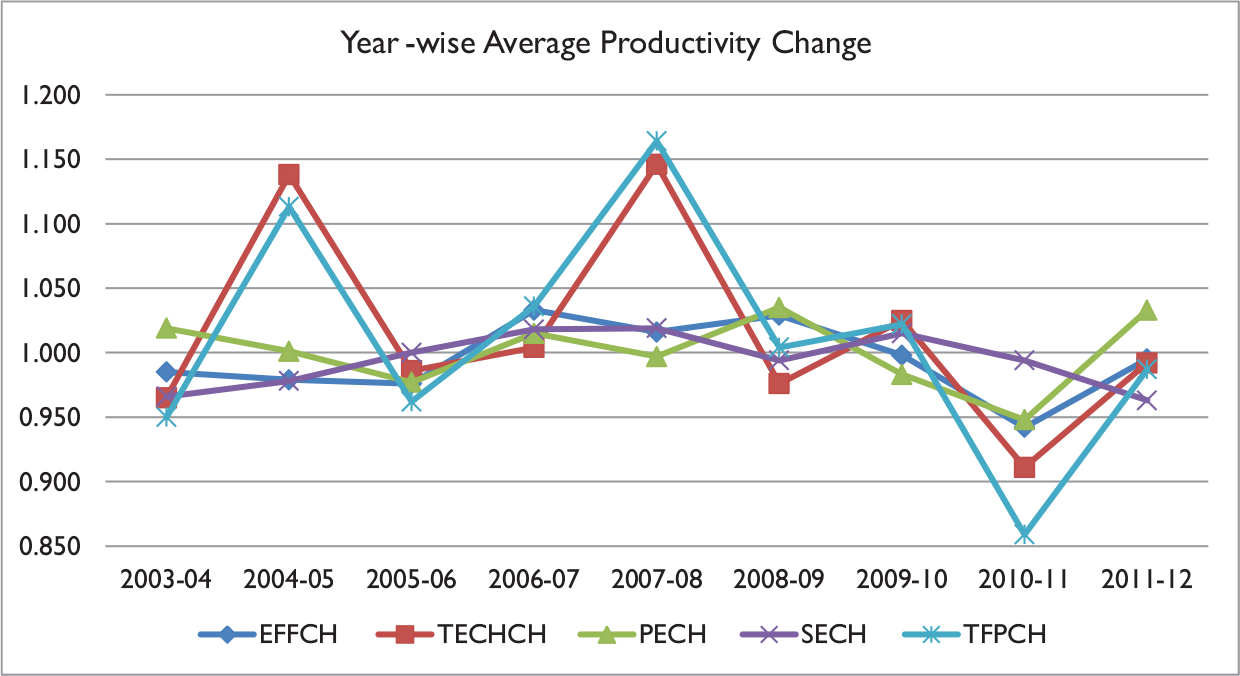
From the graphical representation of average TFPG in Figure 3, it is observed that 2007–2008 and 2004–2005 witnessed highest growth of 16.4 and 11.3 per cent, respectively. 2010–2011 has recorded negative growth of −14.1 per cent. TE change and TECHCH both contributed negatively by −5.8 and −8.9, respectively, during 2010–2011. This indicates regress of the frontier technology during the period and deserves further analysis which is beyond the scope of this research.
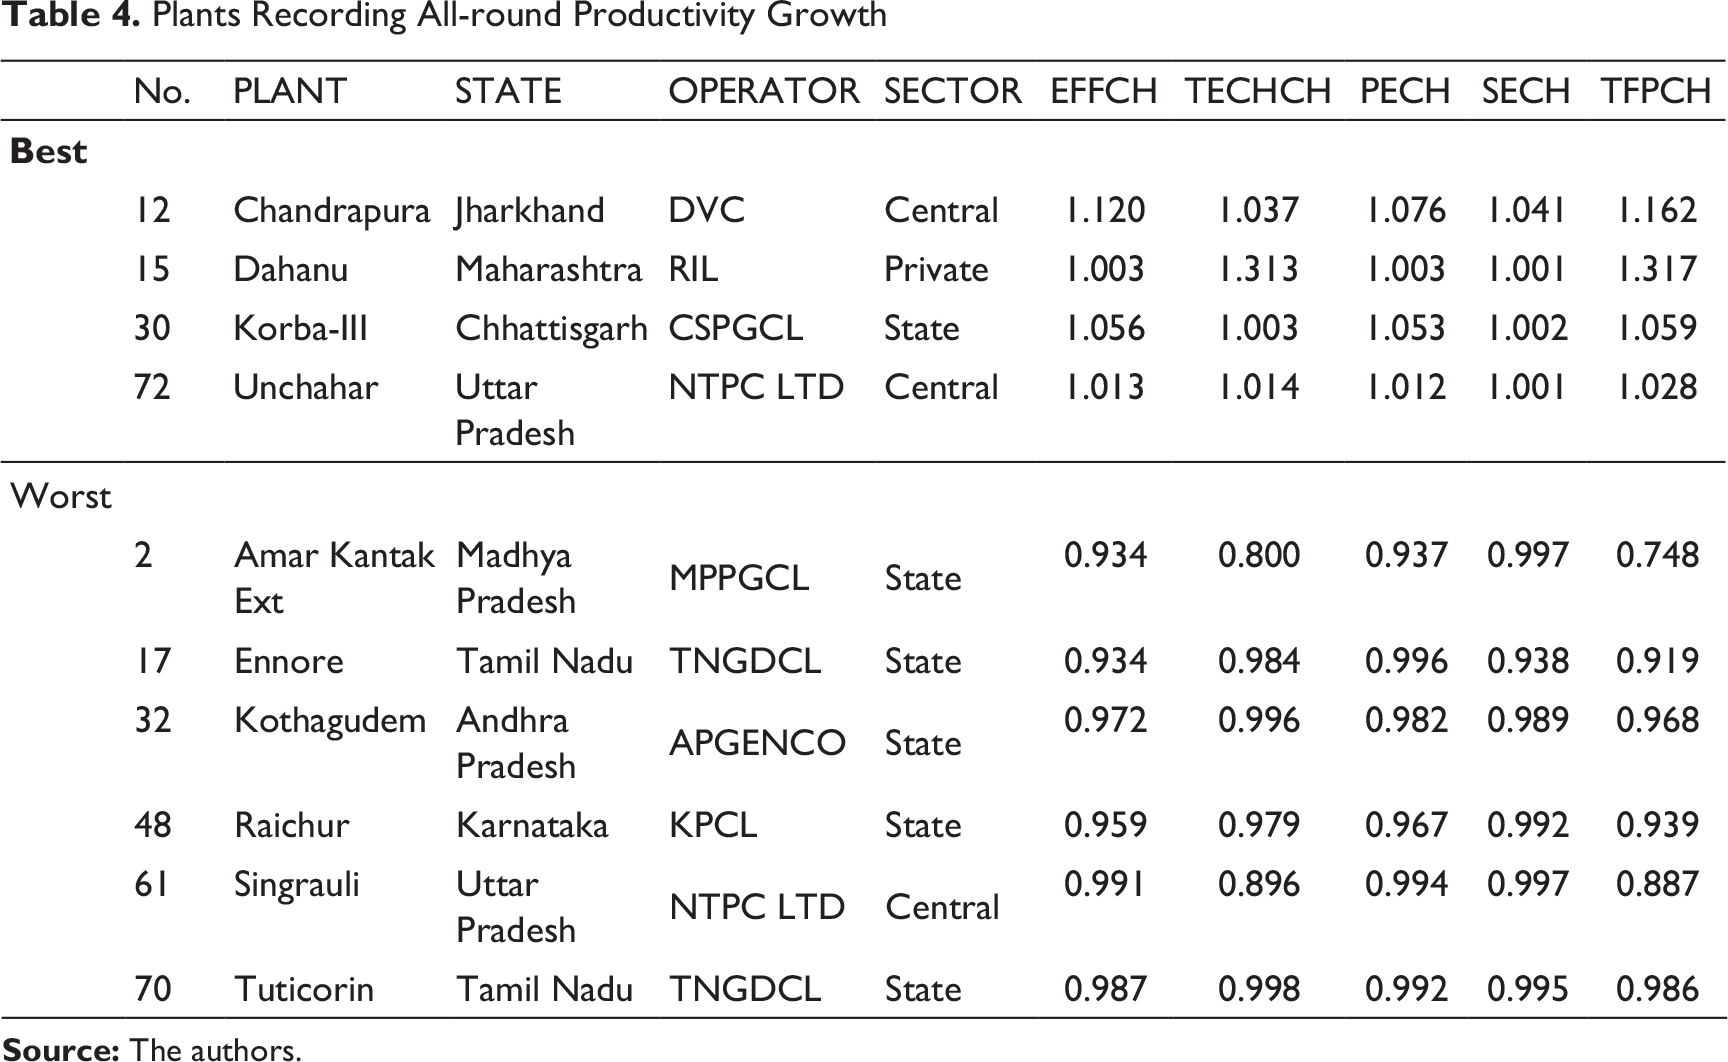
The overall EFFCH of −0.6 per cent per annum when further decomposed indicates 0 and −0.6 per cent per annum due to pure EFFCH and SECH, respectively. The highest EFFCH is observed in plant-12 (Chandrapura), that is, 12 per cent per annum, and the lowest in plant-2 (Amar Kantak Ext) as well as in plant-17 (Ennore), that is, 6.6 per cent per annum from 2002–2003 to 2011–2012. Average SECH is observed as the highest in plant-57 (Santaldih), that is, 6 per cent, and the lowest in plant-47 (Patratu), that is, 19.4 per cent per annum.
EFFCH varied drastically from negative TE growth, that is, 1.5 (2003–2004), to positive TE growth, that is, 3.3 (2006–2007), and then fell to negative TE growth, that is, 5.8, during 2010–2011. As many as 41 power plants registered negative TE growth, while another 10 power plants recorded no change. Remaining 23 power plants recorded positive TE growth.
Positive TECHCH of 1.3 per cent per annum is observed during the research period. It indicates the upward shift in the frontier. The highest TECHCH is observed in plant-51 (Ramagundem-B), that is, 37.9 per cent per annum, and the lowest in plant-60 (Simhadri), that is, 23.8 per cent per annum. A total of 22 power plants registered negative TECHCH, while another 1 plant recorded no change. The remaining 51 power plants registered positive TECHCH.
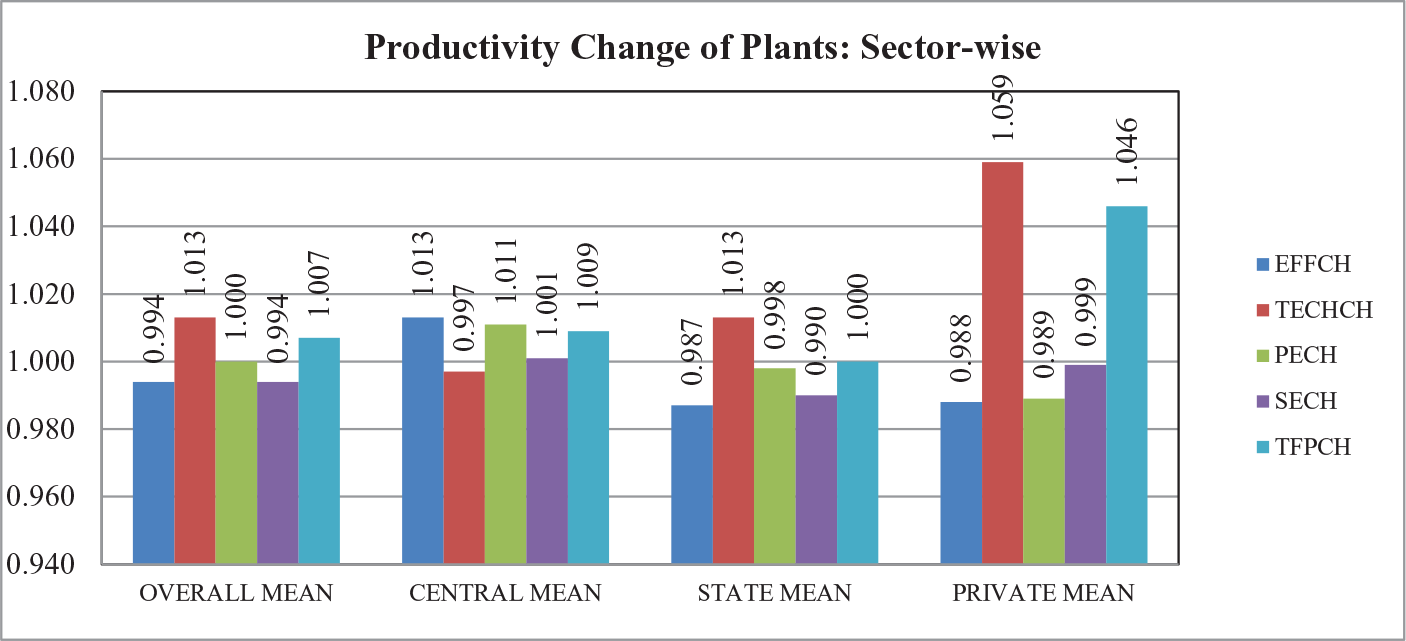
From Table 3, it is observed that the private sector achieved the maximum TFPG of 4.6 per cent per annum, followed by the central sector which recorded a growth of 0.9 per cent per annum. The plants in the state sector recorded no change in growth during the period. The private sector has shown an edge over the centre as well state sector regarding average TFPG.
Productivity Change of Plants: Sector-wise Distribution
Plants Recording All-round Productivity Growth
Correlation Coefficients Among All Indices
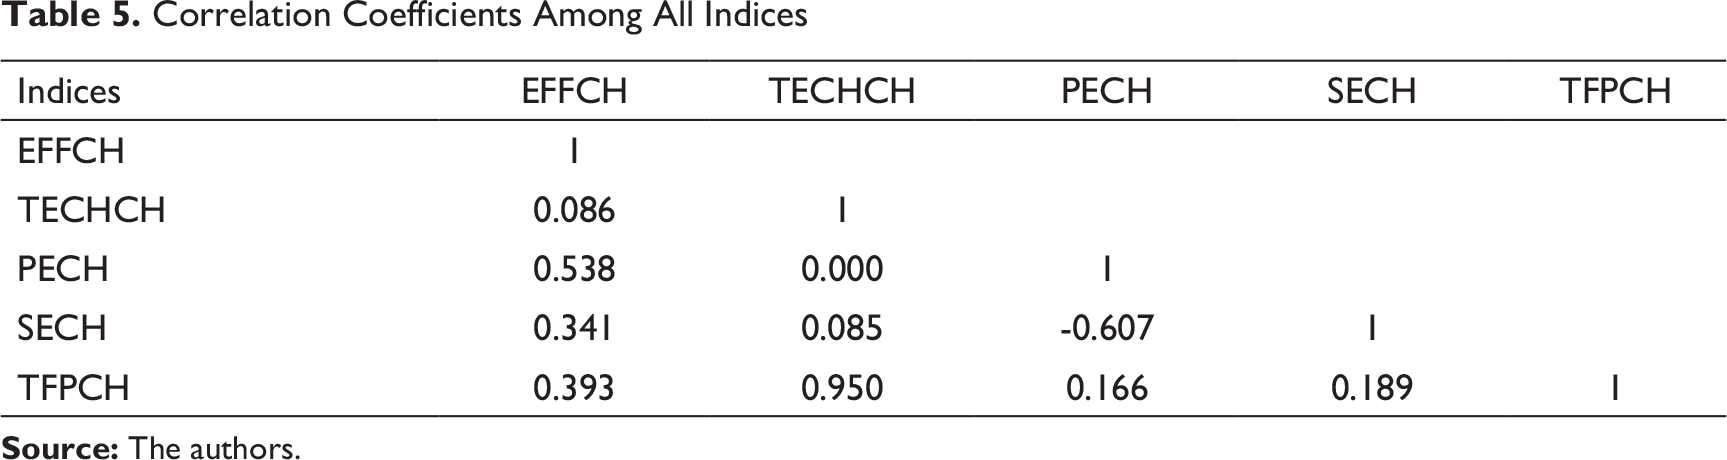
From Table 5, it is observed that TECHCH and TFPCH have a significant positive relationship, followed by PECH and EFFCH. Further, a negative relationship is observed between SECH and PECH. Thus, the energy planner has to incorporate all the perspectives including the correlation coefficient of indices while making a decision or deciding the future course of action.
Sector-wise productivity change of power plants is represented in Figure 4. From the graphical representation, it is found that private plants have the highest technological growth and TFPG of 5.9 and 4.6 per cent per annum, respectively. Technical efficiency growth among state and private plants are the same, that is, −1.2 per cent per annum. However, central plants have observed positive technical efficiency growth of 1.3 per cent per annum. On account of scale efficiency growth, the central power plants have a more advantageous position as compared to state and private power plants as shown in Figure 4.
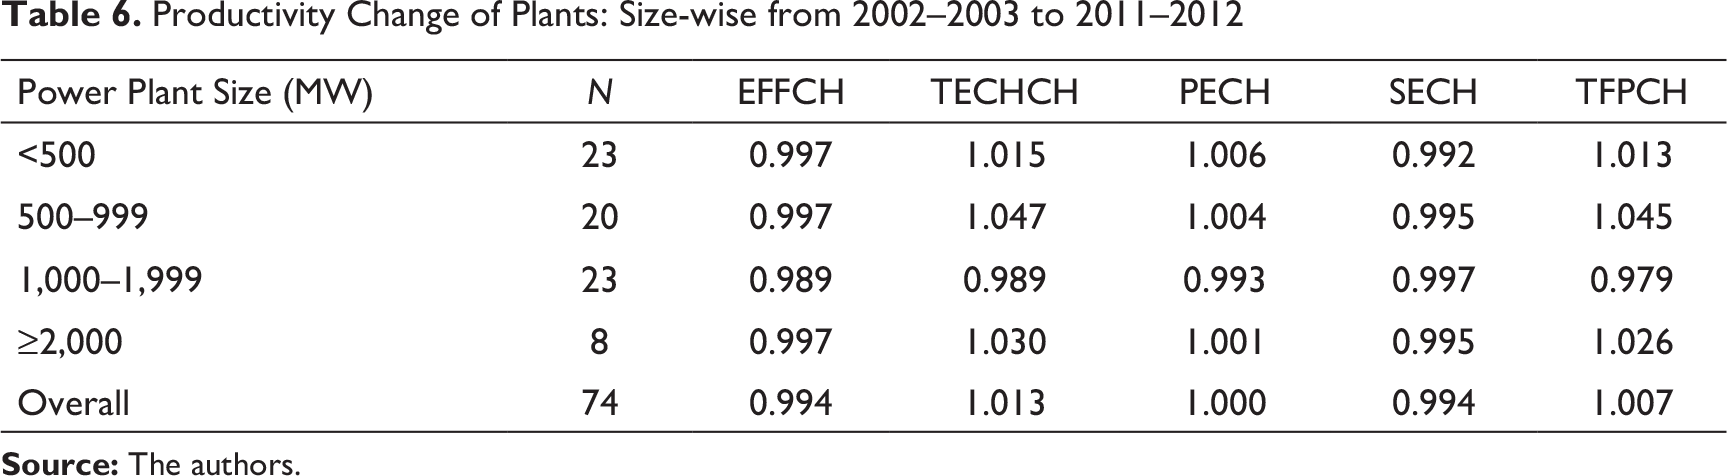
Further, results of productivity change of power plants are bifurcated on the basis of plant size, which is measured in MW. From Table 6, it is observed that power plants between 1,000 and 1,999 MW perform the worst in all indices as compared to other-sized power plants except SECH. Power plants between 500 and 999 MW perform the best and can act as a benchmark for others too. Power plants below 500 MW perform better in all the indices except SECH. It means that power plants below 500 MW lost their technological and pure technical change advantage due to SECH, but plants between 1,000 and 1,999 MW gained the highest due to SECH. Based on TFP change, power plants between 500 and 999 MW have achieved maximum growth, that is, 4.5 per cent per annum, followed by 2,000 and above MW sized power plants. Thus, looking into the results, energy planners should put more concentrated efforts towards power plants between 1,000 and 1,999 MW sizes.
Productivity Change of Plants: Size-wise from 2002–2003 to 2011–2012
Conclusion
DEA-MPI is used to analyse the productivity change of 74 coal-fired power plants located across the India from April 2002 to March 2012. The study revealed 0.70 per cent of average annual TFPG witnessed from 2002–2003 to 2011–2012, indicating overall progress. These study results are contradictory to the outcome of Behera et al. (2011), and positive TFP growth of 1.2 per cent per year was recorded.
The contribution of TECHCH in TFP growth is positive, that is, 1.3 per cent per annum (Behera et al. reported a TECHCH of 0.3% per year). It indicates the expansion of the efficient frontier. However, there was a decrease in technical EFFCH of −0.6 per cent per year, indicating the adverse sign of progress. However, Behera et al. observed increased technical EFFCH of 0.9 per cent per year.
A total of 54.05 per cent of plants has recorded negative TFPG as compared to 40.54 per cent studied by Behera et al. Energy planners should pay attention to these plants and develop action plans for possible improvement in the days to come. Detailed analysis of −0.6 per cent overall technical EFFCH per annum is due to scale efficiency. Thus, energy planners should pay more attention to scale efficiency to improve the overall scenario of power-generation plants.
Central plants have shown better technical efficiency growth of 1.3 per cent per annum but lost their advantage to adverse TECHCH of −0.3 per cent per annum. Private plants observed the just reverse situation of central plants. Private plants showed 5.9 per cent of positive technological growth per annum but lost their advantage to adverse technical EFFCH of 1.2 per cent per annum.
Centre’s power plants have observed positive SECH of 0.1 per cent per annum, but both state and private plants witnessed negative growth of −1 and −0.1 per cent, respectively. Central, state and private power plants have observed TFP growth of 0.9, 0 and 4.6 per cent per annum, respectively, which is contradictory to the study results of Behera et al. (2011). Behera et al. reported 4.2, 0.4 and −0.8 per cent average TFP growth of central, state and private power plants, respectively.
Negative technical efficiency and scale efficiency growth of plants in the state sector is a matter of concern and needs immediate attention from the policymaker or energy planners. Four plants (Chandrapura, Dahanu, Korba-III and Unchahar) have recorded all-around productivity growth more than unity, but studies conducted by Behera et al. reported 12 power plants. Surprisingly, only one power plant, that is, Unchahar, recorded all-around productivity growth more than unity in both studies.
Managerial Implication
From this article, the managers can draw significant managerial and policy implications. First, India’s thermal power plants can improve their overall technical efficiency by implementing policies of best-performing plants operating under different owners, which would help that particular power plant to move a closer to the efficient production frontier. Second, improving technical performance will definitely have an impact on their profitability. Third, these results are going to help managers focus on crucial areas where these power plants are lacking and ways to become optimum efficient. In short, this empirical study provides useful information to policymakers and concerned authorities who have been gradually directed towards partial regulation. In addition, since the thermal power plant industry is a capital-driven industry, it takes a lot of time, money and efforts to make relevant changes in existing established structures to improve their overall performance over a period of time.
Further, it can be concluded that governance of different stakeholders has their pros and cons over operational efficiency. Thus, this study unlocks a new research dimension, whether public private partnership (PPP) delivers better results than existing structure.
Footnotes
Acknowledgement
The authors are grateful to the anonymous referees of the journal for their extremely useful suggestions to improve the quality of the article.
Declaration of Conflicting Interests
The authors declared no potential conflicts of interest with respect to the research, authorship and/or publication of this article.
Funding
The authors received no financial support for the research, authorship and/or publication of this article.