



Abstract
At National Stock Exchange (NSE), the largest by market capitalization and the most liquid stocks, which form the majority of free float market capitalization of the exchange, have traded futures contracts. The equity stock futures segment in India has recorded very high growth in trading volume and turnover for more than one decade where majority trade happens on NSE. The primary objective of this study is to investigate the dynamic linkages between equity stock futures and their underlying spot markets. The article examines market efficiency and the causal relationship between single-stock futures and underlying stocks traded at NSE, by employing Johansen cointegration test, a test for autoregressive (AR) order of basis, vector error correction model (VECM) and impulse response functions. The result shows the existence of long-run equilibrium relationship between equity stock futures and their underlying stocks. The spot market is found to play a lead role in correction of any short-run disequilibrium towards long-run equilibrium, for the majority of stocks. Both spot and future markets contribute in price discovery and neither of the markets display considerably higher information efficiency compared to the other. In contrast, the study also reveals possibilities of arbitrage opportunity between the equity stock futures market and the underlying spot market in absence of transaction costs possibly due to faster correction of short-run disequilibrium by spot prices.
Introduction
Derivative contracts with equity shares and stock indexes as underlying variables are the first forms of exchange traded derivatives to be introduced in India. The capital market watchdog, the Securities and Exchange Board of India (SEBI) has approved trading of derivative contracts at the National Stock Exchange (NSE) and the Bombay Stock Exchange (BSE) from the year 2000. Trading first commenced in futures contracts on index, followed by trading on index and equity options, and equity futures thereafter. Since introduction, India has established an active market in exchange traded equity derivatives, and the derivatives segment of the NSE has gained much prominence, as over the years more than 95 per cent of equity derivatives trading has happened on NSE (http://www.sebi.gov.in). With the proliferation of exchange traded financial derivatives as an asset class, understanding the information efficiency of these markets and their role in the price discovery process has become essential for the practitioners, academicians and regulators.
Information efficiency in securities market essentially means how quickly and accurately the market prices of securities adjust to new and relevant information. In a perfectly efficient and frictionless market, current prices of both the derivative contract and its underlying have already reflected all relevant information, and hence the market leaves no pattern to exploit trading opportunities to make any excess economic gain. Information forms an integral part of price dynamics in any market, and price discovery refers to the impounding of new information into the price. Hence, lack of uniformity in information held by the market participants in the different market segments, for example, derivatives market segment and the underlying spot market segment, is likely to result in deviations in asset prices in these markets from their equilibrium. So, if more informed trading takes place in the equity derivatives segment than in equity market segment, price discovery will be quicker and more accurate in the derivatives market as compared to underlying equity market and vice versa. This is likely to result in market inefficiencies in the form of lead–lag relationships and violations of no-arbitrage efficiency. Due to the inherent complexities associated with derivatives market in general, and the existence of market frictions such as transaction cost differentials, liquidity differences, margin requirements, short sale constraints, etc., there may be a higher percentage of more informed and sophisticated traders operating in the derivatives market as compared to the underlying asset market. Price discovery is expected to first take place in the futures market and then to get transmitted to the underlying cash market (Pizzi et al., 1998).
Increasing trade volume in the equity stock futures market in India over more than one decade shows that many investors trade in this segment. Further, for the NSE, as with most of the major global stock exchanges, the largest in terms of market capitalization and the most liquid stocks have traded-futures contracts. In course of normal trading, short-run mispricing between the equity stock futures and the underlying stock market may arise, giving rise to riskless profit opportunities, and through the implementation of arbitrage trading strategies, the markets (spot and futures) reach new equilibrium level. However, understanding of information efficiency of these markets and their lead–lag relationship are important in formulation of successful arbitrage trading strategies. Further, understanding of relationship between futures and cash price movements is important in choice of futures contract for equity price risk management and hedging. Moreover, an important objective of securities market design is optimal price discovery. It is widely accepted that presence of well-regulated and efficient derivatives market facilitates better price discovery in the spot market. So, the understanding of information efficiency of equity stock futures and spot markets, their role in price discovery and causal relationship are important considerations for the securities market regulator in policy formulation. These issues, along with the above-mentioned theoretical arguments, necessitate a thorough research and emphasize the importance of greater understanding of the market efficiency and price discovery dynamics between equity stock futures market and the underlying equity market. Hence, the present research is undertaken.
Accordingly, the remainder of the article is organized as follows. The second section reviews existing literature on the research issue. The third section elaborates the sample, data and research methods for the study. The empirical analysis and results are presented in the fourth section. Finally, the fifth section concludes the study.
Literature Review
The explorative research on market efficiency and price discovery is quite extensive. Only a few noted studies are mentioned here for better understanding of the present research issue. In his seminal work, Fama (1970) has given the theory of efficient markets, which is concerned with whether prices at any point of time fully reflect available information. He has mentioned three forms of market efficiency, namely, weak form, semi-strong form and strong form and the tests to identify each form. The Nobel Prize winning works of Akerlof (1970), Grossman and Stiglitz (1976, 1980) and others have emphasized the importance of information in the price discovery process in any market. In their model, Grossman and Stiglitz (1976) have shown that the process of a market reaching equilibrium is through dissemination of information from informed individuals to uninformed ones. They have also shown that a similar model apply to equity trading (Grossman & Stiglitz, 1980).
There have been exhaustive empirical studies relating to price discovery and linkages between index futures and spot index in developed economies, and to some extent relating to emerging economies. Stoll and Whaley (1990) have studied intra-day price movements between Major Market Index (MMI) futures and S&P 500 index over the period 1982–1987 using an ARMA (p, q) process, and have found that MMI futures lead the spot index by 5 min. Wahab and Lashgari (1993) have examined causality between stock index futures and both the S&P 500 and the FTSE 500 indices using daily data for the period 1988–1992. They have employed cointegration and error correction models and found bi-directional causality, further observing that for more number of days, futures leads spot. Tse (1995) has studied Nikkei 225 futures using daily data over the period 1988–1993 through VECM and found that index futures leads spot index. Abhyankar (1995, 1998), analysing lead–lag relationship between FTSE 100 index futures and the spot index, found that futures market leads spot market. Results have further revealed that the instance of index futures leading spot reduces when transaction costs in the underlying spot market declines. Brooks et al. (2001) have examined lead–lag relationship between FTSE 100 index futures and the stock index using 10 min observations for the period June 1996–1997. The results confirm that futures returns lead spot returns, and the same can be attributed to relatively faster flow of information in futures market due to lower transaction costs and other trading benefits. They have employed a number of time series models for the study and commented that the best forecasting model is that of the error correction type.
Shastri et al. (2008), studying 137 single-stock futures (SSFs) traded on ChicagoOne and NasdaqLiffe Markets (NQLX), have observed that information share of SSFs increases when trading volume of futures is relatively higher than that of the underlying, and with increase in volatility of the underlying stock. Floros and Vougas (2008) have studied efficiency of Greek stock index futures with data from 1999–2001 and observed a stable long-run relationship between spot and futures prices using impulse response functions and also found futures market to be more information efficient than the spot market. Floros (2009), examining price discovery between futures and spot markets in South Africa during the period 2002–2006, has found evidence of bi-directional causality between futures and spot index. Theissen (2012), analysing German stock index, index exchange traded fund (ETF) and index futures using a threshold error correction model, has found futures market leading the process of price discovery. Yanik and Ayturk (2012), have examined lead–lag relationship between spot and futures markets in Turkey using daily data for the period February 2005–March 2011 and have observed that the spot market plays a price discovery role for the futures market for the ISE 30 index. Further, Frommherz (2019), studying price formation in German Stock Index (DAX), has examined its four major market segments for the period July 2007–December 2009 characterized by financial crisis. The results show that futures market leads in terms of price discovery, closely followed by exchange-traded fund, and also that short-selling constraints weaken the price discovery role of certain market segments.
However, there have been a fewer studies in relation to price discovery between futures and spot markets and efficiency of these markets in the Indian context. Gupta and Singh (2007, 2009) have studied the efficiency of Indian equity index futures market, during June 2000 and April 2007 using VAR methodology and VECM, and observed significant bilateral causality between the Nifty and Nifty Futures, and the futures market to be relatively more efficient than the cash market. Similarly, Srinivasan (2009), taking a data period from June 2000 to September 2008, has found bilateral causality between Nifty spot and Nifty futures. Karmakar (2009), has examined price discovery and volatility spillover between the Nifty and Nifty futures during the period June 2000 to March 2007 using VECM and BEKK model and observed higher information efficiency of Nifty futures compared to the underlying spot index. Pati and Padhan (2009) have noted similar findings for data period 2004–2008. Choudhary and Bajaj (2013) have studied price discovery between spot and futures for Nifty and 41 individual stocks using VECM approach, taking a data period from June 2000 (for index) and November 2001 (for individual stocks) till August 2010. The results show that futures price series leads spot price series for Nifty and 21 stocks, and 20 stocks’ futures price series is led by spot price series. Pandey (2014), studying three market segments of the Nifty for period April 2009–March 2014, has found spot market leading the process of price discovery followed by futures and then options. Mukherjee and Mishra (2006), taking intra-day data for Nifty and five actively traded Nifty stocks for the period April–September 2004 have investigated lead–lag relationship, both in terms of return and volatility, among the Nifty spot and futures market. They found strong contemporaneous and bi-directional relationship between the spot and futures market in India, and the spot market to play comparatively stronger leading role in information dissemination. Mallikarjunappa and Afsal (2010) have studied lead–lag relationship between spot and futures markets for a sample of 12 individual stocks traded on NSE, taking minute-wise observations for the period July–December 2006. They have employed VECM in EGARCH framework and found bi-directional causality between spot and futures markets. In addition, there has been some similar empirical research related to market efficiency and price discovery in the context of Indian commodity futures market including some recent studies like Gupta et al. (2018).
Thus studies relating to dynamic linkages between futures and spot markets and related price discovery process have provided mixed evidences both in Indian and international context. Moreover, studies have largely concentrated on analysing the relationship between stock index futures and the underlying index. The nature of an index futures contract implies that it is less likely to be used as an instrument for exploiting firm-specific information, it gives traders the opportunity to exploit macro-based information that is expected to impact the market as a whole; firm-specific information is only reflected in index futures prices through component stocks (Chan et al. 1991). However, there have been few significant studies examining the lead–lag relationship and price discovery between single-stock equity futures market and the underlying equity market, and issues related to no-arbitrage efficiency of these markets. The present study, therefore, aims at contributing towards fulfilment of this gap in the research literature, and facilitating a better understanding of the issues in the context of the Indian securities market.
Sample, Data and Research Methods
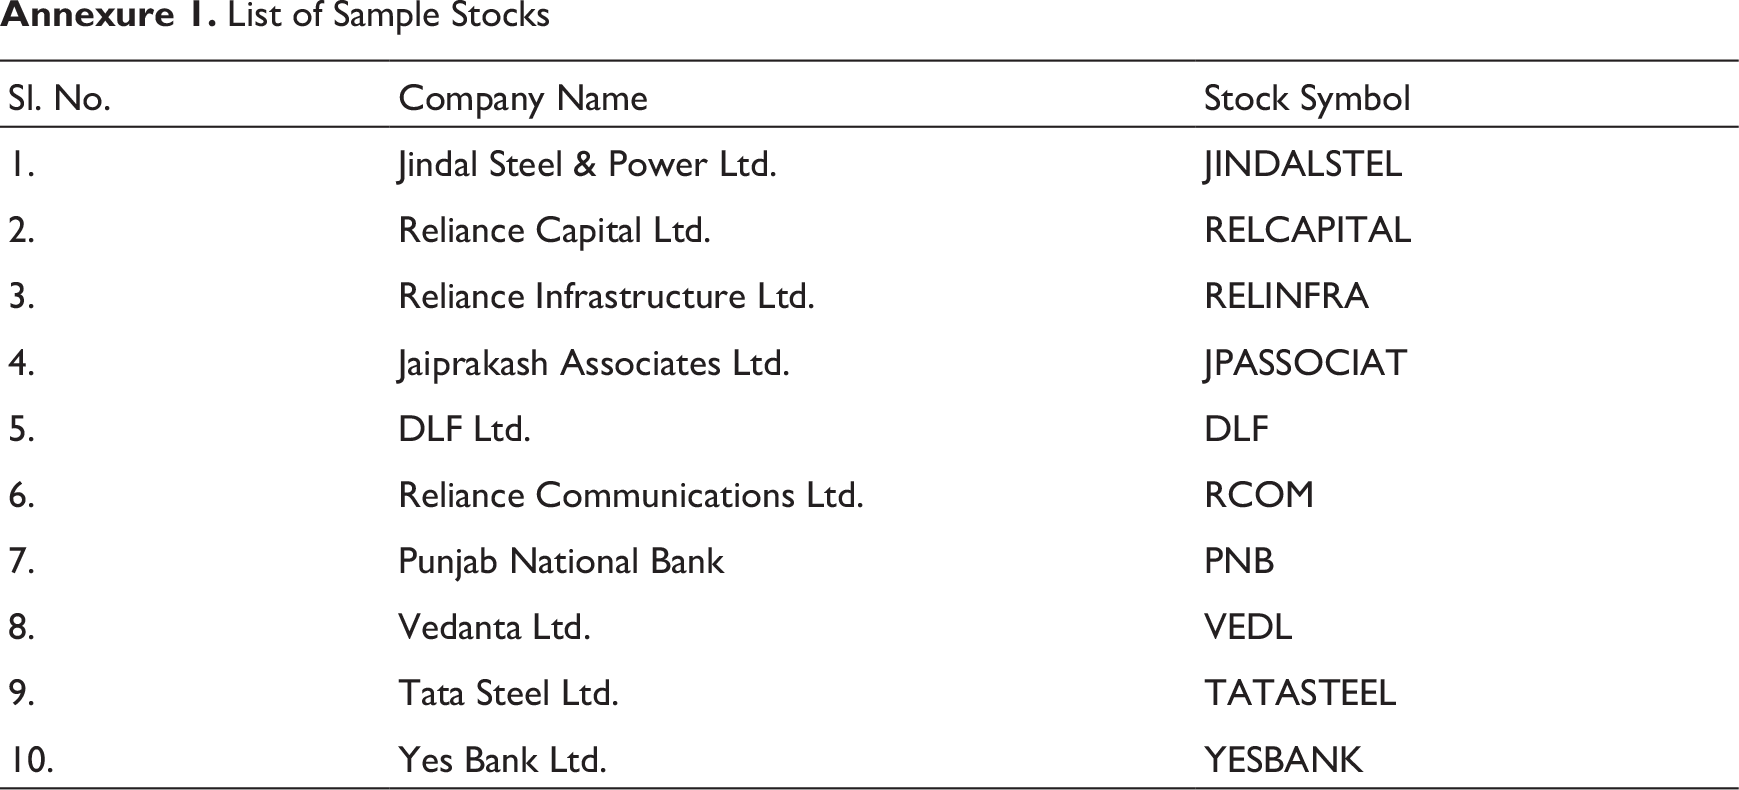
The study is based on observations of daily closing prices of both futures and spot relating to a sample of 10 individual stocks traded in the NSE for a period of 73 months from January 2011 to January 2017. The sample period is characterized by high liquidity in the Indian equity futures market, and during this period, Indian equity market did not experience any major economic crisis. The number of stocks listed as underlying on the derivatives segment of NSE is approximately 150. From a total of 69 stocks which were a part of the S&P CNX Nifty 50 Index (Nifty) and were also listed on the derivatives segment of the exchange during the sample period, top 10 stocks have been selected as underlying for the study (refer Annexure 1 for the list of sample stocks) on the basis of liquidity, calculated as an average of the proportion of daily traded quantity of the stock by the total number of free float outstanding shares. These 10 stocks exhibited a threshold liquidity measure (as calculated above) of at least 1 per cent and also had derivatives trading during the entire sample period. The number of sample stocks taken is in excess of or accord with other studies done in the Indian context. Only price of near month futures contract on the underlying stock is considered as it is most heavily traded. One possible reason for higher liquidity in such contract being, that traders prefer a near month contract as compared to a distant contract for futures hedging because it is likely to enhance the hedging effectiveness as a result of lower optimal hedge ratio (Ripple & Moosa, 2007). All data required for the study have been retrieved from the NSE website (http://www.nseindia.com). A trading week has been considered from Monday to Friday, and to avoid discontinuity in trading due to any in-between holiday, data filling has been done with previous day traded values.
The present study attempts to investigate the dynamic linkages and also comments on no-arbitrage efficiency between equity stock futures and spot markets. The standard Augmented Dickey Fuller (ADF) tests (Dickey & Fuller, 1979) and Phillips-Perron (PP) tests (Phillips & Perron, 1988) are employed to test the presence of unit roots in the log price series of spot and futures and their differences, and identify the order of integration of each variable. The study employs Johansen (1988) cointegration test to identify the existence of cointegrating vector between spot and futures price series. Following Antoniou and Garrett (1993, 1995) and Brooks and Garrett (2002), a test for Autoregressive (AR) order of basis is carried out to assess the possible existence of unexploited arbitrage opportunities. On finding evidence of cointegration, vector error correction model (VECM) is employed to identify the lead–lag relationship between spot and futures returns, followed by analysis of impulse response functions to get a better understanding of the price discovery process.
A cointegration relationship may be seen as a long-term equilibrium phenomenon. A linear combination of variables integrated in order one will be integrated in order zero, that is, stationary, only if the given variables are co-integrated. Such co-integrating variables may deviate from their relationship in the short-run, but their association would return in the long run. Following Johansen (1988, 1991), a p-dimensional vector time series of log-spot price (lnS) and log-futures price (InF) is considered and modelled as an unrestricted vector autoregression (VAR). From the Johansen-Juselius (1990) method, the maximum number of cointegrating vectors (r) is determined; this is done by cointegration trace and maximum eigenvalue tests. The trace statistic examines the null hypothesis of ‘no co-integration (r = 0)’ against the alternative that ‘there is one or more co-integrating vectors (r > 0)’. The maximum eigenvalue test statistic further tests the null hypothesis of the ‘number of co-integrating vectors being equal to r’ against the alternative of ‘r + 1’.
According to Antoniou and Garrett (1993, 1995) and Brooks and Garrett (2002), if futures market and underlying stock market function effectively, that is, they function as one entity and are indistinguishable (being cointegrated), then the only factor that should move relative prices in both markets is ‘arbitrage’, since news (the only other factor) is expected to instantly have identical impact in both the markets. Arbitrage involves simultaneous purchase of one asset and sale of the other, which drives the prices in both markets back to equilibrium if they drift too far apart. It is further argued that since the ‘basis’ (relative price differential between the two markets—spot and futures) gives indication whether arbitrage opportunities are present, it is the ‘basis’ that should drive price movements in both the markets. Further, when the price movement in these markets depends only on the same common factor, the basis, then both the markets are said to function as one and the pricing relationship should be best described by a first-order vector error correction model (VECM), with the error correction term being the relative price differential between the two markets, expressed as:

Where,
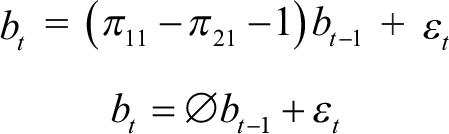
Where
According to Granger representation theorem (Granger, 1986), if the variables are cointegrated, then the VECM can be used. VECM restricts the long-run behaviour of the endogenous variables to converge to their cointegrating relationship, while allowing for short-run adjustment dynamics. The cointegrating term (lagged parameter of the cointegrating equation) is also known as the error correction term, since the deviation from long-run equilibrium is corrected gradually through a series of partial short-run adjustments. Considering a two variable system with
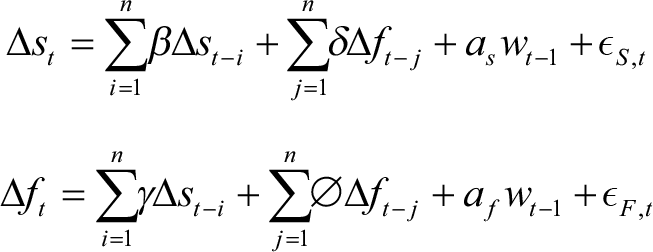
This model contains information about both long-run and short-run adjustments. The coefficients
To have a better insight into the dynamic linkages between spot and futures markets, impulse response function analysis, pioneered by Sims (1980), is carried out in a VECM framework. It is argued that a shock in one market gets transmitted to another market as information flows from one market to the other. Impulse response functions examine causal relationships between two or more dependent (endogenous) variables from VAR or associated VEC model. It traces the effect of one unit or one standard deviation shock (innovation) into the error term of each of the equations simultaneously at time point t, on current and future values of other endogenous variables through the dynamic lag structure of the model. In the context of this study, a shock (innovation) applied to the error-term (
Empirical Analysis and Results
From preliminary data analysis over the sample period, it is observed that the average daily returns of both the markets (spot and futures) are almost equal. The volatility, as measured by standard deviation of returns, of futures market is relatively higher than that of the spot market. The skewness coefficients of frequency distributions of both spot returns and futures returns for some stocks are positive, otherwise negative. Both spot and futures return distributions exhibit fat tails and excessive peak or concentration at the mean (leptokurtic) relative to the normal distribution; furthermore, Jarque–Bera test statistic rejects normality.
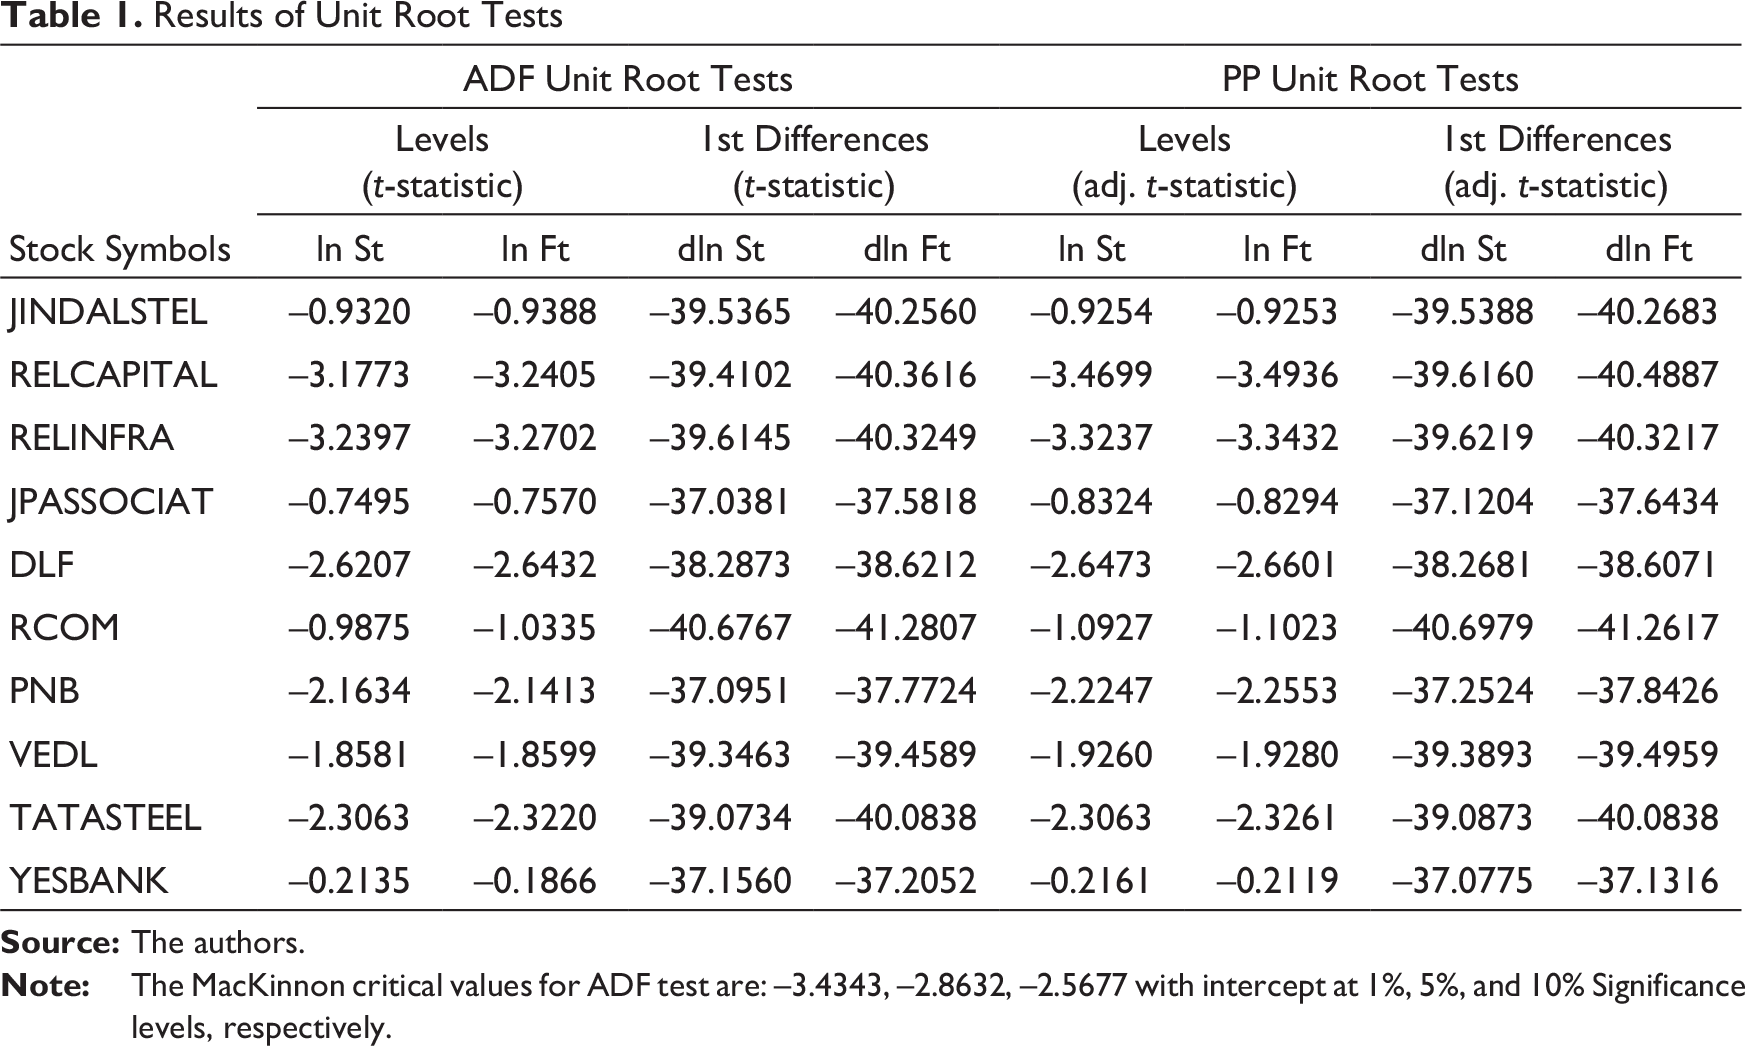
The results of both Augmented Dickey Fuller (ADF) tests and Phillips–Perron (PP) tests confirm that the first differences (log returns) of both spot prices and futures prices do not contain unit root, hence induce stationarity. So, both the spot and futures log price series are integrated in order one, I(1). This is observed for the entire sample (Table 1).
Prior to application of Johansen cointegration test, which is based on maximum likelihood estimation with VAR model, to examine the long-run relationship between spot and futures prices, selection of optimal VAR order (lag length) is done based on Schwarz information criterion (SIC). A lag length of two is selected for 8 out of 10 stocks (Jindalstel, Relcapital, Relinfra, Dlf, Pnb, Vedl, Tatasteel and Yesbank), and for the remaining two stocks (Jpassociat and Rcom) a lag length of three is chosen. The test statistics change only marginally on inclusion or exclusion of intercept in cointegrating equation(s). The overall results of Johansen cointegration test (reported in Table 2) of both cointegration trace and maximum eigenvalue tests indicate existence of one cointegration vector between spot and futures prices, for all ten stocks. This implies that long-run equilibrium relationship exists between both spot and futures markets.
Results of Unit Root Tests
Johansen Cointegration Test

* Denotes rejection of hypothesis at 0.01 level.
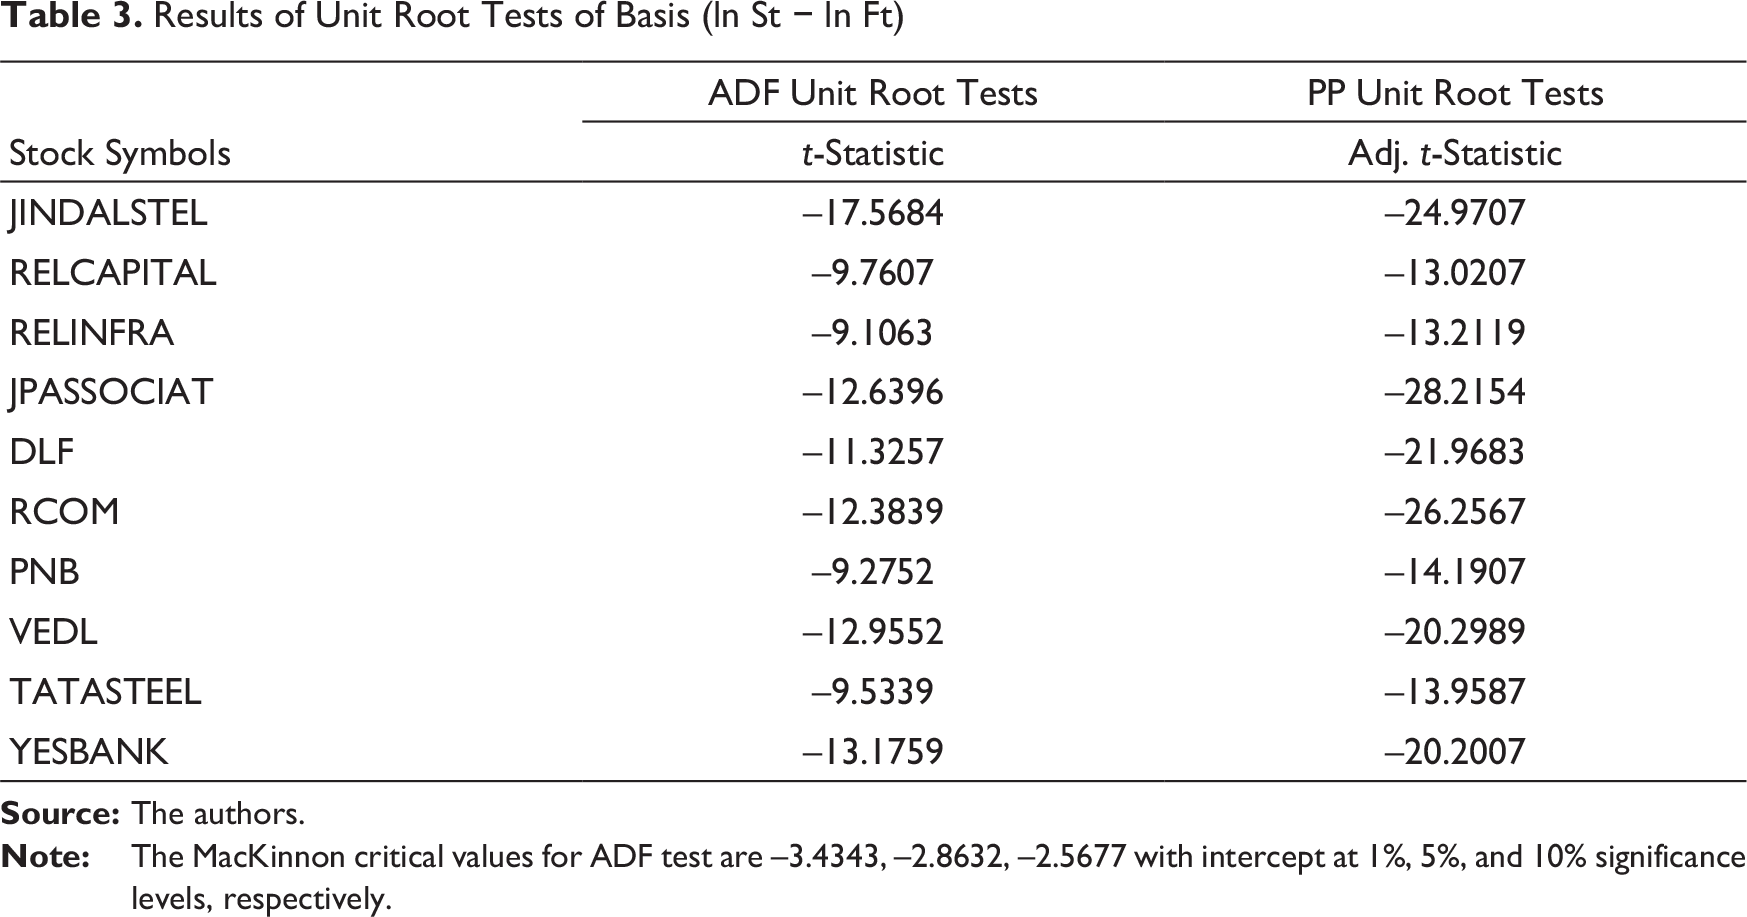
Results of Unit Root Tests of Basis (ln St − ln Ft)
AR order of Basis
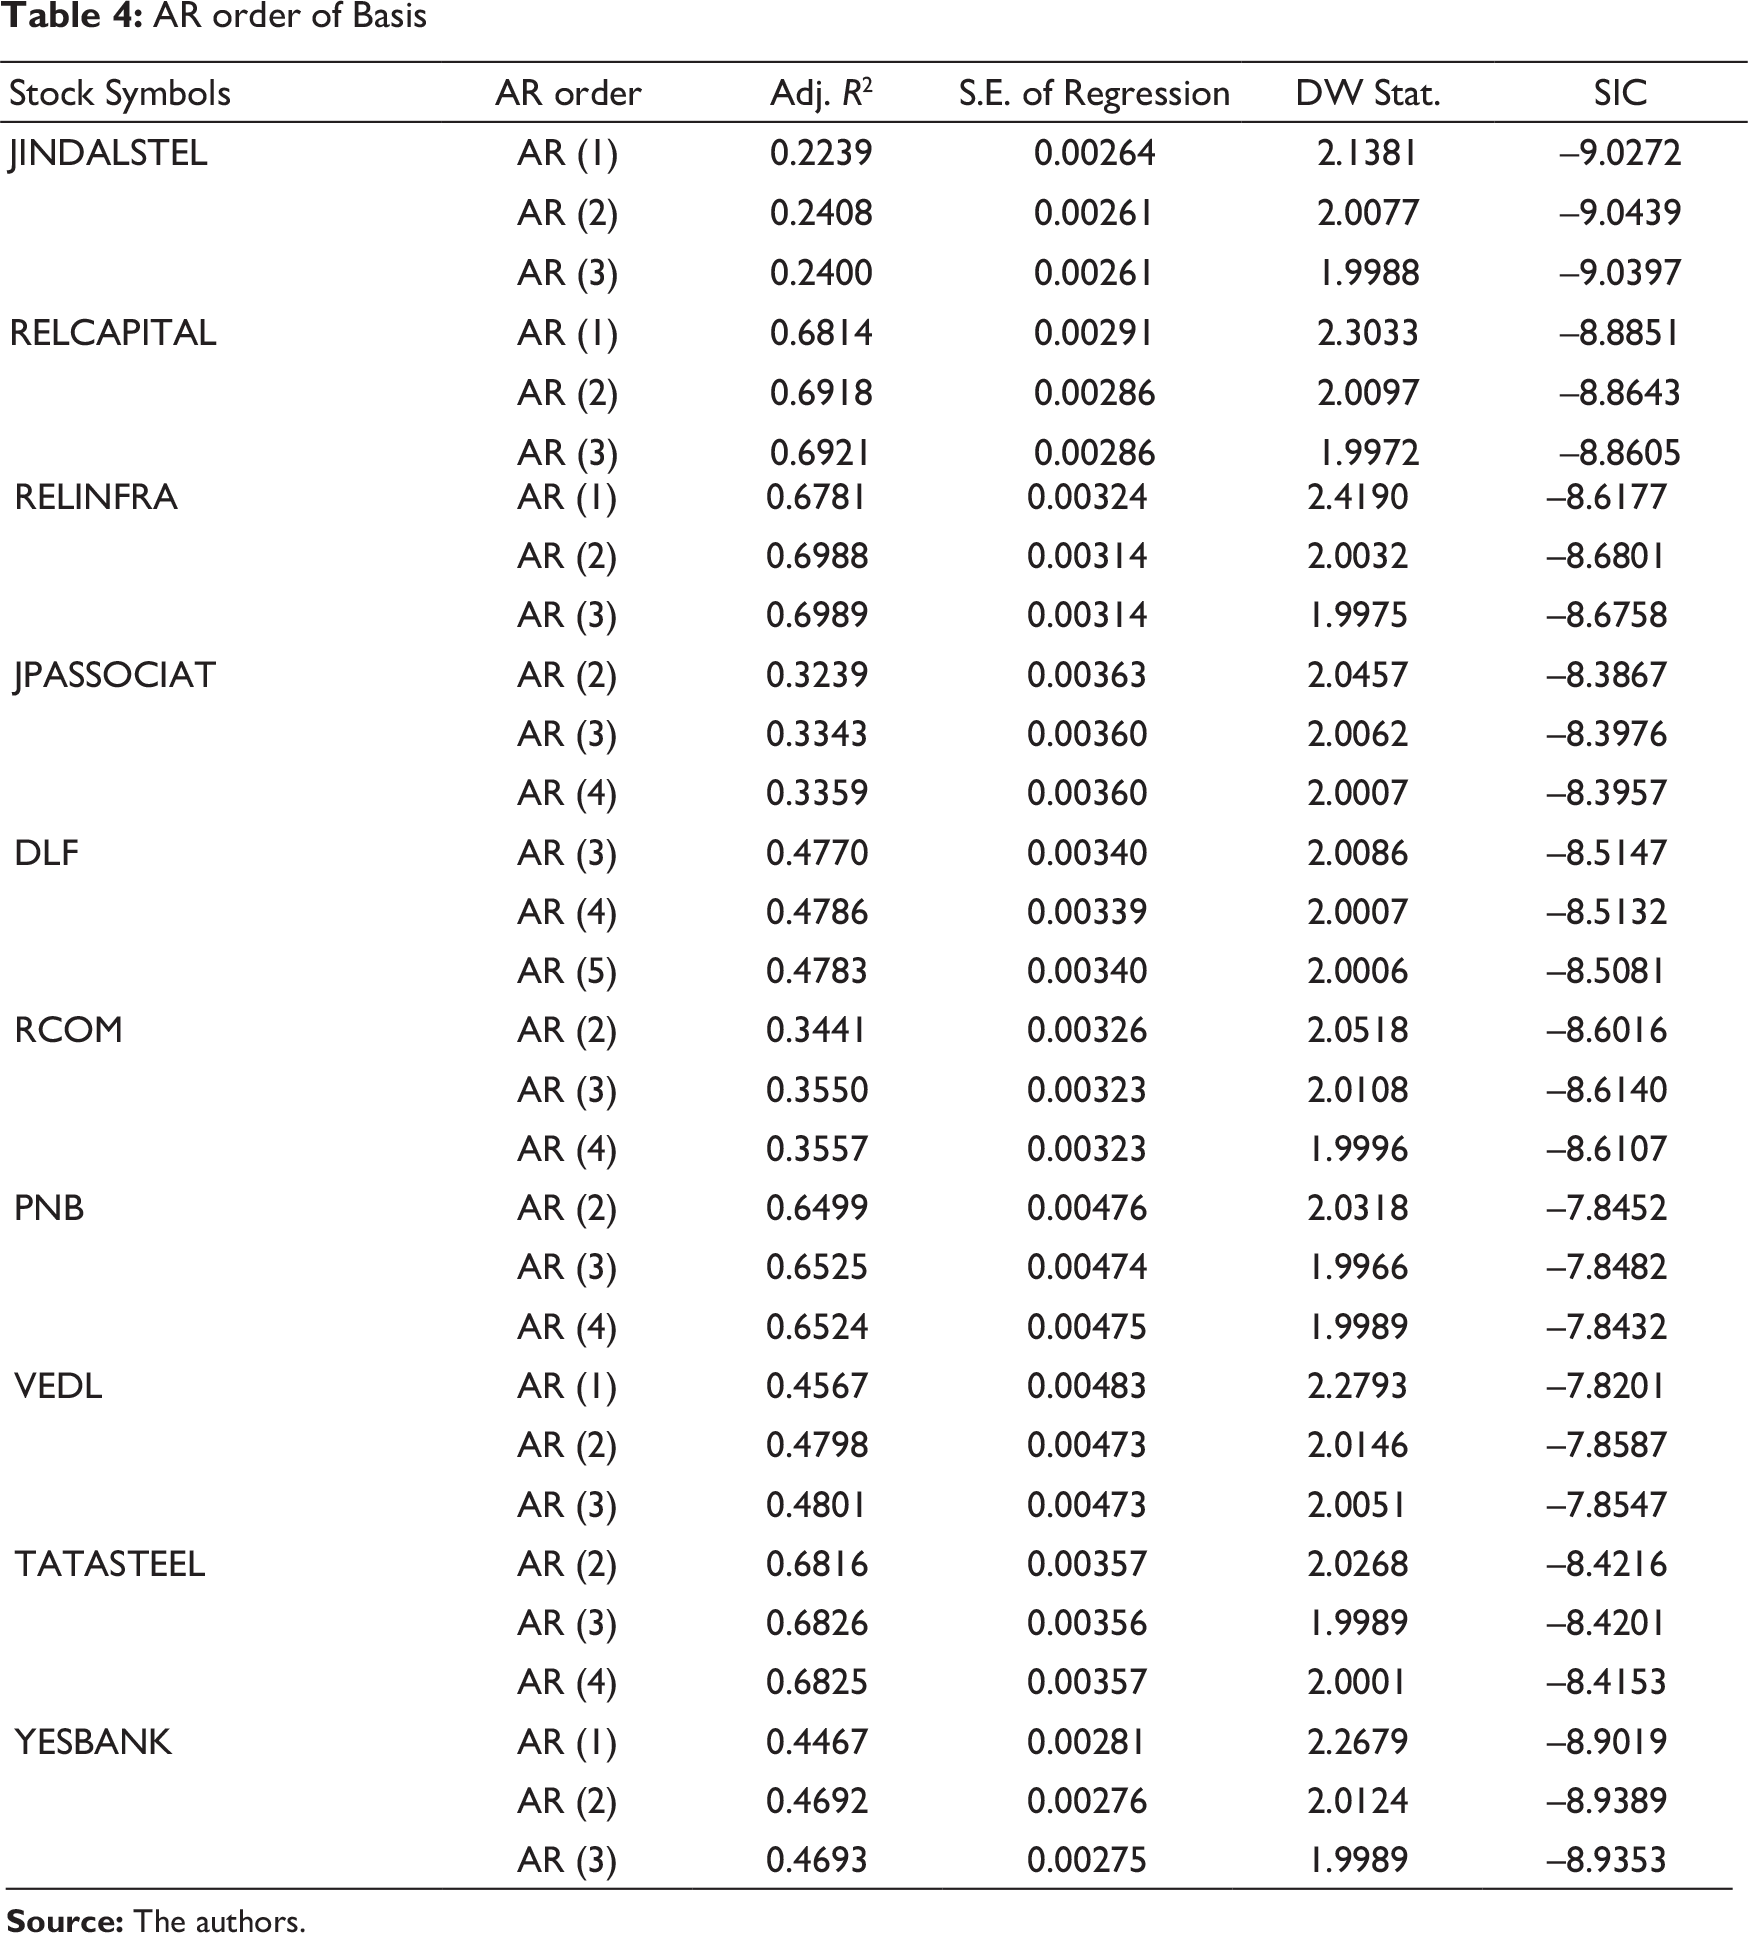
Analysing the autoregressive order of basis (i.e., spot – futures), both ADF test and PP test results (reported in Table 3) show that the basis does not contain a unit root, hence it is stationary. However, it is observed that the basis of the sample stocks are best described by an AR(2) or higher order process (Table 4). This implies that these markets are integrated, but they do not function effectively as one entity, and there is possible existence of unexploited arbitrage opportunities.
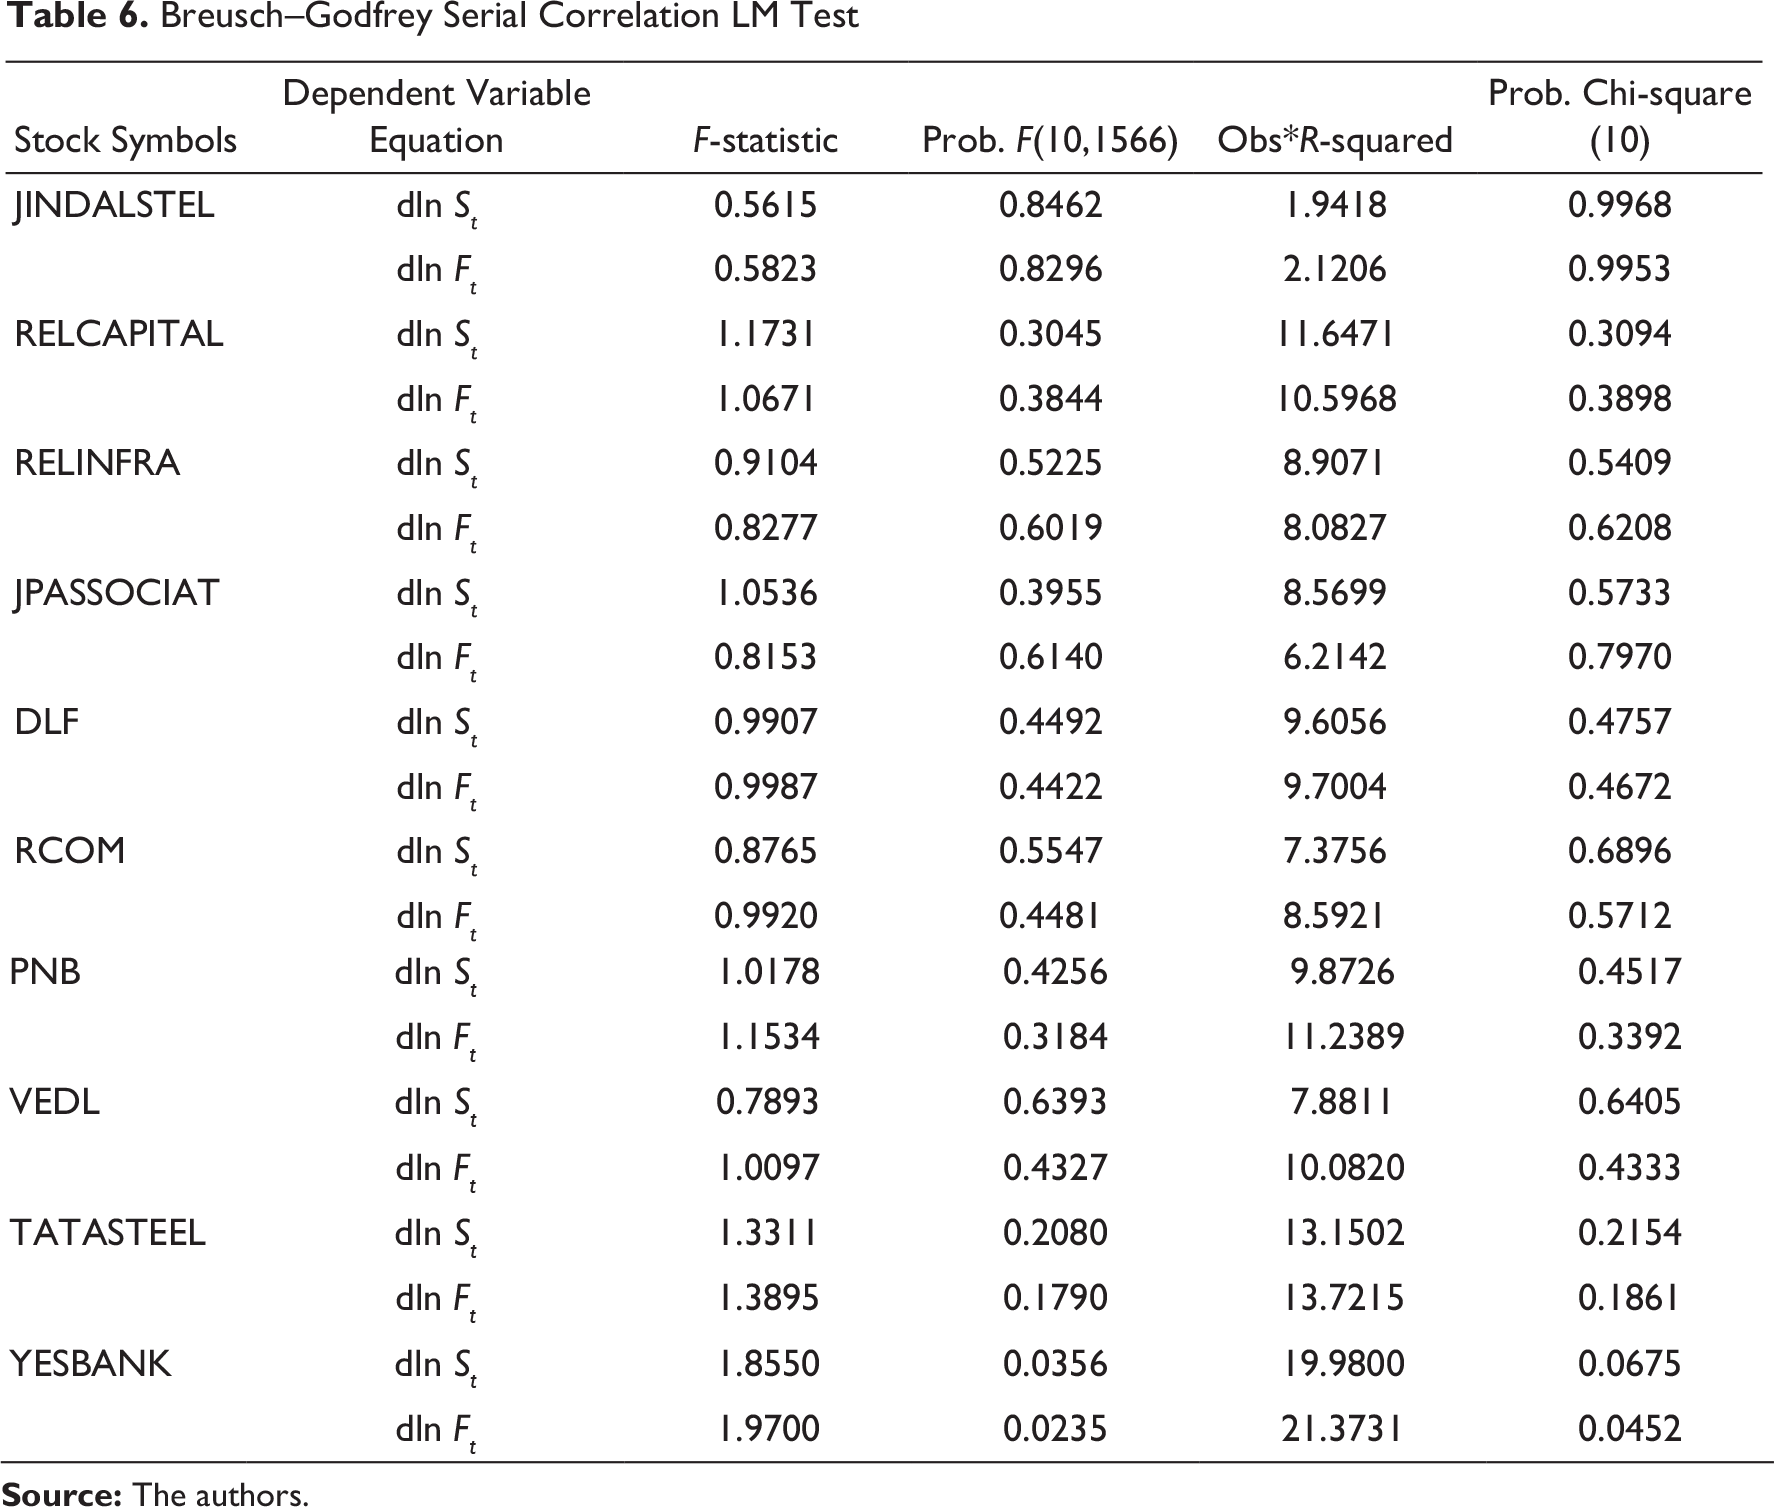
Having identified a co-integrating relationship between spot and futures prices for all the sample stocks, VECM is estimated for each stock, results reported in Table 5. It is observed that in case of 5 out of 10 stocks (50% of the sample size), the error correction term is negative and significant in the equation where
Estimates of Vector Error Correction Model

Breusch–Godfrey Serial Correlation LM Test
Short-run Causality Test
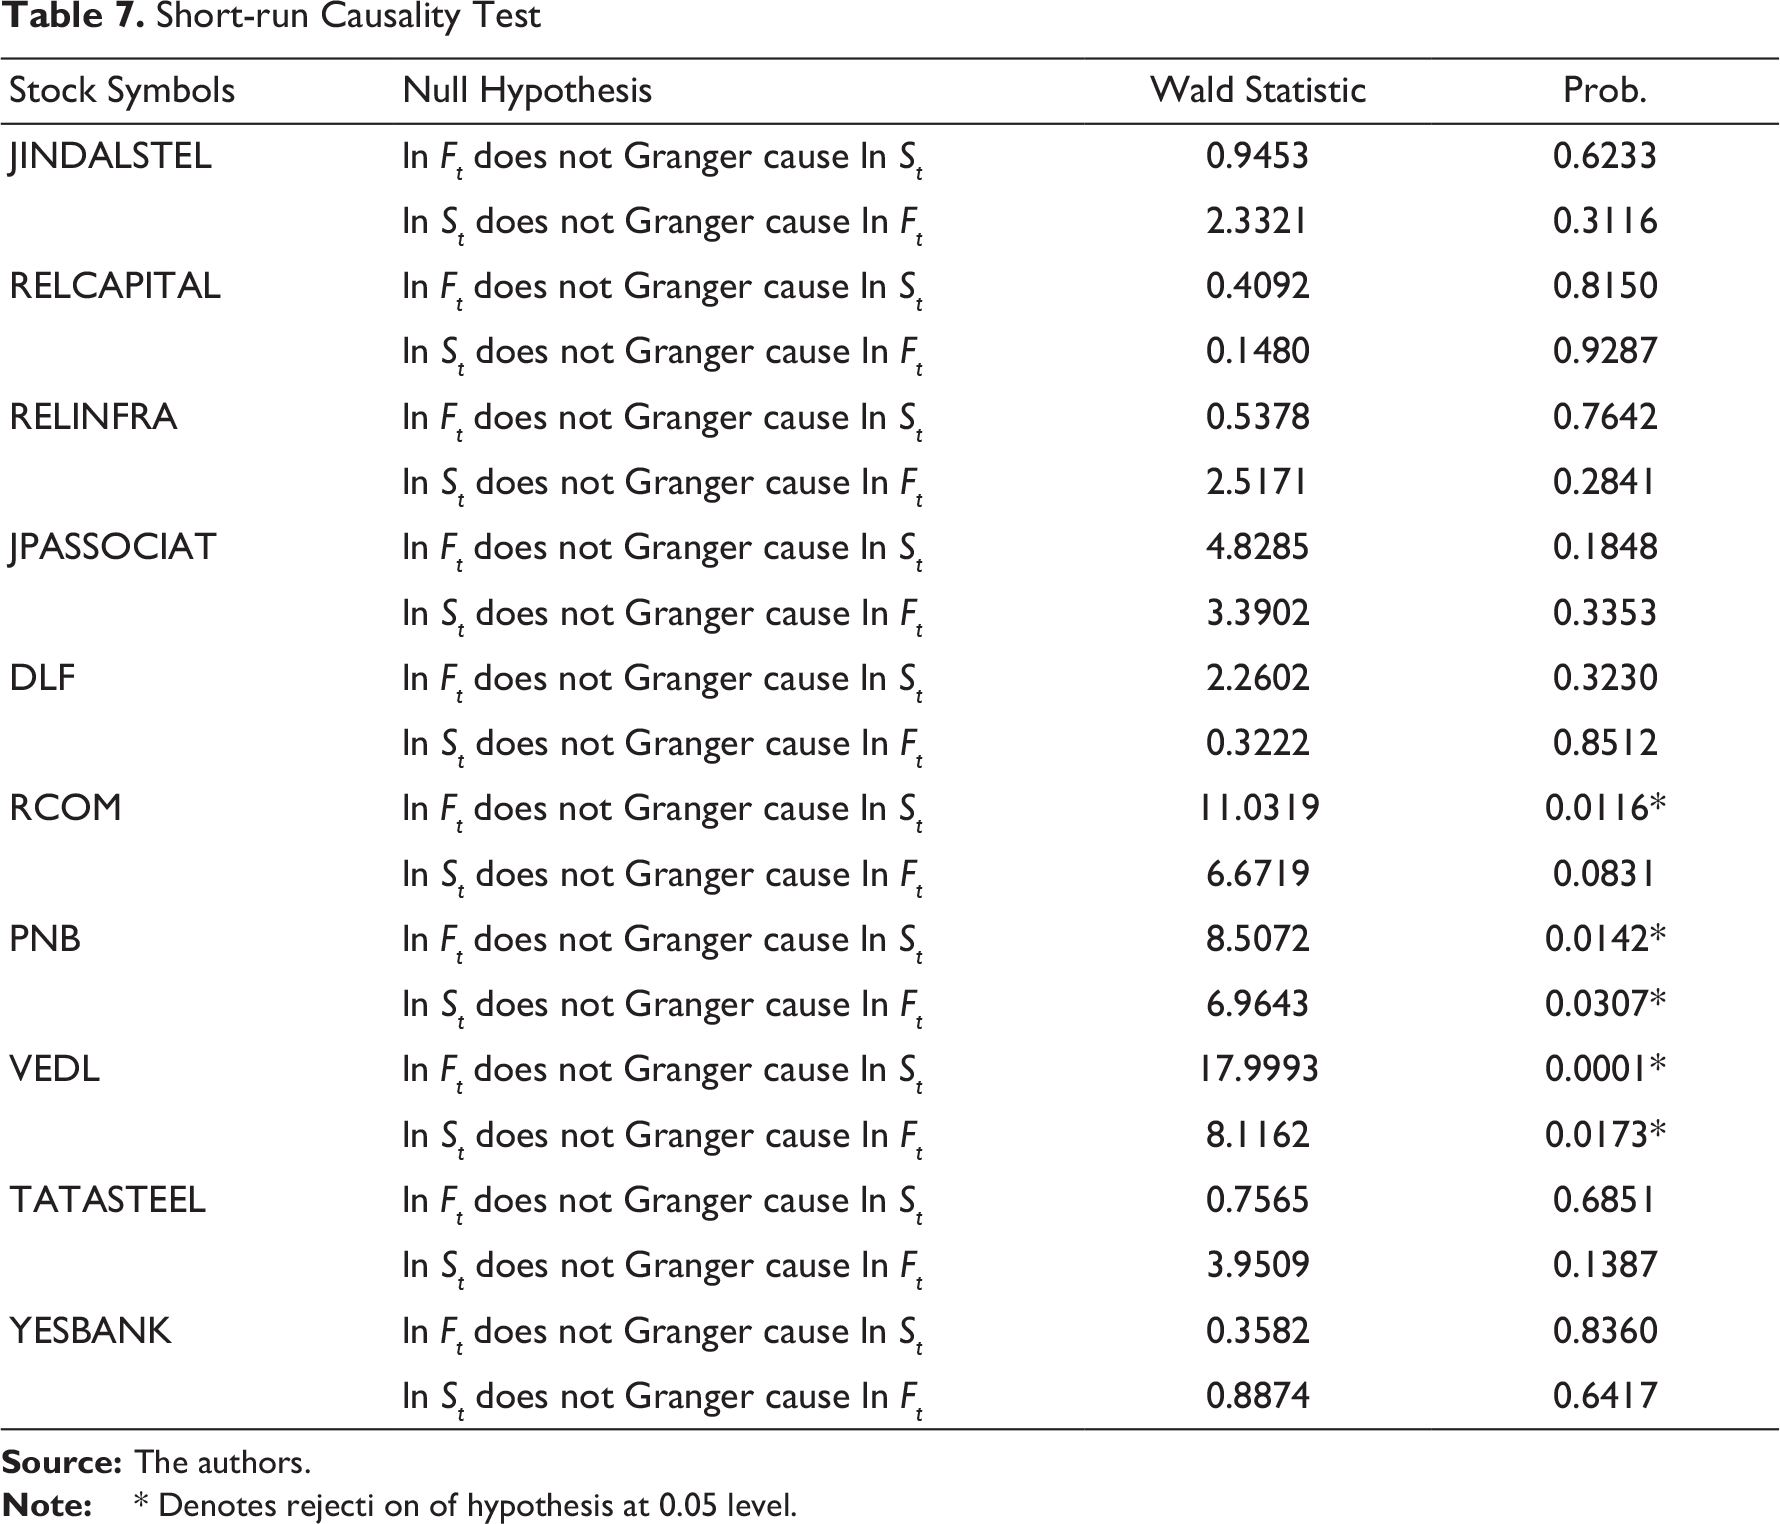
Additionally, in order to investigate short-run causality, Wald test for coefficients of
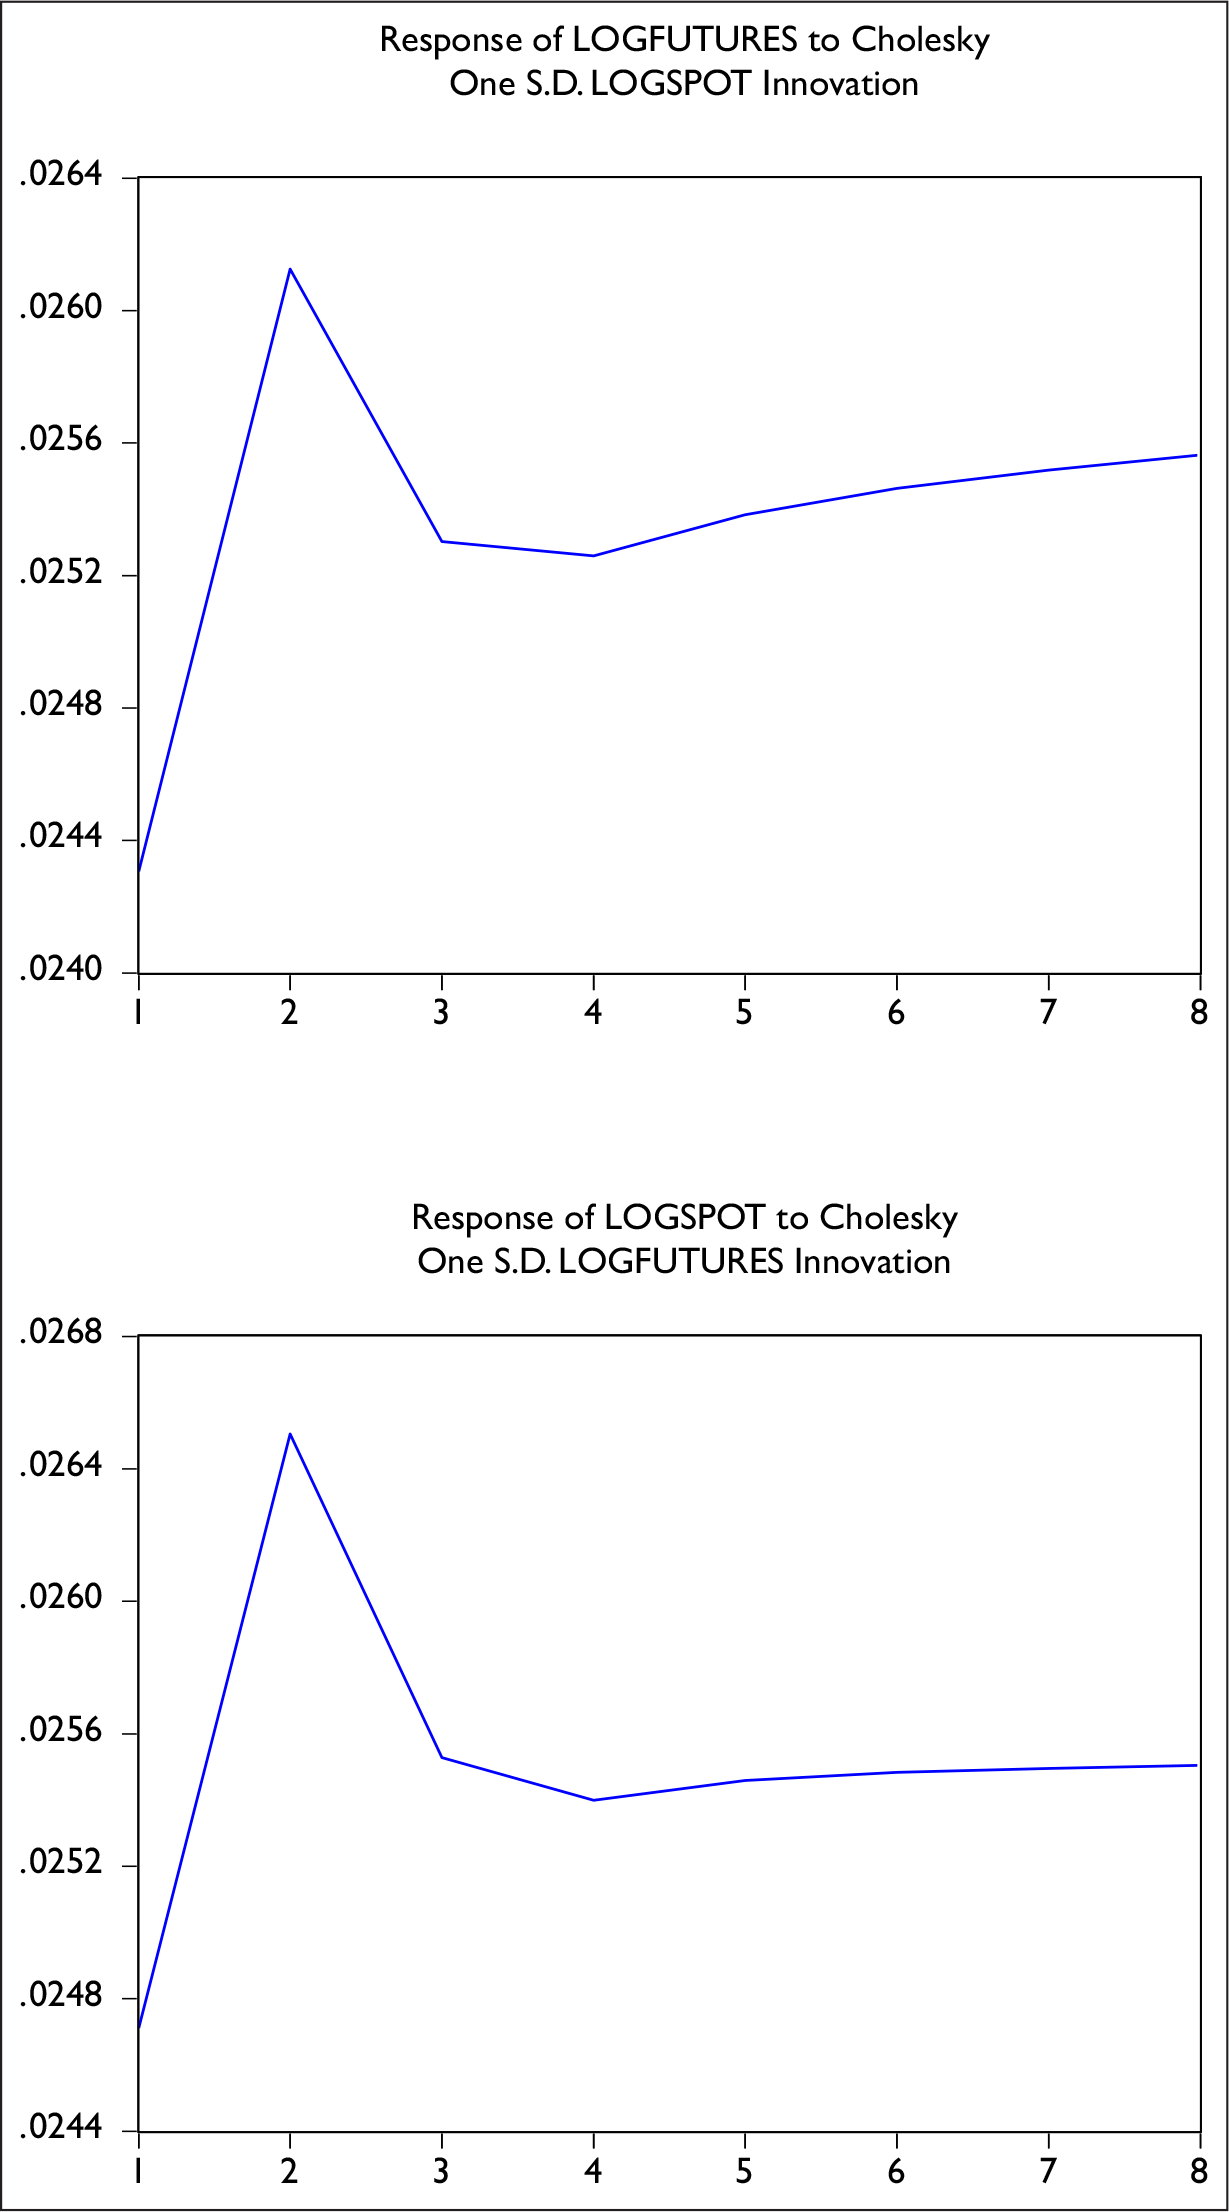
The impulse response functions shown in appendix below in multiple graphs (Figures 1–10) provide evidence that estimated vector for each stock is a cointegrating relationship since, in each case, the impact of a shock upon the system gradually dies out. Furthermore, when a positive shock (innovation) of one SD is applied to spot equation (shown in upper panel graphs) and to futures equation (shown in lower panel graphs), the response of futures to spot innovation and the response of spot to futures innovation, respectively, are noted. The impulse response functions are plotted for eight periods following the impulse. It is observed that, both futures and spot prices mostly adjust to a shock in the other equation within 4 to 5 periods, and the length of major response in either series to an innovation in the other is almost the same.
Conclusion
This study has undertaken a series of methods and tests to explore the efficiency of equity stock futures market, lead–lag relationship between equity stock futures and the underlying stock markets and price discovery. Johansen test for cointegration shows the existence of one cointegrating vector for all sample stocks. Further, the impulse response functions also provide evidence of cointegrating relationship between spot and futures, implying long-run relationship exists between equity stock futures and the underlying stock markets.
The results of VECM estimations indicate a faster error-correction effect of spot in the event of any departure from long-run equilibrium, and hence a long-run causality running from spot to futures, for the majority of stocks. The tests for short-run causality or lead–lag relationship show mixed results, wherein for the majority of stocks, no significant short-run causality between spot and futures is noted; however, for a few stocks (20% of the sample), there is evidence of bi-directional causality. The impulse response graphs show both spot and futures adjust to a shock in the other with almost the same speed, indicating a contemporaneous relationship between spot and futures. One possible explanation is that informed traders operate in both the equity futures and the spot markets, and they do not have any preferred nature of exposure. Further, the results of autoregressive order of basis indicate possible existence of unexploited arbitrage opportunities between the equity stock futures market and the underlying spot market in absence of transaction costs possibly due to faster short-run error correction by spot.
To conclude, the study finds the existence of long-run equilibrium relationship between the equity stock futures and the underlying spot markets. The spot market is found to play a lead role in correction of any disequilibrium towards long-run equilibrium. There is no significant short-run causality between spot and futures for the majority of stocks, and neither of the markets displays considerably higher information efficiency compared to the other. Price discovery happens in both spot and futures markets simultaneously. The present study has failed to take into account transaction costs in analysing the possibilities of exploitation of arbitrage opportunities, and this gives rise to the scope for further research.


List of Sample Stocks
Footnotes
Acknowledgement
The authors are grateful to the anonymous referees of the journal for their extremely useful suggestions to improve the quality of the article. Usual disclaimers apply.
Declaration of Conflicting Interests
The authors declared no potential conflicts of interest with respect to the research, authorship and/or publication of this article.
Funding
The authors received no financial support for the research, authorship and/or publication of this article.

Weblinks